Embed Size (px)
Citation preview

October 2017
Investment Committee
Asset Management & Products
1
2
Summary
• Market action since the previous Investment Strategy • Current Asset Class valuation:
Economic cycle: widespread growth though with some exception; monetary policies that are still expanding even if gradually less
Asset allocation: investment with balanced risks but identifying specific opportunities Equities:
US Equities neutral: consistent valuations and possible currency boosts in quarterly releases
EU Equities neutral: aggregate valuation not yet expensive with internal potential JP Equities overweight: economic valuation with expanding business and currency
support Emerging Markets Equities underweight: in aggregate they are expensive
Bonds: US govies: consistent level of rates today but with upward pressure on the medium EZ govies: rates lower than fundamental levels with preference for the periphery Corporate US: justifiable investment Corporate EZ: not particularly appealing profile Emerging debt: with inflation under control remains interesting
Commodity: Gold: returning to the fundamentals, falling apart the Korean crisis, it is over-valued Oil: probably renewed OPEC efforts and further upside in the short
Forex: Eur/Usd discounts extreme macro scenario, political situation penalizes Gbp, short on the
Yen to keep at least on the short term, intact the Sek expectations, Nok is still attractive, Rub always valid to diversify in the emerging markets
Investment Committee - October 2017
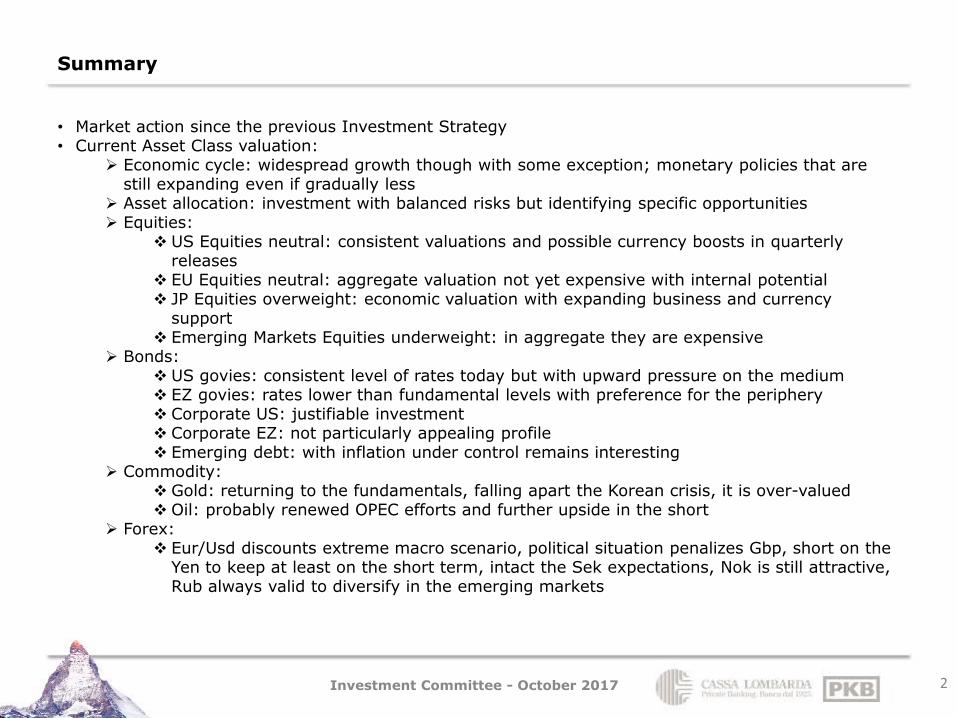
Performance of equity markets in the last period
3
12/10/2017 13:47 prezzo Ultimo periodo %
Indici Azionari 12 ott/17 15set-12ott/17 Ytd 2017 2016Stima PE
rolling12m
Stima dvd
2017
Stima ROE
2017
Stima P/B
2017Vol. 90gg
Stima eps
Fw12/Rw12S&P 500 2555,2 +2,2 +14,1 +9,5 S&P 500 17,9 1,94% +16% 3,1 7,1 +22%
Nasdaq Composite 6603,5 +2,4 +22,7 +7,5 Nasdaq Composite 21,5 1,05% +24% 3,9 11,3 +99%
Eurostoxx 50 3597,4 +2,3 +9,3 +0,7 Eurostoxx 50 14,4 3,34% +9% 1,6 10,3 +28%
Stoxx Europe 600 389,5 +2,3 +7,8 -1,2 Stoxx Europe 600 15,1 3,34% +9% 1,9 9,2 +42%
FTSE MIB 22433,7 +0,9 +16,6 -10,2 FTSE MIB 13,7 3,47% +9% 1,2 12,2 ns
CAC 40 5343,0 +2,5 +9,9 +4,9 CAC 40 14,9 3,11% +9% 1,6 10,6 +24%
DAX 30 12950,6 +3,4 +12,8 +6,9 DAX 30 13,5 2,83% +13% 1,8 10,8 +34%
IBEX 35 10259,9 -0,6 +9,7 -2,0 IBEX 35 13,4 3,68% +8% 1,4 13,8 +17%
FTSE 100 7555,7 +4,7 +5,8 +14,4 FTSE 100 14,6 4,09% +9% 1,9 9,1 +73%
Swiss Market 9257,8 +2,5 +12,6 -6,8 Swiss Market 16,8 3,29% +12% 2,5 9,6 +47%
Oslo Stock Exchange 867,3 +3,8 +13,4 +17,8 Oslo Stock Exchange 14,4 3,75% +11% 1,6 10,0 -64%
OMX Stockholm 30 1644,0 +4,1 +8,4 +4,9 OMX Stockholm 30 16,4 3,55% +11% 2,3 11,1 -3%
NIKKEI 225 20954,7 +5,2 +9,6 +0,4 NIKKEI 225 16,6 1,80% +10% 1,7 9,1 +15%
HANG SENG 28459,0 +2,3 +29,4 +0,4 HANG SENG 12,1 3,22% +13% 1,3 11,8 +17%
Shanghai Composite 3386,1 +1,0 +9,1 -12,3 Shanghai Composite 13,4 1,98% +12% 1,6 8,3 +32%
India Sensex 30 32182,2 -0,3 +20,9 +1,9 India Sensex 30 17,3 1,41% +12% 0,0 9,1 +37%
Russian Micex Index 2094,6 +2,0 -6,2 +26,8 Russian Micex Index 6,6 5,21% +7% 0,7 9,9 +12%
Brazil Bovespa 76659,8 +1,2 +27,3 +38,9 Brazil Bovespa 13,5 2,67% +11% 1,7 13,6 +77%
Varsavia Stock Exc. 65745,5 +1,9 +27,0 +11,4 Varsavia Stock Exc. 12,4 2,27% +10% 1,4 9,8 +42%
Msci Developed local 1531,0 +2,5 +12,2 +6,8 Msci Developed local 12,6 2,41% +11% 2,3 6,2 +28%
Msci Emerging local 59676,2 +2,3 +25,2 +7,1 Msci Emerging local 657,6 2,39% +10% 1,7 7,8 +32%
Fonte: Bloomberg
The following are distinguished: • Japan pushed by good data, Yen weakness and early elections • UK backed by the decline in Gbp against Usd and industrial production • Sweden supported by the domestic industry with record-breaking activity data • Italy penalized by probable European rules that are more stringent on NPL • Spain in counter-tendency due to the Catalan crisis • Emerging almost in line with the Developed, they keep the ytd advantage • India is curbed by activity data below expectations and fears of rising public deficits.
Investment Committee - October 2017
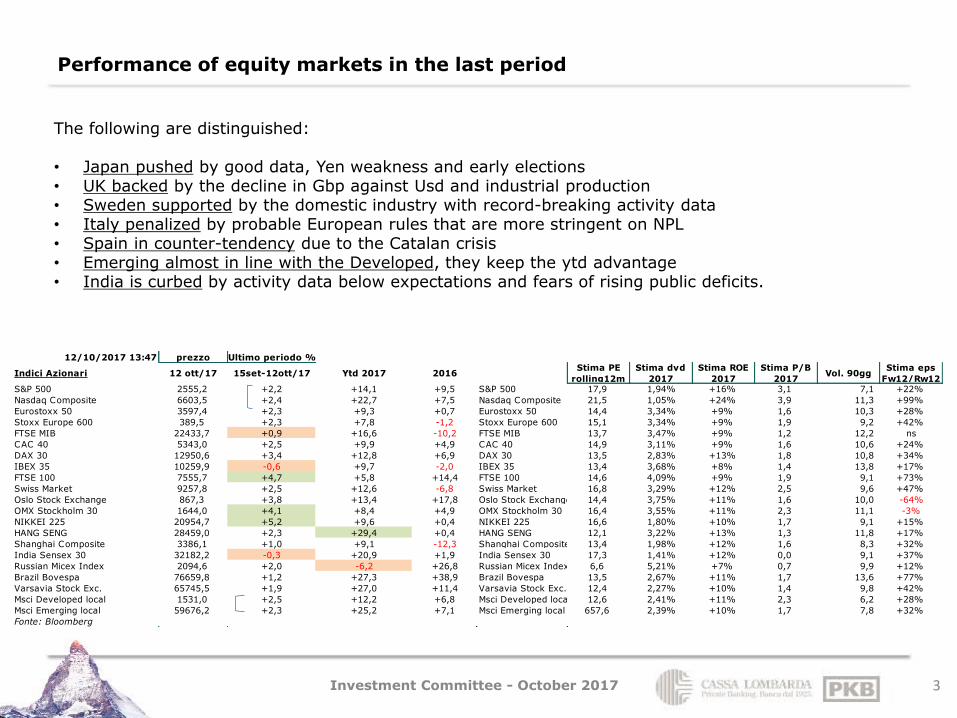
Performance of bond markets in the last period
4
12/10/2017 13:52 tassoswap
spread bpTassi Benchmark 12 ott/17 15set-12ott/17 Ytd 2017 2016 12 ott/17
Euribor 3 mesi -0,33% +0 -1 -19
3 mo Euribor TR Unh E +0,0% +0,0% +0,0%
Treasury US 2-anni US$ 1,50% +12 +32 +14 -26
US Total return 1-3y -0,1% +0,7% +0,9%
Bko 2-anni EUR -0,70% -0 +6 -42 -53
GER Total return 1-3y -0,0% -0,6% +0,3%
BTP 2-anni EUR -0,22% -4 -4 -15 -5
IT Total return 1-3y +0,0% +0,4% +0,4%
Bonos 2-anni EUR -0,27% +1 +1 -28 -10
SP Total return 1-3y -0,1% +0,0% +0,7%
Treasury US 10-anni US$ 2,33% +12 -12 +17 +4
US Total return 7-10y -0,9% +2,7% +0,8%
Bund 10-anni EUR 0,45% +2 +24 -42 -45
GER Total return 7-10y -0,1% -0,8% +2,6%
BTP 10-anni EUR 2,12% +5 +31 +22 +123
IT Total return 7-10y +0,0% +0,4% +1,0%
Bonos 10-anni EUR 1,61% +0 +23 -39 +72
SP Total return 7-10y -0,2% +1,4% +5,1%
Spread 10-anni BTP-Bund 1,68% +3 +7 +64
Spread 10-anni Bonos-Bund 1,17% -1 -1 +3
Us Breakeven Inflation 5 Year 1,81% +5 -5 +58
US Total return Bei +0,3% +0,4% +2,8%
Italy Breakeven Eur inflat. 5 Year 0,94% +7 +18 +2
IT Total return Bei -0,0% -3,7% -3,1%
basis point
Corporate & Emergenti 12 ott/17 15set-12ott/17 Ytd 2017 2016
OAS Euro Investment Grade (avg) 37 -3 -26 -18
BBG EUR IG Corp +0,1% +1,3% +4,4%
OAS Euro High Yield (avg) 203 -1 -118 -166
BBG EUR HY Corp +0,6% +5,5% +8,7%
OAS Usd Investment Grade (avg) 98 -10 -26 -45
BBG USD IG Corp +0,2% +5,4% +5,9%
OAS Usd High Yield (avg) 368 -19 -62 -289
BBG USD HY Corp +0,7% +7,7% +17,4%
Embi Global vs All Treasury 307 -3 -58 -80
BBG USD EM Sov -0,4% +8,9% +9,9%
Emg local Yield 4,77% +0,1% +0,2% -0,1%
BBG Loc EM Sov -1,2% +8,2% +0,6%
basis point
CDS 5YR 12 ott/17 15set-12ott/17 Ytd 2017 2016
USA 25 -1 -2 +27
Germania 12 -0 -10 +22
Italia 139 +3 -18 +157
Francia 20 +0 -17 +37
Spagna 67 +8 -8 +76
Emg Debt 177 +7 -65 +242
Corp Inv Grade Europe 56 +5 -16 +72
Corp High Yield Europe 244 +18 -45 +289
Corp Inv Grade US 55 -1 -12 +67
Corp High Yield US 321 -4 -35 +356
Fonte: Bloomberg
Var. (bp spread; % tot return indice)
Var. (bp rend,; % tot return indice)
Variaz. (bp)
Period characterized by: • Euro curve stability, waiting for
the ECB and the upturn in the dollar curve on a rising probability of a Fed's hike in December
• stability of btp and bonos spreads, but with volatility of the Iberian government due to the political crisis between Madrid and Barcelona
• moderate rise in breakeven inflation rates in US and in Italy on favorable business data
• spread IG and HY stable in euro, but CDS rising on HY in particular
• contraction of IG and HY spreads
in the US against their respective stable CDSs
• spread of emerging issues in hard currency stable but slightly rising Cds.
Investment Committee - October 2017
Performance of commodity, volatility and forex in the last period
5
12/10/2017 13:54 prezzo
Commodity 12 ott/17 15set-12ott/17 Ytd 2017 2016
CRB Index 183 -0,3 -4,7 +9,3
Wti Crude Oil (US$/BBL) 50,6 +1,3 -5,9 +45,0
Gold (US$/oz) 1.296 -1,8 +12,5 +8,6
Grano 435 -3,2 -6,6 -13,2
Copper (US$/MT) 6.800 +4,5 +22,8 +17,7
prezzo
Volatility 12 ott/17 15set-12ott/17 Ytd 2017 2016
Eurostoxx 50 Volatility Index 12,73 +4,4 -29,7 -18,3
SPX Volatility Index 10,08 -0,9 -28,2 -22,9
Treasury Volatility Index (MOVE) 52,69 +4,1 -26,4 +5,6
Currency Volatility Index 7,82 -9,4 -29,1 +16,8
Fonte: Bloomberg
prezzo
Forex 12 ott/17 15set-12ott/17 Ytd 2017 2016
US DOLLAR INDEX 93,044 +1,3 -9,0 +3,6
JPM Asian Dollar Index 107,790 -0,6 +4,7 -3,4
JPM EM Currency Usd 69,532 -2,0 +5,5 +0,3
USD/Yen Giapponese 112,270 +1,3 -4,0 -2,7
EUR/Dollaro Usa 1,186 -0,7 +12,7 -3,2
EUR/Yen Giapponese 133,110 +0,5 +8,2 -5,9
EUR/Chf Franco svizzero 1,155 +0,7 +7,7 -1,5
EUR/Sterlina inglese 0,902 +2,7 +5,7 +15,8
EUR/Dollaro Australiano 1,517 +1,6 +3,9 -2,1
EUR/Dollaro Canadese 1,478 +1,5 +4,6 -6,0
EUR/Corona Norvegese 9,366 -0,1 +3,1 -5,4
EUR/Corona Svedese 9,588 +0,7 +0,1 +4,4
EUR/Corona Danese 7,444 +0,0 +0,1 -0,4
EUR/Dollaro di Singapore 1,606 -0,1 +5,5 -1,3
EUR/Renminbi (yuan) Cinese 7,811 -0,4 +6,4 +3,5
EUR/Rupia indiana 77,189 +0,7 +7,7 -0,6
EUR/Real Brasiliano 3,766 +1,3 +9,8 -20,3
EUR/Rublo russo 68,412 -0,5 +5,7 -17,9
EUR/Zloty polacco 4,275 -0,0 -2,9 +3,4
EUR/Peso Messicano 22,207 +5,3 +1,8 +16,7
EUR/Lira Turca 4,348 +5,9 +17,3 +16,8
Fonte: Bloomberg
Variaz. (%)
Variaz. (%)
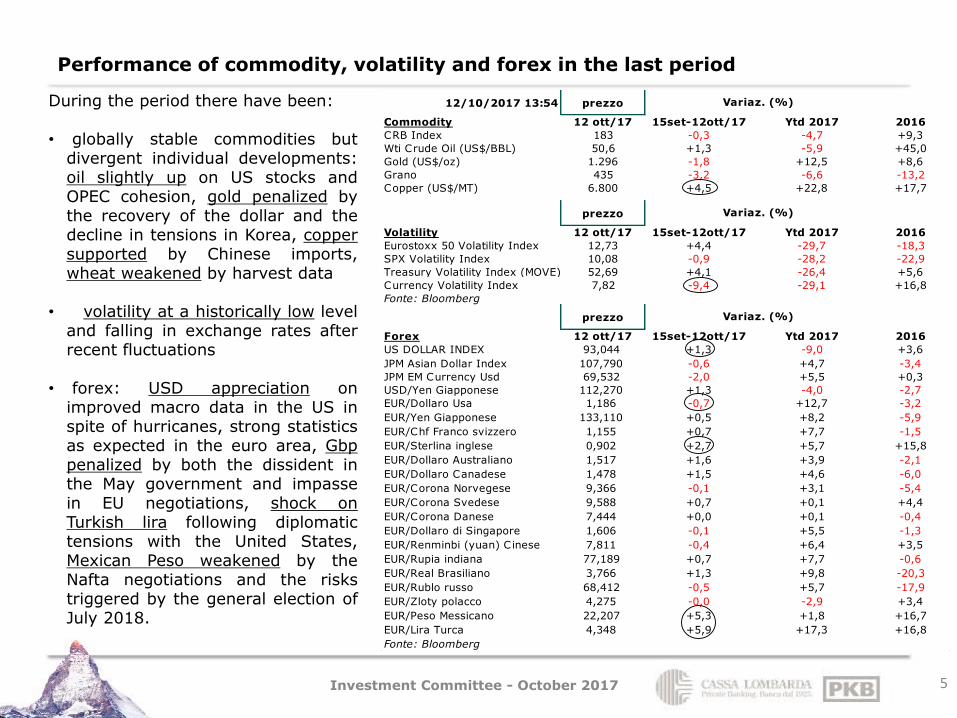
Variaz. (%)During the period there have been: • globally stable commodities but
divergent individual developments: oil slightly up on US stocks and OPEC cohesion, gold penalized by the recovery of the dollar and the decline in tensions in Korea, copper supported by Chinese imports, wheat weakened by harvest data
• volatility at a historically low level
and falling in exchange rates after recent fluctuations
• forex: USD appreciation on improved macro data in the US in spite of hurricanes, strong statistics as expected in the euro area, Gbp penalized by both the dissident in the May government and impasse in EU negotiations, shock on Turkish lira following diplomatic tensions with the United States, Mexican Peso weakened by the Nafta negotiations and the risks triggered by the general election of July 2018.
Investment Committee - October 2017
Macro USA: regular growth and signs of a possible rise in inflation
6
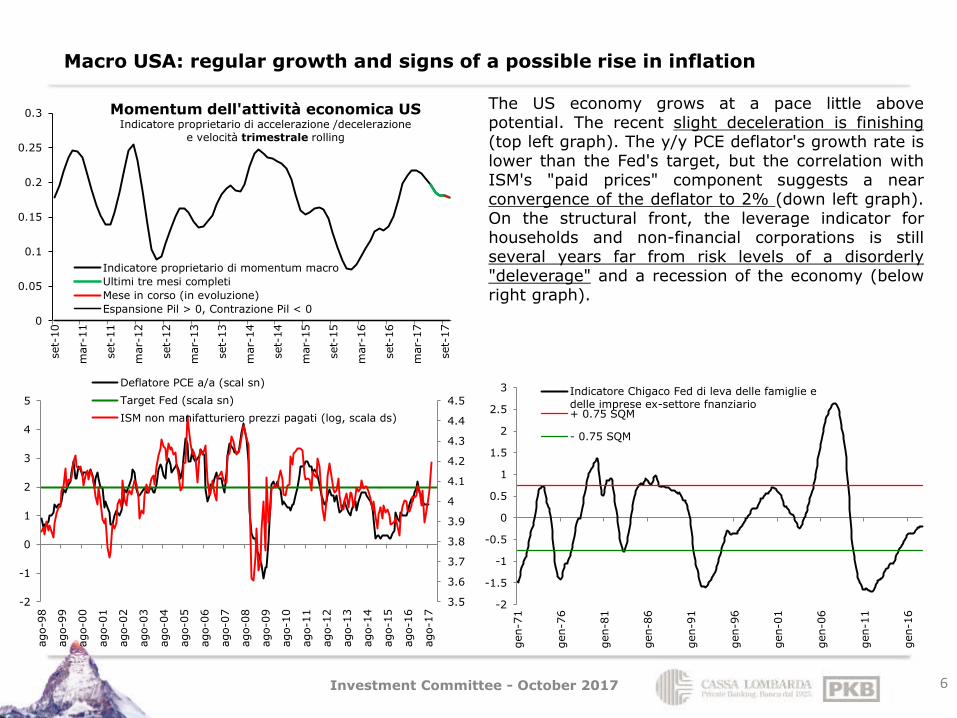
The US economy grows at a pace little above potential. The recent slight deceleration is finishing (top left graph). The y/y PCE deflator's growth rate is lower than the Fed's target, but the correlation with ISM's "paid prices" component suggests a near convergence of the deflator to 2% (down left graph). On the structural front, the leverage indicator for households and non-financial corporations is still several years far from risk levels of a disorderly "deleverage" and a recession of the economy (below right graph).
-2
-1.5
-1
-0.5
0
0.5
1
1.5
2
2.5
3
gen-7
1
gen-7
6
gen-8
1
gen-8
6
gen-9
1
gen-9
6
gen-0
1
gen-0
6
gen-1
1
gen-1
6
Indicatore Chigaco Fed di leva delle famiglie edelle imprese ex-settore fnanziario+ 0.75 SQM
- 0.75 SQM
0
0.05
0.1
0.15
0.2
0.25
0.3
set-
10
mar-
11
set-
11
mar-
12
set-
12
mar-
13
set-
13
mar-
14
set-
14
mar-
15
set-
15
mar-
16
set-
16
mar-
17
set-
17
Momentum dell'attività economica US Indicatore proprietario di accelerazione /decelerazione
e velocità trimestrale rolling
Indicatore proprietario di momentum macro
Ultimi tre mesi completi
Mese in corso (in evoluzione)
Espansione Pil > 0, Contrazione Pil < 0
3.5
3.6
3.7
3.8
3.9
4
4.1
4.2
4.3
4.4
4.5
-2
-1
0
1
2
3
4
5
ago-9
8
ago-9
9
ago-0
0
ago-0
1
ago-0
2
ago-0
3
ago-0
4
ago-0
5
ago-0
6
ago-0
7
ago-0
8
ago-0
9
ago-1
0
ago-1
1
ago-1
2
ago-1
3
ago-1
4
ago-1
5
ago-1
6
ago-1
7
Deflatore PCE a/a (scal sn)
Target Fed (scala sn)
ISM non manifatturiero prezzi pagati (log, scala ds)
Investment Committee - October 2017
EZ macro: strong growth but weak credit activity
7
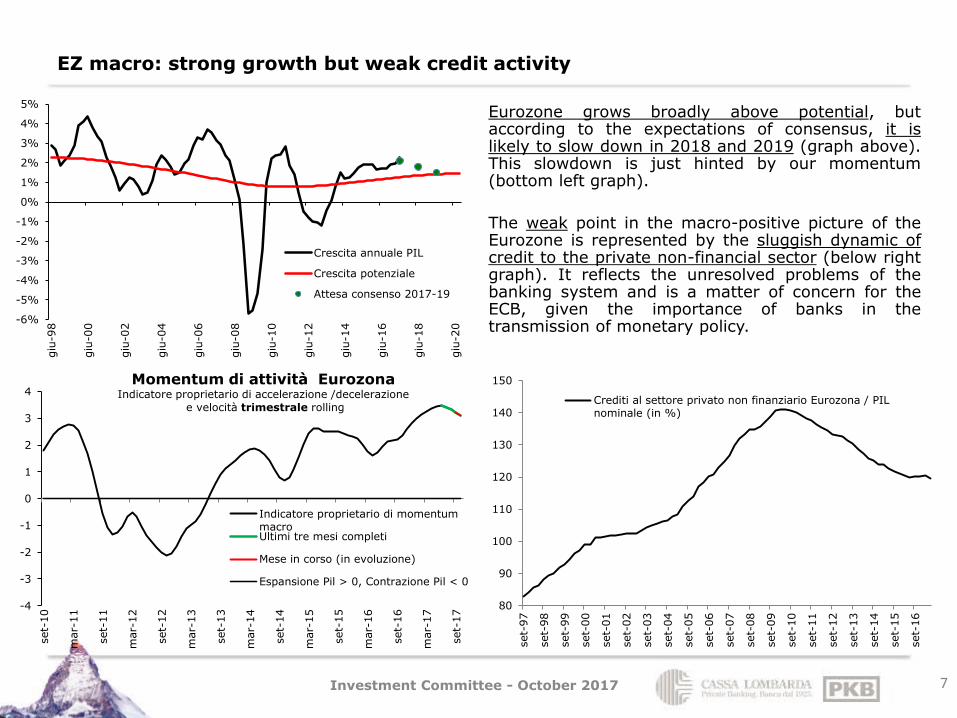
Eurozone grows broadly above potential, but according to the expectations of consensus, it is likely to slow down in 2018 and 2019 (graph above). This slowdown is just hinted by our momentum (bottom left graph).
The weak point in the macro-positive picture of the Eurozone is represented by the sluggish dynamic of credit to the private non-financial sector (below right graph). It reflects the unresolved problems of the banking system and is a matter of concern for the ECB, given the importance of banks in the transmission of monetary policy.
-4
-3
-2
-1
0
1
2
3
4
set-
10
mar-
11
set-
11
mar-
12
set-
12
mar-
13
set-
13
mar-
14
set-
14
mar-
15
set-
15
mar-
16
set-
16
mar-
17
set-
17
Momentum di attività Eurozona Indicatore proprietario di accelerazione /decelerazione
e velocità trimestrale rolling
Indicatore proprietario di momentummacroUltimi tre mesi completi
Mese in corso (in evoluzione)
Espansione Pil > 0, Contrazione Pil < 0
80
90
100
110
120
130
140
150
set-
97
set-
98
set-
99
set-
00
set-
01
set-
02
set-
03
set-
04
set-
05
set-
06
set-
07
set-
08
set-
09
set-
10
set-
11
set-
12
set-
13
set-
14
set-
15
set-
16
Crediti al settore privato non finanziario Eurozona / PILnominale (in %)
-6%
-5%
-4%
-3%
-2%
-1%
0%
1%
2%
3%
4%
5%
giu
-98
giu
-00
giu
-02
giu
-04
giu
-06
giu
-08
giu
-10
giu
-12
giu
-14
giu
-16
giu
-18
giu
-20
Crescita annuale PIL
Crescita potenziale
Attesa consenso 2017-19
Investment Committee - October 2017
Macro RoW: United kindom (=) Japan (+/=)
8
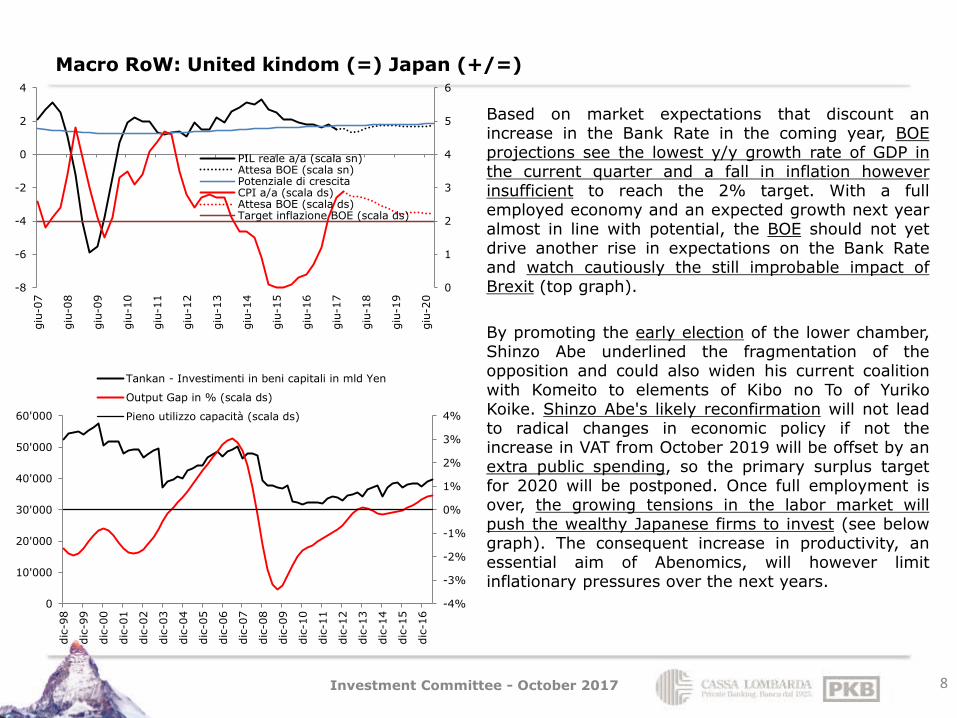
Based on market expectations that discount an increase in the Bank Rate in the coming year, BOE projections see the lowest y/y growth rate of GDP in the current quarter and a fall in inflation however insufficient to reach the 2% target. With a full employed economy and an expected growth next year almost in line with potential, the BOE should not yet drive another rise in expectations on the Bank Rate and watch cautiously the still improbable impact of Brexit (top graph).
By promoting the early election of the lower chamber, Shinzo Abe underlined the fragmentation of the opposition and could also widen his current coalition with Komeito to elements of Kibo no To of Yuriko Koike. Shinzo Abe's likely reconfirmation will not lead to radical changes in economic policy if not the increase in VAT from October 2019 will be offset by an extra public spending, so the primary surplus target for 2020 will be postponed. Once full employment is over, the growing tensions in the labor market will push the wealthy Japanese firms to invest (see below graph). The consequent increase in productivity, an essential aim of Abenomics, will however limit inflationary pressures over the next years.
-4%
-3%
-2%
-1%
0%
1%
2%
3%
4%
0
10'000
20'000
30'000
40'000
50'000
60'000
dic
-98
dic
-99
dic
-00
dic
-01
dic
-02
dic
-03
dic
-04
dic
-05
dic
-06
dic
-07
dic
-08
dic
-09
dic
-10
dic
-11
dic
-12
dic
-13
dic
-14
dic
-15
dic
-16
Tankan - Investimenti in beni capitali in mld Yen
Output Gap in % (scala ds)
Pieno utilizzo capacità (scala ds)
0
1
2
3
4
5
6
-8
-6
-4
-2
0
2
4
giu
-07
giu
-08
giu
-09
giu
-10
giu
-11
giu
-12
giu
-13
giu
-14
giu
-15
giu
-16
giu
-17
giu
-18
giu
-19
giu
-20
PIL reale a/a (scala sn)Attesa BOE (scala sn)Potenziale di crescitaCPI a/a (scala ds)Attesa BOE (scala ds)Target inflazione BOE (scala ds)
Investment Committee - October 2017
Macro RoW: China (=/-)
9
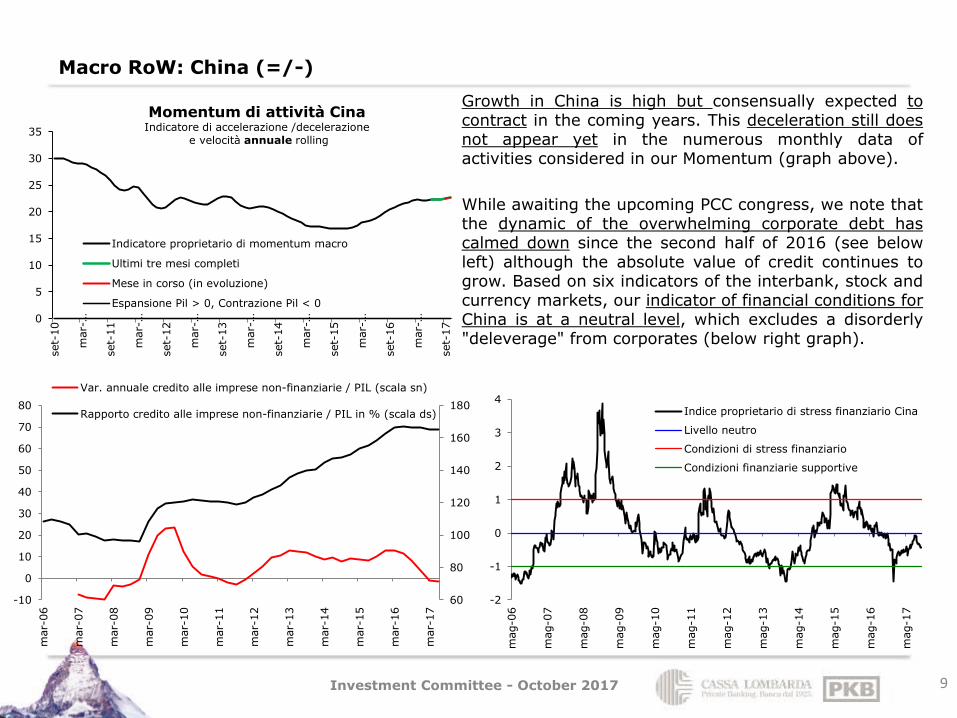
Growth in China is high but consensually expected to contract in the coming years. This deceleration still does not appear yet in the numerous monthly data of activities considered in our Momentum (graph above).
While awaiting the upcoming PCC congress, we note that the dynamic of the overwhelming corporate debt has calmed down since the second half of 2016 (see below left) although the absolute value of credit continues to grow. Based on six indicators of the interbank, stock and currency markets, our indicator of financial conditions for China is at a neutral level, which excludes a disorderly "deleverage" from corporates (below right graph).
-2
-1
0
1
2
3
4
mag-0
6
mag-0
7
mag-0
8
mag-0
9
mag-1
0
mag-1
1
mag-1
2
mag-1
3
mag-1
4
mag-1
5
mag-1
6
mag-1
7
Indice proprietario di stress finanziario Cina
Livello neutro
Condizioni di stress finanziario
Condizioni finanziarie supportive
60
80
100
120
140
160
180
-10
0
10
20
30
40
50
60
70
80
mar-
06
mar-
07
mar-
08
mar-
09
mar-
10
mar-
11
mar-
12
mar-
13
mar-
14
mar-
15
mar-
16
mar-
17
Var. annuale credito alle imprese non-finanziarie / PIL (scala sn)
Rapporto credito alle imprese non-finanziarie / PIL in % (scala ds)
0
5
10
15
20
25
30
35
set-
10
mar-…
set-
11
mar-…
set-
12
mar-…
set-
13
mar-…
set-
14
mar-…
set-
15
mar-…
set-
16
mar-…
set-
17
Momentum di attività Cina Indicatore di accelerazione /decelerazione
e velocità annuale rolling
Indicatore proprietario di momentum macro
Ultimi tre mesi completi
Mese in corso (in evoluzione)
Espansione Pil > 0, Contrazione Pil < 0
Investment Committee - October 2017
Macro RoW: Latam (=/+)
10
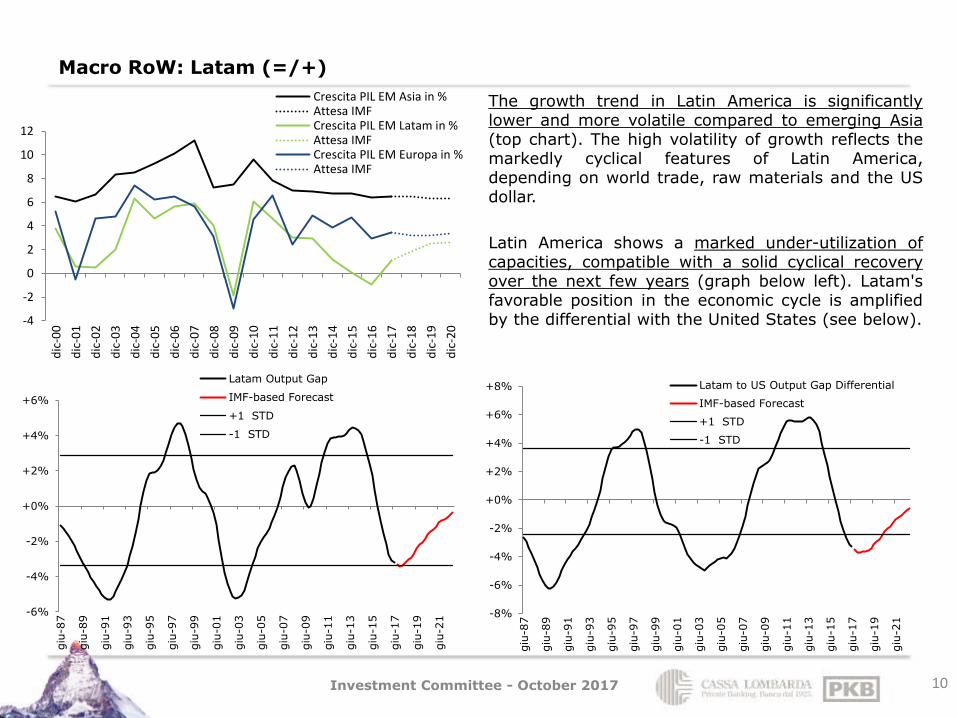
The growth trend in Latin America is significantly lower and more volatile compared to emerging Asia (top chart). The high volatility of growth reflects the markedly cyclical features of Latin America, depending on world trade, raw materials and the US dollar.
Latin America shows a marked under-utilization of capacities, compatible with a solid cyclical recovery over the next few years (graph below left). Latam's favorable position in the economic cycle is amplified by the differential with the United States (see below).
-4
-2
0
2
4
6
8
10
12
dic
-00
dic
-01
dic
-02
dic
-03
dic
-04
dic
-05
dic
-06
dic
-07
dic
-08
dic
-09
dic
-10
dic
-11
dic
-12
dic
-13
dic
-14
dic
-15
dic
-16
dic
-17
dic
-18
dic
-19
dic
-20
Crescita PIL EM Asia in %Attesa IMFCrescita PIL EM Latam in %Attesa IMFCrescita PIL EM Europa in %Attesa IMF
-6%
-4%
-2%
+0%
+2%
+4%
+6%
giu
-87
giu
-89
giu
-91
giu
-93
giu
-95
giu
-97
giu
-99
giu
-01
giu
-03
giu
-05
giu
-07
giu
-09
giu
-11
giu
-13
giu
-15
giu
-17
giu
-19
giu
-21
Latam Output Gap
IMF-based Forecast
+1 STD
-1 STD
-8%
-6%
-4%
-2%
+0%
+2%
+4%
+6%
+8%
giu
-87
giu
-89
giu
-91
giu
-93
giu
-95
giu
-97
giu
-99
giu
-01
giu
-03
giu
-05
giu
-07
giu
-09
giu
-11
giu
-13
giu
-15
giu
-17
giu
-19
giu
-21
Latam to US Output Gap Differential
IMF-based Forecast
+1 STD
-1 STD
Investment Committee - October 2017
Monetary Policies: still expanding even if gradually less
11
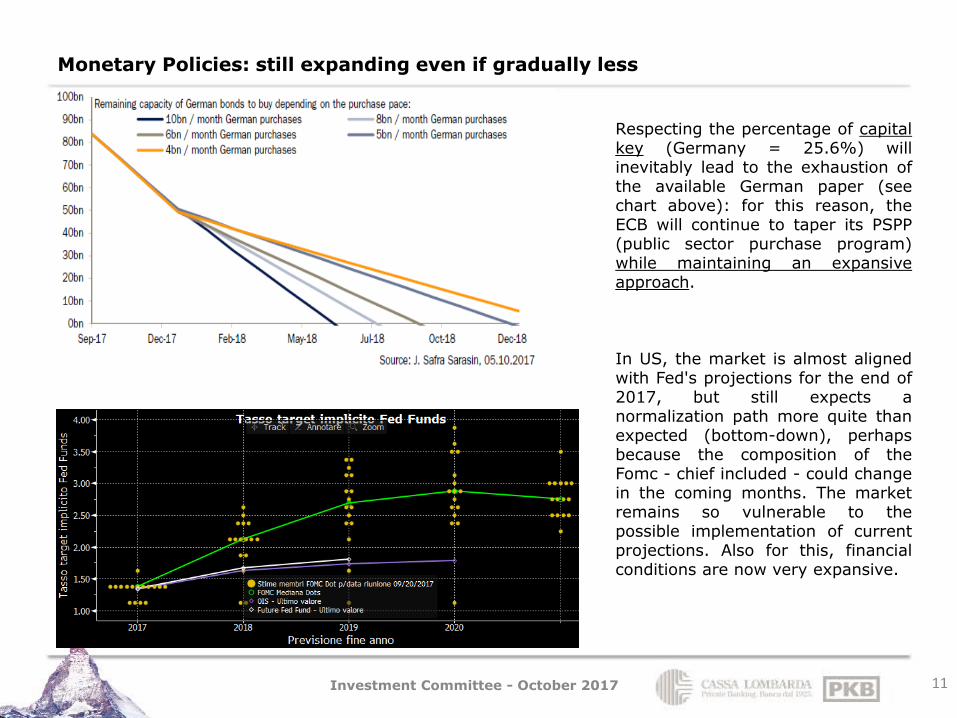
Respecting the percentage of capital key (Germany = 25.6%) will inevitably lead to the exhaustion of the available German paper (see chart above): for this reason, the ECB will continue to taper its PSPP (public sector purchase program) while maintaining an expansive approach. In US, the market is almost aligned with Fed's projections for the end of 2017, but still expects a normalization path more quite than expected (bottom-down), perhaps because the composition of the Fomc - chief included - could change in the coming months. The market remains so vulnerable to the possible implementation of current projections. Also for this, financial conditions are now very expansive.
Investment Committee - October 2017
Asset allocation: a position with a total balanced risk is appropriate
12
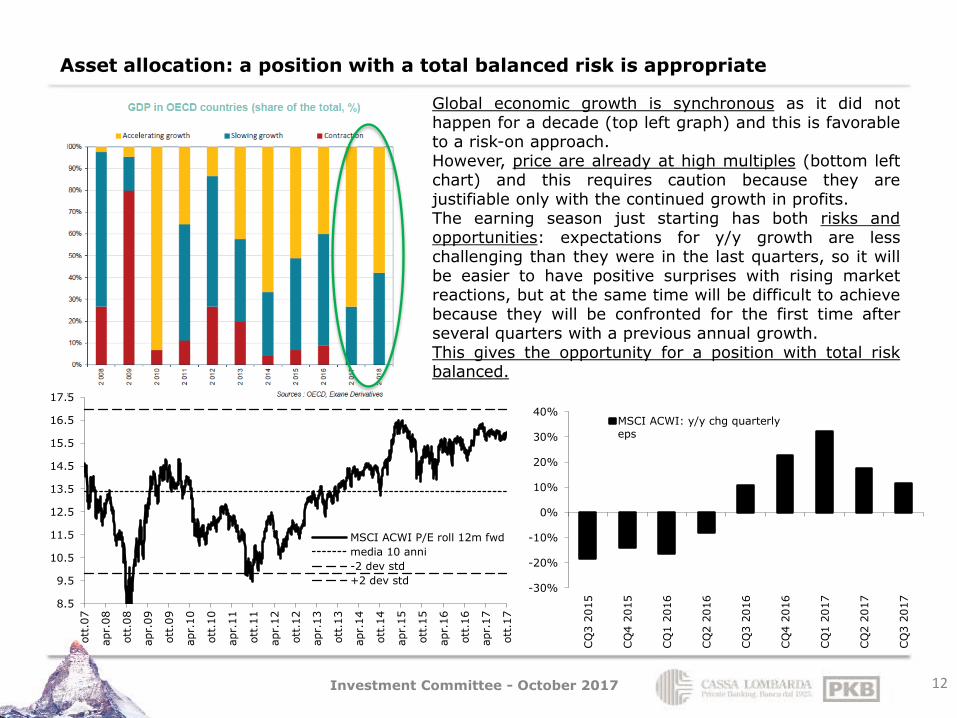
Global economic growth is synchronous as it did not happen for a decade (top left graph) and this is favorable to a risk-on approach. However, price are already at high multiples (bottom left chart) and this requires caution because they are justifiable only with the continued growth in profits. The earning season just starting has both risks and opportunities: expectations for y/y growth are less challenging than they were in the last quarters, so it will be easier to have positive surprises with rising market reactions, but at the same time will be difficult to achieve because they will be confronted for the first time after several quarters with a previous annual growth. This gives the opportunity for a position with total risk balanced.
-30%
-20%
-10%
0%
10%
20%
30%
40%
CQ
3 2
015
CQ
4 2
015
CQ
1 2
016
CQ
2 2
016
CQ
3 2
016
CQ
4 2
016
CQ
1 2
017
CQ
2 2
017
CQ
3 2
017
MSCI ACWI: y/y chg quarterlyeps
8.5
9.5
10.5
11.5
12.5
13.5
14.5
15.5
16.5
17.5
ott
.07
apr.
08
ott
.08
apr.
09
ott
.09
apr.
10
ott
.10
apr.
11
ott
.11
apr.
12
ott
.12
apr.
13
ott
.13
apr.
14
ott
.14
apr.
15
ott
.15
apr.
16
ott
.16
apr.
17
ott
.17
MSCI ACWI P/E roll 12m fwd
media 10 anni
-2 dev std
+2 dev std
Investment Committee - October 2017
Asset allocation: balanced position by identifying selective opportunities
13
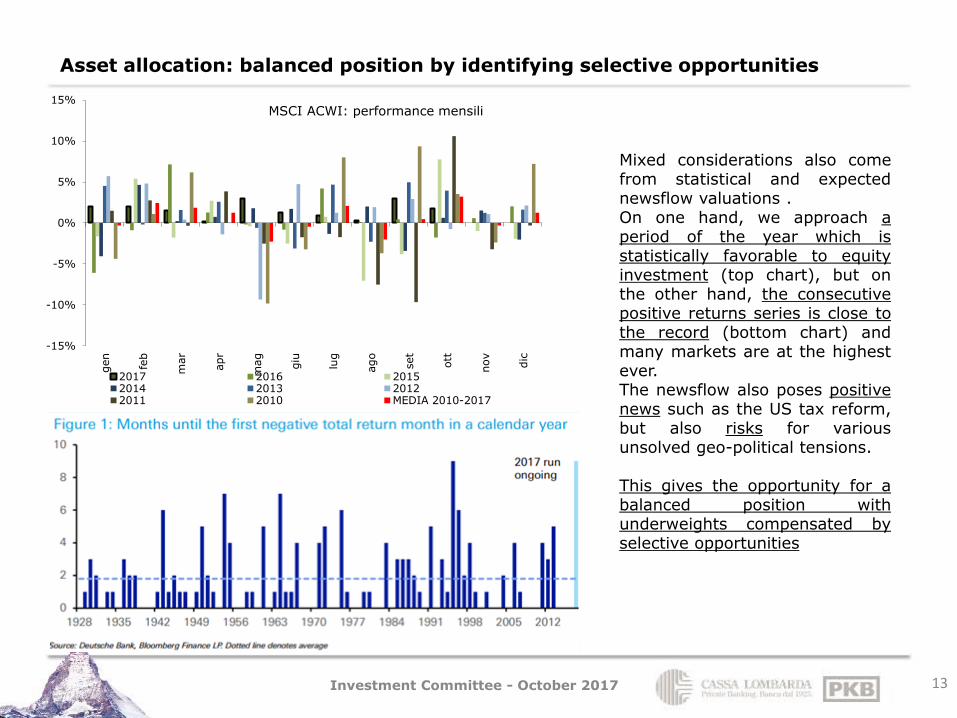
Mixed considerations also come from statistical and expected newsflow valuations . On one hand, we approach a period of the year which is statistically favorable to equity investment (top chart), but on the other hand, the consecutive positive returns series is close to the record (bottom chart) and many markets are at the highest ever. The newsflow also poses positive news such as the US tax reform, but also risks for various unsolved geo-political tensions. This gives the opportunity for a balanced position with underweights compensated by selective opportunities
-15%
-10%
-5%
0%
5%
10%
15%gen
feb
mar
apr
mag
giu
lug
ago
set
ott
nov
dic
MSCI ACWI: performance mensili
2017 2016 20152014 2013 20122011 2010 MEDIA 2010-2017
Investment Committee - October 2017
Asset allocation: growth should curb curve flattening
14
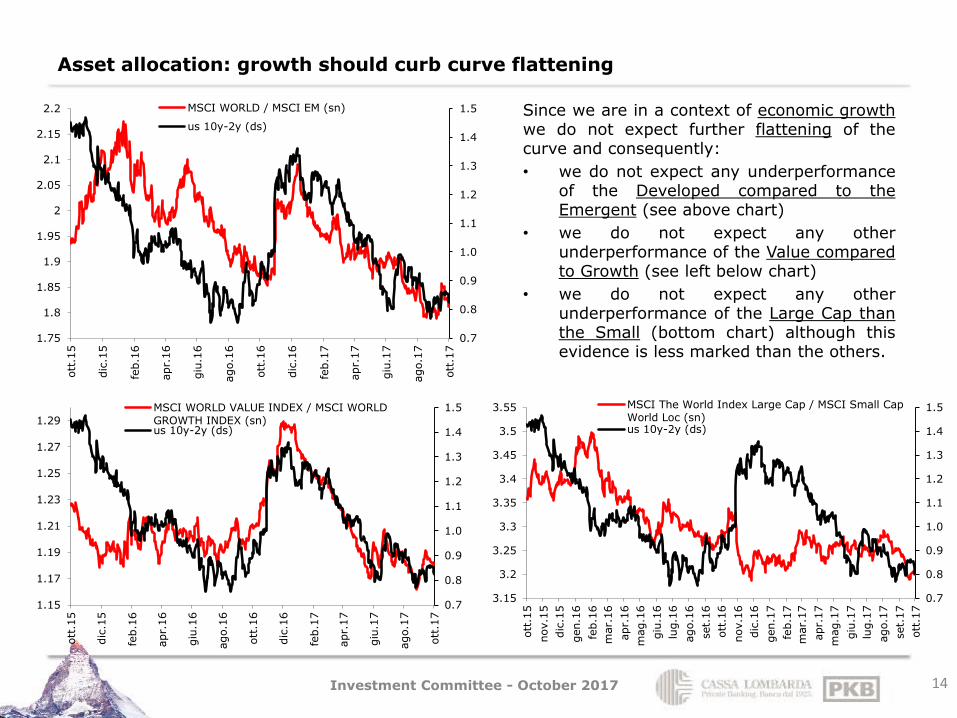
Since we are in a context of economic growth we do not expect further flattening of the curve and consequently:
• we do not expect any underperformance of the Developed compared to the Emergent (see above chart)
• we do not expect any other underperformance of the Value compared to Growth (see left below chart)
• we do not expect any other underperformance of the Large Cap than the Small (bottom chart) although this evidence is less marked than the others.
0.7
0.8
0.9
1.0
1.1
1.2
1.3
1.4
1.5
1.75
1.8
1.85
1.9
1.95
2
2.05
2.1
2.15
2.2
ott
.15
dic
.15
feb.1
6
apr.
16
giu
.16
ago.1
6
ott
.16
dic
.16
feb.1
7
apr.
17
giu
.17
ago.1
7
ott
.17
MSCI WORLD / MSCI EM (sn)
us 10y-2y (ds)
0.7
0.8
0.9
1.0
1.1
1.2
1.3
1.4
1.5
1.15
1.17
1.19
1.21
1.23
1.25
1.27
1.29
ott
.15
dic
.15
feb.1
6
apr.
16
giu
.16
ago.1
6
ott
.16
dic
.16
feb.1
7
apr.
17
giu
.17
ago.1
7
ott
.17
MSCI WORLD VALUE INDEX / MSCI WORLDGROWTH INDEX (sn)us 10y-2y (ds)
0.7
0.8
0.9
1.0
1.1
1.2
1.3
1.4
1.5
3.15
3.2
3.25
3.3
3.35
3.4
3.45
3.5
3.55
ott
.15
nov.1
5
dic
.15
gen.1
6
feb.1
6
mar.
16
apr.
16
mag.1
6
giu
.16
lug.1
6
ago.1
6
set.
16
ott
.16
nov.1
6
dic
.16
gen.1
7
feb.1
7
mar.
17
apr.
17
mag.1
7
giu
.17
lug.1
7
ago.1
7
set.
17
ott
.17
MSCI The World Index Large Cap / MSCI Small CapWorld Loc (sn)us 10y-2y (ds)
Investment Committee - October 2017
US Shares: consistent valuations and possible currency boosts in quarterly releases
15
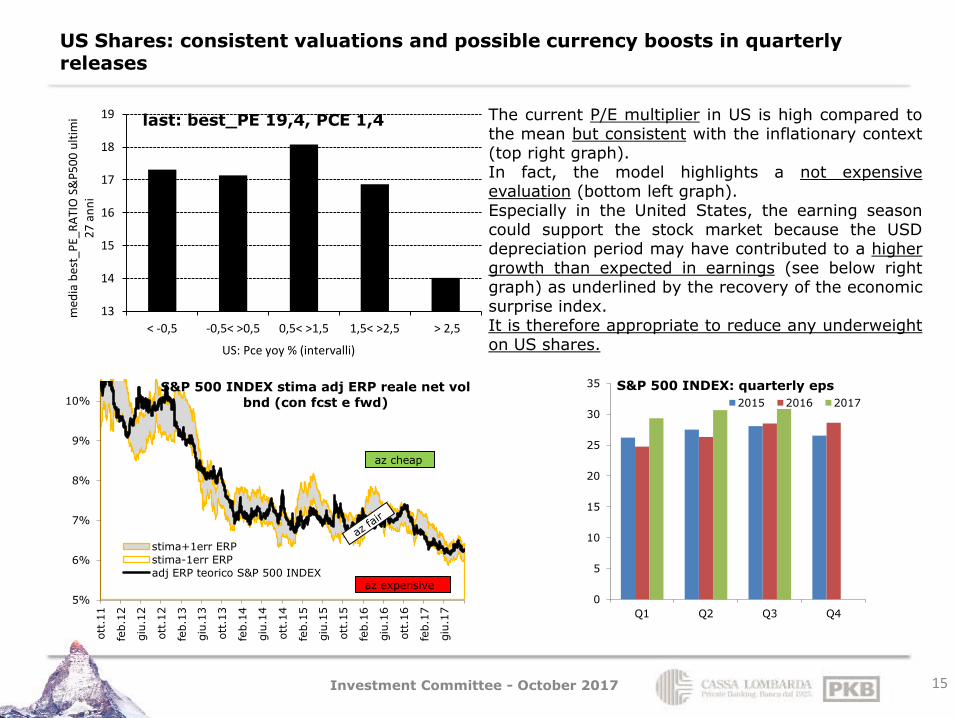
The current P/E multiplier in US is high compared to the mean but consistent with the inflationary context (top right graph). In fact, the model highlights a not expensive evaluation (bottom left graph). Especially in the United States, the earning season could support the stock market because the USD depreciation period may have contributed to a higher growth than expected in earnings (see below right graph) as underlined by the recovery of the economic surprise index. It is therefore appropriate to reduce any underweight on US shares.
13
14
15
16
17
18
19
< -0,5 -0,5< >0,5 0,5< >1,5 1,5< >2,5 > 2,5
med
ia b
est_
PE_
RA
TIO
S&
P5
00
ult
imi
27
an
ni
US: Pce yoy % (intervalli)
last: best_PE 19,4, PCE 1,4
5%
6%
7%
8%
9%
10%
ott
.11
feb.1
2
giu
.12
ott
.12
feb.1
3
giu
.13
ott
.13
feb.1
4
giu
.14
ott
.14
feb.1
5
giu
.15
ott
.15
feb.1
6
giu
.16
ott
.16
feb.1
7
giu
.17
S&P 500 INDEX stima adj ERP reale net vol
bnd (con fcst e fwd)
stima+1err ERP
stima-1err ERP
adj ERP teorico S&P 500 INDEX
az cheap
az expensive
0
5
10
15
20
25
30
35
Q1 Q2 Q3 Q4
S&P 500 INDEX: quarterly eps
2015 2016 2017
Investment Committee - October 2017
EU equities: aggregate valuation not expensive yet, with inner potential
16
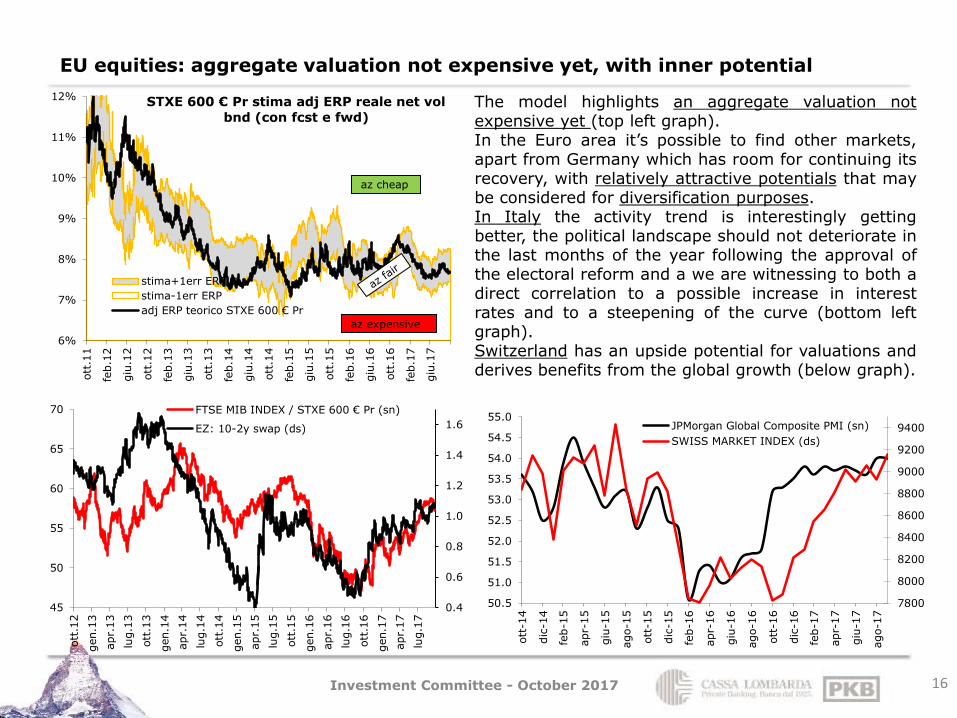
The model highlights an aggregate valuation not expensive yet (top left graph). In the Euro area it’s possible to find other markets, apart from Germany which has room for continuing its recovery, with relatively attractive potentials that may be considered for diversification purposes. In Italy the activity trend is interestingly getting better, the political landscape should not deteriorate in the last months of the year following the approval of the electoral reform and a we are witnessing to both a direct correlation to a possible increase in interest rates and to a steepening of the curve (bottom left graph). Switzerland has an upside potential for valuations and derives benefits from the global growth (below graph).
6%
7%
8%
9%
10%
11%
12%ott
.11
feb.1
2
giu
.12
ott
.12
feb.1
3
giu
.13
ott
.13
feb.1
4
giu
.14
ott
.14
feb.1
5
giu
.15
ott
.15
feb.1
6
giu
.16
ott
.16
feb.1
7
giu
.17
STXE 600 € Pr stima adj ERP reale net vol
bnd (con fcst e fwd)
stima+1err ERP
stima-1err ERP
adj ERP teorico STXE 600 € Pr
az cheap
az expensive
0.4
0.6
0.8
1.0
1.2
1.4
1.6
45
50
55
60
65
70
ott
.12
gen.1
3
apr.
13
lug.1
3
ott
.13
gen.1
4
apr.
14
lug.1
4
ott
.14
gen.1
5
apr.
15
lug.1
5
ott
.15
gen.1
6
apr.
16
lug.1
6
ott
.16
gen.1
7
apr.
17
lug.1
7FTSE MIB INDEX / STXE 600 € Pr (sn)
EZ: 10-2y swap (ds)
7800
8000
8200
8400
8600
8800
9000
9200
9400
50.5
51.0
51.5
52.0
52.5
53.0
53.5
54.0
54.5
55.0
ott
-14
dic
-14
feb-1
5
apr-
15
giu
-15
ago-1
5
ott
-15
dic
-15
feb-1
6
apr-
16
giu
-16
ago-1
6
ott
-16
dic
-16
feb-1
7
apr-
17
giu
-17
ago-1
7
JPMorgan Global Composite PMI (sn)
SWISS MARKET INDEX (ds)
Investment Committee - October 2017
Japan equities: cheap valuations with expanding business and currency support.
17
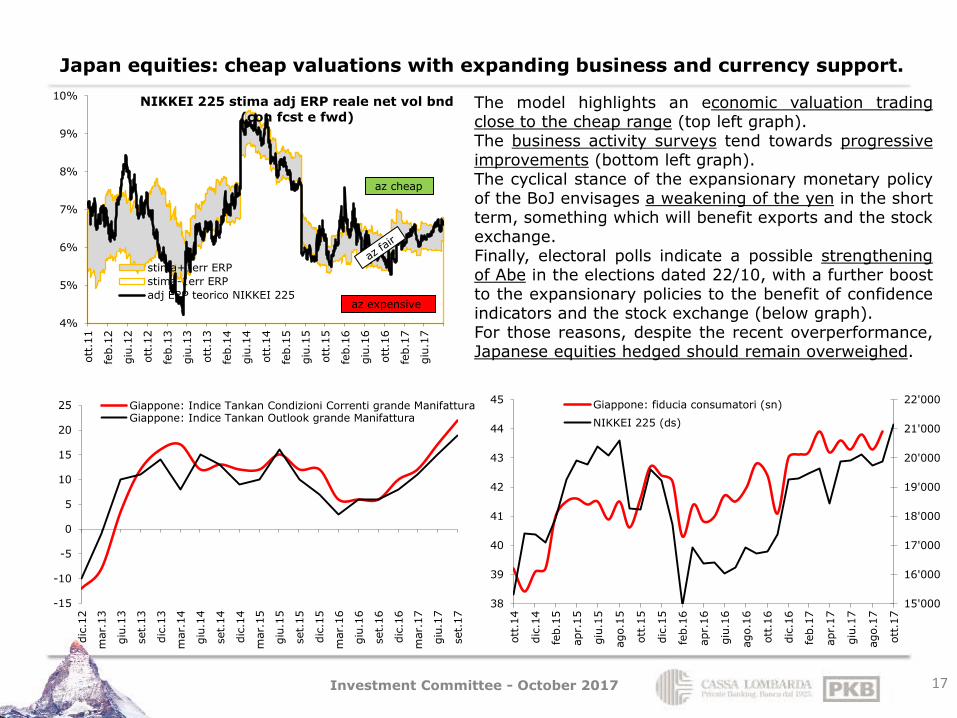
The model highlights an economic valuation trading close to the cheap range (top left graph). The business activity surveys tend towards progressive improvements (bottom left graph). The cyclical stance of the expansionary monetary policy of the BoJ envisages a weakening of the yen in the short term, something which will benefit exports and the stock exchange. Finally, electoral polls indicate a possible strengthening of Abe in the elections dated 22/10, with a further boost to the expansionary policies to the benefit of confidence indicators and the stock exchange (below graph). For those reasons, despite the recent overperformance, Japanese equities hedged should remain overweighed.
4%
5%
6%
7%
8%
9%
10%ott
.11
feb.1
2
giu
.12
ott
.12
feb.1
3
giu
.13
ott
.13
feb.1
4
giu
.14
ott
.14
feb.1
5
giu
.15
ott
.15
feb.1
6
giu
.16
ott
.16
feb.1
7
giu
.17
NIKKEI 225 stima adj ERP reale net vol bnd
(con fcst e fwd)
stima+1err ERP
stima-1err ERP
adj ERP teorico NIKKEI 225
az cheap
az expensive
-15
-10
-5
0
5
10
15
20
25
dic
.12
mar.
13
giu
.13
set.
13
dic
.13
mar.
14
giu
.14
set.
14
dic
.14
mar.
15
giu
.15
set.
15
dic
.15
mar.
16
giu
.16
set.
16
dic
.16
mar.
17
giu
.17
set.
17
Giappone: Indice Tankan Condizioni Correnti grande ManifatturaGiappone: Indice Tankan Outlook grande Manifattura
15'000
16'000
17'000
18'000
19'000
20'000
21'000
22'000
38
39
40
41
42
43
44
45
ott
.14
dic
.14
feb.1
5
apr.
15
giu
.15
ago.1
5
ott
.15
dic
.15
feb.1
6
apr.
16
giu
.16
ago.1
6
ott
.16
dic
.16
feb.1
7
apr.
17
giu
.17
ago.1
7
ott
.17
Giappone: fiducia consumatori (sn)
NIKKEI 225 (ds)
Investment Committee - October 2017
Emerging Markets Equities: in aggregate considered to be expensive
18
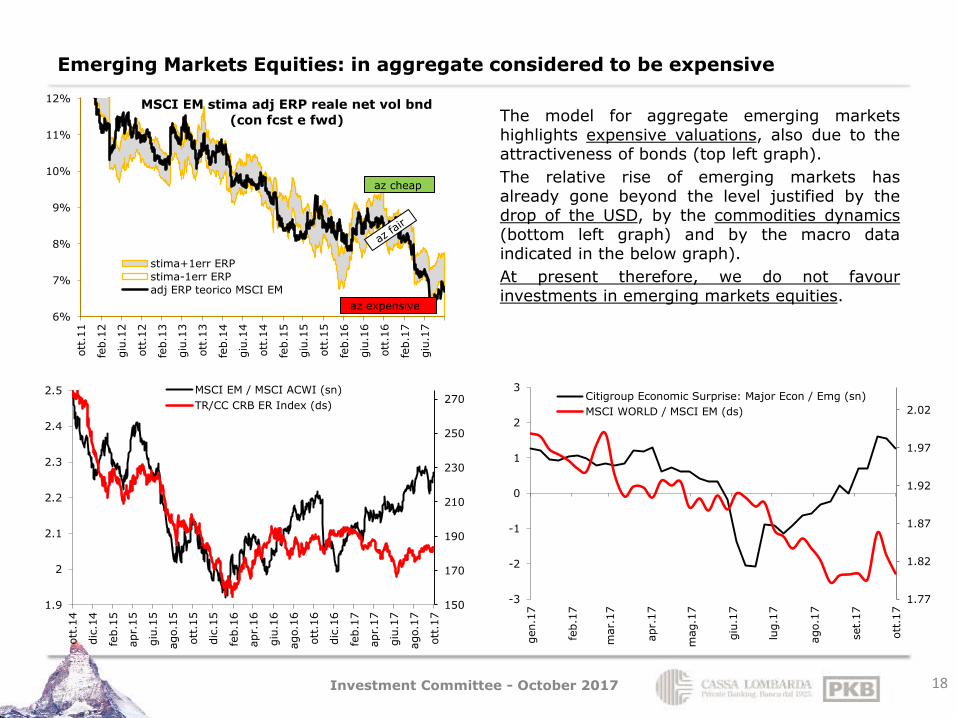
The model for aggregate emerging markets highlights expensive valuations, also due to the attractiveness of bonds (top left graph).
The relative rise of emerging markets has already gone beyond the level justified by the drop of the USD, by the commodities dynamics (bottom left graph) and by the macro data indicated in the below graph).
At present therefore, we do not favour investments in emerging markets equities.
6%
7%
8%
9%
10%
11%
12%
ott
.11
feb.1
2
giu
.12
ott
.12
feb.1
3
giu
.13
ott
.13
feb.1
4
giu
.14
ott
.14
feb.1
5
giu
.15
ott
.15
feb.1
6
giu
.16
ott
.16
feb.1
7
giu
.17
MSCI EM stima adj ERP reale net vol bnd
(con fcst e fwd)
stima+1err ERP
stima-1err ERP
adj ERP teorico MSCI EM
az cheap
az expensive
150
170
190
210
230
250
270
1.9
2
2.1
2.2
2.3
2.4
2.5
ott
.14
dic
.14
feb.1
5
apr.
15
giu
.15
ago.1
5
ott
.15
dic
.15
feb.1
6
apr.
16
giu
.16
ago.1
6
ott
.16
dic
.16
feb.1
7
apr.
17
giu
.17
ago.1
7
ott
.17
MSCI EM / MSCI ACWI (sn)
TR/CC CRB ER Index (ds)
1.77
1.82
1.87
1.92
1.97
2.02
-3
-2
-1
0
1
2
3
gen.1
7
feb.1
7
mar.
17
apr.
17
mag.1
7
giu
.17
lug.1
7
ago.1
7
set.
17
ott
.17
Citigroup Economic Surprise: Major Econ / Emg (sn)
MSCI WORLD / MSCI EM (ds)
Investment Committee - October 2017
US government bonds: current consistent levels for rates but with upward pressure in the medium term
19
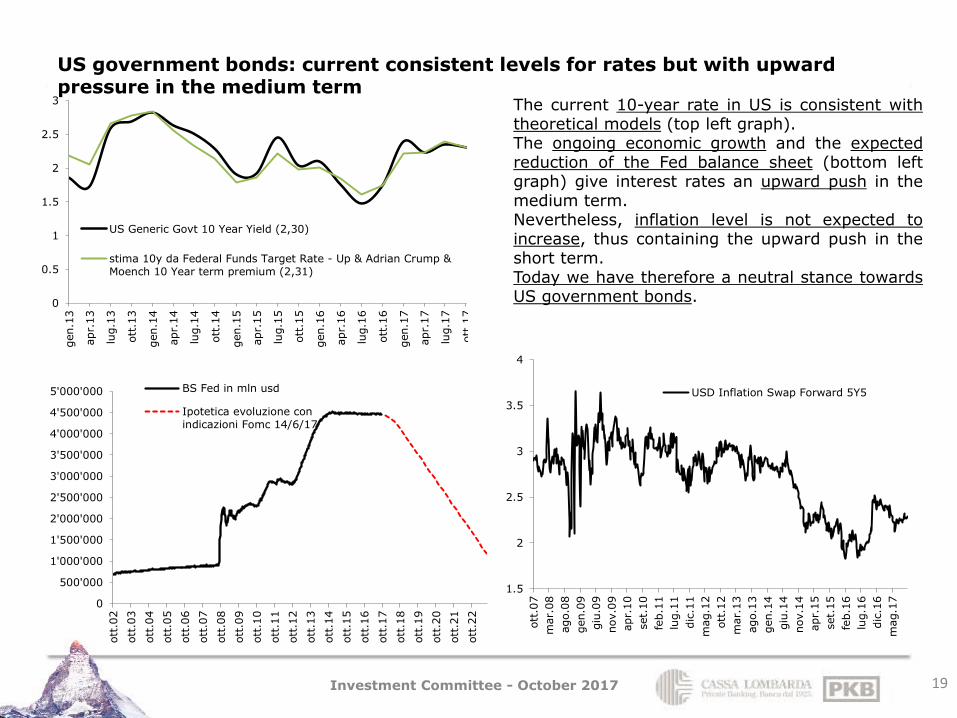
The current 10-year rate in US is consistent with theoretical models (top left graph). The ongoing economic growth and the expected reduction of the Fed balance sheet (bottom left graph) give interest rates an upward push in the medium term. Nevertheless, inflation level is not expected to increase, thus containing the upward push in the short term. Today we have therefore a neutral stance towards US government bonds. 0
0.5
1
1.5
2
2.5
3
gen.1
3
apr.
13
lug.1
3
ott
.13
gen.1
4
apr.
14
lug.1
4
ott
.14
gen.1
5
apr.
15
lug.1
5
ott
.15
gen.1
6
apr.
16
lug.1
6
ott
.16
gen.1
7
apr.
17
lug.1
7
ott
.17
US Generic Govt 10 Year Yield (2,30)
stima 10y da Federal Funds Target Rate - Up & Adrian Crump &Moench 10 Year term premium (2,31)
0
500'000
1'000'000
1'500'000
2'000'000
2'500'000
3'000'000
3'500'000
4'000'000
4'500'000
5'000'000
ott
.02
ott
.03
ott
.04
ott
.05
ott
.06
ott
.07
ott
.08
ott
.09
ott
.10
ott
.11
ott
.12
ott
.13
ott
.14
ott
.15
ott
.16
ott
.17
ott
.18
ott
.19
ott
.20
ott
.21
ott
.22
BS Fed in mln usd
Ipotetica evoluzione conindicazioni Fomc 14/6/17
1.5
2
2.5
3
3.5
4
ott
.07
mar.
08
ago.0
8
gen.0
9
giu
.09
nov.0
9
apr.
10
set.
10
feb.1
1
lug.1
1
dic
.11
mag.1
2
ott
.12
mar.
13
ago.1
3
gen.1
4
giu
.14
nov.1
4
apr.
15
set.
15
feb.1
6
lug.1
6
dic
.16
mag.1
7
USD Inflation Swap Forward 5Y5
Investment Committee - October 2017
Eurozone government bonds: rates lower than fundamental levels with preference for peripherals
20
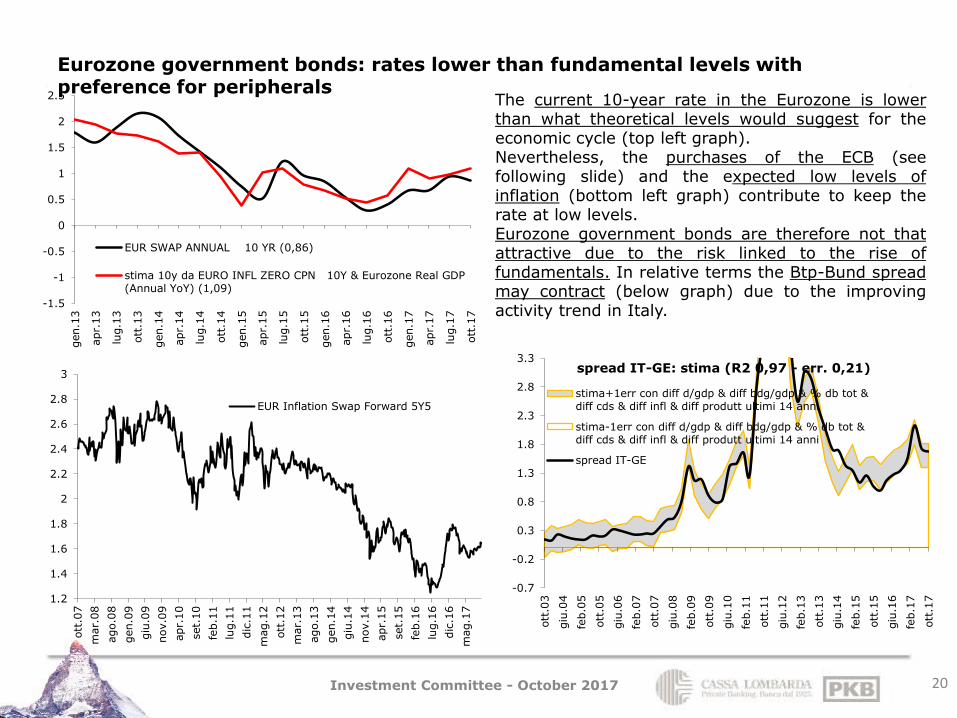
The current 10-year rate in the Eurozone is lower than what theoretical levels would suggest for the economic cycle (top left graph). Nevertheless, the purchases of the ECB (see following slide) and the expected low levels of inflation (bottom left graph) contribute to keep the rate at low levels. Eurozone government bonds are therefore not that attractive due to the risk linked to the rise of fundamentals. In relative terms the Btp-Bund spread may contract (below graph) due to the improving activity trend in Italy.
-1.5
-1
-0.5
0
0.5
1
1.5
2
2.5
gen.1
3
apr.
13
lug.1
3
ott
.13
gen.1
4
apr.
14
lug.1
4
ott
.14
gen.1
5
apr.
15
lug.1
5
ott
.15
gen.1
6
apr.
16
lug.1
6
ott
.16
gen.1
7
apr.
17
lug.1
7
ott
.17
EUR SWAP ANNUAL 10 YR (0,86)
stima 10y da EURO INFL ZERO CPN 10Y & Eurozone Real GDP(Annual YoY) (1,09)
1.2
1.4
1.6
1.8
2
2.2
2.4
2.6
2.8
3
ott
.07
mar.
08
ago.0
8
gen.0
9
giu
.09
nov.0
9
apr.
10
set.
10
feb.1
1
lug.1
1
dic
.11
mag.1
2
ott
.12
mar.
13
ago.1
3
gen.1
4
giu
.14
nov.1
4
apr.
15
set.
15
feb.1
6
lug.1
6
dic
.16
mag.1
7
EUR Inflation Swap Forward 5Y5
-0.7
-0.2
0.3
0.8
1.3
1.8
2.3
2.8
3.3
ott
.03
giu
.04
feb.0
5
ott
.05
giu
.06
feb.0
7
ott
.07
giu
.08
feb.0
9
ott
.09
giu
.10
feb.1
1
ott
.11
giu
.12
feb.1
3
ott
.13
giu
.14
feb.1
5
ott
.15
giu
.16
feb.1
7
ott
.17
spread IT-GE: stima (R2 0,97 - err. 0,21)
stima+1err con diff d/gdp & diff bdg/gdp & % db tot &diff cds & diff infl & diff produtt ultimi 14 anni
stima-1err con diff d/gdp & diff bdg/gdp & % db tot &diff cds & diff infl & diff produtt ultimi 14 anni
spread IT-GE
Investment Committee - October 2017
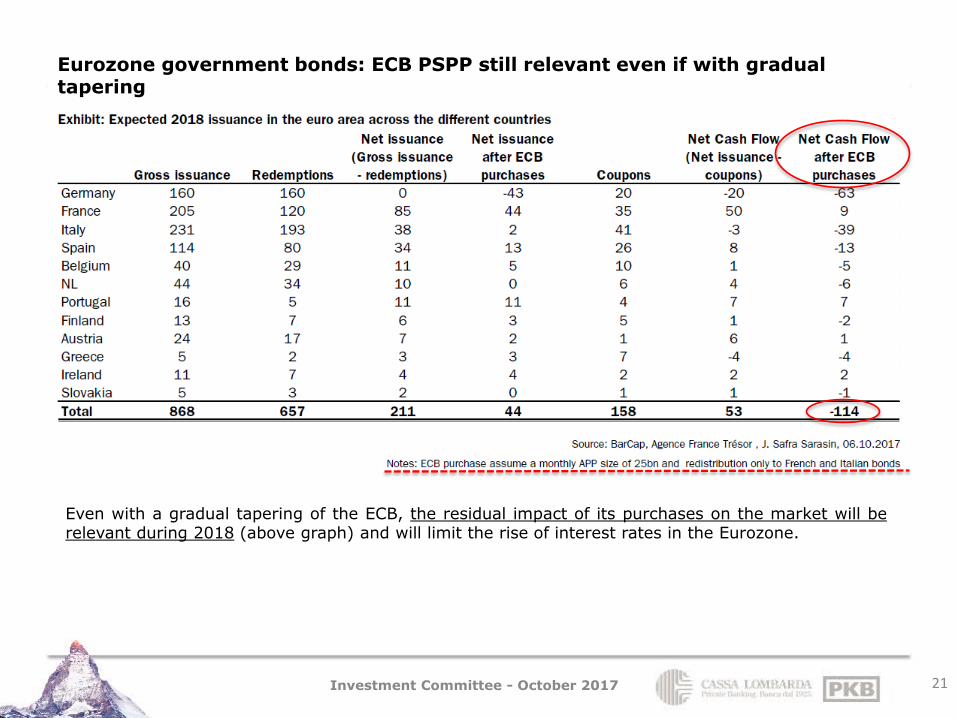
Eurozone government bonds: ECB PSPP still relevant even if with gradual tapering
21
Even with a gradual tapering of the ECB, the residual impact of its purchases on the market will be relevant during 2018 (above graph) and will limit the rise of interest rates in the Eurozone.
Investment Committee - October 2017
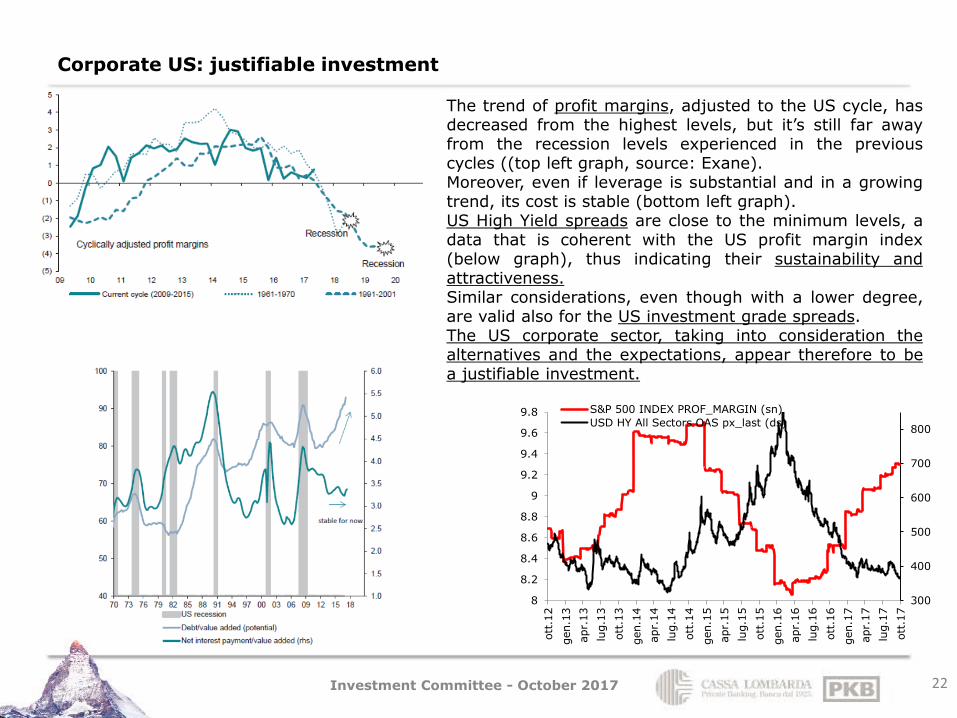
Corporate US: justifiable investment
22
The trend of profit margins, adjusted to the US cycle, has decreased from the highest levels, but it’s still far away from the recession levels experienced in the previous cycles ((top left graph, source: Exane). Moreover, even if leverage is substantial and in a growing trend, its cost is stable (bottom left graph). US High Yield spreads are close to the minimum levels, a data that is coherent with the US profit margin index (below graph), thus indicating their sustainability and attractiveness. Similar considerations, even though with a lower degree, are valid also for the US investment grade spreads. The US corporate sector, taking into consideration the alternatives and the expectations, appear therefore to be a justifiable investment.
300
400
500
600
700
800
8
8.2
8.4
8.6
8.8
9
9.2
9.4
9.6
9.8
ott
.12
gen.1
3
apr.
13
lug.1
3
ott
.13
gen.1
4
apr.
14
lug.1
4
ott
.14
gen.1
5
apr.
15
lug.1
5
ott
.15
gen.1
6
apr.
16
lug.1
6
ott
.16
gen.1
7
apr.
17
lug.1
7
ott
.17
S&P 500 INDEX PROF_MARGIN (sn)
USD HY All Sectors OAS px_last (ds)
Investment Committee - October 2017
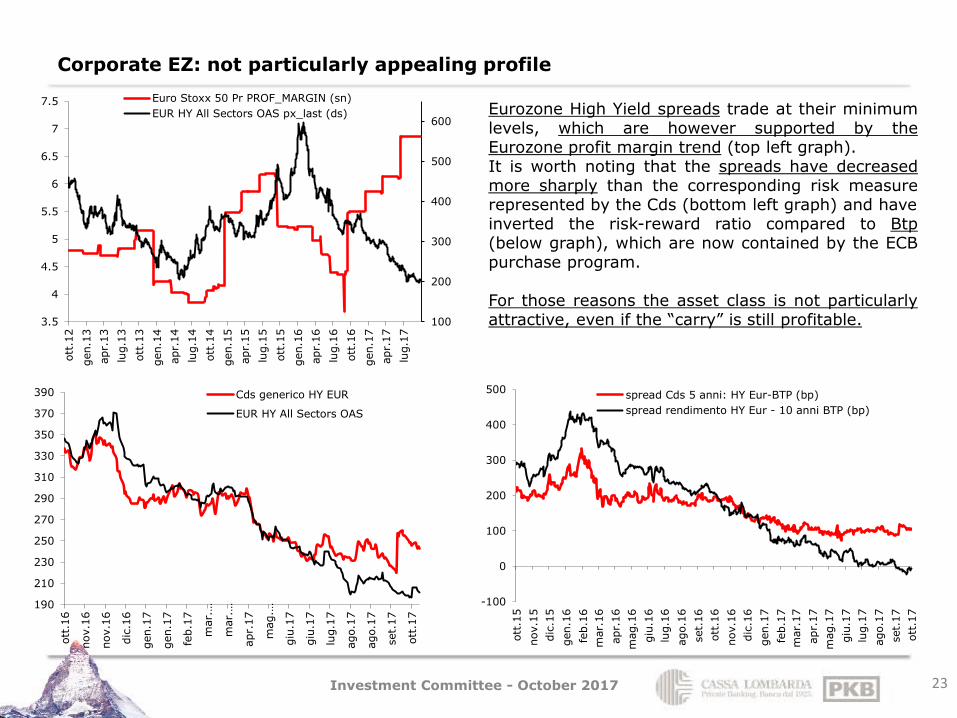
Corporate EZ: not particularly appealing profile
23
Eurozone High Yield spreads trade at their minimum levels, which are however supported by the Eurozone profit margin trend (top left graph). It is worth noting that the spreads have decreased more sharply than the corresponding risk measure represented by the Cds (bottom left graph) and have inverted the risk-reward ratio compared to Btp (below graph), which are now contained by the ECB purchase program. For those reasons the asset class is not particularly attractive, even if the “carry” is still profitable.
100
200
300
400
500
600
3.5
4
4.5
5
5.5
6
6.5
7
7.5
ott
.12
gen.1
3
apr.
13
lug.1
3
ott
.13
gen.1
4
apr.
14
lug.1
4
ott
.14
gen.1
5
apr.
15
lug.1
5
ott
.15
gen.1
6
apr.
16
lug.1
6
ott
.16
gen.1
7
apr.
17
lug.1
7
Euro Stoxx 50 Pr PROF_MARGIN (sn)
EUR HY All Sectors OAS px_last (ds)
-100
0
100
200
300
400
500
ott
.15
nov.1
5
dic
.15
gen.1
6
feb.1
6
mar.
16
apr.
16
mag.1
6
giu
.16
lug.1
6
ago.1
6
set.
16
ott
.16
nov.1
6
dic
.16
gen.1
7
feb.1
7
mar.
17
apr.
17
mag.1
7
giu
.17
lug.1
7
ago.1
7
set.
17
ott
.17
spread Cds 5 anni: HY Eur-BTP (bp)
spread rendimento HY Eur - 10 anni BTP (bp)
190
210
230
250
270
290
310
330
350
370
390
ott
.16
nov.1
6
nov.1
6
dic
.16
gen.1
7
gen.1
7
feb.1
7
mar.…
mar.…
apr.
17
mag.…
giu
.17
giu
.17
lug.1
7
ago.1
7
ago.1
7
set.
17
ott
.17
Cds generico HY EUR
EUR HY All Sectors OAS
Investment Committee - October 2017
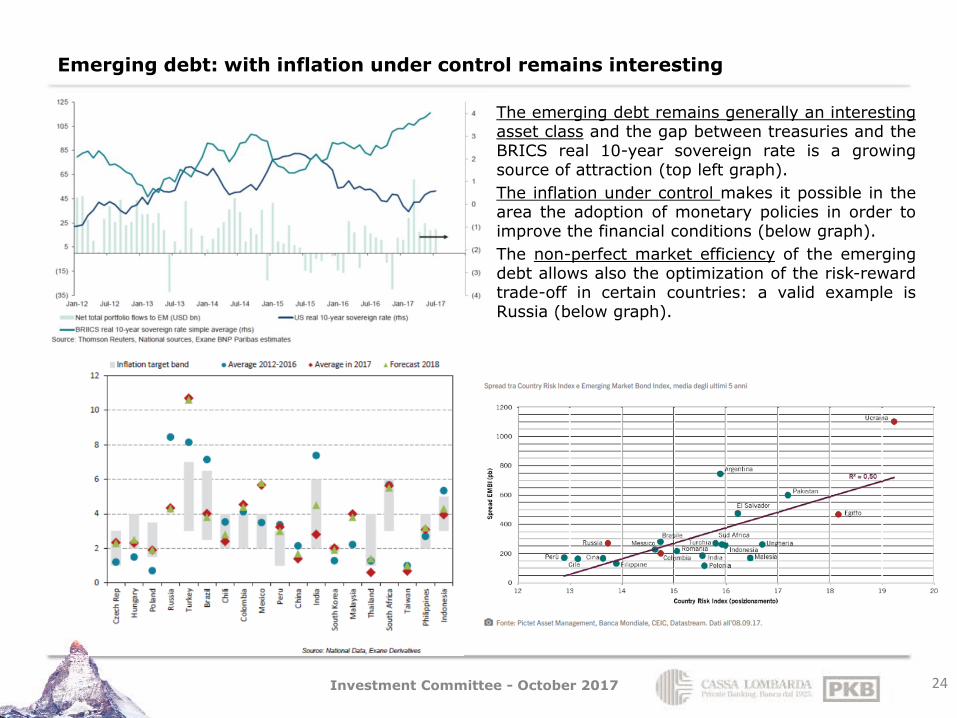
Emerging debt: with inflation under control remains interesting
24
The emerging debt remains generally an interesting asset class and the gap between treasuries and the BRICS real 10-year sovereign rate is a growing source of attraction (top left graph).
The inflation under control makes it possible in the area the adoption of monetary policies in order to improve the financial conditions (below graph).
The non-perfect market efficiency of the emerging debt allows also the optimization of the risk-reward trade-off in certain countries: a valid example is Russia (below graph).
Investment Committee - October 2017
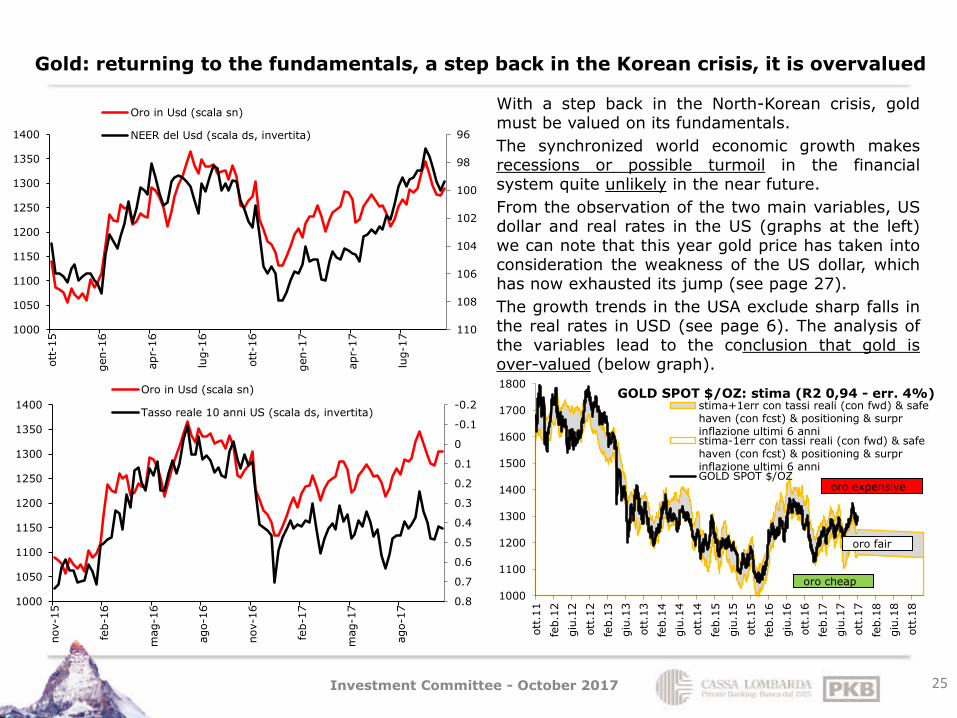
With a step back in the North-Korean crisis, gold must be valued on its fundamentals.
The synchronized world economic growth makes recessions or possible turmoil in the financial system quite unlikely in the near future.
From the observation of the two main variables, US dollar and real rates in the US (graphs at the left) we can note that this year gold price has taken into consideration the weakness of the US dollar, which has now exhausted its jump (see page 27).
The growth trends in the USA exclude sharp falls in the real rates in USD (see page 6). The analysis of the variables lead to the conclusion that gold is over-valued (below graph).
Gold: returning to the fundamentals, a step back in the Korean crisis, it is overvalued
25
96
98
100
102
104
106
108
1101000
1050
1100
1150
1200
1250
1300
1350
1400
ott
-15
gen-1
6
apr-
16
lug-1
6
ott
-16
gen-1
7
apr-
17
lug-1
7
Oro in Usd (scala sn)
NEER del Usd (scala ds, invertita)
1000
1100
1200
1300
1400
1500
1600
1700
1800
ott
.11
feb.1
2
giu
.12
ott
.12
feb.1
3
giu
.13
ott
.13
feb.1
4
giu
.14
ott
.14
feb.1
5
giu
.15
ott
.15
feb.1
6
giu
.16
ott
.16
feb.1
7
giu
.17
ott
.17
feb.1
8
giu
.18
ott
.18
GOLD SPOT $/OZ: stima (R2 0,94 - err. 4%) stima+1err con tassi reali (con fwd) & safehaven (con fcst) & positioning & surprinflazione ultimi 6 annistima-1err con tassi reali (con fwd) & safehaven (con fcst) & positioning & surprinflazione ultimi 6 anniGOLD SPOT $/OZ
oro cheap
oro expensive
oro fair
-0.2
-0.1
0
0.1
0.2
0.3
0.4
0.5
0.6
0.7
0.81000
1050
1100
1150
1200
1250
1300
1350
1400
nov-1
5
feb-1
6
mag-1
6
ago-1
6
nov-1
6
feb-1
7
mag-1
7
ago-1
7Oro in Usd (scala sn)
Tasso reale 10 anni US (scala ds, invertita)
Investment Committee - October 2017
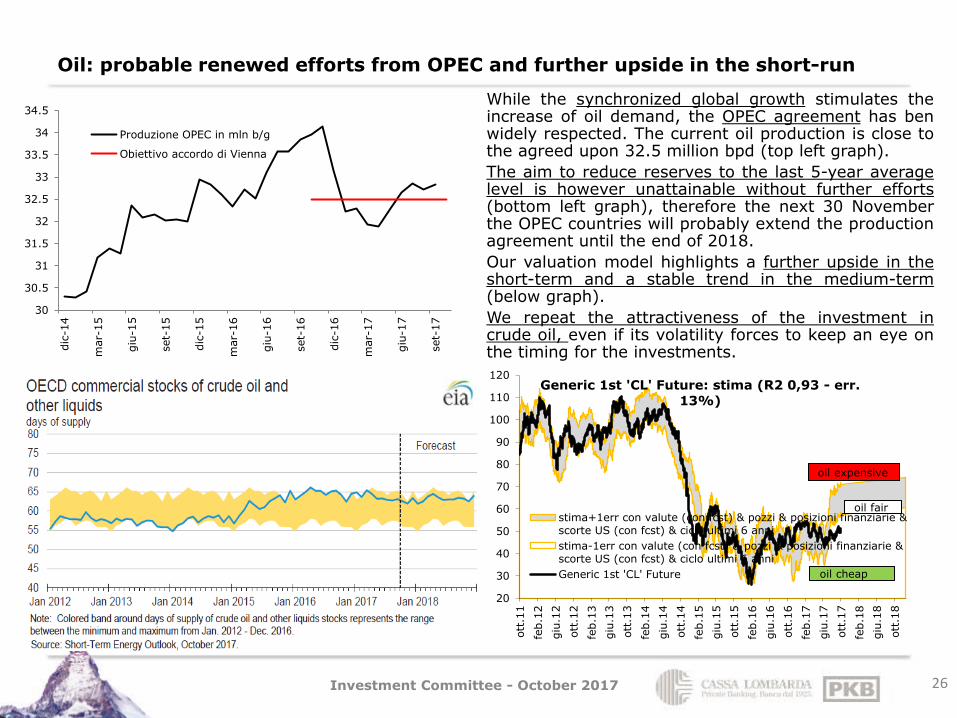
While the synchronized global growth stimulates the increase of oil demand, the OPEC agreement has ben widely respected. The current oil production is close to the agreed upon 32.5 million bpd (top left graph).
The aim to reduce reserves to the last 5-year average level is however unattainable without further efforts (bottom left graph), therefore the next 30 November the OPEC countries will probably extend the production agreement until the end of 2018.
Our valuation model highlights a further upside in the short-term and a stable trend in the medium-term (below graph).
We repeat the attractiveness of the investment in crude oil, even if its volatility forces to keep an eye on the timing for the investments.
Oil: probable renewed efforts from OPEC and further upside in the short-run
26
30
30.5
31
31.5
32
32.5
33
33.5
34
34.5
dic
-14
mar-
15
giu
-15
set-
15
dic
-15
mar-
16
giu
-16
set-
16
dic
-16
mar-
17
giu
-17
set-
17
Produzione OPEC in mln b/g
Obiettivo accordo di Vienna
20
30
40
50
60
70
80
90
100
110
120
ott
.11
feb.1
2
giu
.12
ott
.12
feb.1
3
giu
.13
ott
.13
feb.1
4
giu
.14
ott
.14
feb.1
5
giu
.15
ott
.15
feb.1
6
giu
.16
ott
.16
feb.1
7
giu
.17
ott
.17
feb.1
8
giu
.18
ott
.18
Generic 1st 'CL' Future: stima (R2 0,93 - err.
13%)
stima+1err con valute (con fcst) & pozzi & posizioni finanziarie &scorte US (con fcst) & ciclo ultimi 6 anni
stima-1err con valute (con fcst) & pozzi & posizioni finanziarie &scorte US (con fcst) & ciclo ultimi 6 anni
Generic 1st 'CL' Future oil cheap
oil expensive
oil fair
Investment Committee - October 2017
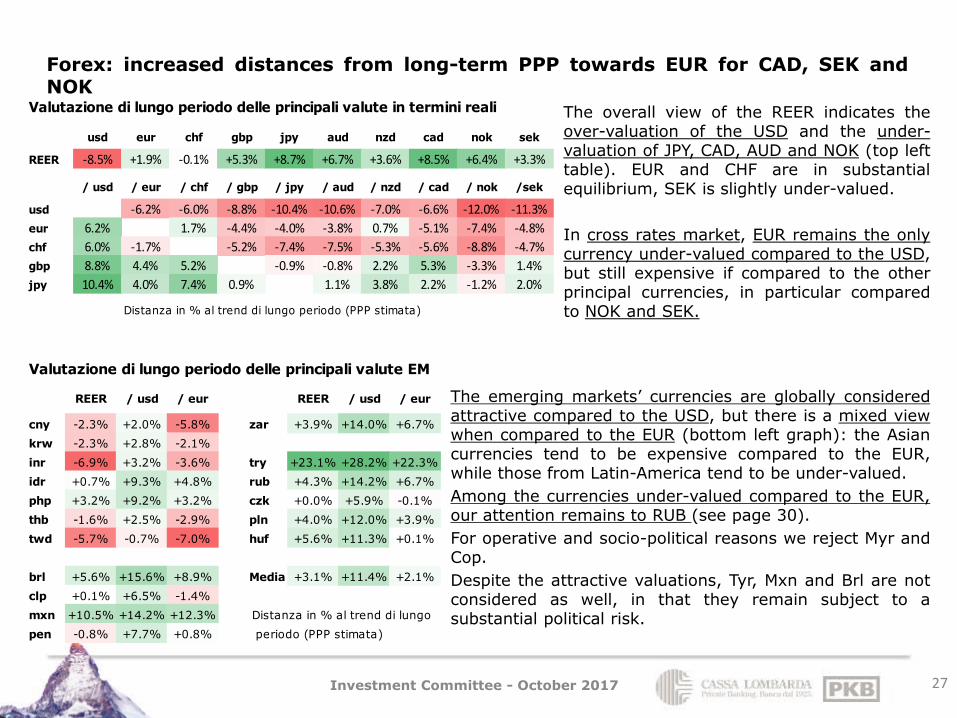
The overall view of the REER indicates the over-valuation of the USD and the under-valuation of JPY, CAD, AUD and NOK (top left table). EUR and CHF are in substantial equilibrium, SEK is slightly under-valued.
In cross rates market, EUR remains the only currency under-valued compared to the USD, but still expensive if compared to the other principal currencies, in particular compared to NOK and SEK.
Forex: increased distances from long-term PPP towards EUR for CAD, SEK and NOK
27
The emerging markets’ currencies are globally considered attractive compared to the USD, but there is a mixed view when compared to the EUR (bottom left graph): the Asian currencies tend to be expensive compared to the EUR, while those from Latin-America tend to be under-valued.
Among the currencies under-valued compared to the EUR, our attention remains to RUB (see page 30).
For operative and socio-political reasons we reject Myr and Cop.
Despite the attractive valuations, Tyr, Mxn and Brl are not considered as well, in that they remain subject to a substantial political risk.
Valutazione di lungo periodo delle principali valute in termini reali
usd eur chf gbp jpy aud nzd cad nok sek
REER -8.5% +1.9% -0.1% +5.3% +8.7% +6.7% +3.6% +8.5% +6.4% +3.3%
/ usd / eur / chf / gbp / jpy / aud / nzd / cad / nok /sek
usd -6.2% -6.0% -8.8% -10.4% -10.6% -7.0% -6.6% -12.0% -11.3%
eur 6.2% 1.7% -4.4% -4.0% -3.8% 0.7% -5.1% -7.4% -4.8%
chf 6.0% -1.7% -5.2% -7.4% -7.5% -5.3% -5.6% -8.8% -4.7%
gbp 8.8% 4.4% 5.2% -0.9% -0.8% 2.2% 5.3% -3.3% 1.4%
jpy 10.4% 4.0% 7.4% 0.9% 1.1% 3.8% 2.2% -1.2% 2.0%
Distanza in % al trend di lungo periodo (PPP stimata)
Valutazione di lungo periodo delle principali valute EM
REER / usd / eur REER / usd / eur
cny -2.3% +2.0% -5.8% zar +3.9% +14.0% +6.7%
krw -2.3% +2.8% -2.1%
inr -6.9% +3.2% -3.6% try +23.1% +28.2% +22.3%
idr +0.7% +9.3% +4.8% rub +4.3% +14.2% +6.7%
php +3.2% +9.2% +3.2% czk +0.0% +5.9% -0.1%
thb -1.6% +2.5% -2.9% pln +4.0% +12.0% +3.9%
twd -5.7% -0.7% -7.0% huf +5.6% +11.3% +0.1%
brl +5.6% +15.6% +8.9% Media EM+3.1% +11.4% +2.1%
clp +0.1% +6.5% -1.4%
mxn +10.5% +14.2% +12.3% Distanza in % al trend di lungo
pen -0.8% +7.7% +0.8% periodo (PPP stimata)
Investment Committee - October 2017
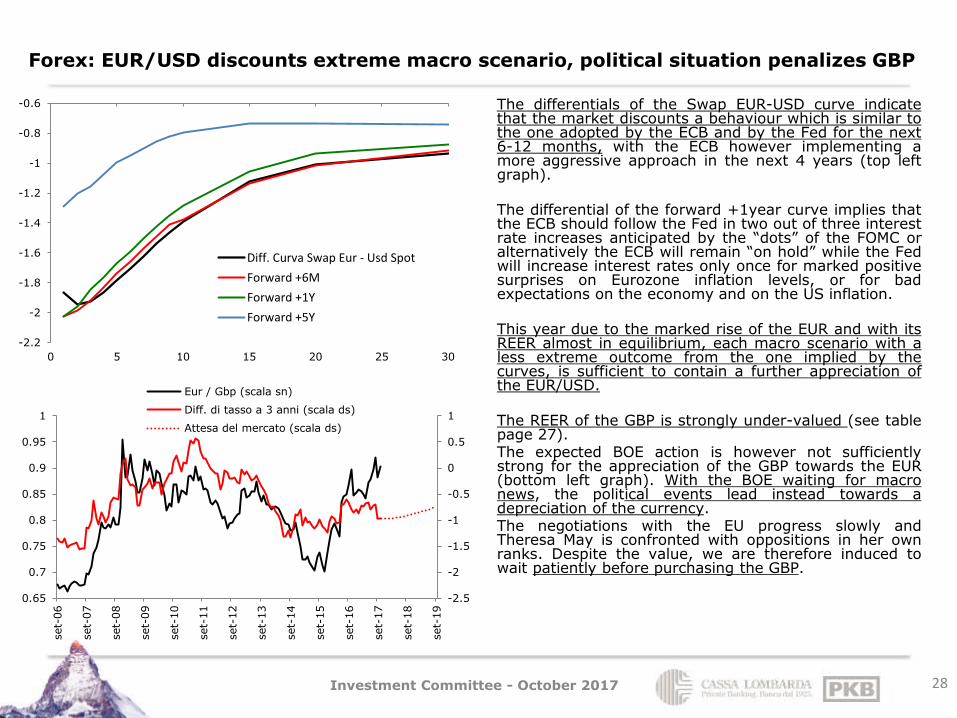
The differentials of the Swap EUR-USD curve indicate that the market discounts a behaviour which is similar to the one adopted by the ECB and by the Fed for the next 6-12 months, with the ECB however implementing a more aggressive approach in the next 4 years (top left graph). The differential of the forward +1year curve implies that the ECB should follow the Fed in two out of three interest rate increases anticipated by the “dots” of the FOMC or alternatively the ECB will remain “on hold” while the Fed will increase interest rates only once for marked positive surprises on Eurozone inflation levels, or for bad expectations on the economy and on the US inflation. This year due to the marked rise of the EUR and with its REER almost in equilibrium, each macro scenario with a less extreme outcome from the one implied by the curves, is sufficient to contain a further appreciation of the EUR/USD. The REER of the GBP is strongly under-valued (see table page 27). The expected BOE action is however not sufficiently strong for the appreciation of the GBP towards the EUR (bottom left graph). With the BOE waiting for macro news, the political events lead instead towards a depreciation of the currency. The negotiations with the EU progress slowly and Theresa May is confronted with oppositions in her own ranks. Despite the value, we are therefore induced to wait patiently before purchasing the GBP.
Forex: EUR/USD discounts extreme macro scenario, political situation penalizes GBP
28
-2.5
-2
-1.5
-1
-0.5
0
0.5
1
0.65
0.7
0.75
0.8
0.85
0.9
0.95
1
set-
06
set-
07
set-
08
set-
09
set-
10
set-
11
set-
12
set-
13
set-
14
set-
15
set-
16
set-
17
set-
18
set-
19
Eur / Gbp (scala sn)
Diff. di tasso a 3 anni (scala ds)
Attesa del mercato (scala ds)
-2.2
-2
-1.8
-1.6
-1.4
-1.2
-1
-0.8
-0.6
0 5 10 15 20 25 30
Diff. Curva Swap Eur - Usd Spot
Forward +6M
Forward +1Y
Forward +5Y
Investment Committee - October 2017
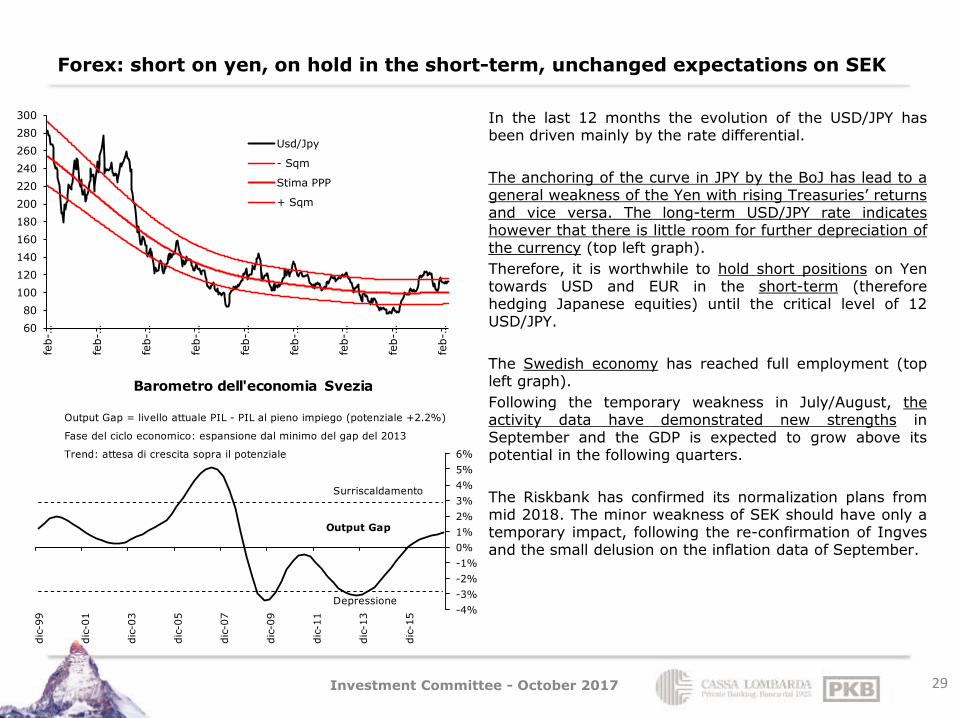
In the last 12 months the evolution of the USD/JPY has been driven mainly by the rate differential.
The anchoring of the curve in JPY by the BoJ has lead to a general weakness of the Yen with rising Treasuries’ returns and vice versa. The long-term USD/JPY rate indicates however that there is little room for further depreciation of the currency (top left graph).
Therefore, it is worthwhile to hold short positions on Yen towards USD and EUR in the short-term (therefore hedging Japanese equities) until the critical level of 12 USD/JPY.
The Swedish economy has reached full employment (top left graph).
Following the temporary weakness in July/August, the activity data have demonstrated new strengths in September and the GDP is expected to grow above its potential in the following quarters.
The Riskbank has confirmed its normalization plans from mid 2018. The minor weakness of SEK should have only a temporary impact, following the re-confirmation of Ingves and the small delusion on the inflation data of September.
Forex: short on yen, on hold in the short-term, unchanged expectations on SEK
29
60
80
100
120
140
160
180
200
220
240
260
280
300
feb-…
feb-…
feb-…
feb-…
feb-…
feb-…
feb-…
feb-…
feb-…
Usd/Jpy
- Sqm
Stima PPP
+ Sqm
Output Gap = livello attuale PIL - PIL al pieno impiego (potenziale +2.2%)
Fase del ciclo economico: espansione dal minimo del gap del 2013
Trend: attesa di crescita sopra il potenziale
Surriscaldamento
Output Gap
Depressione-4%
-3%
-2%
-1%
0%
1%
2%
3%
4%
5%
6%
dic
-99
dic
-01
dic
-03
dic
-05
dic
-07
dic
-09
dic
-11
dic
-13
dic
-15
Barometro dell'economia Svezia
Investment Committee - October 2017
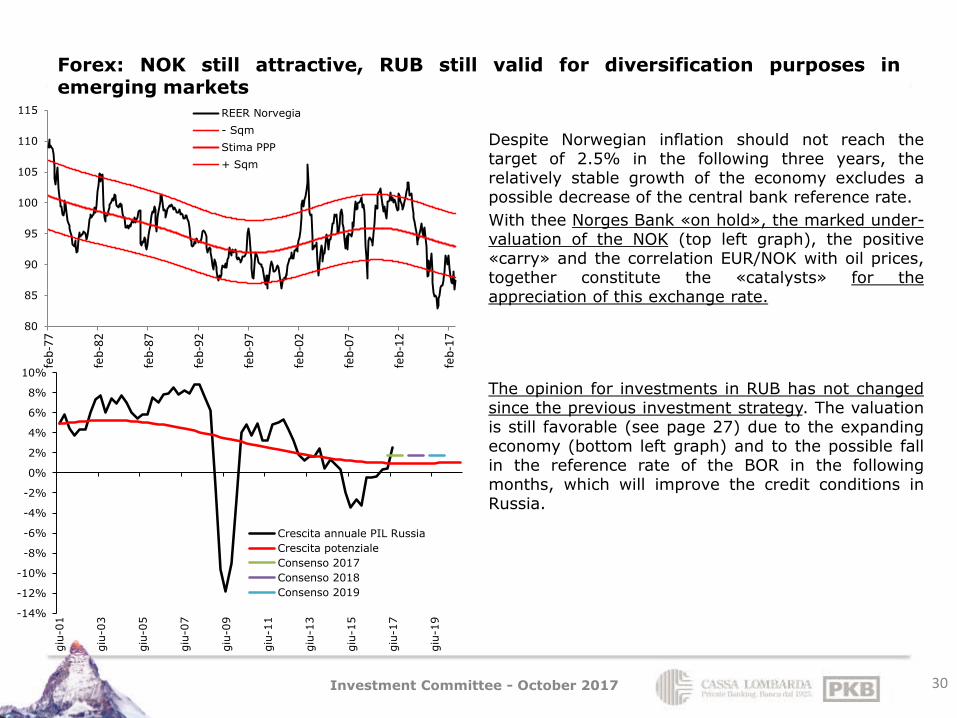
Despite Norwegian inflation should not reach the target of 2.5% in the following three years, the relatively stable growth of the economy excludes a possible decrease of the central bank reference rate.
With thee Norges Bank «on hold», the marked under-valuation of the NOK (top left graph), the positive «carry» and the correlation EUR/NOK with oil prices, together constitute the «catalysts» for the appreciation of this exchange rate.
The opinion for investments in RUB has not changed since the previous investment strategy. The valuation is still favorable (see page 27) due to the expanding economy (bottom left graph) and to the possible fall in the reference rate of the BOR in the following months, which will improve the credit conditions in Russia.
Forex: NOK still attractive, RUB still valid for diversification purposes in emerging markets
30
80
85
90
95
100
105
110
115
feb
-77
feb
-82
feb
-87
feb
-92
feb
-97
feb
-02
feb
-07
feb
-12
feb
-17
REER Norvegia
- Sqm
Stima PPP
+ Sqm
-14%
-12%
-10%
-8%
-6%
-4%
-2%
0%
2%
4%
6%
8%
10%
giu
-01
giu
-03
giu
-05
giu
-07
giu
-09
giu
-11
giu
-13
giu
-15
giu
-17
giu
-19
Crescita annuale PIL Russia
Crescita potenziale
Consenso 2017
Consenso 2018
Consenso 2019
Investment Committee - October 2017
Disclaimer The information and opinions contained in this report have been obtained from public sources believed to reliable. No representation or warranty is made or implied that is accurate or complete. Any opinions expressed in this report are subject to change without notice. This report has been prepared solely for information purposes and if so decided, for private circulation and does not constitute any solicitation to buy or sell any instrument, or to engage in any trading strategy. Sources: PKB / Cassa Lombarda calculations on Bloomberg data, unless otherwise stated
31
Asset Management & Products
Investment Committee - October 2017