Embed Size (px)
Citation preview

COMPANY PRESENTATION MILAN, MARCH 27TH 2018
GROUP HIGHLIGHTS
& STRATEGY
AEROPORTO G. MARCONI DI BOLOGNA S.p.A. 2
FY 2017
FINANCIALS
2018
KEY UPDATES
HIGHLIGHTS
& STRATEGY

3
BOLOGNA’S AIRPORT MAIN CHARACTERISTICS
AEROPORTO G. MARCONI DI BOLOGNA S.p.A.
8.2 MILLION PAX 76.3% INTERNATIONAL PAX
THE HIGHEST CONNECTIVITY GROWTH IN EU 2004-2014 +984% ACI Europe 2014 Airport Industry Connectivity Report
CENTRAL GEOGRAPHICAL LOCATION
HIGH STANDARD OF LIVING
STRONG ENTREPRENEURIAL SPIRIT
FY 2017
FINANCIALS
2018
KEY UPDATES
HIGHLIGHTS
& STRATEGY
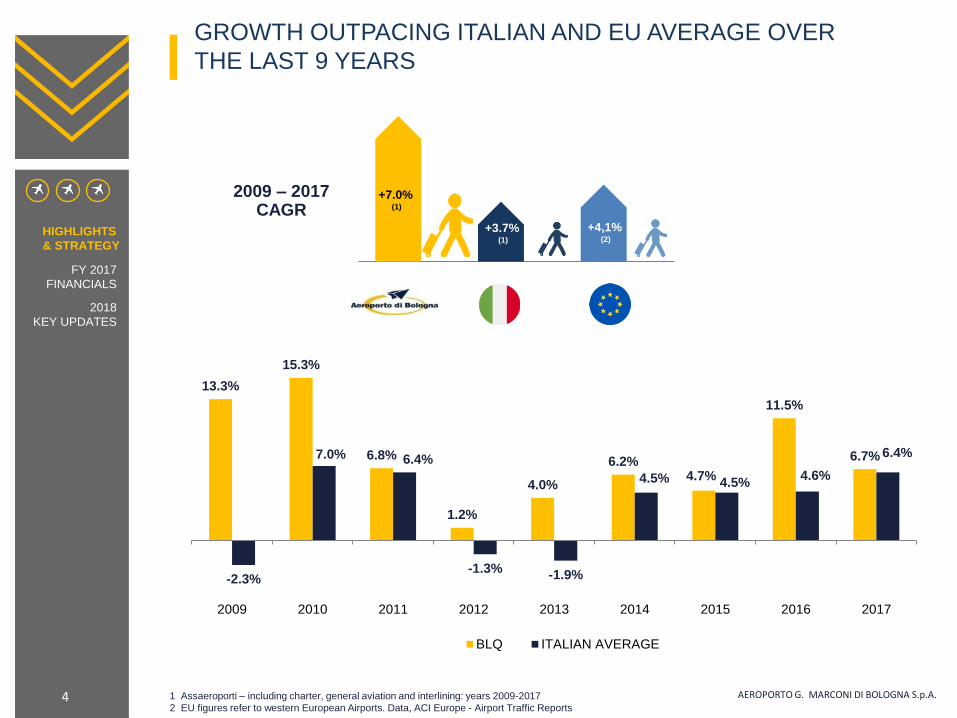
GROWTH OUTPACING ITALIAN AND EU AVERAGE OVER
THE LAST 9 YEARS
4 1 Assaeroporti – including charter, general aviation and interlining: years 2009-2017
2 EU figures refer to western European Airports. Data, ACI Europe - Airport Traffic Reports
+4,1% (2)
+3.7% (1)
+7.0%
(1)
2009 – 2017 CAGR
13.3%
15.3%
6.8%
1.2%
4.0%
6.2% 4.7%
11.5%
6.7%
-2.3%
7.0% 6.4%
-1.3% -1.9%
4.5% 4.5% 4.6%
6.4%
2009 2010 2011 2012 2013 2014 2015 2016 2017
BLQ ITALIAN AVERAGE
AEROPORTO G. MARCONI DI BOLOGNA S.p.A.
HIGHLIGHTS
& STRATEGY
FY 2017
FINANCIALS
2018
KEY UPDATES
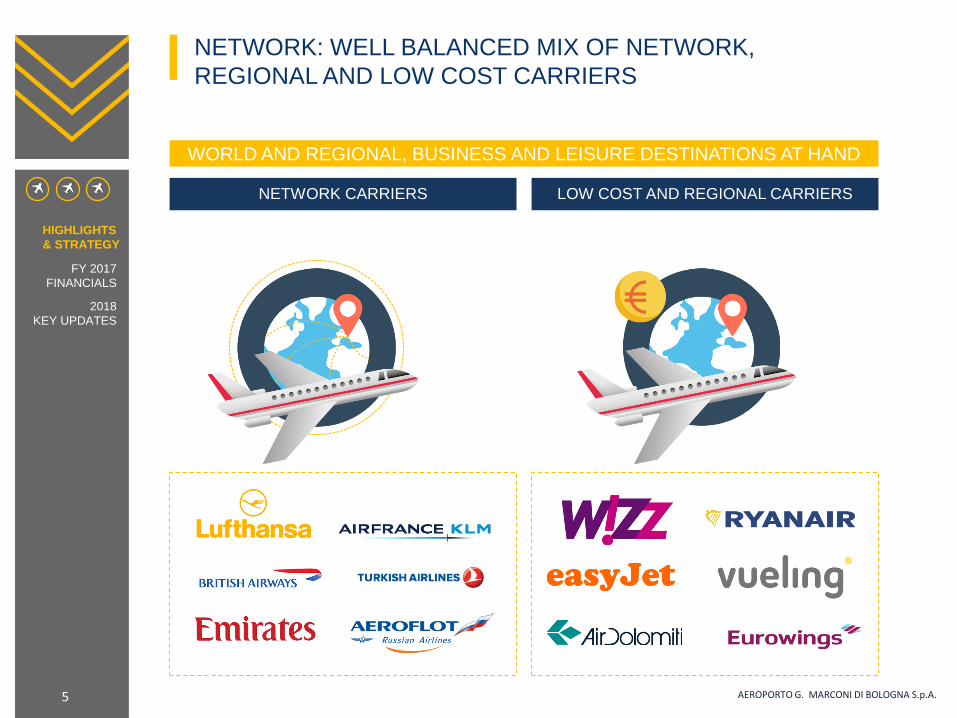
NETWORK: WELL BALANCED MIX OF NETWORK,
REGIONAL AND LOW COST CARRIERS
5
WORLD AND REGIONAL, BUSINESS AND LEISURE DESTINATIONS AT HAND
NETWORK CARRIERS LOW COST AND REGIONAL CARRIERS
AEROPORTO G. MARCONI DI BOLOGNA S.p.A.
HIGHLIGHTS
& STRATEGY
FY 2017
FINANCIALS
2018
KEY UPDATES

CATCHMENT AREA: BOLOGNA AIRPORT COMPETITIVE
POSITIONING
6 * BLQ passengers/Catchment area airports passengers. BLQ catchment includes airports within
200 Km ca. maximum distance: Ancona, Florence, Parma, Pisa, Treviso, Venice and Verona airports
** Assaeroporti data
-15.9%
0.5%
4.9%
5.7%
6.7%
7.8%
10.4%
14.4%
26.6%
Parma
Ancona
Pisa
Florence
Bologna
Venice
Verona
Treviso
Rimini
BOLOGNA CATCHMENT AREA:
VAR. % PASSENGERS FY 2017 vs FY 2016**
Catchment area traffic increased by 7.6% (+ 2.4 ml passengers) vs 2016
Growth driven by both domestic (+5.8%) and international traffic (+9.2%)
BLQ market share in the catchment area*: 24.5%
BOLOGNA
VENEZIA
TREVISO
PISA
VERONA
FIRENZE
PARMA
ANCONA
HIGHLIGHTS
& STRATEGY
AEROPORTO G. MARCONI DI BOLOGNA S.p.A.
FY 2017
FINANCIALS
2018
KEY UPDATES
RIMINI
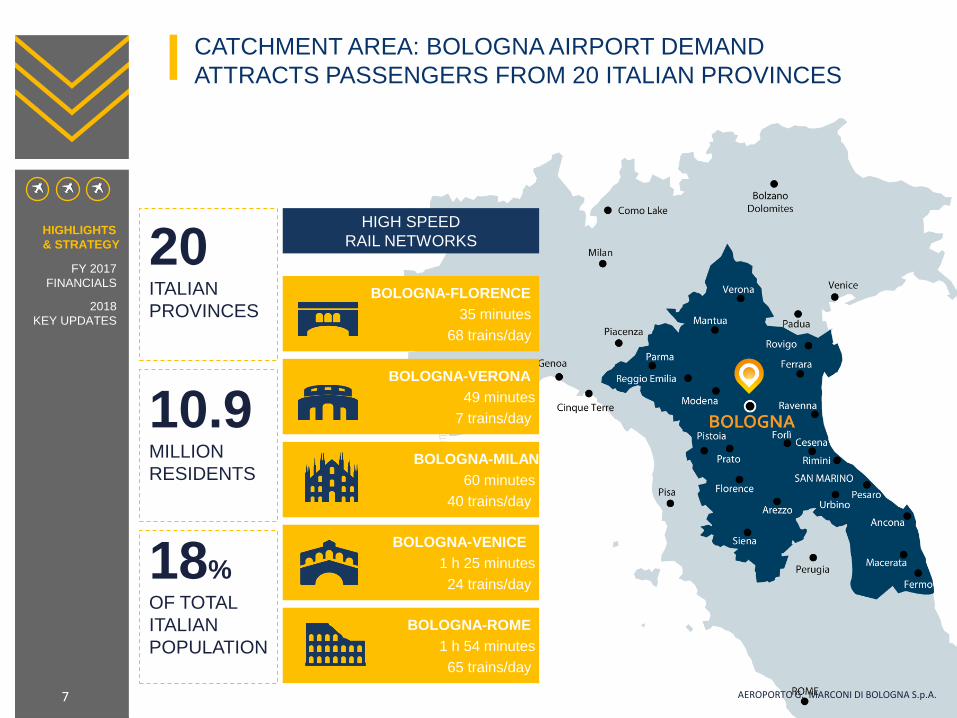
CATCHMENT AREA: BOLOGNA AIRPORT DEMAND
ATTRACTS PASSENGERS FROM 20 ITALIAN PROVINCES
7
20 ITALIAN
PROVINCES
10.9 MILLION
RESIDENTS
18% OF TOTAL
ITALIAN
POPULATION
AEROPORTO G. MARCONI DI BOLOGNA S.p.A.
HIGHLIGHTS
& STRATEGY
FY 2017
FINANCIALS
2018
KEY UPDATES
BOLOGNA-FLORENCE
35 minutes
68 trains/day
HIGH SPEED
RAIL NETWORKS
BOLOGNA-VERONA
49 minutes
7 trains/day
BOLOGNA-MILAN
60 minutes
40 trains/day
BOLOGNA-VENICE
1 h 25 minutes
24 trains/day
BOLOGNA-ROME
1 h 54 minutes
65 trains/day
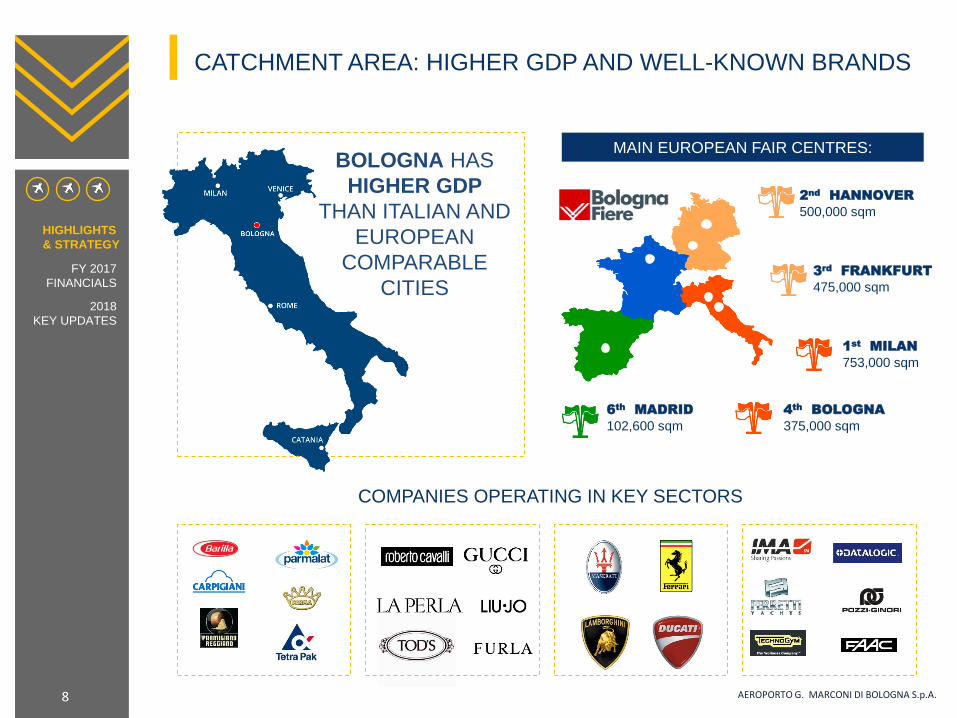
CATCHMENT AREA: HIGHER GDP AND WELL-KNOWN BRANDS
8
BOLOGNA HAS
HIGHER GDP
THAN ITALIAN AND
EUROPEAN
COMPARABLE
CITIES
MAIN EUROPEAN FAIR CENTRES:
3rd
FRANKFURT
475,000 sqm
4th
BOLOGNA
375,000 sqm
6th
MADRID
102,600 sqm
2nd
HANNOVER
500,000 sqm
1st
MILAN
753,000 sqm
COMPANIES OPERATING IN KEY SECTORS
AEROPORTO G. MARCONI DI BOLOGNA S.p.A.
HIGHLIGHTS
& STRATEGY
FY 2017
FINANCIALS
2018
KEY UPDATES

9
OUR STRATEGIC AMBITION
TO BE THE IDEAL GATEWAY FOR ITALY
The route development opportunities together with the ground transport network
expansion could make Bologna Airport an ideal air to ground gateway not only
for outgoing but also for incoming passengers and accessibility
AEROPORTO G. MARCONI DI BOLOGNA S.p.A.
HIGHLIGHTS
& STRATEGY
FY 2017
FINANCIALS
2018
KEY UPDATES

10
OUR LONG TERM APPROACH
Bologna Airport to be recognized by passengers as an ideal gateway thanks to its
rich destination network, the ease of access from the wider region and the high
quality of its facilities and services
TO ENHANCE CONNECTIVITY
AND CARE FOR A UNIQUE PASSENGER EXPERIENCE
AEROPORTO G. MARCONI DI BOLOGNA S.p.A.
HIGHLIGHTS
& STRATEGY
FY 2017
FINANCIALS
2018
KEY UPDATES
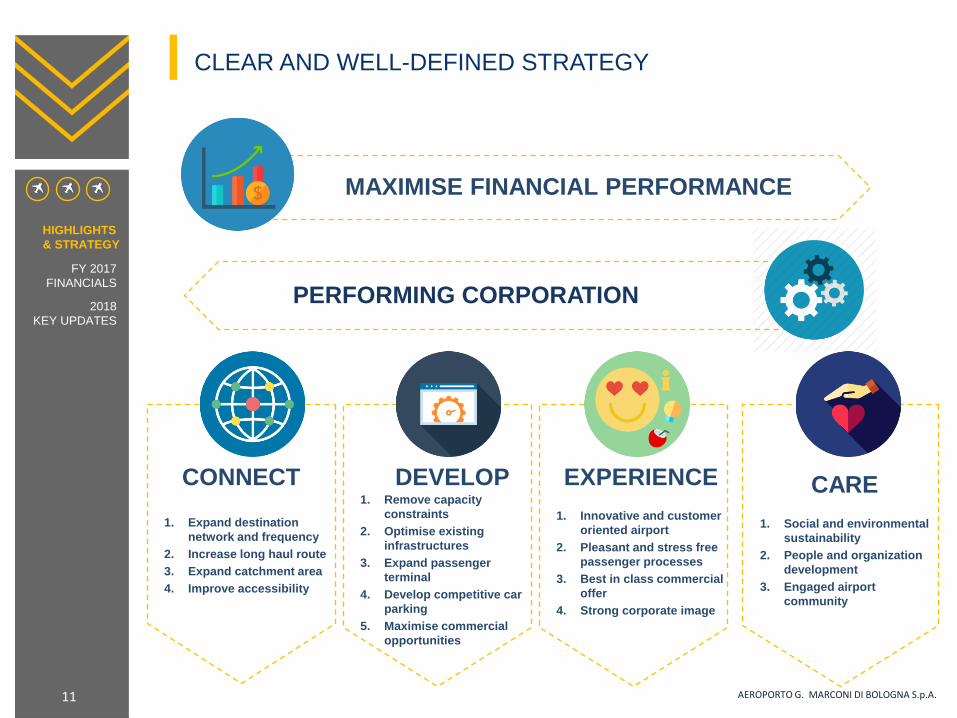
CLEAR AND WELL-DEFINED STRATEGY
11 AEROPORTO G. MARCONI DI BOLOGNA S.p.A.
HIGHLIGHTS
& STRATEGY
FY 2017
FINANCIALS
2018
KEY UPDATES
MAXIMISE FINANCIAL PERFORMANCE
PERFORMING CORPORATION
1. Expand destination
network and frequency
2. Increase long haul route
3. Expand catchment area
4. Improve accessibility
CONNECT 1. Remove capacity
constraints
2. Optimise existing
infrastructures
3. Expand passenger
terminal
4. Develop competitive car
parking
5. Maximise commercial
opportunities
DEVELOP
1. Innovative and customer
oriented airport
2. Pleasant and stress free
passenger processes
3. Best in class commercial
offer
4. Strong corporate image
EXPERIENCE
1. Social and environmental
sustainability
2. People and organization
development
3. Engaged airport
community
CARE
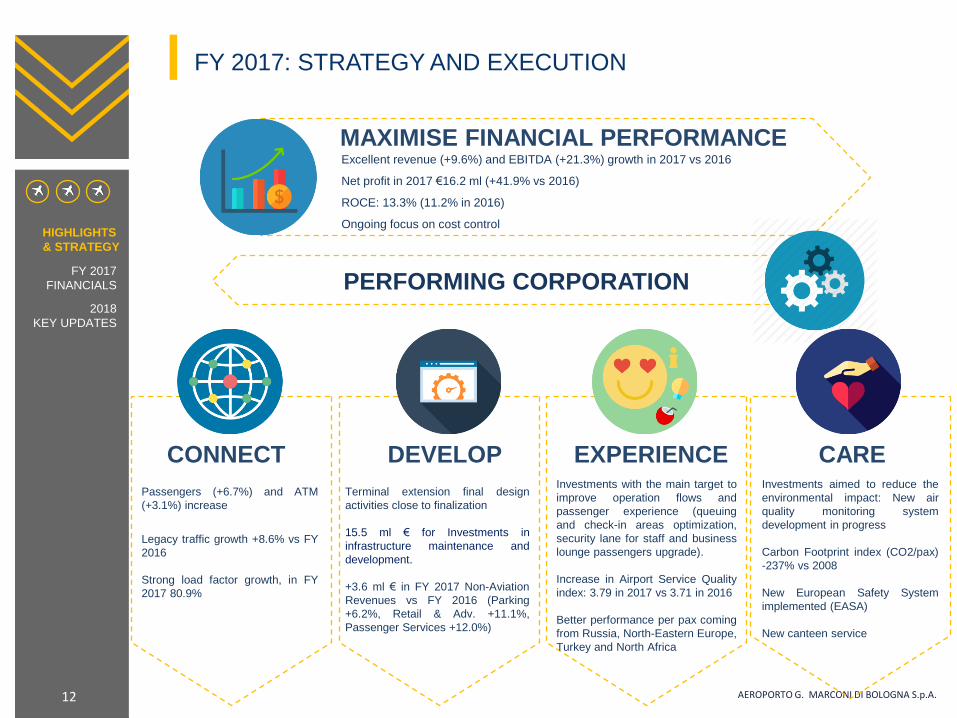
FY 2017: STRATEGY AND EXECUTION
12 AEROPORTO G. MARCONI DI BOLOGNA S.p.A.
Passengers (+6.7%) and ATM
(+3.1%) increase
Legacy traffic growth +8.6% vs FY
2016
Strong load factor growth, in FY
2017 80.9%
CONNECT DEVELOP EXPERIENCE CARE
Terminal extension final design
activities close to finalization
15.5 ml € for Investments in
infrastructure maintenance and
development.
+3.6 ml € in FY 2017 Non-Aviation
Revenues vs FY 2016 (Parking
+6.2%, Retail & Adv. +11.1%,
Passenger Services +12.0%)
Investments with the main target to
improve operation flows and
passenger experience (queuing
and check-in areas optimization,
security lane for staff and business
lounge passengers upgrade).
Increase in Airport Service Quality
index: 3.79 in 2017 vs 3.71 in 2016
Better performance per pax coming
from Russia, North-Eastern Europe,
Turkey and North Africa
Investments aimed to reduce the
environmental impact: New air
quality monitoring system
development in progress
Carbon Footprint index (CO2/pax)
-237% vs 2008
New European Safety System
implemented (EASA)
New canteen service
HIGHLIGHTS
& STRATEGY
FY 2017
FINANCIALS
2018
KEY UPDATES
MAXIMISE FINANCIAL PERFORMANCE Excellent revenue (+9.6%) and EBITDA (+21.3%) growth in 2017 vs 2016
Net profit in 2017 €16.2 ml (+41.9% vs 2016)
ROCE: 13.3% (11.2% in 2016)
Ongoing focus on cost control
PERFORMING CORPORATION

Aircraft: B767-300ER
8 Business + 259 Economy= 267seats
FIRST STEPS TOWARDS FUTURE DEVELOPMENT:
DIRECT FLIGHTS FROM CHINA TO BOLOGNA
13 AEROPORTO G. MARCONI DI BOLOGNA S.p.A.
STARTING 15TH JUNE 2018
HIGHLIGHTS
& STRATEGY
FY 2017
FINANCIALS
2018
KEY UPDATES

FIRST STEPS TOWARDS FUTURE DEVELOPMENT:
STRENGHTENING ACCESSIBILITY
14
Monorail connection
to Central Railway Station
Starting in 2019
Running time: 7 minutes
Bus connection
City Centre - Central Railway Station
Every 15 minutes
Running time: 15/20 minutes AEROPORTO G. MARCONI DI BOLOGNA S.p.A.
HIGHLIGHTS
& STRATEGY
FY 2017
FINANCIALS
2018
KEY UPDATES
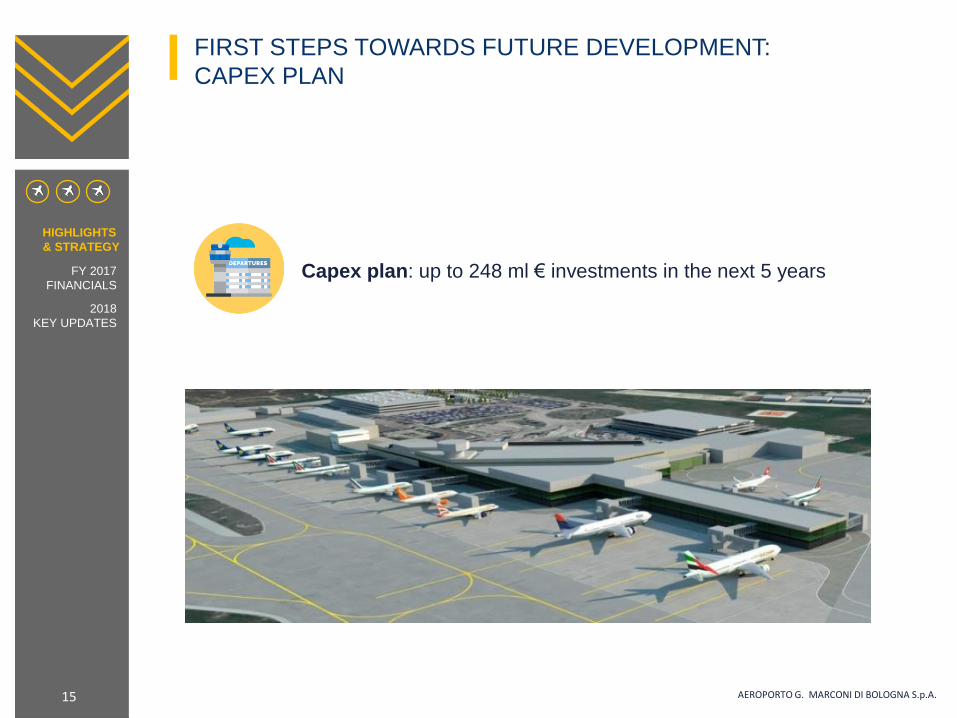
FIRST STEPS TOWARDS FUTURE DEVELOPMENT:
CAPEX PLAN
15
Capex plan: up to 248 ml € investments in the next 5 years
AEROPORTO G. MARCONI DI BOLOGNA S.p.A.
HIGHLIGHTS
& STRATEGY
FY 2017
FINANCIALS
2018
KEY UPDATES

16
EXPANSION
Departure area expansion on the 1st
floor (+24,000 sqm) to:
improve passengers flow
increase commercial area and offer
enhance customer experience
Update: Final design activities close to
finalization
FIRST STEPS TOWARDS FUTURE DEVELOPMENT:
TERMINAL EXPANSION PROJECT
AEROPORTO G. MARCONI DI BOLOGNA S.p.A.
HIGHLIGHTS
& STRATEGY
FY 2017
FINANCIALS
2018
KEY UPDATES

17
New multilevel parking construction to increase on site parking spaces
and meet passenger growth
Update: final design activities close to finalization
FIRST STEPS TOWARDS FUTURE DEVELOPMENT:
NEW MULTILEVEL PARKING
AEROPORTO G. MARCONI DI BOLOGNA S.p.A.
HIGHLIGHTS
& STRATEGY
FY 2017
FINANCIALS
2018
KEY UPDATES
18
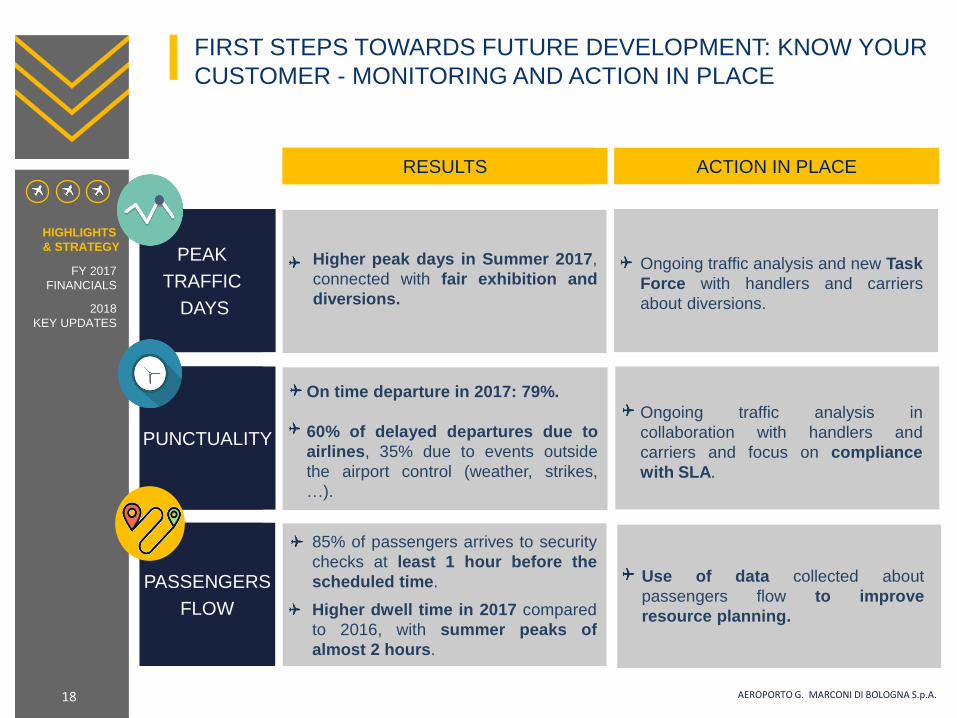
FIRST STEPS TOWARDS FUTURE DEVELOPMENT: KNOW YOUR
CUSTOMER - MONITORING AND ACTION IN PLACE
AEROPORTO G. MARCONI DI BOLOGNA S.p.A.
HIGHLIGHTS
& STRATEGY
FY 2017
FINANCIALS
2018
KEY UPDATES
PEAK
TRAFFIC
DAYS
Higher peak days in Summer 2017,
connected with fair exhibition and
diversions.
On time departure in 2017: 79%.
60% of delayed departures due to
airlines, 35% due to events outside
the airport control (weather, strikes,
…).
85% of passengers arrives to security
checks at least 1 hour before the
scheduled time.
Higher dwell time in 2017 compared
to 2016, with summer peaks of
almost 2 hours.
Ongoing traffic analysis and new Task
Force with handlers and carriers
about diversions.
RESULTS ACTION IN PLACE
PUNCTUALITY
Ongoing traffic analysis in
collaboration with handlers and
carriers and focus on compliance
with SLA.
PASSENGERS
FLOW
Use of data collected about
passengers flow to improve
resource planning.
19
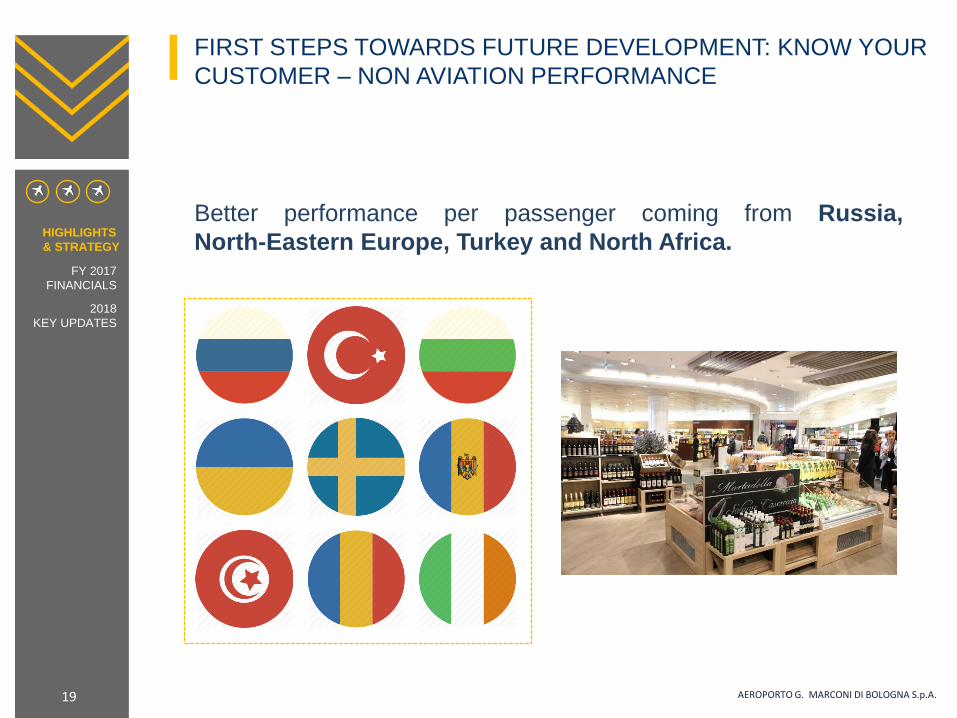
FIRST STEPS TOWARDS FUTURE DEVELOPMENT: KNOW YOUR
CUSTOMER – NON AVIATION PERFORMANCE
AEROPORTO G. MARCONI DI BOLOGNA S.p.A.
HIGHLIGHTS
& STRATEGY
FY 2017
FINANCIALS
2018
KEY UPDATES
Better performance per passenger coming from Russia,
North-Eastern Europe, Turkey and North Africa.

MONITORING OF QUALITY SERVICES AND
PASSENGER EXPERIENCE
20
SERVICE QUALITY CUSTOMER SATISFACTION INDEX
Customer Satisfaction Index:
ENAC (Italian Civil Aviation Authority) indicators
(Carta dei Servizi)
comparison with Italian regional airports
focus on airport services performance
Airport Service Quality:
ACI World Airport Council International
panel includes more than 250 airports worldwide
focus on airport passenger experience
AIRPORT SERVICE QUALITY
AEROPORTO G. MARCONI DI BOLOGNA S.p.A.
98.4% 97.0%
FY 2016 FY 2017
3.71 3.79
FY 2016 FY 2017
HIGHLIGHTS
& STRATEGY
FY 2017
FINANCIALS
2018
KEY UPDATES

THE PAX GROWTH MULTIPLIER EFFECT
21 AEROPORTO G. MARCONI DI BOLOGNA S.p.A.
PASSENGERS AND PROFITABILITY (VAR% FY 17/16)
FY 2017 8.2 ml
PAX
21.3% 6.7%
€ 99.1 ml
REVENUES
€ 34.2 ml
EBITDA
FY 2017 60% 40%
GROUP REVENUES BREAKDOWN SBU AVIATION SBU NON AVIATION
FY 2016 60% 40%
GROWTH DRIVEN BY INCREASE IN PAX VOLUMES, TRAFFIC MIX, IMPROVEMENT
OF AVIATION PROFITABILITY, DEVELOPMENT OF NON-AVIATION BUSINESS
AND EFFECTIVE COST CONTROL
41.9%
€ 16.2 ml
NET PROFIT
HIGHLIGHTS
& STRATEGY
9.6%
FY 2017
FINANCIALS
2018
KEY UPDATES

22
FY 2017
FINANCIALS
AEROPORTO G. MARCONI DI BOLOGNA S.p.A.
FY 2017
FINANCIALS
2018
KEY UPDATES
HIGHLIGHTS
& STRATEGY
23
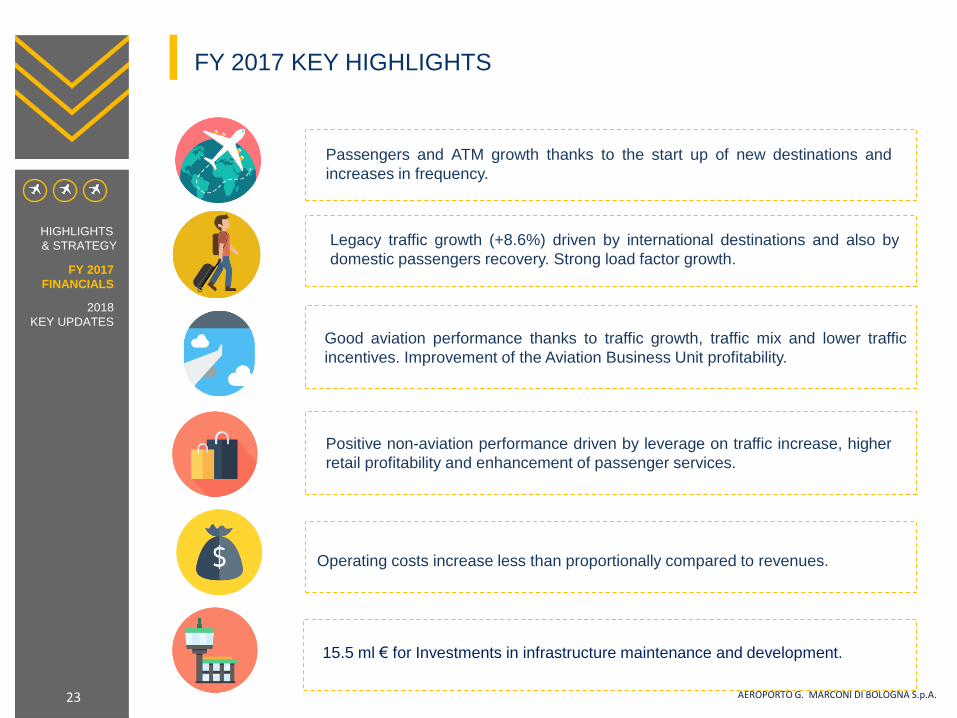
FY 2017 KEY HIGHLIGHTS
AEROPORTO G. MARCONI DI BOLOGNA S.p.A.
FY 2017
FINANCIALS
2018
KEY UPDATES
HIGHLIGHTS
& STRATEGY
Passengers and ATM growth thanks to the start up of new destinations and
increases in frequency.
Legacy traffic growth (+8.6%) driven by international destinations and also by
domestic passengers recovery. Strong load factor growth.
Good aviation performance thanks to traffic growth, traffic mix and lower traffic
incentives. Improvement of the Aviation Business Unit profitability.
Positive non-aviation performance driven by leverage on traffic increase, higher
retail profitability and enhancement of passenger services.
Operating costs increase less than proportionally compared to revenues.
15.5 ml € for Investments in infrastructure maintenance and development.
24
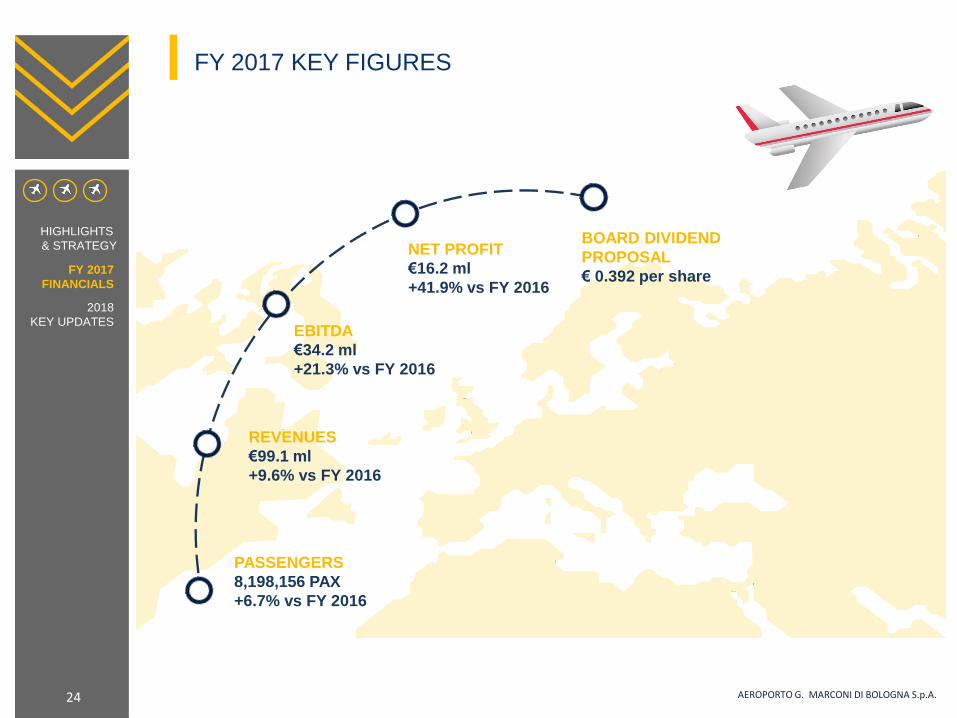
FY 2017 KEY FIGURES
AEROPORTO G. MARCONI DI BOLOGNA S.p.A.
FY 2017
FINANCIALS
2018
KEY UPDATES
HIGHLIGHTS
& STRATEGY
PASSENGERS
8,198,156 PAX
+6.7% vs FY 2016
REVENUES
€99.1 ml
+9.6% vs FY 2016
EBITDA
€34.2 ml
+21.3% vs FY 2016
NET PROFIT
€16.2 ml
+41.9% vs FY 2016
BOARD DIVIDEND
PROPOSAL
€ 0.392 per share
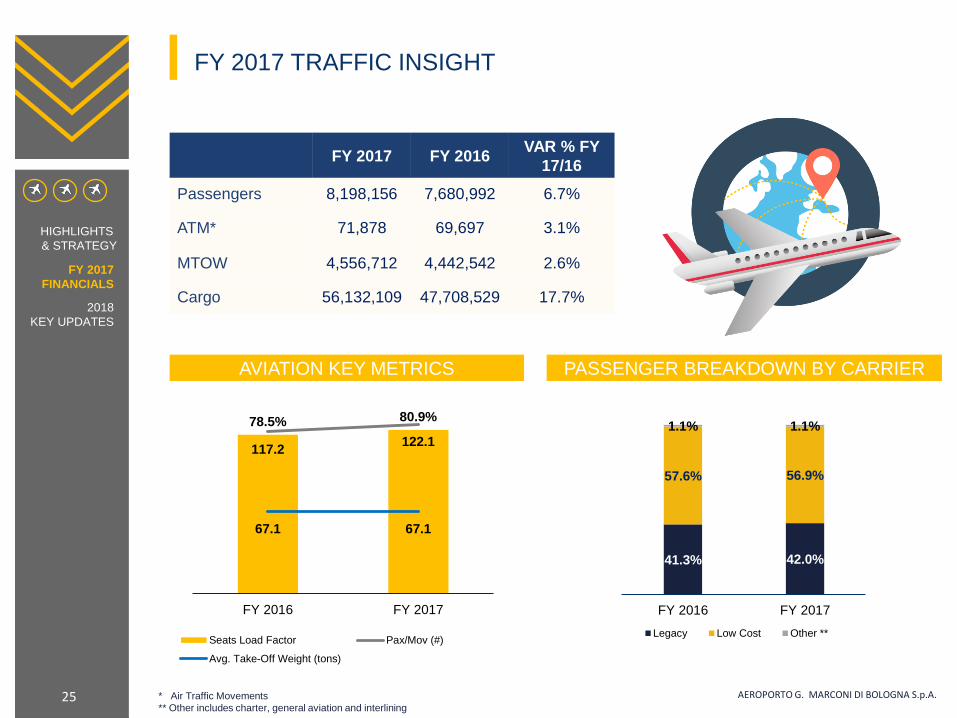
FY 2017 TRAFFIC INSIGHT
25 * Air Traffic Movements
** Other includes charter, general aviation and interlining
AEROPORTO G. MARCONI DI BOLOGNA S.p.A.
FY 2017 FY 2016 VAR % FY
17/16
Passengers 8,198,156 7,680,992 6.7%
ATM* 71,878 69,697 3.1%
MTOW 4,556,712 4,442,542 2.6%
Cargo 56,132,109 47,708,529 17.7%
AVIATION KEY METRICS PASSENGER BREAKDOWN BY CARRIER
41.3% 42.0%
57.6% 56.9%
1.1% 1.1%
FY 2016 FY 2017
Legacy Low Cost Other **
78.5% 80.9%
117.2 122.1
67.1 67.1
FY 2016 FY 2017
Seats Load Factor Pax/Mov (#)
Avg. Take-Off Weight (tons)
FY 2017
FINANCIALS
2018
KEY UPDATES
HIGHLIGHTS
& STRATEGY
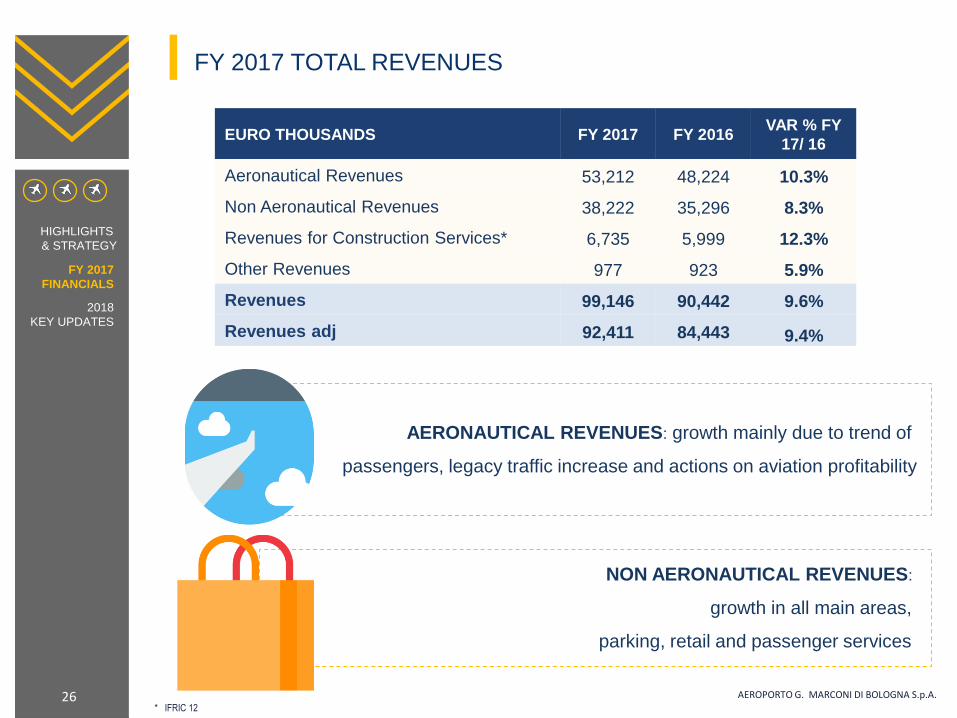
FY 2017 TOTAL REVENUES
26
AERONAUTICAL REVENUES: growth mainly due to trend of
passengers, legacy traffic increase and actions on aviation profitability
NON AERONAUTICAL REVENUES:
growth in all main areas,
parking, retail and passenger services
* IFRIC 12
AEROPORTO G. MARCONI DI BOLOGNA S.p.A.
FY 2017
FINANCIALS
2018
KEY UPDATES
HIGHLIGHTS
& STRATEGY
EURO THOUSANDS FY 2017 FY 2016 VAR % FY
17/ 16
Aeronautical Revenues 53,212 48,224 10.3%
Non Aeronautical Revenues 38,222 35,296 8.3%
Revenues for Construction Services* 6,735 5,999 12.3%
Other Revenues 977 923 5.9%
Revenues 99,146 90,442 9.6%
Revenues adj 92,411 84,443 9.4%

AVIATION AND NON-AVIATION BUSINESS
27
REVENUES BREAKDOWN (%) EBITDA BREAKDOWN (%)
AEROPORTO G. MARCONI DI BOLOGNA S.p.A.
60%
40% 34%
66%
AVIATION NON AVIATION
60%
40% 41% 59% FY 2017
FY 2016
FY 2017
FINANCIALS
2018
KEY UPDATES
HIGHLIGHTS
& STRATEGY
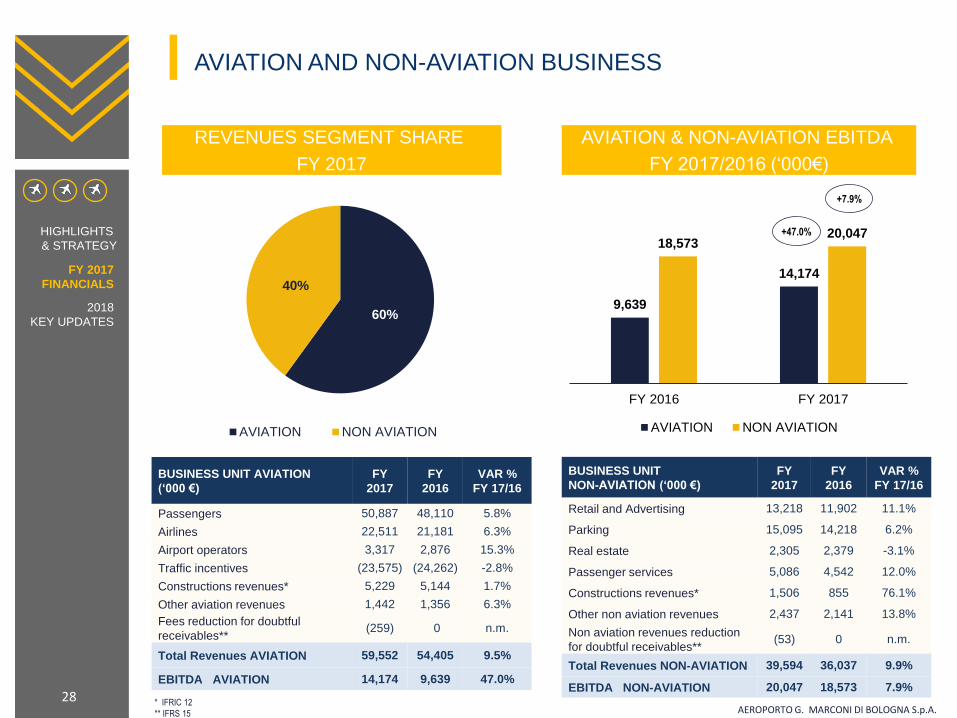
AVIATION AND NON-AVIATION BUSINESS
28 * IFRIC 12
** IFRS 15 AEROPORTO G. MARCONI DI BOLOGNA S.p.A.
9,639
14,174
18,573 20,047
FY 2016 FY 2017
AVIATION NON AVIATION
REVENUES SEGMENT SHARE
FY 2017
60%
40%
AVIATION NON AVIATION
AVIATION & NON-AVIATION EBITDA
FY 2017/2016 (‘000€)
+47.0%
+7.9%
FY 2017
FINANCIALS
2018
KEY UPDATES
HIGHLIGHTS
& STRATEGY
BUSINESS UNIT AVIATION
(‘000 €)
FY
2017
FY
2016
VAR %
FY 17/16
Passengers 50,887 48,110 5.8%
Airlines 22,511 21,181 6.3%
Airport operators 3,317 2,876 15.3%
Traffic incentives (23,575) (24,262) -2.8%
Constructions revenues* 5,229 5,144 1.7%
Other aviation revenues 1,442 1,356 6.3%
Fees reduction for doubtful
receivables** (259) 0 n.m.
Total Revenues AVIATION 59,552 54,405 9.5%
EBITDA AVIATION 14,174 9,639 47.0%
BUSINESS UNIT
NON-AVIATION (‘000 €)
FY
2017
FY
2016
VAR %
FY 17/16
Retail and Advertising 13,218 11,902 11.1%
Parking 15,095 14,218 6.2%
Real estate 2,305 2,379 -3.1%
Passenger services 5,086 4,542 12.0%
Constructions revenues* 1,506 855 76.1%
Other non aviation revenues 2,437 2,141 13.8%
Non aviation revenues reduction
for doubtful receivables** (53) 0 n.m.
Total Revenues NON-AVIATION 39,594 36,037 9.9%
EBITDA NON-AVIATION 20,047 18,573 7.9%
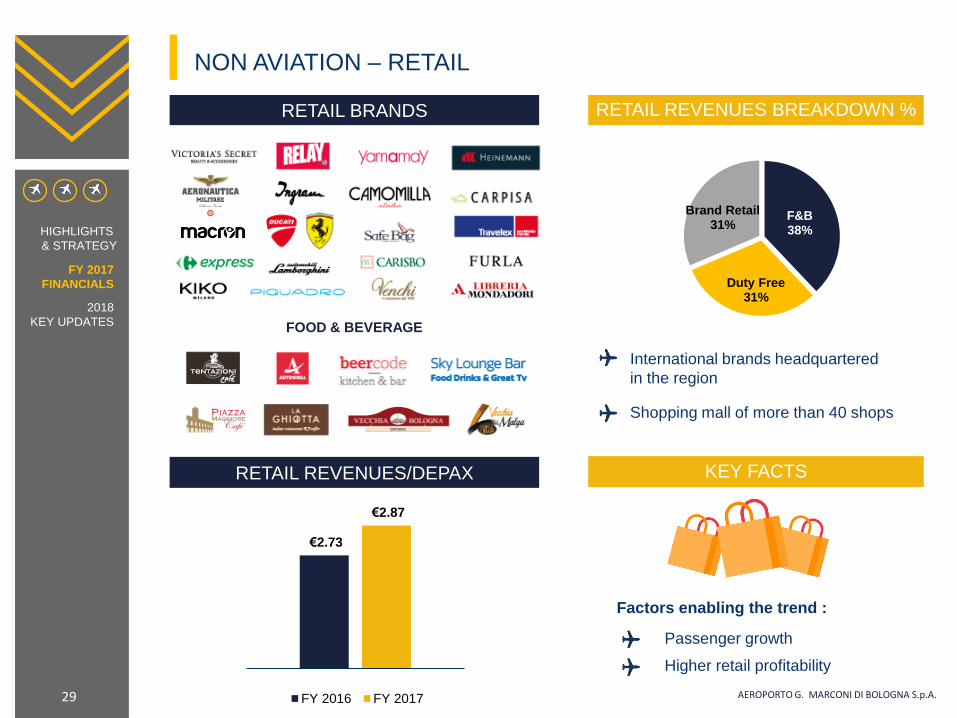
NON AVIATION – RETAIL
29
RETAIL REVENUES BREAKDOWN %
International brands headquartered
in the region
Shopping mall of more than 40 shops
RETAIL REVENUES/DEPAX KEY FACTS
RETAIL BRANDS
Factors enabling the trend :
Passenger growth
Higher retail profitability
FOOD & BEVERAGE
F&B 38%
Duty Free 31%
Brand Retail 31%
AEROPORTO G. MARCONI DI BOLOGNA S.p.A.
€2.73
€2.87
FY 2016 FY 2017
FY 2017
FINANCIALS
2018
KEY UPDATES
HIGHLIGHTS
& STRATEGY

NON AVIATION – PARKING
30
CAR PARKING REVENUES PARKING LAYOUT
Parking revenues: top tier at EU level
5,400 car parking spaces
Revenues management system, electronic charge
payment devices, booking and ticketing through web site
PARKING REVENUES/DEPAX KEY FACTS
Factors enabling the trend:
Passenger growth
Opening of a new car parking area
Remote parking
8%
On site parking
92%
AEROPORTO G. MARCONI DI BOLOGNA S.p.A.
€3.70 €3.69
FY 2016 FY 2017
FY 2017
FINANCIALS
2018
KEY UPDATES
HIGHLIGHTS
& STRATEGY
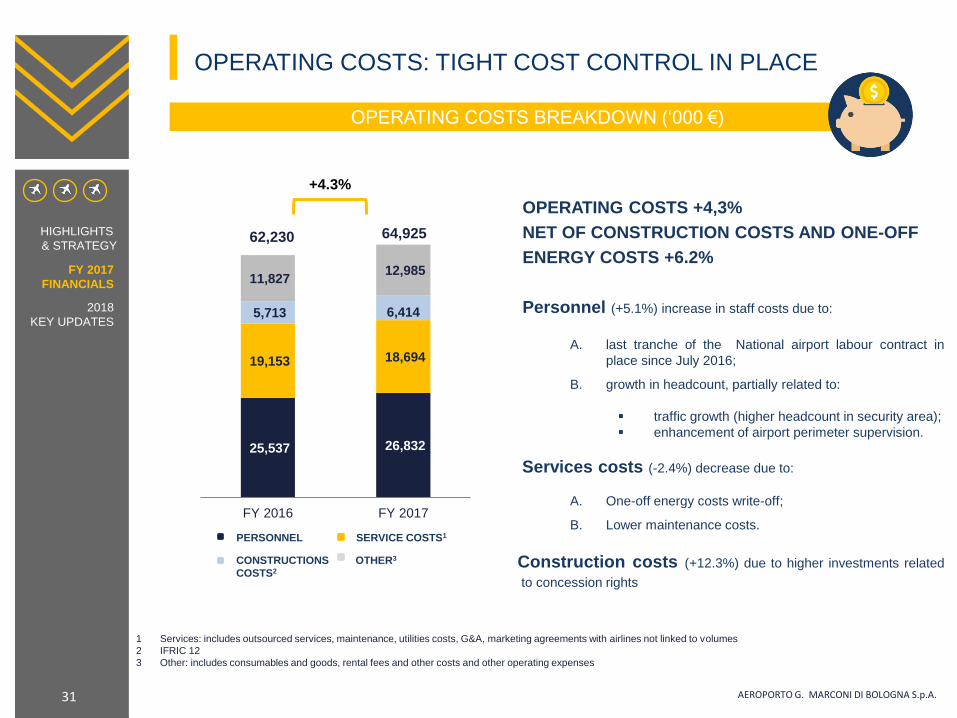
OPERATING COSTS: TIGHT COST CONTROL IN PLACE
31
1 Services: includes outsourced services, maintenance, utilities costs, G&A, marketing agreements with airlines not linked to volumes
2 IFRIC 12
3 Other: includes consumables and goods, rental fees and other costs and other operating expenses
AEROPORTO G. MARCONI DI BOLOGNA S.p.A.
OPERATING COSTS BREAKDOWN (‘000 €)
OPERATING COSTS +4,3%
NET OF CONSTRUCTION COSTS AND ONE-OFF
ENERGY COSTS +6.2%
Personnel (+5.1%) increase in staff costs due to:
A. last tranche of the National airport labour contract in
place since July 2016;
B. growth in headcount, partially related to:
traffic growth (higher headcount in security area);
enhancement of airport perimeter supervision.
Services costs (-2.4%) decrease due to:
A. One-off energy costs write-off;
B. Lower maintenance costs.
Construction costs (+12.3%) due to higher investments related
to concession rights
64,925 62,230
PERSONNEL SERVICE COSTS1
CONSTRUCTIONS
COSTS2
OTHER3
+4.3%
FY 2017
FINANCIALS
2018
KEY UPDATES
HIGHLIGHTS
& STRATEGY
25,537 26,832
19,153 18,694
5,713 6,414
11,827 12,985
FY 2016 FY 2017
EBITDA
32 1 IFRIC 12
2 Services: includes outsourced services, maintenance, utilities costs, G&A, marketing agreements with airlines not linked to volumes.
3 Other: includes consumables and goods, rental fees and other costs and other operating expenses. AEROPORTO G. MARCONI DI BOLOGNA S.p.A.
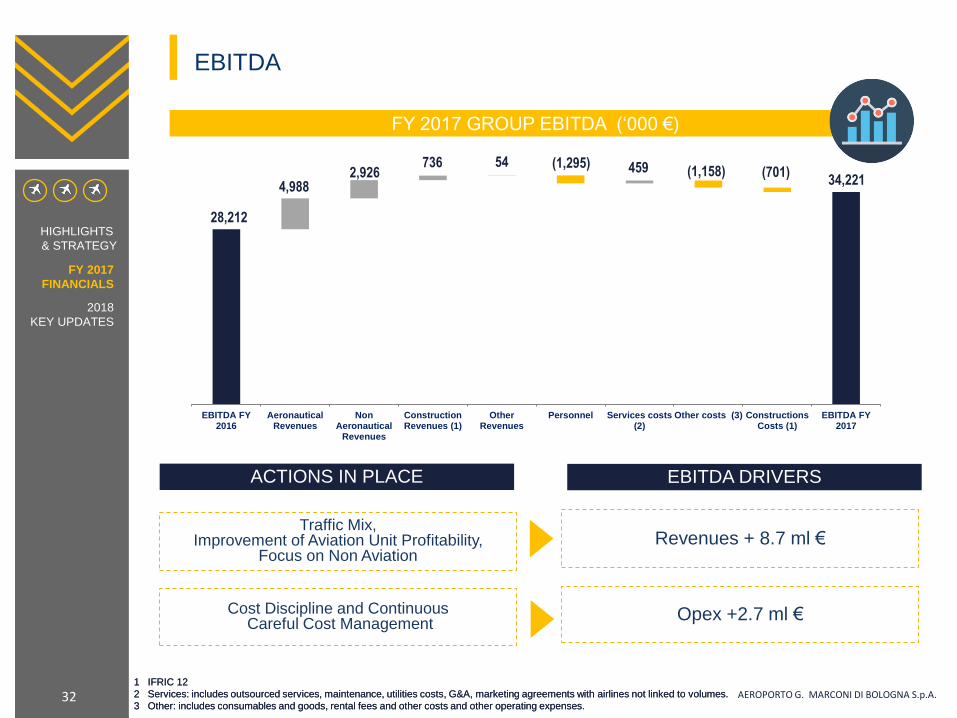
FY 2017 GROUP EBITDA (‘000 €)
Revenues + 8.7 ml € Traffic Mix,
Improvement of Aviation Unit Profitability, Focus on Non Aviation
Opex +2.7 ml € Cost Discipline and Continuous Careful Cost Management
EBITDA DRIVERS ACTIONS IN PLACE
1 IFRIC 12
2 Services: includes outsourced services, maintenance, utilities costs, G&A, marketing agreements with airlines not linked to volumes.
3 Other: includes consumables and goods, rental fees and other costs and other operating expenses.
FY 2017
FINANCIALS
2018
KEY UPDATES
HIGHLIGHTS
& STRATEGY
34,221
28,212
4,988 2,926
736 54 (1,295) 459 (1,158) (701)
EBITDA FY2016
AeronauticalRevenues
NonAeronautical
Revenues
ConstructionRevenues (1)
OtherRevenues
Personnel Services costs(2)
Other costs (3) ConstructionsCosts (1)
EBITDA FY2017
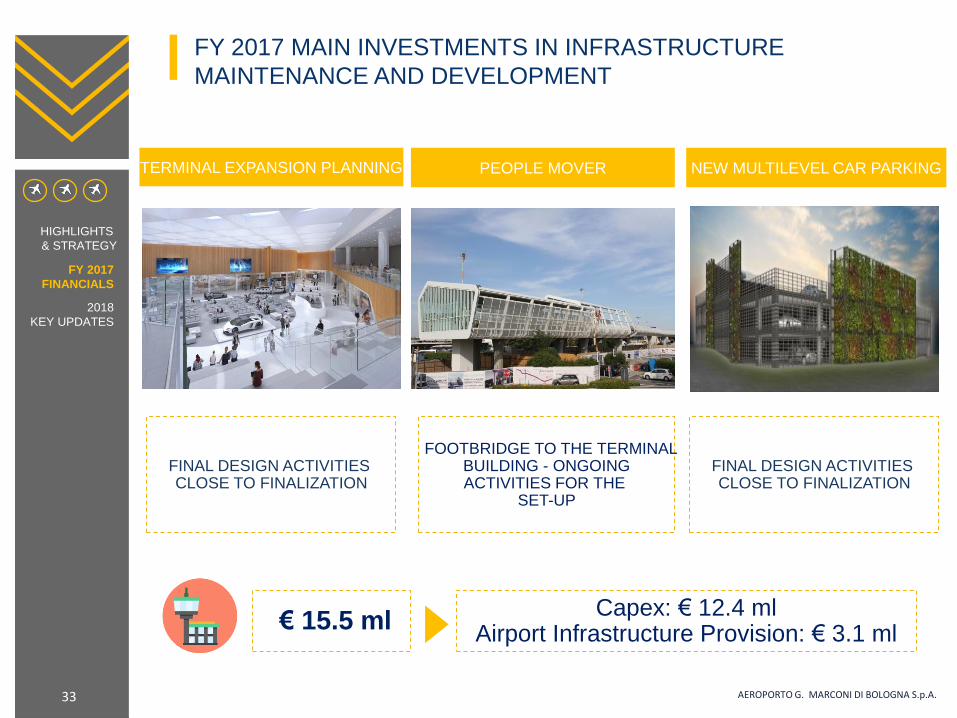
FY 2017 MAIN INVESTMENTS IN INFRASTRUCTURE
MAINTENANCE AND DEVELOPMENT
33 AEROPORTO G. MARCONI DI BOLOGNA S.p.A.
TERMINAL EXPANSION PLANNING PEOPLE MOVER
Capex: € 12.4 ml Airport Infrastructure Provision: € 3.1 ml
€ 15.5 ml
NEW MULTILEVEL CAR PARKING
FINAL DESIGN ACTIVITIES CLOSE TO FINALIZATION
FOOTBRIDGE TO THE TERMINAL BUILDING - ONGOING ACTIVITIES FOR THE
SET-UP
FINAL DESIGN ACTIVITIES CLOSE TO FINALIZATION
FY 2017
FINANCIALS
2018
KEY UPDATES
HIGHLIGHTS
& STRATEGY
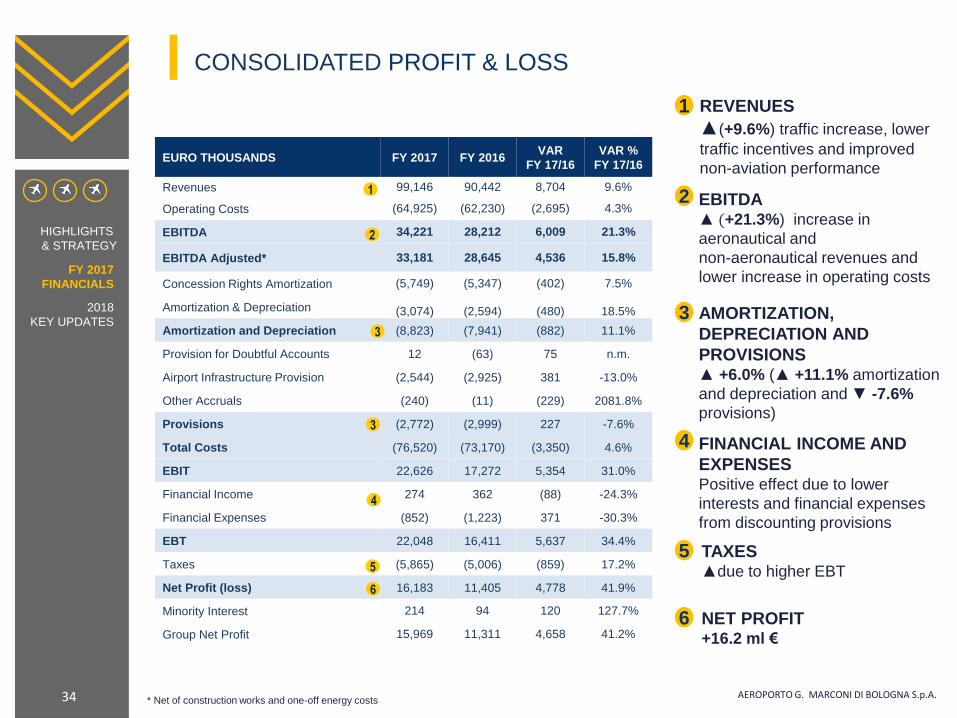
CONSOLIDATED PROFIT & LOSS
34 * Net of construction works and one-off energy costs AEROPORTO G. MARCONI DI BOLOGNA S.p.A.
REVENUES
▲(+9.6%) traffic increase, lower
traffic incentives and improved
non-aviation performance
1
EBITDA ▲ (+21.3%) increase in
aeronautical and
non-aeronautical revenues and
lower increase in operating costs
AMORTIZATION,
DEPRECIATION AND
PROVISIONS ▲ +6.0% (▲ +11.1% amortization
and depreciation and ▼ -7.6%
provisions)
FINANCIAL INCOME AND
EXPENSES Positive effect due to lower
interests and financial expenses
from discounting provisions
TAXES ▲due to higher EBT
NET PROFIT +16.2 ml €
2
3
4
5
6
FY 2017
FINANCIALS
2018
KEY UPDATES
HIGHLIGHTS
& STRATEGY
EURO THOUSANDS FY 2017 FY 2016 VAR
FY 17/16
VAR %
FY 17/16
Revenues 99,146 90,442 8,704 9.6%
Operating Costs (64,925) (62,230) (2,695) 4.3%
EBITDA 34,221 28,212 6,009 21.3%
EBITDA Adjusted* 33,181 28,645 4,536 15.8%
Concession Rights Amortization (5,749) (5,347) (402) 7.5%
Amortization & Depreciation (3,074) (2,594) (480) 18.5%
Amortization and Depreciation (8,823) (7,941) (882) 11.1%
Provision for Doubtful Accounts 12 (63) 75 n.m.
Airport Infrastructure Provision (2,544) (2,925) 381 -13.0%
Other Accruals (240) (11) (229) 2081.8%
Provisions (2,772) (2,999) 227 -7.6%
Total Costs (76,520) (73,170) (3,350) 4.6%
EBIT 22,626 17,272 5,354 31.0%
Financial Income 274 362 (88) -24.3%
Financial Expenses (852) (1,223) 371 -30.3%
EBT 22,048 16,411 5,637 34.4%
Taxes (5,865) (5,006) (859) 17.2%
Net Profit (loss) 16,183 11,405 4,778 41.9%
Minority Interest 214 94 120 127.7%
Group Net Profit 15,969 11,311 4,658 41.2%
1
2
3
4
5
6
3
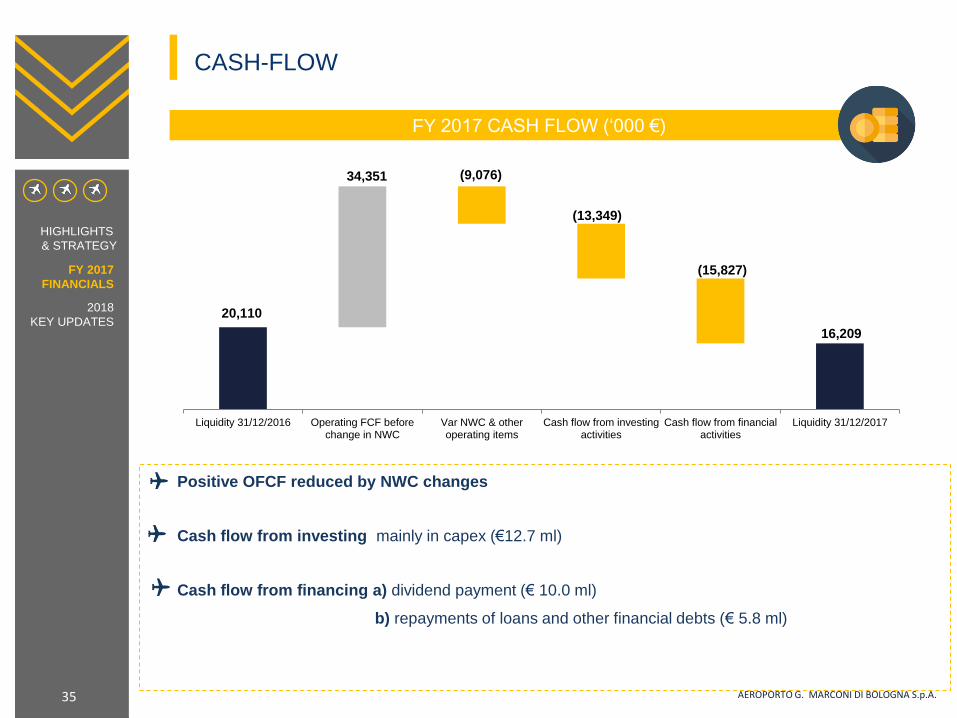
CASH-FLOW
35
FY 2017 CASH FLOW (‘000 €)
Positive OFCF reduced by NWC changes
Cash flow from investing mainly in capex (€12.7 ml)
Cash flow from financing a) dividend payment (€ 10.0 ml)
b) repayments of loans and other financial debts (€ 5.8 ml)
AEROPORTO G. MARCONI DI BOLOGNA S.p.A.
FY 2017
FINANCIALS
2018
KEY UPDATES
HIGHLIGHTS
& STRATEGY
16,209
20,110
34,351 (9,076)
(13,349)
(15,827)
Liquidity 31/12/2016 Operating FCF beforechange in NWC
Var NWC & otheroperating items
Cash flow from investingactivities
Cash flow from financialactivities
Liquidity 31/12/2017
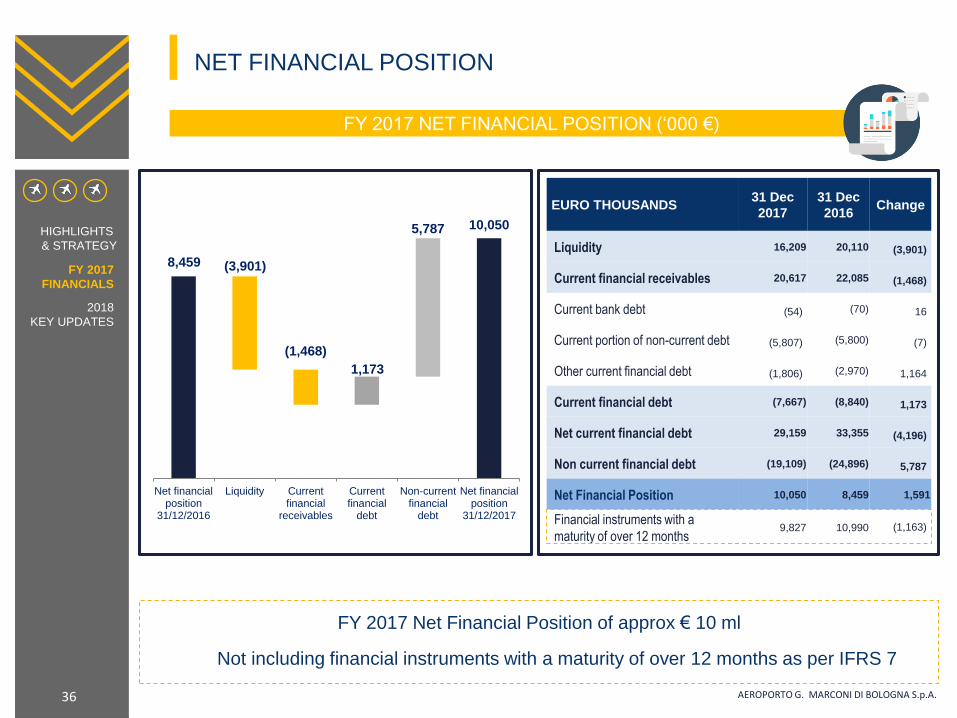
NET FINANCIAL POSITION
36
FY 2017 NET FINANCIAL POSITION (‘000 €)
FY 2017 Net Financial Position of approx € 10 ml
Not including financial instruments with a maturity of over 12 months as per IFRS 7
AEROPORTO G. MARCONI DI BOLOGNA S.p.A.
FY 2017
FINANCIALS
2018
KEY UPDATES
HIGHLIGHTS
& STRATEGY
10,050
8,459 (3,901)
(1,468)
1,173
5,787
Net financialposition
31/12/2016
Liquidity Currentfinancial
receivables
Currentfinancial
debt
Non-currentfinancial
debt
Net financialposition
31/12/2017
EURO THOUSANDS 31 Dec
2017
31 Dec
2016 Change
Liquidity 16,209 20,110 (3,901)
Current financial receivables 20,617 22,085 (1,468)
Current bank debt (54) (70) 16
Current portion of non-current debt (5,807) (5,800) (7)
Other current financial debt (1,806) (2,970) 1,164
Current financial debt (7,667) (8,840) 1,173
Net current financial debt 29,159 33,355 (4,196)
Non current financial debt (19,109) (24,896) 5,787
Net Financial Position 10,050 8,459 1,591
Financial instruments with a
maturity of over 12 months 9,827 10,990 (1,163)
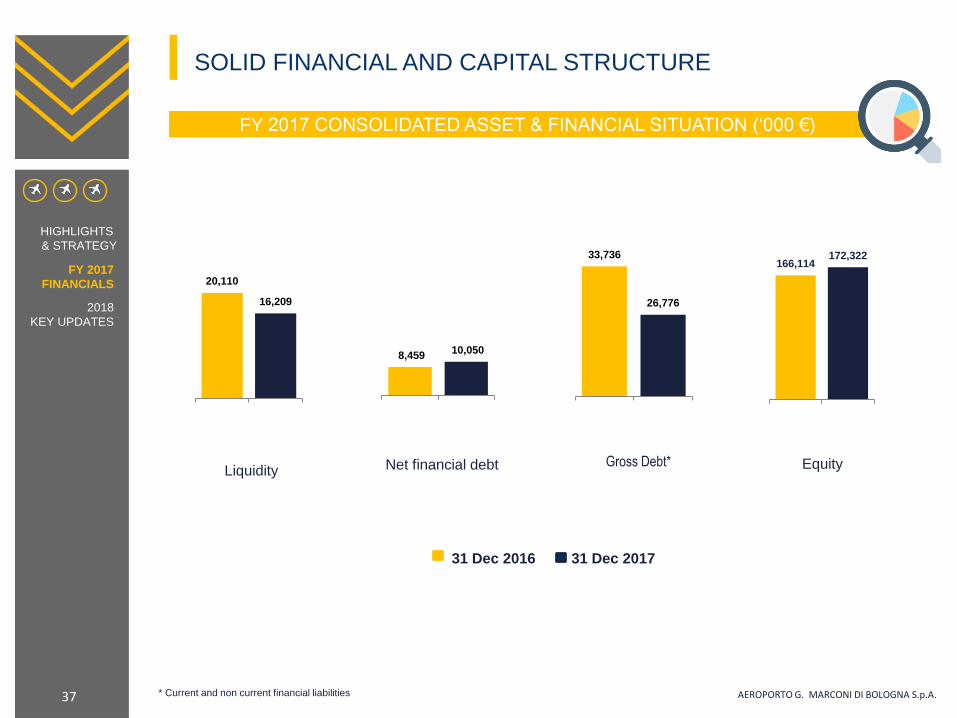
SOLID FINANCIAL AND CAPITAL STRUCTURE
37
FY 2017 CONSOLIDATED ASSET & FINANCIAL SITUATION (‘000 €)
* Current and non current financial liabilities
31 Dec 2016 31 Dec 2017
AEROPORTO G. MARCONI DI BOLOGNA S.p.A.
FY 2017
FINANCIALS
2018
KEY UPDATES
HIGHLIGHTS
& STRATEGY 33,736
26,776
1 2
Gross Debt*
20,110
16,209
31 Dec2016
31 Dec2017
Liquidity
166,114
172,322
1 2
Equity
8,459 10,050
31 Dec2016
31 Dec2017
Net financial debt
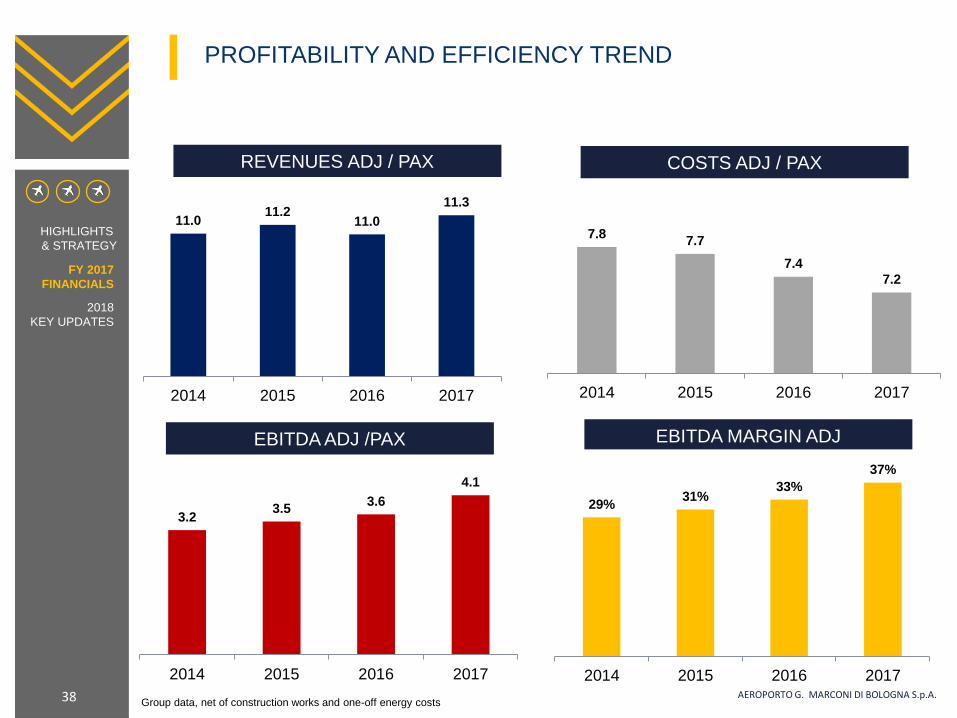
7.8 7.7
7.4
7.2
2014 2015 2016 2017
11.0 11.2
11.0
11.3
2014 2015 2016 2017
38
PROFITABILITY AND EFFICIENCY TREND
REVENUES ADJ / PAX
EBITDA ADJ /PAX EBITDA MARGIN ADJ
COSTS ADJ / PAX
3.2 3.5
3.6
4.1
2014 2015 2016 2017
29% 31%
33%
37%
2014 2015 2016 2017
Group data, net of construction works and one-off energy costs
AEROPORTO G. MARCONI DI BOLOGNA S.p.A.
FY 2017
FINANCIALS
2018
KEY UPDATES
HIGHLIGHTS
& STRATEGY
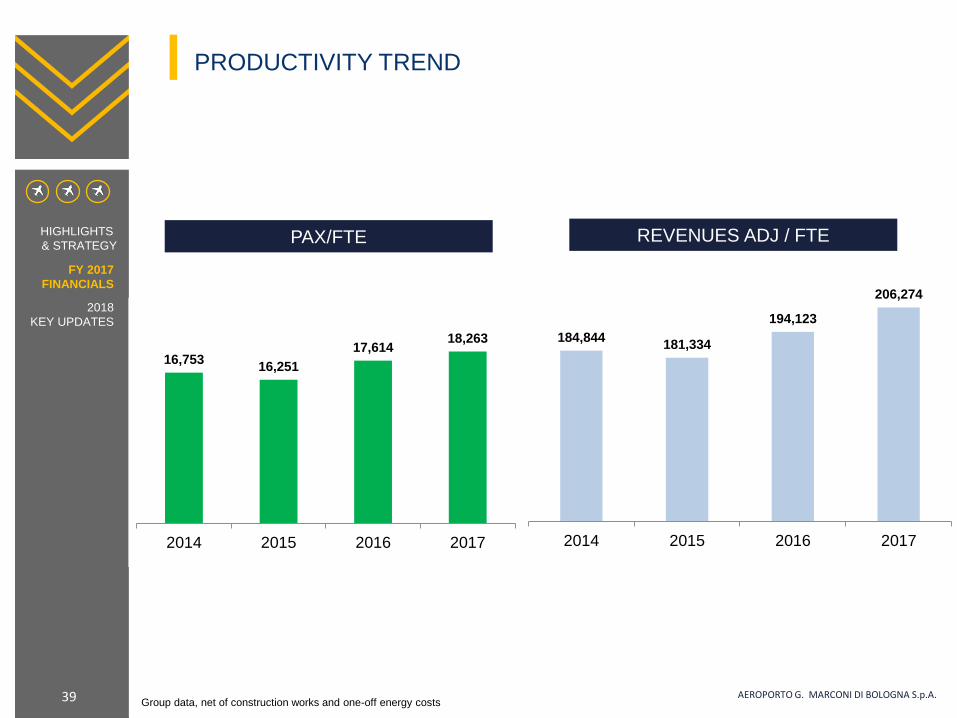
39
PRODUCTIVITY TREND
AEROPORTO G. MARCONI DI BOLOGNA S.p.A. Group data, net of construction works and one-off energy costs
PAX/FTE REVENUES ADJ / FTE
16,753 16,251
17,614 18,263
2014 2015 2016 2017
184,844 181,334
194,123
206,274
2014 2015 2016 2017
FY 2017
FINANCIALS
2018
KEY UPDATES
HIGHLIGHTS
& STRATEGY
40
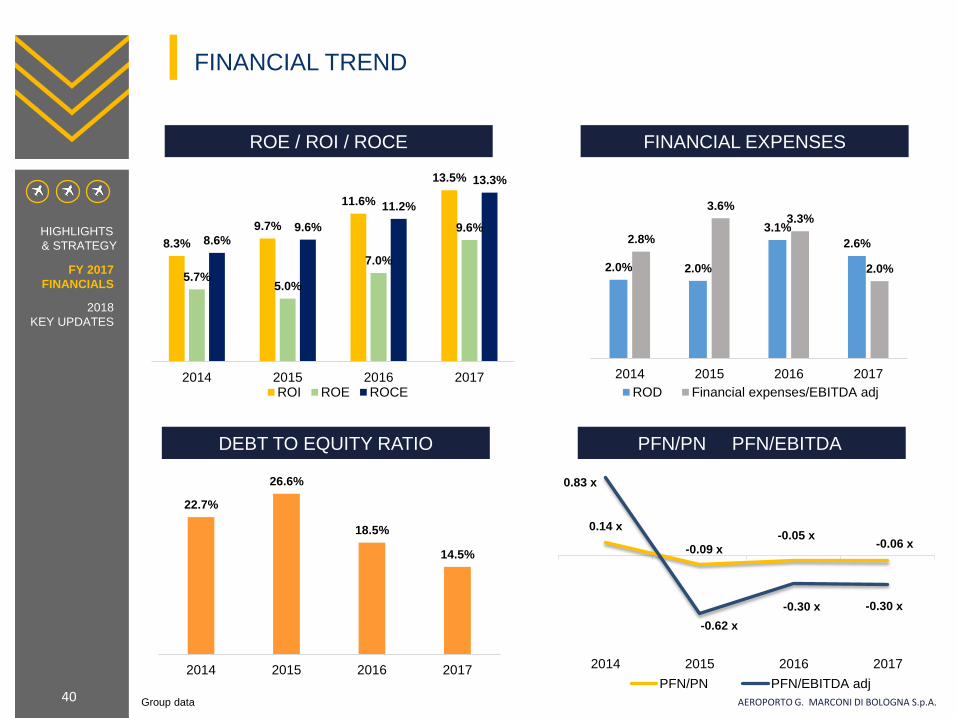
FINANCIAL TREND
AEROPORTO G. MARCONI DI BOLOGNA S.p.A.
FY 2017
FINANCIALS
2018
KEY UPDATES
HIGHLIGHTS
& STRATEGY
AEROPORTO G. MARCONI DI BOLOGNA S.p.A.
Group data
ROE / ROI / ROCE FINANCIAL EXPENSES
8.3%
9.7%
11.6%
13.5%
5.7% 5.0%
7.0%
9.6% 8.6%
9.6%
11.2%
13.3%
2014 2015 2016 2017ROI ROE ROCE
2.0% 2.0%
3.1%
2.6% 2.8%
3.6% 3.3%
2.0%
2014 2015 2016 2017
ROD Financial expenses/EBITDA adj
0.14 x
-0.09 x -0.05 x
-0.06 x
0.83 x
-0.62 x
-0.30 x -0.30 x
2014 2015 2016 2017
PFN/PN PFN/EBITDA adj
22.7%
26.6%
18.5%
14.5%
2014 2015 2016 2017
DEBT TO EQUITY RATIO PFN/PN PFN/EBITDA

41
2018
KEY UPDATES
AEROPORTO G. MARCONI DI BOLOGNA S.p.A.
FY 2017
FINANCIALS
2018
KEY UPDATES
HIGHLIGHTS
& STRATEGY
2018: NEW CONNECTIONS AND NEW FREQUENCIES
42 AEROPORTO G. MARCONI DI BOLOGNA S.p.A.
NEW FLIGHTS
NEW FREQUENCIES
New direct flights to China: a total of 60
departures and as many arrivals will connect
China to Bologna Airport in Summer 2018
New flight to Russia operated by Ural Airlines (1
weekly flight) starting in Summer 2018
New 2 weekly flights to Athens operated by
Aegean Airlines starting in Summer 2018
New 2 daily flights to Palermo operated by Alitalia
starting in Summer 2018
New 2 weekly flights to Tbilisi operated by
Georgian Airways starting in Summer 2018
Amsterdam operated by KLM from 3 to 4 daily flights started in February 2018
Catania operated by Alitalia from 1 to 2 daily flights starting in Summer 2018
Moscow operated by Aeroflot from 2 to 3 daily flights starting in Summer 2018
Barcelona operated by Vueling from 1 to 2 daily flights starting in Summer 2018
FY 2017
FINANCIALS
2018
KEY UPDATES
HIGHLIGHTS
& STRATEGY
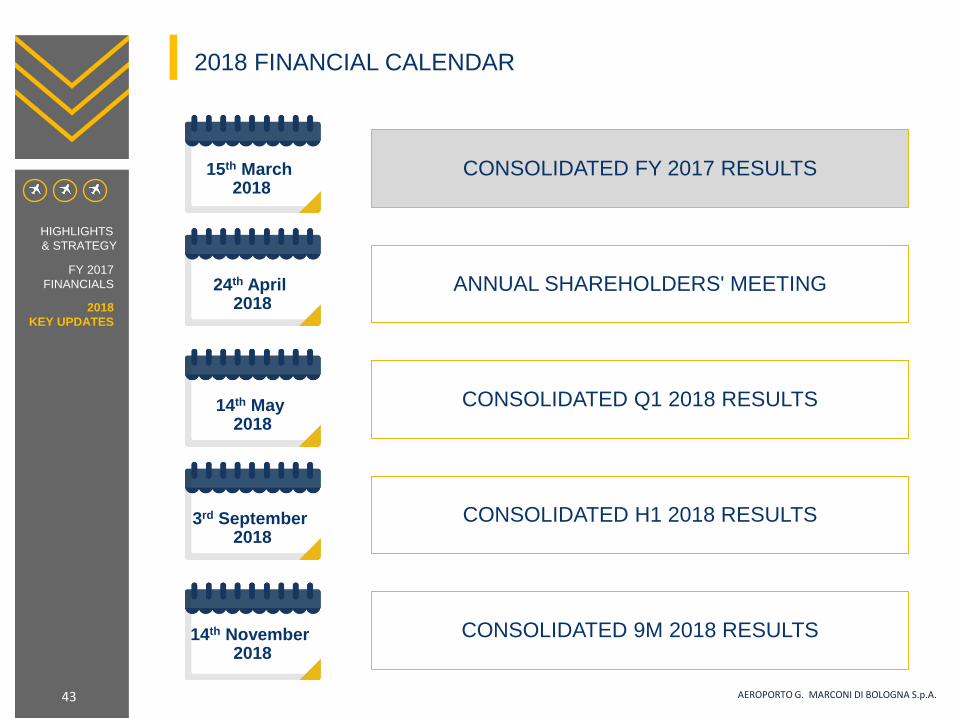
2018 FINANCIAL CALENDAR
43 AEROPORTO G. MARCONI DI BOLOGNA S.p.A.
15th March 2018
CONSOLIDATED FY 2017 RESULTS
24th April 2018
ANNUAL SHAREHOLDERS' MEETING
14th May 2018
CONSOLIDATED Q1 2018 RESULTS
3rd September 2018
CONSOLIDATED H1 2018 RESULTS
14th November 2018
CONSOLIDATED 9M 2018 RESULTS
FY 2017
FINANCIALS
2018
KEY UPDATES
HIGHLIGHTS
& STRATEGY

DISCLAIMER
44
This document has been prepared by Aeroporto G. Marconi di Bologna S.p.A. (AdB) solely for use at the presentation to potential
institutional investors it is not to be reproduced or circulated and is not to be used in the United States, Canada, Australia or Japan.
The information contained in this document has not been independently verified. No representation or warranty expressed or implied
is made as to, and no reliance should be placed on, the fairness, accuracy, completeness or correctness of the information or
opinions contained herein. None of AdB or any of their representatives shall have any liability whatsoever (in negligence or
otherwise) for any loss arising from any use of this document or its contents or otherwise arising in connection with this document.
This document does not constitute an offer or invitation to purchase or subscribe for any shares and neither any part of it shall form
the basis of or be relied upon in connection with any contract or commitment whatsoever. This document is being supplied to you
solely for your information and may not be reproduced, redistributed or passed on, directly or indirectly, to any other person or
published, in whole or in part, for any purpose.
Neither this document nor any part or copy of it may be taken or transmitted into the United States or distributed, directly or indirectly,
in the United States, or to any “U.S. Person” as that term is defined in Regulation S under the U.S. Securities Act of 1933, as
amended (the “Securities Act”). Neither this document nor any part or copy of it may be taken or transmitted into or distributed
directly or indirectly in Australia (other than to persons in Australia to whom an offer of securities may be made without a disclosure
document in accordance with Chapter 6D of the Corporations Act 2001 (Cth.), or taken or transmitted into Canada or Japan, or
distributed directly or indirectly in Canada or distributed or redistributed in Japan or to any resident thereof. Any failure to comply with
this restriction may constitute a violation of U.S., Australian, Canadian or Japanese securities laws, as applicable. The distribution of
this document in other jurisdictions may also be restricted by law, and persons into whose possession this document comes should
inform themselves about, and observe, any such restrictions. In this case no reliance will be placed on AdB.
The statements contained in this document that are not historical facts are "forward-looking" statements (as such term is defined in
the United States Private Securities Litigation Reform Act of 1995), which can be identified by the use of forward-looking terminology
such as "believes", "expects", "may", "will", "should" or "anticipates" or the negative thereof or other variations thereon or comparable
terminology, or by discussions of strategy that involve risks and uncertainties.
These forward-looking statements, such as the statements regarding AdB‘ s ability to develop and expand its business, the effects of
regulation, changes in overall economic conditions, capital spending and financial resources and other statements contained in this
document regarding matters that are not historical facts involve predictions. No assurance can be given that the anticipated results
will be achieved. Actual events or results may differ materially as a result of risks and uncertainties facing AdB and its subsidiaries.
Such risks and uncertainties include, but are not limited to, increased competition and regulatory, legislative and judicial
developments that could cause actual results to vary materially from future results indicated, expressed or implied in such forward-
looking statements.
By viewing the material in this document, you agree to the foregoing.
AEROPORTO G. MARCONI DI BOLOGNA S.p.A.
45
For additional information:
INVESTOR RELATIONS
Nazzarena Franco
Strategy Planning and Investor Relations Director
Tel: +39 051/6479680
Milan, March 27th 2018
THANK YOU FOR YOUR ATTENTION!
AEROPORTO G. MARCONI DI BOLOGNA S.p.A.