Embed Size (px)
Citation preview

Presented at 9th Poverty and Economic Policy (PEP) Research Network ConferenceSi R C b diSiem Reap, Cambodia7 December 2011Asri Yusrina, Athia Yumna, Rahmitha, Akhmadi

Introduction Introduction Macro Impact
o Impact on Economic Sector Textile/Batik Industrieso Impact on Economic Sector Textile/Batik Industrieso Impact on Fisheries Industrieso Impact on Returning Overseas Workers
Micro Impacto Impact of GFC on Householdso Coping Mechanism Adopted by Householdso Coping Mechanism Adopted by Households
Government Policy Response Conclusion Conclusion

Global financial crisiso Hit the US in mid-2008o Affected and spread all over the worldo European and Asian countries.po Indonesia: contribution of 33 provinces/497 districts
CBMS Areaso CBMS implementation conducted data collection rider
questionnaire (impact of GFC)Transmitted through weaked export demand falleno Transmitted through weaked export demand, fallen commodity and oil price, currency depreciation, weaker domestic production, dismissals and lay-offs as well as returning overseas workersreturning overseas workers.
o Indepth interview with handicraft exporter: handicraft export declined by 30% (mid-2008), 60% (end of Dec 2008) “preliminary research” to identify possibility of impact of the GFC in CBMS areas interviewed with preliminary research to identify possibility of impact of the GFC in CBMS areas interviewed with exporter, Local government, businessmen, Labor Agency
AimThe aim of this study is to understand the The aim of this study is to understand the impact of GFC on Households in the CBMS areas and to identify which household groupareas and to identify which household group is the most affected.
Methodology
A i ti i i 5 A census using questionnaires in 5 kelurahan, in addition to the CBMS questionnairesquestionnaires.
Complemented by qualitative study using in-depth interviews and FGDs with the affecteddepth interviews and FGDs with the affected communities and households.
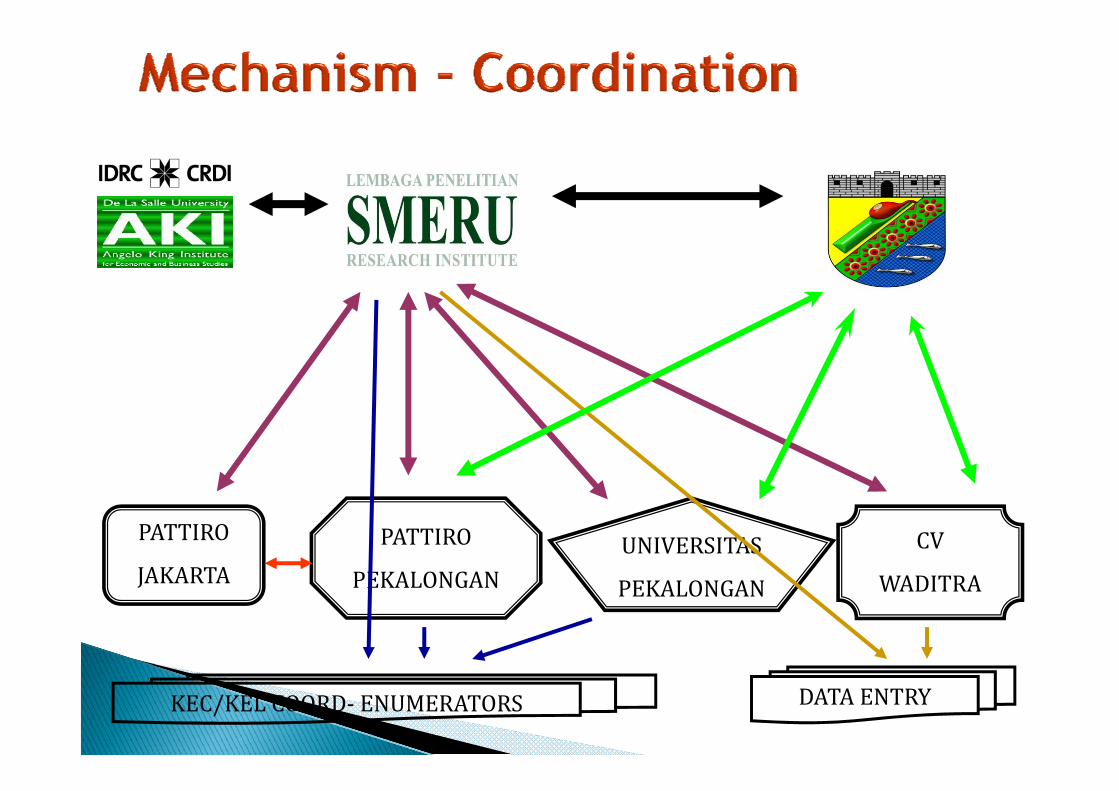
PATTIROJAKARTA PATTIROPEKALONGAN UNIVERSITAS CV JAKARTA PEKALONGAN PEKALONGAN WADITRAKEC/KEL COORD- ENUMERATORS DATA ENTRY

CBMS KOTA PEKALONGAN47 Villages 69,840 HHs
2009 CBMS DATA COLLECTION23 Villages 41,651 HHs
Has industry/factory that employs formal labor
Site Selection Criteria
Has home industry that employs formal/informal labor
Produce handicraft/art work for export or to beProduce handicraft/art work for export or to be marketed in tourist destinations within Indonesia
Most of the population work in overseas Most of the population work in major cities in
GFC CENSUS
Most of the population work in major cities in Indonesia
GFC CENSUS5 Villages 13,609 HHs

Indonesian economy growth slower
10%
5
5
0
1997 1998 1999 2000 2001 2002 2003 2004 2005 2006 2007 2008 2009 2010
-10
-5
-15
YearYear

24 23
2655 Trend of poverty rate in Indonesia 1996 - 201124.23
23.43
22
2450
17 47
19.1418.41 18.2
17.4216.66
17.75
16 5818
20
40
45
cent
age
Tota
l
17.47 16.66 15.97 16.58
15.42
14.15
13.3312 49
14
1635
Perc
34.01 49.5 47.97 38.7 37.9 38.4 37.3 36.1 35.1 39.3 37.17 34.96 32.5331.02 30.02
12.49
10
12
25
30
1996 1998 1999 2000 2001 2002 2003 2004 2005 2006 2007 2008 2009 2010 2011
Total %

Industrial Origin 2008 2009I II III IV I II III
Agriculture 6 3 4 8 3 4 4 7 4 8 2 4 2 7Agriculture 6.3 4.8 3.4 4.7 4.8 2.4 2.7Mining and Quarrying
-1.7 -0.5 2.1 2.1 2.2 2.4 6.5
Manufacturing Industry
4.3 4.2 4.3 1.8 1.6 1.5 1.3
Electricity Gas and 12 3 11 8 10 4 9 3 11 4 15 4 14 6Electricity, Gas, and Clean Water
12.3 11.8 10.4 9.3 11.4 15.4 14.6
Construction 8.0 8.1 7.6 5.7 6.3 6.4 8.8Trade, Hotel, and Restaurant
6.9 8.1 8.4 5.6 0.6 -0.1 -0.6
Transport and 18.3 17.3 15.5 15.8 16.7 17.5 18.2pCommunicationFinance, Renting, and Business Service
8.3 8.7 8.6 7.4 6.3 5.5 4.9and Business ServiceOther Services 5.9 6.7 7.2 6.0 6.8 7.4 5.8GDP Growth Rate 6.2 6.4 6.4 5.2 4.4 4.0 4.2

When households were able to adjust with the risen food prices, at the end of first quarter of 2009food prices, at the end of first quarter of 2009o inflation is lower than the previous year of the same period.o export and import growth of goods in first quarter of 2009
drop numerously as compared with its growth in the samedrop numerously as compared with its growth in the same period of the previous year. Both are affected by the volatility of exchange rate, which is about IDR/USD 11,517. The investment is falling to 3 5% in regards to crowding outThe investment is falling to 3.5% in regards to crowding out of foreign investment.
Indonesia’s macroeconomic condition begins toIndonesia s macroeconomic condition begins to stable in the third quarter of 2009o people are benefited with the low inflation rate.
h l d l do However there is a large decline in export, compared to same period in 2008, presumably caused by the broadened of GFC impact received by developed
dcountries outside US.

G th 3rd Q t 1st Q t 3rd Q tGrowth 3rd Quarter 2008
1st Quarter 2009
3rd Quarter 2009
GDP 6.4 4.4 4.2
Inflation 13.5 8.48 2.83
Export 10.6 -19.1 -22.3
I t 11 24 1 30 84Import 11 -24.1 -30.84
Exchange rate 9,331 11,517 9,633(IDR/USD)
Investment 12.2 3.5 4

Impact on Textile/Batik Industries Impact on Textile/Batik Industries (1)(1)
Two channels of how the impact of GFC is transmittedto textiles sector and then to households in KotaPekalongan.Pekalongan.
1. through factories that reduced their input to cope with the weaken demand. Disnaker: that a company named ‘Tobal Batik’, regularly received order from US, has
reduced their employee from 400 to 50 workers during 2008-2010. closing of garment factory that caused by internal mis-management of family
business workers from this factory have been laid off gradually since 2007 up to2010 Th h i f hi l i f i di d f2010 Thus the impact of this closing factory was not immediate and formerworkers able to adjust with compensation they have received.
2. through the batik industry. share of batik industry in national GDP is relatively steady which is about 9% per year export value of Indonesia’s batik during 2004-2008 is in positive trend though it is
weaken in 2005.o Export value of batik industry is USD34 2 million (2004) USD12 43 milliono Export value of batik industry is USD34.2 million (2004) USD12.43 million
(2005) USD14.26 million (2006) USD20.87 million (2007) USD32.27million (2008).
o The positive trend is weakened again in January-November 2009 with exportvalues of USD17.35 million since the targeted countries for Indonesia’s batikexport such as US is in financial crisisexport such as US is in financial crisis.
Based on rough estimation, batik industry from Kota Pekalongan contributes about29% of Indonesia’s batik export values in January-November 2009.

Impact on Textile/Batik Industries Impact on Textile/Batik Industries (2)(2)
14000
180
200
10000
12000
140
160
6000
8000
100
120
4000
40
60
80
0
2000
0
20
l l l lJan-07 Apr-07 Jul-07 Oct-07 Jan-08 Apr-08 Jul-08 Oct-08 Jan-09 Apr-09 Jul-09 Oct-09 Jan-10 Apr-10 Jul-10 Oct-10 Jan-11
Cotton (USD/pound) Crude Oil (USD/barrel) Currency (IDR/USD)

Impact on Fisheries IndustryImpact on Fisheries Industry Indonesia’s fisheries exports fell immediately when demand from the
US fell 30%–40% during the 2008/09 GFC.o The US is the main market for Indonesia’s fisheries exports and takes 40%o The US is the main market for Indonesia s fisheries exports and takes 40%.o Fisheries industries of Pekalongan contributes 50% of city’s export value
weaken export demand means lower amount of fish that would be bought bywholesaler. However, the quantitative and qualitative analysis in Pekalongandoes not reveal about how HHs felt the impact of GFC through fisheriesdoes ot e ea about o s e t t e pact o G C t oug s e esindustry.
Closing of the only local fishers trading place in north of KotaP k lPekalongan.o Due to the closing of ice factory, local fishers cannot buy ice that they use to
freeze up fish they catched.o the fishers sold the fish through on sea transaction.o the local fishers trading place was deserted from any transaction and then
closed.o the closing has affected HHs that rely their source of income through several
activities in the fish trading place: fishing deck hands, small reseller of fish.
Indication of weaken export demand due to GFC and the closingof local fish trading place are additional shocks that contributes
d i i b il /b ik i d d hto compound crises given by textile/batik industry and hasimpact on households.

Impact on Returning Overseas Workers Impact on Returning Overseas Workers (1)(1)
There is an assumption that GFC also affect overseas workersthat working in industrial sector and that they were laid offg ydue to weaken export demand.o South Korea and Malaysia, the affected sectors are automotive,
textile and electronic injection industrytextile, and electronic injection industry.o The companies manage the GFC impact through a reduction in
the number of working days and hours.o the overseas worker did not return home immediately, theyo the overseas worker did not return home immediately, they
sought work in other companies.
Most of overseas workers from Kota Pekalongan work asd ti k th th i d t i l l bdomestic workers rather than industrial labor.o Overseas workers returned were not caused by impact of GFC.o The country destination for most of overseas workers is Saudio The country destination for most of overseas workers is Saudi
Arabia.o Overseas workers who were registered on private recruitment
agency located in kota are not only local resident but alsok f b k lworkers from Kabupaten Pekalongan.

Incidence of Returning Overseas Workers of Kota Pekalongan
16
g g
10
12
14
6
8
10
%
0
2
4
0
2008 2009 2010

Number of returning overseas workers and their reasons
Reasons of Returning 2008 2009 2010 Total
Troubled35 21 38 94
14.5 11.7 16.7 14.5
On leave18 6 18 42
7.5 3.3 7.9 6.5
Had finished their working contract188 152 171 511
78.0 84.9 75.3 78.9
Total 241 179 227 647
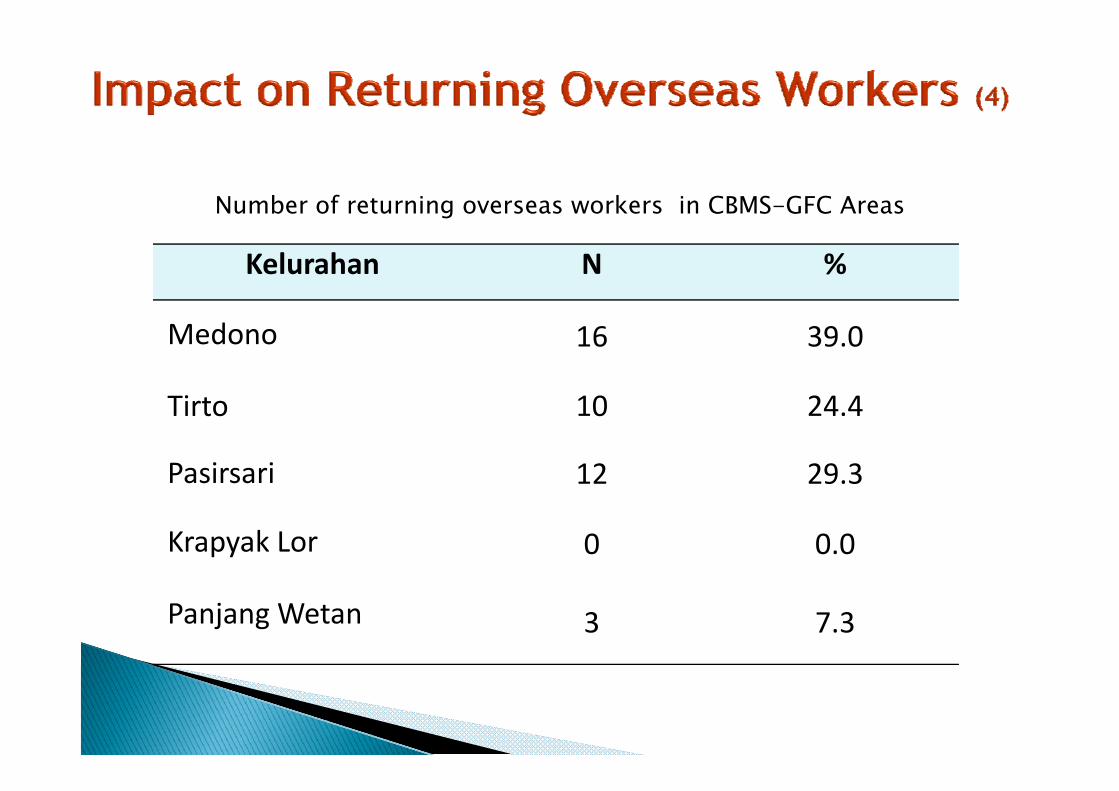
Number of returning overseas workers in CBMS-GFC Areas
Kelurahan N %
g
Medono 16 39.0
i 10 2Tirto 10 24.4
Pasirsari 12 29.3
Krapyak Lor 0 0.0
Panjang Wetan 3 7.3
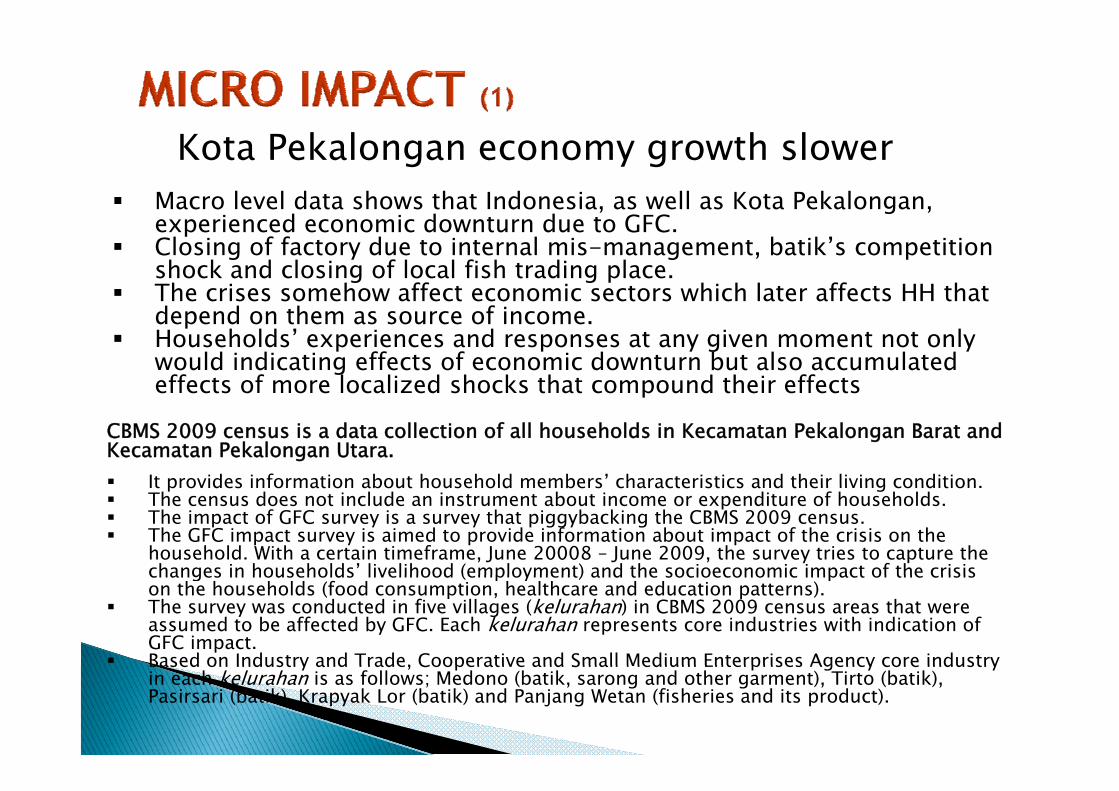
Kota Pekalongan economy growth slower Macro level data shows that Indonesia, as well as Kota Pekalongan,
i d i d d GFCexperienced economic downturn due to GFC. Closing of factory due to internal mis-management, batik’s competition
shock and closing of local fish trading place. The crises somehow affect economic sectors which later affects HH that
d d h fdepend on them as source of income. Households’ experiences and responses at any given moment not only
would indicating effects of economic downturn but also accumulated effects of more localized shocks that compound their effectsp
CBMS 2009 census is a data collection of all households in Kecamatan Pekalongan Barat and Kecamatan Pekalongan Utara. It provides information about household members’ characteristics and their living conditionIt provides information about household members characteristics and their living condition. The census does not include an instrument about income or expenditure of households. The impact of GFC survey is a survey that piggybacking the CBMS 2009 census. The GFC impact survey is aimed to provide information about impact of the crisis on the
household. With a certain timeframe, June 20008 – June 2009, the survey tries to capture the changes in households’ livelihood (employment) and the socioeconomic impact of the crisischanges in households livelihood (employment) and the socioeconomic impact of the crisis on the households (food consumption, healthcare and education patterns).
The survey was conducted in five villages (kelurahan) in CBMS 2009 census areas that were assumed to be affected by GFC. Each kelurahan represents core industries with indication of GFC impact.
Based on Industry and Trade, Cooperative and Small Medium Enterprises Agency core industryBased on Industry and Trade, Cooperative and Small Medium Enterprises Agency core industry in each kelurahan is as follows; Medono (batik, sarong and other garment), Tirto (batik), Pasirsari (batik), Krapyak Lor (batik) and Panjang Wetan (fisheries and its product).

Trend of GDRP
1 500 000
2,000,000
2,500,000
Trend of GDRP
500,000
1,000,000
1,500,000
GDRP
-
2000
2001
2002
2003
2004
2005
2006
2007
2008
2009
2010
d f f h
0.100000
0.120000
Trend of rate of growth
0.040000
0.060000
0.080000
-
0.020000
2001200220032004200520062007200820092010

Impact of GFC on HouseholdsImpact of GFC on Households Other than to locate the poorest group within the village
by using PCA, the merged data also enable us to identifyHH that felt the compound crisesHH that felt the compound crises.
Impacts of the crises on HHs are showed throughindications of any HH member switching their job,indications of any HH member switching their job,particularly to the worse job and HHs with decliningincome.o Job switching also indicates that quite a lot of HHs in the villageg q g
that work in informal sector therefore they are vulnerable toeconomic crisis.
The impact of crises also affect income received by HHs sinceinformal worker working in batik industry working on lesssquare meter of mori cloth to be painted or dyed on batiksqua e ete o o c ot to be pa ted o dyed o batpattern, contract labor in garment industry that working onless hour, and part because of most HH members areswitching to worse jobswitching to worse job.
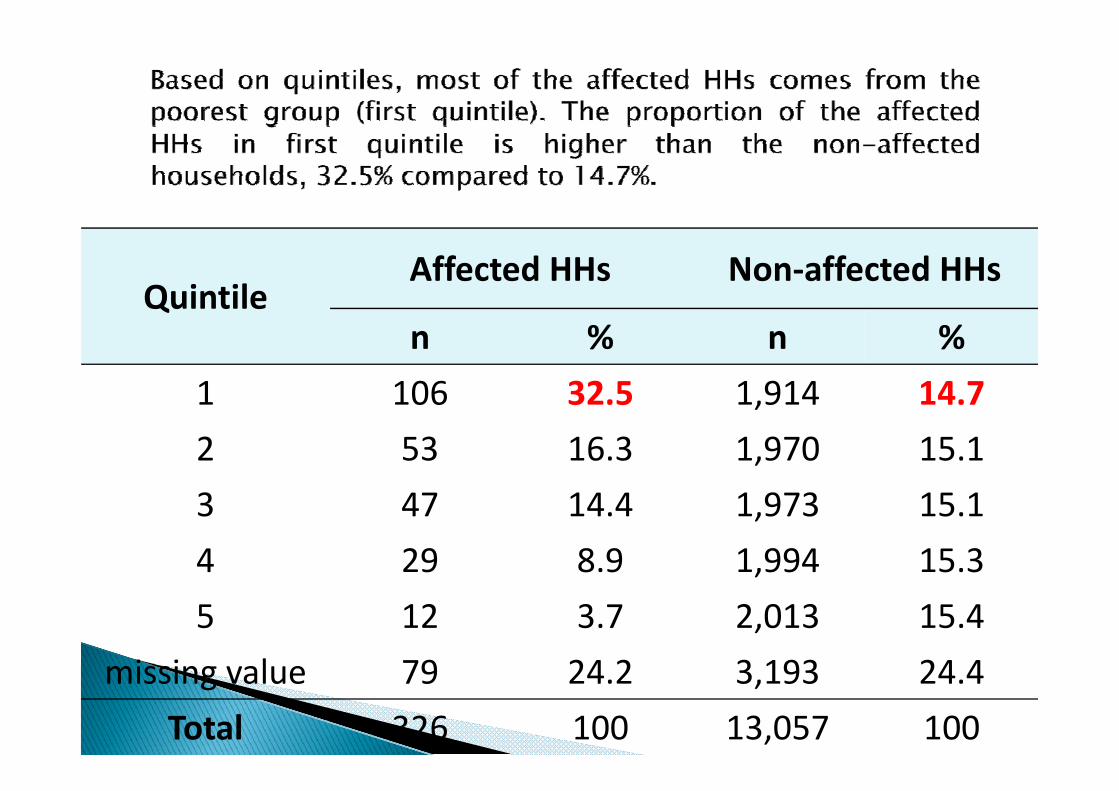
QuintileAffected HHs Non-affected HHs
Quintilen % n %
1 106 32 5 1 914 14 71 106 32.5 1,914 14.72 53 16.3 1,970 15.13 47 14.4 1,973 15.14 29 8.9 1,994 15.3,5 12 3.7 2,013 15.4
i i l 79 24 2 3 193 24 4missing value 79 24.2 3,193 24.4Total 326 100 13,057 100

Poverty Situation Medono Tirto Pasirsari Krapyak Panjang Poverty Situation Medono Tirto Pasirsari Lor Wetan
Total households (n) 3,178 2,326 2,066 2,606 3,207
Household head never attend or not finished primary school 13.86 13.33 22.65 17.27 17.76
High dependency ratio* 6.23 4.94 5.86 7.64 5.89g p y
Living in house with dirt floor 2.71 5.55 8.13 3.65 5.52Received health insurance for 18 69 23 99 38 29 22 76 36 23poor 18.69 23.99 38.29 22.76 36.23
Received Unconditional Cash Transfer 2008 (BLT2008) 14.85 18.7 30.88 18.23 33.61
Received house renovation program of Kota Pekalongan 8.78 8.94 17.52 5.37 8.61

Tabulation of HH’s welfare based on PCA with 393 HHs (2.93% of 13,283 HHs) switching to a worse job than previous13,283 HHs) switching to a worse job than previous
Across kelurahan, 30.03% of the poorest HHs switching job stated that their cuurent job is worse than previous job (June 2008-June 2009).
Quintilemissing
Total1 2 3 4 5
)
Kelurahan missing values
1 2 3 4 5 nn % n % n % n % n % 100%
Medono 30 33.7 16 17.9 17 19.1 7 7.9 5 5.6 14 89Tirto 17 26.6 12 18.7 12 18.7 6 9.4 3 4.7 14 64Pasirsari 6 13.9 10 23.3 9 20.9 4 9.3 5 11.6 9 43Krapyak Lor 17 28 8 8 13 6 8 13 6 6 10 2 2 3 4 18 59Krapyak Lor 17 28.8 8 13.6 8 13.6 6 10.2 2 3.4 18 59PanjangWetan 48 34.8 24 17.4 13 9.4 12 8.7 4 2.9 37 138
T l 118 30 0 70 17 8 59 15 0 35 8 9 19 4 8 92 393Total 118 30.0 70 17.8 59 15.0 35 8.9 19 4.8 92 393

601 HHs (4.49%) of total HHs across kelurahan that experience declining in income during June 2008-2009
Most of HHs that experinece a decline in their income is from the
Q i til T t l
Most of HHs that experinece a decline in their income is from the poorest group (Q1)
Kelurahan
Quintilemissing value
Total
1 2 3 4 5 n
n % n % n % n % n % 100%
Medono 43 33.8 22 17.3 20 15.7 9 7.1 4 3.2 29 127
Tirto 30 31 9 18 19 1 13 13 8 7 7 5 5 5 3 21 94Tirto 30 31.9 18 19.1 13 13.8 7 7.5 5 5.3 21 94
Pasirsari 14 21.5 11 16.9 12 18.5 7 10.8 4 6.1 17 65
Krapyak Lor 20 26 3 15 19 7 14 18 4 6 7 9 3 3 9 18 76Krapyak Lor 20 26.3 15 19.7 14 18.4 6 7.9 3 3.9 18 76
Panjang Wetan 66 27.6 43 17.9 34 14.2 25 10.5 4 1.7 67 239
Total 173 28.8 109 18.1 93 15.5 54 8.9 20 3.3 152 601

ThusThus, During June 2008-June 2009 compound
crisis felt by HHs has made them switchedcrisis felt by HHs has made them switched job and experienced declining on income.
HHs in the lowest quintile (Q1) are the most affected group due to the impact of globalaffected group due to the impact of global financial crisis

Coping MechanismCoping MechanismThe most affected group is the poorest
what poorest households didwhat poorest households did some indicators as coping mechanism that
household did : Change in food consumption pattern
Ch i h l h h d
household did :
Change in healthcare payment method Household sold or pawned their assets Children age below 15 started working Children age 15-18 started working Children age 6-15 dropped out of school Children that were transferred from private to p
gov’t school

During crisis period 8 5% of the total number of HHs (1 134 of 13 383 HHs) During crisis period, 8.5% of the total number of HHs (1,134 of 13,383 HHs) experienced a reduction in quantity and quality of food consumption.
Of the 1,134 Hhs, 81.8% reduced their meal frequency from three times a day to twice per day, while 16.14% had a meal frequency reduction from twice a day to once per day.
N ti Ch i F d C ti M d b HH
Some households (0.9%) had smaller portions of meal consumed, while 1.1% of the HHs had to turn to less quality foods.
KelurahanNegative Changes in Food Consumption Made by HH
TotalFrom 3x to 2x From 2x to 1x Reduced Quality
of FoodReduced
Quantity of Food
Medono 257 28 2 5 29288.0% 9.6% 0.7% 1.7% 100%
Tirto 142 41 9 5 197Tirto72.1% 20.8% 4.6% 2.5% 100%
Pasirsari 66 34 0 0 10066.0% 34.0% 0% 0% 100%
238 31 2 0 2 1Krapyak Lor 238 31 2 0 27187. 8% 11.4% 0.7% 0% 100%
PanjangW
225 50 0 0 274Wetan 82.1% 17.9% 0% 0% 100%
Total 928 183 13 10 1,134% 81.8 16.1 1.1 0.9 100

From 1,134 HHs, 115 HHs or 35,3% are from the affected and 1,019 HHs or 7,8% from non-affected HHs
Affected HHs Non-affected HHsChanges in Food Consumption N=326 N=13,057
n % n %
From 3x to 2x 89 27.3 839 6.4From 2x to 1x 24 7.36 159 1.2Reduced quality of food 2 0.6 11 0.1
Reduced quantity of food 0 0 10 0 1Reduced quantity of food 0 0 10 0.1
Total 115 35 3 1 019 7 8Total 115 35.3 1,019 7.8
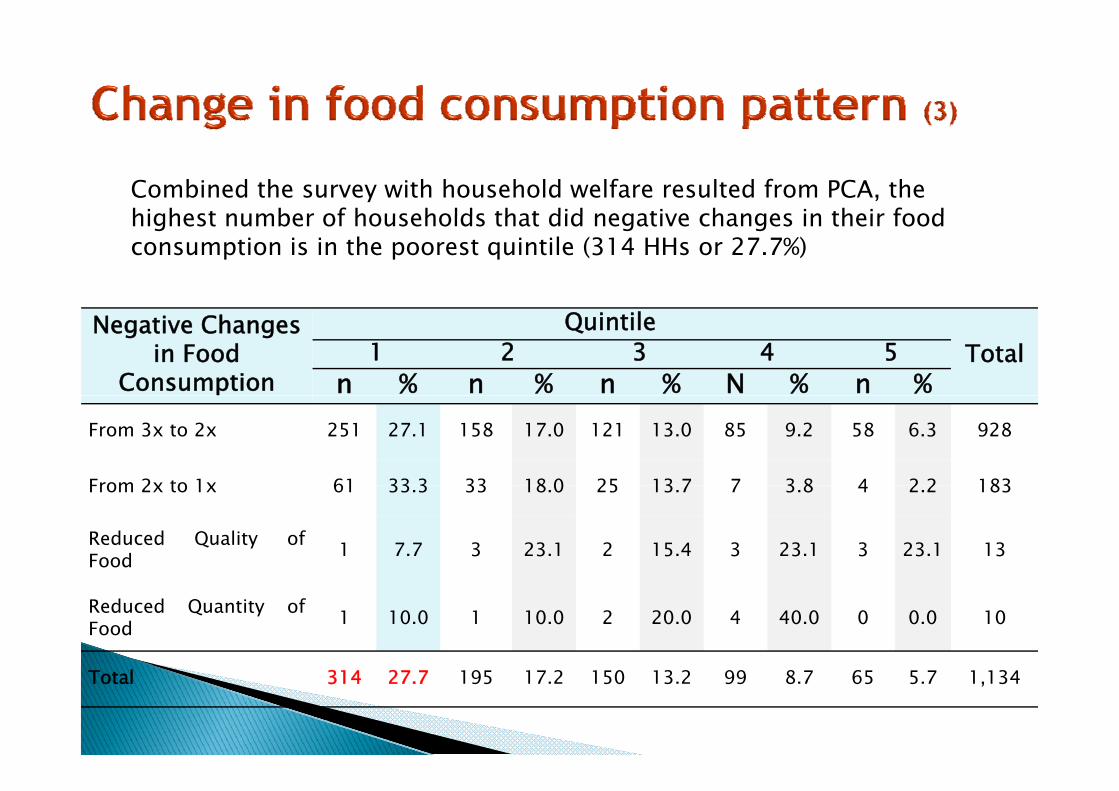
Combined the survey with household welfare resulted from PCA, the highest number of households that did negative changes in their foodhighest number of households that did negative changes in their food consumption is in the poorest quintile (314 HHs or 27.7%)
Negative Changes in Food
Consumption
QuintileTotal1 2 3 4 5
n % n % n % N % n %From 3x to 2x 251 27.1 158 17.0 121 13.0 85 9.2 58 6.3 928
From 2x to 1x 61 33 3 33 18 0 25 13 7 7 3 8 4 2 2 183From 2x to 1x 61 33.3 33 18.0 25 13.7 7 3.8 4 2.2 183
Reduced Quality ofFood 1 7.7 3 23.1 2 15.4 3 23.1 3 23.1 13
Reduced Quantity ofFood 1 10.0 1 10.0 2 20.0 4 40.0 0 0.0 10
Total 314 27.7 195 17.2 150 13.2 99 8.7 65 5.7 1,134

647 HHs (4.83% of total HHs) that change their healthcare patterns The highest number of households that change their healthcare pattern
is in Kelurahan Pasirsari
Changes in Healthcare Changes in Payment
is in Kelurahan Pasirsari.
Kelurahan Changes in Healthcare MethodN % N %
Medono 156 24 1 66 17 9Medono 156 24.1 66 17.9
Tirto 59 9.1 15 4.1
Pasirsari 196 30 3 139 37 9Pasirsari 196 30.3 139 37.9Krapyak Lor 125 19.3 40 10.9Panjang Wetan 111 17 7 107 29 2Panjang Wetan 111 17.7 107 29.2
Total 647 100 367 100
1,599 Hs (11.9% of 13,383 HHs) sold or pawned their , ( , ) passets, such as livestock, motorcycle, land, poultry, etc.)
There are 144 of 326 (0.44%) affected households. The non-affected households perform this coping strategy are p p g gy1,455 of 13,057 HHs (11.1%).
These categorized reasons are based on sampled HHs g pstatements, and divided it into general reason and specific reason.
The general reason are that salary is not enough, did not have money, urgent need, did not want to borrow money from others.
And specific reason is as follows:

Reasons of pawning or selling asset
Affected HHs (N=326)
Non-affected HHs (N=13,057)
n % n %
daily need 66 0.20 575 4.40
percentage of HHs that used money from pawned or sold
pay school fee 14 0.04 111 0.85
pay debt 10 0.03 72 0.55
health expenses 5 0.02 62 0.47
for business capital 2 0 01 59 0 45
asset to fulfill daily needs is high in both groups.
for business capital 2 0.01 59 0.45
to get a job 2 0.01 22 0.17
daily and school need 1 0.003 22 0.17
to renovate house 0 0 14 0.11
However, the proportion is higher in the non-affected h h ld 4 4% daily need & business capital 0 0 10 0.08
for family occasion 0 0 7 0.05
secondary need 0 0 5 0.04
&
households, 4.4%, compared to 0.2% of the affected HHs.
pay debt & school needs 1 0.003 3 0.02
pay debt & daily needs 1 0.003 2 0.02
school needs & business capital 1 0.003 2 0.02
salary is not enough 1 0.003 13 0.10 The affected HHs also use
this coping strategy to pay y g
did not have money 7 0.02 72 0.55
urgent need 1 0.00 85 0.65
did not want to borrow 1 0.003 1 0.01
this coping strategy to pay their children school expenses and to pay debt.
others 0 0 12 0.09
do not know 31 0.10 306 2.34
Total 144 0.44 1,455 11.14

HHs with children age 10-14 started working comes from the affected households (14 HHs, 4.3% of total affected) and the non-affected HHs (220 HH 1 7% f t t l ff t d)(220 HHs or 1.7% of total non-affected).
The proportion of HHs with 2 children started working is slighlty higher in the affected HHs than in the non-affected HHs (0.92% vs 0.27%).
Numbers of Children 10-14
Affected HHsN=326
Non-affected HHsH=13 057Children 10 14
Started Working N=326 H=13,057
N % N %1 11 3.4 183 1.42 3 0.9 35 0.33 0 0 2 0.0
Total 14 4.3 220 1.7
Once more the majority of the poorest HHs are having children age 10-14 started
working (68 of 234 HHs or 29.1%). HHs h h ld d kwith children started working is
decreasing as their welfare is increasing.

CBMS GFC d t h 1 166 HH h b d 15 18 t t d ki H i CBMS-GFC data shows 1,166 HHs whose members aged 15–18 started working. Having it cross-checked using the CBMS census, merely 677 HHs that actually have household members aged 15-18 and that they are starting to work error in data collection
25 HH 7 7% f th ff t d HH hi h th t HH f i d li i f 25 HHs or 7.7% are from the affected HHs, which mean that as HHs facing declining of income during the crises, they need assistance from younger member to generate income or help the parents in generating income.
The proportion of HHs with one child age 15-18 years old started working is quite high in the affected gro ps 6 1% compared to 3 9%
Numbers of Children 15-18Affected HHs
N=326Non-affected HHs
N=13 057
in the affected groups, 6.1% compared to 3.9%.
Numbers of Children 15 18 Started Working in a HH
N=326 N=13,057
n % n %
1 20 6 1 517 3 91 20 6.1 517 3.9
2 5 1.5 117 0.93 0 0 18 0.1
Total 25 7.7 652 4.9

Indonesia has an “Wajardikdas” for primary school and junior secondary school
During the period of crisis, June 2008–June 2009, there is an indication of HHs that discontinued their children education.
h d h h h f l b l h d They doing it to cope with the crises as their financial ability had decreased.
121 HHs with children age 6-15 years old drop out of school.121 HHs with children age 6 15 years old drop out of school.
10 HHs or 3.07% are from the affected HHs while the 111 HHs (0.8%) are from the non-affected.
The proportion of HHs with drop out child in junior high school level is slightly higher in the affected HHs (1.2% compared to 0.3%).
There are 5 of 69 HHs from the non affected HHs with indication There are 5 of 69 HHs from the non-affected HHs with indication of having more than one drop out child. These HHs have children that drop out in primary and junior high school.

School Level of Children D.OAffected HHs
(N=326)
Non-affected HHs
(N 13 057)(N=13,057)n % n %
Primary school 6 1.8 69 0.5Junior high school 4 1 2 41 0 3Junior high school 4 1.2 41 0.3Senior high school 0 0 1 0.0
Total 10 3.1 111 0.8
School Level of D.O
QuintileTotal1 2 3 4 5
Children aln % n % n % n % n %
Primary school 28 37.3 15 20 8 10.7 4 5.3 0 0 75
Junior high school 14 31.1 9 20 4 8.9 6 13.3 0 0 45
Senior high 0 0 0 1 100 0 0 0 0 0 0 0 1school 0 0.0 1 100 0 0.0 0 0 0 0 1
Total 42 34.7 25 20.7 12 9.9 10 8.3 0 0 121

Another coping mechanism that we assumed HHs would do in coping with the crisis is withdraw their children from the private to gov’tschool since school fees in gov’t school is subsidizedschool since school fees in gov t school is subsidized.
There no differences in the proportion of HH with the withdrawal children in the affected and non-affected HHs, both 0.3%.
Adding the analysis by HHs quintile, it shows that majority HHs with the withdrawal children come from the upper two quintiles. This instrument is weak indicator since there is other reason for a
HHs with Children 6-15 Affected HHs(N 326)
Non-affected HHs (N 13 057)
withdrawal of children.
transferred from private to government school
(N=326) (N=13,057)n % n %
Yes 1 0.3 40 0.3
No 325 99.7 13,017 99.7
Total 326 100 13,057 100

As a response of economic downturn that occurred in fourth quarterGOV’T POLICY RESPONSE GOV’T POLICY RESPONSE (1)(1)
As a response of economic downturn that occurred in fourth quarter of 2008 due to GFC’s impact, GoI proposed for approval of Fiscal Stimulus Package (FSP) to the parliament.
The FSP aims to (i) maintain people purchasing power (ii) maintain the stability of business climate (iii) create job opportunity and b b l id ff l babsorb laid-off labor:
o 1st objective: GoI provide incentive such as, reducing individual income tax, increasing minimum limit of non-income tax and giving various subsidiesincreasing minimum limit of non income tax and giving various subsidies.
o 2nd objective: GoI gives business sector incentives on taxes as well as various subsidies.
o 3rd objective: accomplished through allocating the FSP fund for labor intensive j p g gprojects in infrastructure and extension of The National Program for Community Empowerment (PNPM).
Th G I ll d R 73 3 illi f h FSP f d hi h i b The GoI allocated Rp73.3 trillion for the FSP fund, which is about 1.4% of 2009 GDP. The FSP fund is allocated to all provinces across Indonesia but only several districts/cities in each province that receive the fund. The use of this fund is determined by GoI whether it is used to build new infrastructure or restore existing infrastructure.

The FSP fund is not being allocated based on the area that was severely affected by GFC since data about GFC’s impact acrossseverely affected by GFC since data about GFC s impact across region is not available. Thus, the allocation was given based on deprived area, economic zone, political decision and etc. Although the project is aimed to absorb laid-off labor, there is no practice on or regulation about using local labor that was laid-off.
Kota Pekalongan received about IDR1,933 million from National Budget through Deconcentration and Co-administration Fund at theBudget through Deconcentration and Co-administration Fund at the district level.
Based on GFC household survey the observed time frame of GFC’s Based on GFC household survey, the observed time frame of GFC s impact on households is from June 2008 – June 2009. As for the utilization of FSP fund, it was started in the beginning of August 2009.
o the survey is unable to capture the result of GoI mitigating strategy as a response of GFC impact.
o Since the mitigating strategy was not given to the targeted receiver such as homeo Since the mitigating strategy was not given to the targeted receiver, such as home industry of batik and fisheries industry, it is difficult to observe the outcome.
B d i f GFC 2 161 HHBased on impact of GFC census, 2,161 HHs stated that they have received special aid
i l ti t th GFCprograms in relation to the GFC.
◦ The data also provide information about the sourceThe data also provide information about the source of the aid programs, i.e. Government, private and religious institution as well as mass organization.◦ 310 HHs had received capital loan and 598 HHs
received capital goods from the government.◦ the data could not give further explanation whether◦ the data could not give further explanation whether
capital loan or goods received by HHs come from the gov’t is in specific form of PNPM or not. g p

Form of Special Aid Programs
Medono Tirto Pasirsari Krapyak Lor
Panjang Wetan Total
Programs
Capital loan32 109 19 22 128 310
14 1 27 6 8 7 6 5 13 0 14 414.1 27.6 8.7 6.5 13.0 14.4
Capital goods30 80 62 33 393 598
13 2 20 3 28 4 9 7 40 0 27 713.2 20.3 28.4 9.7 40.0 27.7
Others157 191 135 280 457 1,220
69 2 48 4 61 9 82 6 46 5 56 569.2 48.4 61.9 82.6 46.5 56.5
Do not know8 15 2 4 4 33
3 5 3 8 0 9 1 2 0 4 1 53.5 3.8 0.9 1.2 0.4 1.5
Total 227 395 218 339 982 2,161100 100 100 100 100 100

G I l b R 200 000 i 18 2 illi f HH GoI also spent about Rp200,000 times 18,2 million of poor HHs across Indonesia in the form of UCT2009 (BLT 2009). Targeted HHs in 2009 are the same with HHs received BLT2008 since the database used is from PPLS08from PPLS08.
Suara Pantura (2009), there are 22,983 households in Pekalongan City that received BLT 2009. The distribution of BLT2009 in the city was conducted on 20-27 April 2009.
The 2009 CBMS census does not include an instrument about HHs received BLT2009 but the impact of GFC survey able to capture HHsreceived BLT2009 but the impact of GFC survey able to capture HHs that received BLT in June 2008 – June 2009.
From ‘Others’ special aid programs (1,220 HHs), the data reveals that HHs received BLT2009 Raskin Health Insurance for the poorHHs received BLT2009, Raskin, Health Insurance for the poor (Jamkesmas), scholarship/(BOS) and House renovation program.
Cross-tabulate HHs received BLT2009 with HHs welfare from the PCA method, it resulted a description of the receiver. The poorest group has the highest number of HHs received BLT2009, 229 of 806 HHs (28.4%). Household in the highest quintile received BLT2009 could indicate an i l i f h i l i h i dinclusion error of the social protection program or the incorrectednessin the PCA process.
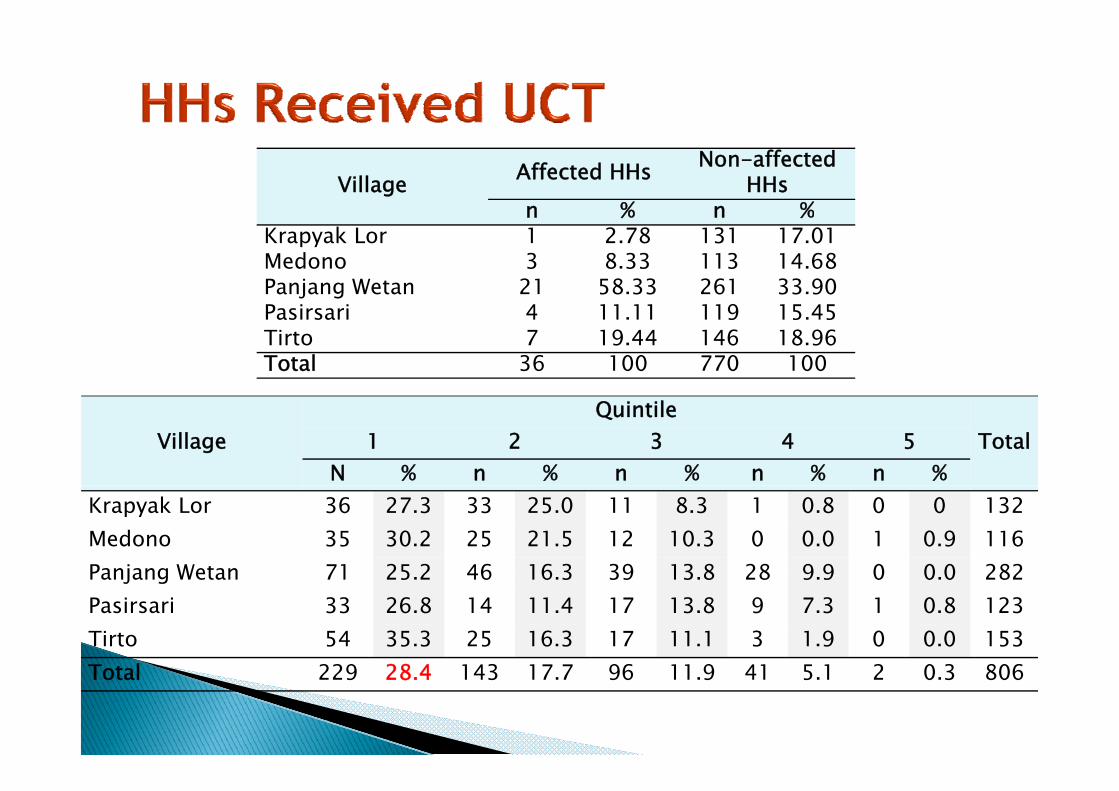
Village Affected HHs Non-affected HHs
n % n %n % n %Krapyak Lor 1 2.78 131 17.01Medono 3 8.33 113 14.68Panjang Wetan 21 58.33 261 33.90P i i 4 11 11 119 15 45Pasirsari 4 11.11 119 15.45Tirto 7 19.44 146 18.96Total 36 100 770 100
VillageQuintile
Total1 2 3 4 5N % n % n % n % n %
Krapyak Lor 36 27.3 33 25.0 11 8.3 1 0.8 0 0 132Medono 35 30.2 25 21.5 12 10.3 0 0.0 1 0.9 116Panjang Wetan 71 25 2 46 16 3 39 13 8 28 9 9 0 0 0 282Panjang Wetan 71 25.2 46 16.3 39 13.8 28 9.9 0 0.0 282Pasirsari 33 26.8 14 11.4 17 13.8 9 7.3 1 0.8 123Tirto 54 35.3 25 16.3 17 11.1 3 1.9 0 0.0 153T l 229 28 4 143 17 7 96 11 9 41 5 1 2 0 3 806Total 229 28.4 143 17.7 96 11.9 41 5.1 2 0.3 806

Through this study we sought to ascertain indication of GFC’sCONCLUSIONCONCLUSION
Through this study we sought to ascertain indication of GFC simpact in Kota Pekalongan across macro and microeconomiclevel. Two main economic sectors in Kota Pekalongan wereaffected by the GFC impact.a ected by t e G C pacto Textile/batik industries are affected through weaken export demand and increasing price of
imported cotton.o Fisheries industries are also affected by the weaken export demand. During period of GFC,
other crises exist in local context such as a closing of garment factory due to mis-other crises exist in local context such as a closing of garment factory due to mismanagement and family conflict, batik’s competition shock and a closing of local fisherstrading place.
o However, there is no indication of GFC’s impact on the returning of overseas worker fromKota Pekalongan in which most of them are working as domestic worker.
The 326 affected Hhs were identified through incidence of HHwith member switching job, particularly to worsen job, anddeclining of income during June 2008–June 2009.declining of income during June 2008 June 2009.o Based on households’s charactheristics the affected households are households with head
of households that never attend or not finished primary school, working in industrial sector,come from the poorest group, living in house with dirt floor and had received several socialprotection program from government.p otect o p og a o go e e t
o Based on quintiles, it appears that the poorest group, lowest quintile, has the highestnumber of affected households.

HHs perform several coping strategies, such aschanging their food consumption pattern, healthcarepayment method, pawning or selling assets andpayment method, pawning or selling assets anddriving their children to enter the labor force anddrop out from school. The majority of HHs carryingout these strategies are HHs in the poorest group.g p g p
The GoI need to have a good database of targetedHHs since the social protection programs had easedHHs since the social protection programs had easedpoor HHs during the crises.o They used health insurance for the poor and BLT2009 as their safety neto An early response system requires a good database that will support immediateo An early response system requires a good database that will support immediate
action from government in handling any crisis.o Infrastructure project from FSP fund are less likely to reach the targeted HHs.o Government awareness on vulnerable economic sectors, in which many households
rely on it, is also important as well as preventive action of giving incentive for theind stries in the time of crisisindustries in the time of crisis.
o Local government should initiate the importance of providing database ofvulnerable economic sectors and targeted HHs at their own cost, such as HH datagiven through CBMS project in Kota Pekalongan.