Embed Size (px)
Citation preview

Presented at Puget Sound Shorelines and the Impacts of Armoring Workshop,May 12-14 2009. This presentation not peer reviewed.

Inventory and Assessment of Current and Historic Beach Feeding Sources/Erosion and Accretion Areas for the Marine Shorelines of WRIA 8 & 9
Jim Johannessen, Licensed Engineering Geologist, MSAndrea MacLennan, MS
Coastal Geologic Services, IncBellingham, WA
With historic Accretion Shoreform mapping by Aundrea McBrideSkagit River System Cooperative
www.coastalgeo.com

Purpose
Field map current sediment sources (feeder bluffs), accretion shoreforms, transport zones and modified shores throughout study area
Research and map historic sediment sources (feeder bluffs), accretion shoreforms, transport zones
Based on results of comparison of current and historic sediment process data: prioritize restoration & conservation areas based on degree of loss/intact nearshore habitat forming processes
Results for understanding processes, salmon recovery planning and implementation, permit and siting issues, SMP updates and much more…

Conceptual Model
Sediment
Beaches

Conceptual Processes
Sediment
Beaches
Littoral Drift/ Net Shore-drift cells
Erosion/ Mass Wasting
Bluffs (~90%??)
Waves
Deposition > Habitats

Previous Feeder Bluff/Accretion Shoreform Mapping by CGS
1999-2009:
Current conditions mapping has been
completed for over 680 miles of PS shore
Historic conditions mapping has been
completed for over 250 miles of PS shore
Additional mapping in 2009:
Current conditions 200-400 miles

Study Area
WRIA 9 & 8
~121 miles
(2004-2005)

Current Conditions MappingField Mapping Classification-1
Feeder Bluff Exceptional - Magnolia Bluff • Rapidly eroding, abundant sediment load• Recent landslide scarps• Lack of vegetation cover, some fallen trees• Presence of colluvium, boulder/cobble lag
Feeder Bluff - Normandy Park• Periodic sediment input; longer recurrence interval than FBE
• Presents of historic scarps, lack of mature vegetation and intermittent bank erosion.
CGS field photo, 2004 CGS field photo, 2004

Current Conditions Mapping.Field Mapping Classification-2
Transport Zone – South Vashon Island• Lack of visible indicators of erosion or accretion.• Mature vegetation e.g. conifers.• Occasional toe erosion.
Accretion Shoreform – East Maury Island• Broad backshore area (greater than 10 ft).• Backshore vegetation community. • Spit and/or lagoon landward of a spit. • Relatively fine-grained sediment and very old drift logs in the backshore.
AS(es) were classified into 5 sub-categories to capture their
contrasting condition. Categories including the
location of any modifications and presence/absence of a
stream or creek.
CGS field photo, 2004 CGS field photo, 2004

Current Conditions MappingField Mapping Classification-3
Modified –• Bulkheaded or otherwise altered. • Natural geomorphic character of shore is (largely) concealed.• Potential sediment sources lost.
Modified – by BNSF Railway• Modified by BNSF railway causeway.
No Appreciable Drift• Modified to the degree that net shore-drift is precluded.
• Typically also consists of fill areas.
• Common in marinas and Port facilities.
CGS field photo, 2004CGS field photo, 2004 DOE oblique, 2001

Current Conditions Results• mapped at 1:24,000• typical segment length 300-700 ft• 858 shore segments
Shoretype Number of Units Min Length (ft) Max Length (ft) Mean Length (ft) % of Study AreaFeeder Bluff Exceptional 29 61 2,861 709 3.30%Feeder Bluff 184 23 3,560 517 15.10%Transport Zone 95 19 1,808 274 4.10%Accretion Shoreform 247 5 2,930 473 18.50%Modified 287 21 29,986 1,004 45.60%Modified - RR 16 829 17,247 5,293 13.40%Sum 858 100.00%
Mod + Mod-RR + AS-mods = 69% MODIFIED
22 drift cells had NO INTACT SEDIMENT SOURCE (61 cells total)
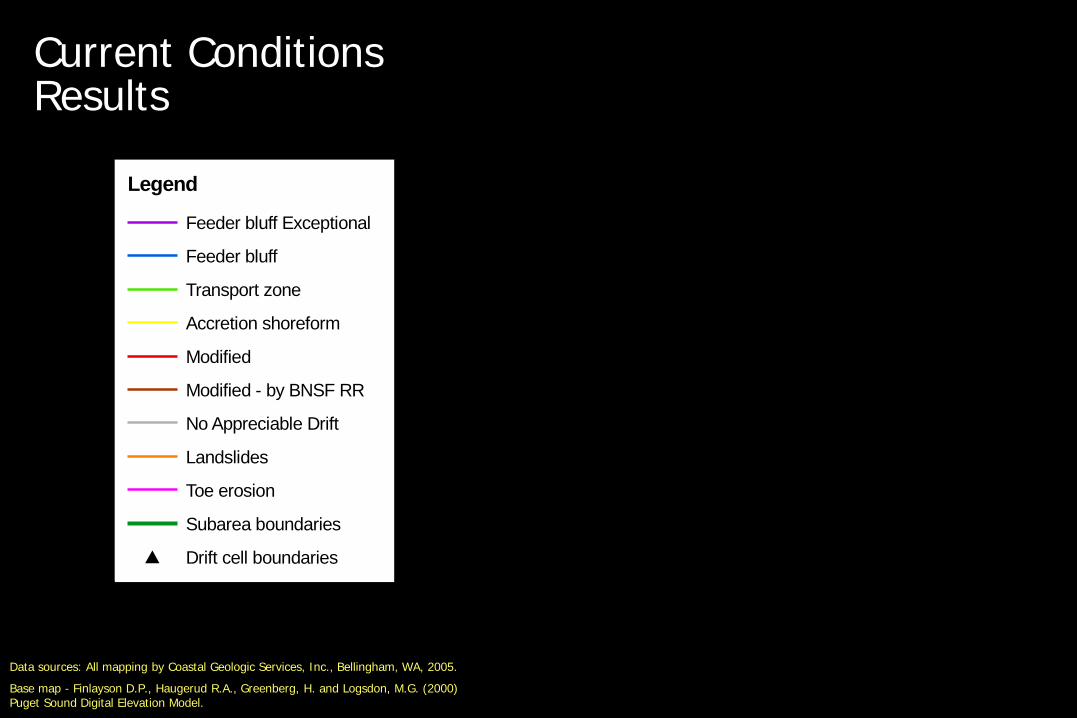
Current Conditions Results
Legend
Feeder bluff Exceptional
Feeder bluff
Transport zone
Accretion shoreform
Modified
Modified - by BNSF RR
No Appreciable Drift
Landslides
Toe erosion
Subarea boundaries
# Drift cell boundaries
Three Tree Point
Data sources: All mapping by Coastal Geologic Services, Inc., Bellingham, WA, 2005.
Base map - Finlayson D.P., Haugerud R.A., Greenberg, H. and Logsdon, M.G. (2000) Puget Sound Digital Elevation Model. 1:24,000

Historic Conditions Methods
• Current Conditions mapping was starting point
> researched historic condition of currently modified shores only
• Relied on concurrence between available data sets
Media Year Source
1940 US ACOE1947 Snoho Cty
1977/78 DOE & SC1990 DNR2002 USGS
Oblique aerial photos 2000/01 DOEMaps 1841 US Ex.
1841 NOAA1850+ GLO1854 USCS
1855-56 Anonymous1878 Koch, A.
1879 NOAA1884 Kroll1891 NOAA1890 City of Seattle1891 Kroll
1866/99 USC&GS1905 NOAA1991 USGS
1893-34 M. Stixrud1854 US Coast Survey
B. Collins data 2004 T-sheets2005 T-sheets
Vector data Year Source Theme Notes2004 DNR-geology Surface Geology Mapped Qb, Qls1975 DOE-CZA Slope stability Recent landslides 1975 DOE-CZA Slope stability Historic landslides2004 KC-DNR&P 1933-60 landslides WRIA9 shoreline2004 KC-DNR&P 1996-97 landslides WRIA9 shoreline2004 BNSF/WRIA8 1996-97 landslides WRIA8 shoreline
Shoretype 2004 CGS Geomorphic character FBE, FB, TZ, AS, ModLandslides 2004 CGS Recent landslides In previous 2-3 yrsToe erosion 2004 CGS Recent toe erosion In previous 2-3 yrs
Coverage & Applicability, Misc.Vertical aerial photography
1936 Walker & Assoc. Historic conditions, landslide mapping WRIA 9 only, stereo pairsPhoto mosaics – WRIA8 & 9 – not georeferencedHistoric conditions, landslide mapping, WRIA8 onlyColor and 1:6000 B&W orthos – 3 ft resolutionCoastal areas only - 1ft pixel King and Snohomish County (no scale)West Point to Alki Point (Wilkes map)Puget Sound Admiralty Inlet (Wilkes map)Cadastral GLO Survey Maps – some digitized in S. end, Reconnaissance of Seattle Harbor and Duwamish BayPlan of Seattle 1855-56Bird’s Eye View of Seattle and Environs (Kroll) perspective
1878 Glover, E. Birds Eye View of City of Seattle (Kroll) perspective drawingSeattle Harbor, Puget SoundCity of Seattle –downtown perspective drawingSeattle to Olympia & Vashon/Maury IslandsSeattle Tidelands, many maps, filed by subarea.Bird’s eye view of Seattle, incl. Smith Cove to AlkiAll WRIA8&9 T-sheets plus descriptive reports 1899; Admiralty Inlet & Puget SoundGeology of Vashon & Maury Islands (landslide and beach Map of part of Seattle Harbor showing SoundingsPreliminary survey of Duwamish Bay, Washington TerritoryAquatic/tidal wetland habitat loss – Elliott Bay (Green/Duw)Cartographic symbol mapping

Historic Conditions MethodsHistoric Bluff Conditions
HSSI = Historic Sediment Source Index
Reach topography, surface geology, landslide history, landscape and net shore-drift context, T-sheets, historic air photos (1936/47)
Index scores convey the relative likelihood that unit was a source of littoral sediment
(Prior to scoring units – modified shores were delineated into segments of homogenous geomorphic character)
University of Washington Special Collections Libraries. Negative No. UW 1682

Historic Conditions Methods: Historic Sediment Supply Index (HSSI)
Score Question Source0-2-4-6 Relative fetch: longest fetch distance measured in GIS
(0=0-<5 mi., 2=5-<10, 4=10-<15-, 6=15+) .USGS 7.5” topo maps, DNR shoreline
0-3-6-9-12 Typical bluff height. First contour must be w ithin 100 ft of Shorezone shoreline 0=0-80 ft, 3=81-120, 6=121-160, 9=161-200, 12=200+ ft.
USGS 7.5” topo maps
0-6 Surface Geology: dominant unit in segment. Unit scores reflect relative quantity of beach-forming material (coarse sand and gravel). 6=Qva; 3=Qls, Qsgo; 2=Qpom, Qtb, Qob, Qvt , 0=Other units**
WADNR-Geology
10 Mapped as Rocky/Eroding/Bluff in T-sheet interpretations by B. Collins? (Rocky bluff and Bluff w ere represent same shore features just referred to earlier/later products)
B Collins, 2005, University of Washington, Rivers History Group
10 1936/47 visual evidence of eroding bluff; including slides, slumping, scarps, trees in intertidal etc.?
Walker and Assoc., KCDNR&P and Snohomish County
5 Recent landslides w ithin 500ft of segment? City of Seattle, KC DNR&P BNSF
5 Older slides (Qls or Uos) w ithin 500 ft of segment? Qls=DNR surface geology; Uos=DOE, CZ Atlas
5 Landslides mapped by CGS w ithin 500 ft of segment? CGS current conditions mapping.
5 Adjacent to Feeder Bluff in CGS current conditions mapping; or Historic Feeder Bluffs?
CGS current conditions mapping
2 Within 500 ft of divergent zone? DOE w ith CGS edits, WA net shore drif t
2 Within 1500 ft of divergent zone? Net shore drif t mapping by DOE (w ith CGS edits)
1 Absence of low elevation backshore? USGS 7.5” topo
• 35 shore segments from current conditions mapping were scored for index calibration
• Following scoring all mod units – data were compared with calibration data and shoretype categories were delineated:
Score HSSI Shoretype0 – 19 Not Feeder Bluff20 – 29 Potential Feeder Bluff30 – 45 Modified Feeder Bluff46 + Modified Feeder Bluff
Exceptional

Data sources: All mapping by Coastal Geologic Services, Inc., Bellingham, WA, 2005.
Base map - Finlayson D.P., Haugerud R.A., Greenberg, H. and Logsdon, M.G. (2000) Puget Sound Digital Elevation Model.
Historic Conditions ResultsHistoric Bluff Conditions
Northern RR/S. Snohomish Co.
LegendBNSF slides (96-97)
96-97 slides
33-60 slides
Old slide
Recent slide
Feeder bluff Exceptional
Feeder bluff
Potential Feeder bluff
NOT Feeder bluff
Feeder bluff Exceptional
Feeder bluff
Transport zone
Accretion shoreform
Modified
Modified - by BNSF RR
No Appreciable Drift

1:24,000Legend
Subarea Boundaries
Current Conditions Shoretypes
Modified
Modified - by BNSF RR
No Appreciable Drift
Historic Conditions Shoretypes (offshore
Feeder Bluff Exceptional
# Drift Cell Boundaries
Potential Feeder Bluff
Feeder Bluff
Transport Zone
Accretion Shoreform
Feeder Bluff Exceptional
Feeder Bluff
NOT Feeder Bluff
Data sources: All mapping by Coastal Geologic Services, Inc., Bellingham, WA, 2005.
Base map - Finlayson D.P., Haugerud R.A., Greenberg, H. and Logsdon, M.G. (2000) Puget Sound Digital Elevation Model.
Historic Conditions ResultsHistoric Bluff Conditions
Northern RR/S. Snohomish Co.

1:24,000Legend
Subarea Boundaries
Current Conditions Shoretypes
Modified
Modified - by BNSF RR
No Appreciable Drift
Historic Conditions Shoretypes (offshore)
Feeder Bluff Exceptional
# Drift Cell Boundaries
Potential Feeder Bluff
Feeder Bluff
Transport Zone
Accretion Shoreform
Feeder Bluff Exceptional
Feeder Bluff
NOT Feeder Bluff
Data sources: All mapping by Coastal Geologic Services, Inc., Bellingham, WA, 2005.
Base map - Finlayson D.P., Haugerud R.A., Greenberg, H. and Logsdon, M.G. (2000) Puget Sound Digital Elevation Model.
Historic Conditions ResultsHistoric Bluff Conditions
Seahurst

Using T-sheets
Gravel or grasslands in backshore Spit or bar morphology Channels, impoundments and
marsh behind beach berm Stream channels, deltas, or valleys
Historic Conditions ResultsHistoric Accretion Shoreforms: Edmonds example

Using Historic Photos
Textures of backshore vegetation
Channels, impoundments and marsh textures behind beach berm
Stream channels or deltas Accumulations of drift logs
>3 logs deep Spit or bar morphology
Historic Conditions ResultsHistoric Accretion Shoreforms: Edmonds example
#
#
#

Using Topo Maps
Spit or bar morphology Backshore platform Channels,
impoundments and marsh behind beach berm
Stream channels, deltas, or valleys
Historic Conditions ResultsHistoric Accretion Shoreforms: Edmonds example

Results of Current ConditionsAccretion Shoreforms
#
#
#
#
#
#
#
####
#
#
##
###
#######
# ##
###
###
###
##
###
#
#
#
Compared to similar past mapping and classification methods on Vashon and Maury Islands……..
Source Year No. UnitsShoreZone 2001 21CommEn Space 2005 20CGS -this study 2005 59
CZA classified Accretion Shoreforms as NF=Not Feeding, F=Feeding, FS=Feeding Substantial
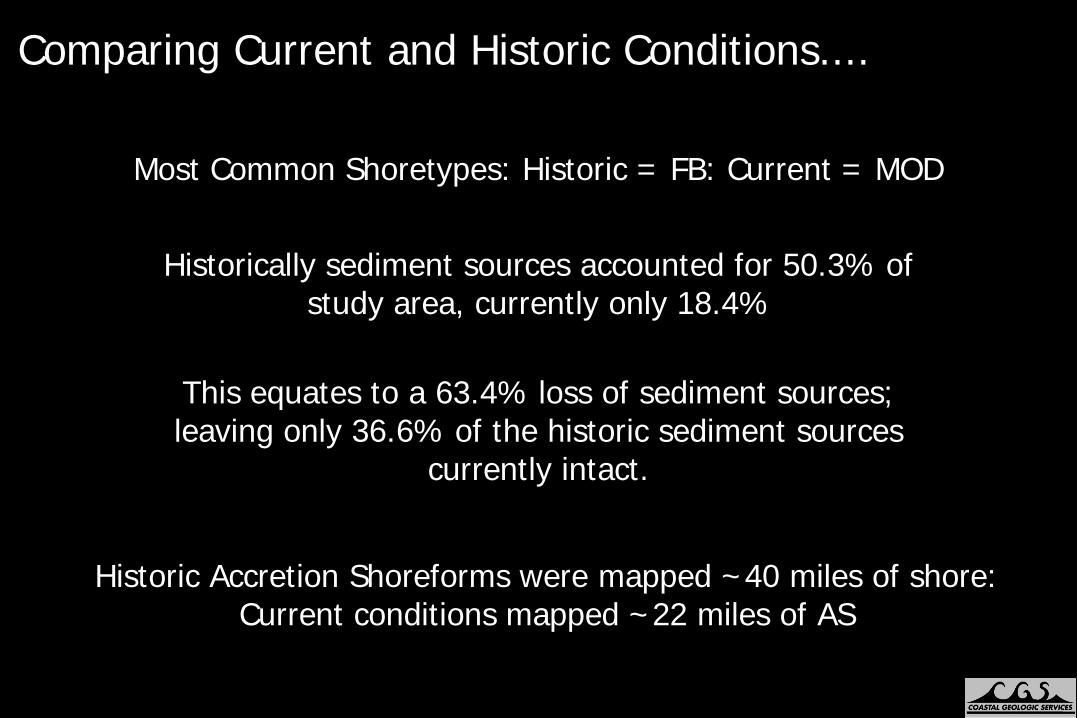
Comparing Current and Historic Conditions....
This equates to a 63.4% loss of sediment sources; leaving only 36.6% of the historic sediment sources
currently intact.
Historically sediment sources accounted for 50.3% of study area, currently only 18.4%
Most Common Shoretypes: Historic = FB: Current = MOD
Historic Accretion Shoreforms were mapped ~40 miles of shore: Current conditions mapped ~22 miles of AS

Restoration and Conservation Prioritization
• All current and historic FBs and FBEs (and Potential FBs) were scored using the HSSI index.
• The highest scoring historic sediment sources (throughout the study area and in each drift cell) were identified as being of high
RESTORATION POTENTIAL.
• The highest scoring current sediment sources (throughout the study area and in each drift cell) were identified as being of high
CONSERVATION POTENTIAL.
Restoration and Conservation prioritization was performed at the unit, drift cell and landscape scale.

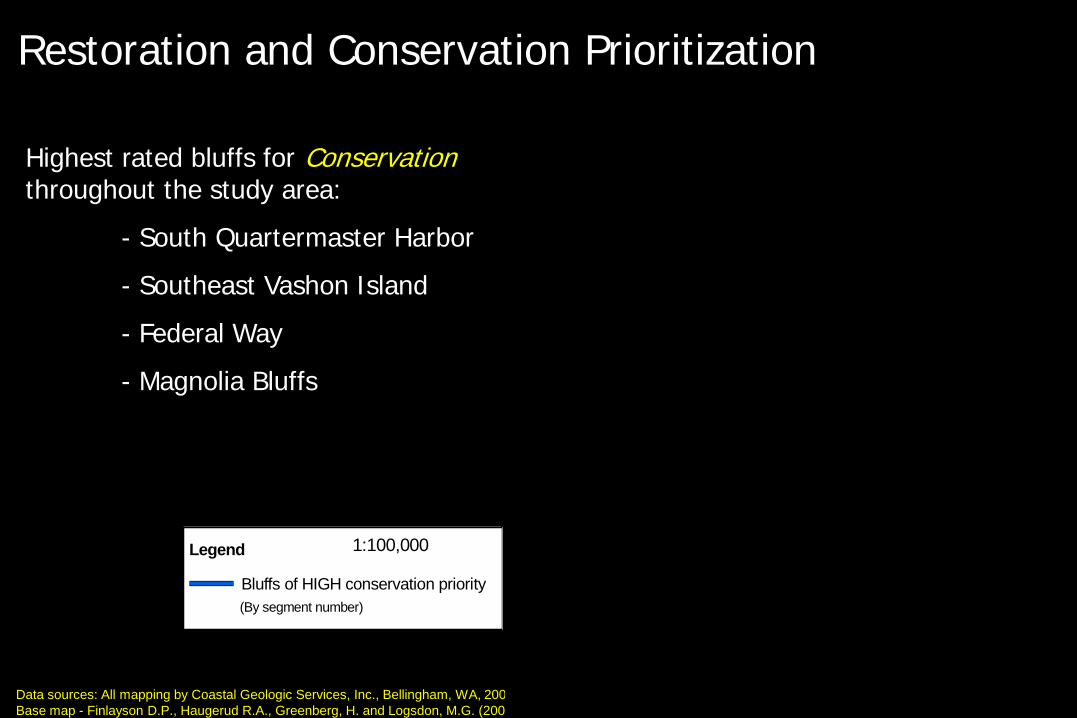
Restoration and Conservation Prioritization
Data sources: All mapping by Coastal Geologic Services, Inc., Bellingham, WA, 2005.
Legend
Bluffs of HIGH restoration priority
1:200,000
(By segment number)
Base map - Finlayson D.P., Haugerud R.A., Greenberg, H. and Logsdon, M.G. (2000) Puget Snd Digital Elev Mod.
Highest rated bluffs for Restoration in study area:
- Northern Railroad sub-area
- Magnolia Bluffs
- Normandy Park to Des Moines
- Southern Quartermaster Harbor
- East Vashon Island
- North of Three Tree Pt
- Inner Quartermaster Harbor
- North side Burton Peninsula
Restoration and Conservation Prioritization
1:100,000
(By segment number)
Legend
Bluffs of HIGH conservation priority
Highest rated bluffs for Conservationthroughout the study area:
- South Quartermaster Harbor
- Southeast Vashon Island
- Federal Way
- Magnolia Bluffs
Data sources: All mapping by Coastal Geologic Services, Inc., Bellingham, WA, 2005.Base map - Finlayson D.P., Haugerud R.A., Greenberg, H. and Logsdon, M.G. (2000) Puget Sound Digital Elevation Model.

Restoration and Conservation PrioritizationDrift cells were ranked by calculating the percent of intact sediment sources (relative to historic conditions) in the cell, then weighting that number by the scores of the individual current and historic sediment source units that make up that drift cell.
Prioritization score =(HFB score * % HFB of total pre-dev. sed source) + (CFB score * % of total pre-dev. sed source)(CFB score * % of total pre-dev. sed source)
Where, CFB= Current Feeder Bluff, HFB=Historic Feeder Bluff.

Conclusions Feeder bluff and accretion shoreform mapping along 121 miles of WRIA 8 & 9 Current and Historic data Mapping provides process-based physical information that’s been lacking Based primarily on new field data collection & not models Data useful for:
- furthering GIS-based nearshore & salmon science- shoreline mgt (long-range & immediate)- restoration and conservation
Synthesis of data from 99 drift cells:
93 miles of historic sediment sources
42 miles of current sediment sources
= 55% loss of nearshore sediment sources
Average loss of (linear extent) of sediment supply: 42%