Embed Size (px)
Citation preview

Presented byBinaya Pasakhala
Assessing Vulnerability of People’s Livelihood in Far-western Nepal: Implications on
Adaptation to Climate Change

Introduction
The earth’s global temperature has increased by about 0.8 °C in a period of 150 years.
Increase in sea level rise, altitudinal shift of vegetation, retreat of glaciers and rise in extreme climatic conditions.
Impacts of climate change will be severe upon developing countries and poor people.

Impact of climate change in
Nepal • Rise in Temperature
(In Nepal, temperature rise of about
0.06ºC recorded between 1977-94 )
Melting of Glaciers Floods Drought Fire
Introduction

Problem Statement
Need for Adaptation
Decline in agricultural production
Damages and losses of infrastructure and property
Loss of lives

General objective : To assess vulnerability of people’s livelihood
in Far-western, Nepal.
Specific objectives
• To document trend of change of temperature and
precipitation
• To assess livelihood assets of local people
• To examine factors contributing to vulnerability of households
to climate variability and change
• To examine existing measures adopted for coping with climate
variability and change
Objectives

Result Interpretation
Literature Review
Research Design
Problem Statement
Objective 2• Primary data:
Household questionnaire survey, Key Informant Survey
• Frequency, Percentage, t-tests, Weighted Average Index
Objective 1
• Secondary data from Department of Hydrology and Meteorology
• Trend Analysis
Objective 3• Primary data:
Household questionnaire survey, Key Informant Survey, Group Discussion
• Frequency, Percentage, AHP, Correlation and Multiple regression
Objective 4• Primary data:
Household questionnaire survey, Key Informant Survey, Group discussion
• Frequency and Percentage
Conclusion and Recommendation
Data Collection
Study area Selection
Sample Design
Research Methodology

• Situated in Plain area
• Flood affected in 2007, 2008, 2009
Sample Size: 98
• Situated in Siwalik hill
• Drought affected in 2008
Sample Size: 87
• District in Far-western region of Nepal
• Area- 3235 sq km.• Climate- Tropical in
Plains and sub-tropical in Siwalik range
Study Area

Flood Affected Areas
Pawera
Basauti
1
95
78
46
38
2 No damage
Loss of crops
Damage to house and property
Loss of Livestock
Loss of agricul-ture land
Injury
Damages due to climatic hazards

Drought Affected Area
Godavari
4
89
48
31
20
No damage
Loss of crops
Damage to house and property
Loss of Livestock
Loss of agricul-ture land
Injury
Damages due to climatic hazards

Trend of Change in Temperature
Number of cool nights decreased by 10 nights during 1977 and 2008, which was statistically significant.

Trend of Change in Rainfall
Number of consecutive dry days increased by 60 days during 1977 and 2008, which was statistically significant.

Trend of Change in Rainfall

Jan Feb Mar Apr May Jun Jul Aug Sep Oct Nov Dec0
100
200
300
400
500
600
1977-86
1987-96
1998-06
Monthly distribution of rainfall in decades
Trend of Change in Rainfall

Perception on change in temperature
No change Increase Decrease0
10
20
30
40
50
60
70
80
90
100
Flood af-fected area
Drought af-fected area
No change Increase Decrease0
10
20
30
40
50
60
Flood af-fected area
Drought af-fected area
Perception on change in amount of rainfall
Perception on Trend of Climate
Deforestation was perceived as major reason for increasing temperature and change in rainfall pattern

• Possession of livelihood assets was statistically different between two areas
• Access to road, market and linkages with external agencies were better in flood affected area than in drought affected area
• Agriculture was major on-farm occupation and labor was major off-farm occupation of households in both study areas
• Failure of crops have caused shift in livelihood strategy (i.e. from agriculture to labor)
Livelihood Assessment

Flood affected area Drought affected area
P
S
FH
N
0
0.5
1
High
Medium
Low
P
S
FH
N
0
0.5
1
High
Medium
Low
P= Physical capital, S= Social capital, F= Financial capital, H= Human capital and N= Natural capital
Livelihood Assessment
No statistical significant difference between group of respondents (on basis of ethnicity and caste) in both areas.

Indicators of adaptive capacity
Variables Weights Consistency Index (CI)
Physical Capital
Land Holding 0.54 Maximum Eigen value = 4.11 CI = 0.03
Availability of Irrigation facility
0.23
Livestock 0.15Information Sources 0.08
Human CapitalTrainings attended 0.54 Maximum
Eigenvalue = 3CI = 0.04
Educated Percent 0.30Labor aged members 0.16
Financial Capital
Income sources 0.44 Maximum Eigenvalue = 4.26CI = 0.086
Annual income level 0.29Savings 0.15Access to credit 0.12
Social CapitalSocial harmony 0.54 Maximum
Eigenvalue = 3.09CI = 0.04
Membership to institutions 0.30Participation 0.16
Natural CapitalCrop diversity 0.50 Maximum
Eigen value = 2CI = 0
Adoption of new crop varieties 0.50
Vulnerability Assessment

Indicators of exposure and sensitivity
Rating scale
0.33 (low) 0.67 (medium) 1 (high)
Number of damages 1 or 0 2 3
Prior experience of extreme climatic events No - Yes
Food insecurity 8-12 months 4-8 monthsLess than 4
months
Proportion of on-farm income
Less than 30 percent 30-60 percent Above 60 percent
Distance from riverAbove 400
meters 100-400 metersLess than 100
meters
Vulnerability = (adaptive capacity) – (sensitivity + exposure)(Deressa et al., 2008)
Vulnerability Assessment

28
27
45
Low Medium High
Flood affected area
6
20
74
Low Medium High
Drought affected area
Percentage of households into 3 vulnerable groups
Vulnerability Assessment
Low Medium High
Vulnerability Score Range
1 0.05 -0.09 -1

Low Medium High0
5
10
15
20
25
30
35
40
45
50
Tharu
Brahmin/Chhetri
Low Medium High0
10
20
30
40
50
60
70
80
90Brahmin/ChhetriDalits
Flood affected area Drought affected area
Percentage of respondents’ group into 3 vulnerable groups
Vulnerability Assessment

Distance from river and annual income was identified as major factors affecting vulnerability of households in flood affected area
Prior experience of climatic hazard and annual income were identified as major factor affecting vulnerability of households in drought affected area
Factors affecting Vulnerability of households

Autonomous Adaptation Measures
Water pumps and natural springs
Change in cropping calendar
Raising house storey and foundation
Raised silos, steel silos
Adoption of improved crop varieties
Out migration
Change in climate was not singular reason for adoption of improved crop varieties.

Adaptation Measures
Early warning system
Evacuation shelter houses
Raised water hand pumps
River training
River bed cultivation
Planned adaptation measures: supported by external agencies in flood affected area
Barriers to adaptation: Lack of governmental and external agencies
supportLack of resources, Lack of technical knowledge, Lack of awareness.

Non-significant increasing trend of temperature and significant increase in dry days and decline in winter rain during 1997-2007.
Vulnerability of households to climate change is higher in drought affected area (Siwalik hills) than in flood affected area (plains).
Vulnerability between groups of respondent were insignificant.
Distance from river was major factor influencing vulnerability of households to climate variability and change in flood affected area.
Similarly, prior experience of climatic disaster was major factor influencing vulnerability of households to climate variability and change in drought affected area.
Communities have adopted adaptation measures in response to climatic hazards. Adaptation measures insulate households from negative impacts of climate hazards.
Conclusions

Empowerment and awareness raising of local people
Construction of reservoirs and irrigation facility, river training activities, installing early warning system
Introducing microfinance schemes
Inclusion of institutional arrangements and policies for vulnerability assessment
Recommendations
Government and NGOs
Researchers
Households Adoption of drought hardy and flood
hardy crop varieties Diversifying livelihood strategies
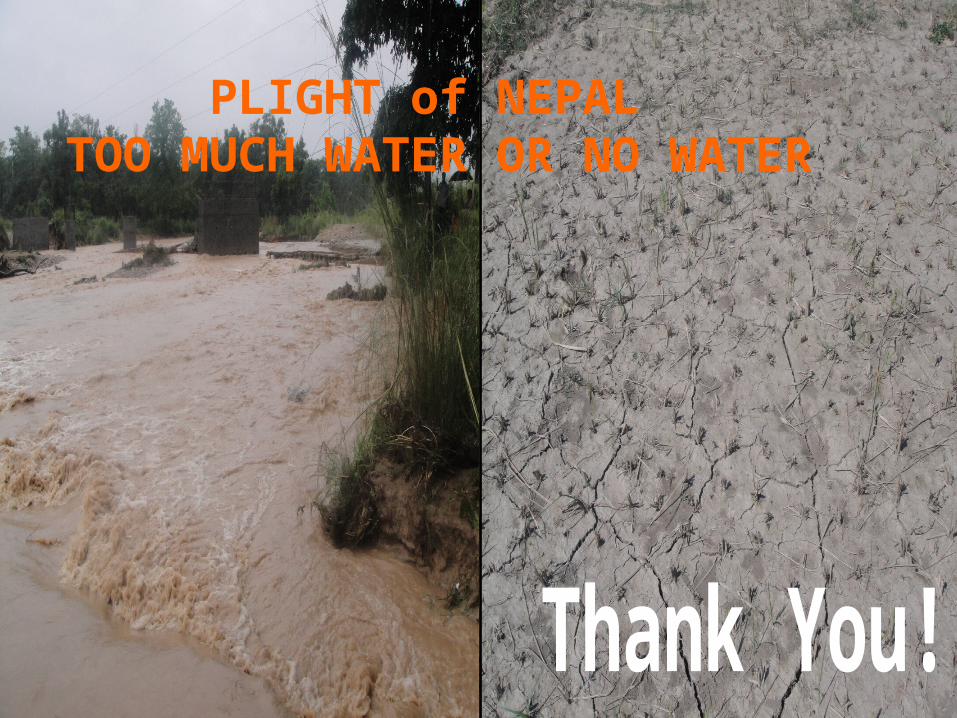
PLIGHT of NEPAL TOO MUCH WATER OR NO WATER