Embed Size (px)
Citation preview

P R E S E N T E D B Y D A L E C OX
I N T E R N A T I O N A L S C H O O L O F B E I J I N GL E H I G H U N I V E R S I T Y
W I T H
C O U N C I L F O R I N T E R N A T I O N A L S C H O O L SI N T E R N A T I O N A L S C H O O L S E R V I C E S
S E A R C H - A S S O C I A T E S
A Global Study of International Teacher Recruitment

Essential Questions
What is successful recruiting?
What are teachers looking for? What are the
implications of that?
What does the process look like in 2011-12?
What trends/changes will occur in the next five
years?
How does this information help a school improve
its recruiting efforts?

Activity One
What are the changes and trends in recruiting?

Part I: Demographic Profile of Candidates
Gender
41%
59% Male Female
n = 1,543

Age
21 -25 26-30 31-35 36-40 41-45 46-50 51-55 56-60 61-64 65+0%
2%
4%
6%
8%
10%
12%
14%
16%
18%
20%
n = 1,543
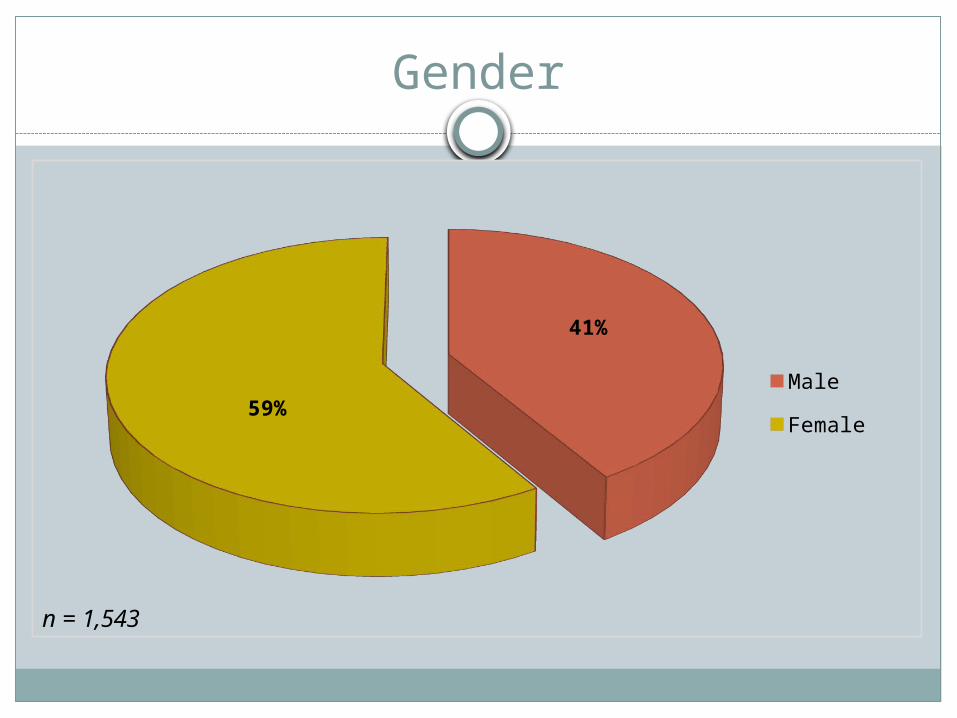
Years of Full-time Teaching Experience
1-5 years 6-10 years 11-15 years 16-20 years 21-25 years 26-30 years 31-35 years 36-39 years 40 and more years
0%
5%
10%
15%
20%
25%
30%
n = 1,543

Years of Full-time Overseas Teaching Experience
1-5 years 6-10 years 11-15 years 16-20 years 21-25 years 26-30 years 31-35 years0%
5%
10%
15%
20%
25%
30%
35%
40%
45%
50%
n = 1,543

Nationality
49%
12%14%
7%
4%15%
USCandadianUKAustralianNew ZealandOther
n = 1,543

Dependent Children
29%
71% Yes No
n = 1,543
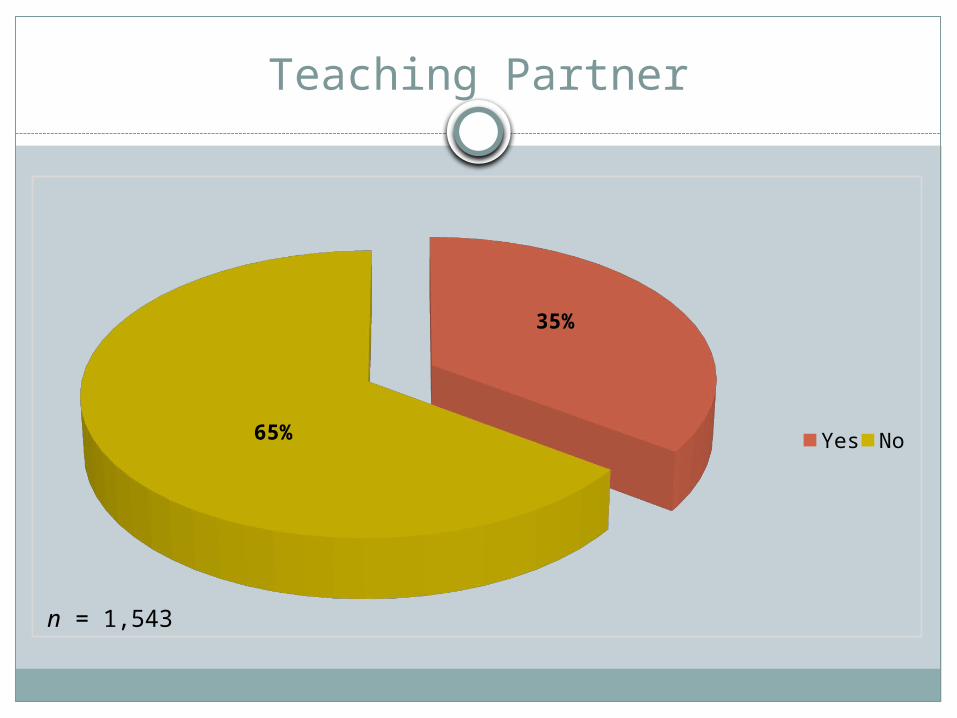
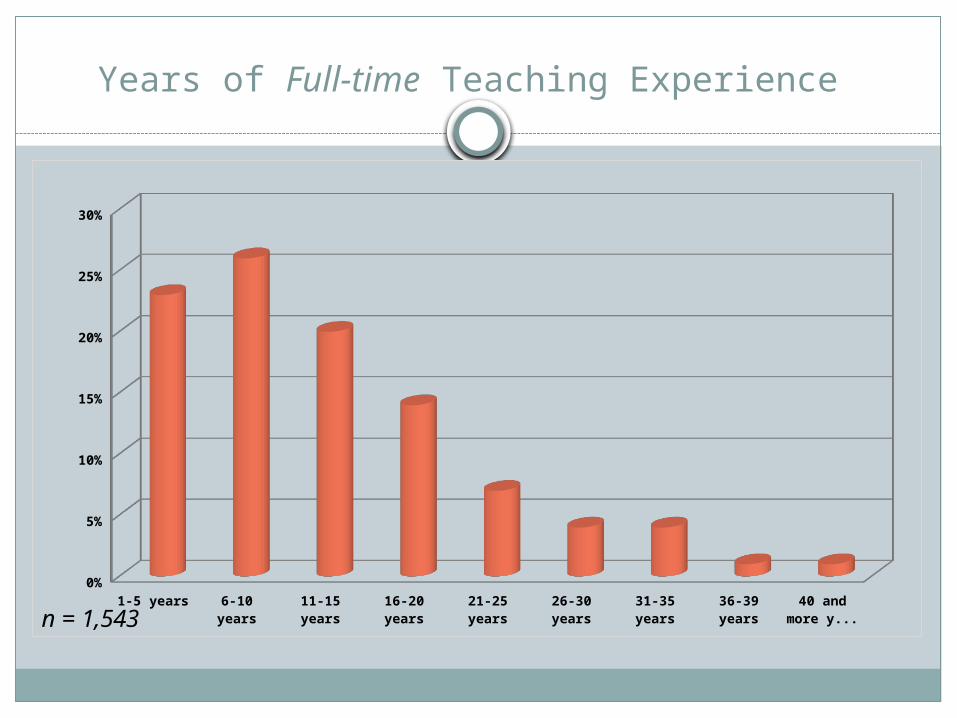
Teaching Partner
35%
65%Yes No
n = 1,543

Preferred Teaching Level
31%
18%27%
25%
Elementary
Middle School
High School
High School IB or AP
n = 1,543

Part II: The Recruiting Process

Total Recruiting Agency Registrations
68%
26%
7%
One
Two
Three or more
n = 1,543

Job Fairs Attended
15%
76%
8%
1%
None
One
Two
Three or more
n = 646

Completed Fair Process
69%
31%
Yes
No
n = 782

Reasons for Not Completing Full Fair Process
5%17%
50%
28%Chose not to go interna-tional
No job match found
Hired before fair/directly
Other
n = 259

Targeted Specific Regions
72%
28%
Yes
No
n = 1,543

First and Second Choice Regions
7%
36%
28%
11%
5%11%
3%
AfricaAsia-Pacific EuropeMiddle EastNorth Amer-icaSouth Amer-icaOther
n = 1,543

Employed in Preferred Region
67%
33%
Yes
No
n = 709

Employed at Preferred School
48%52%
Yes No
n = 709

Activity Two
What characteristics of schools and jobs are most
influential in candidate choices?

Part III: Candidate Perceptions of Schools/Jobs

Underlying Factors in the Recruiting Process
Seven underlying factors (in order of strength of influence)
1. Relationship with school leadership2. External work conditions3. Professional satisfaction4. Personal well-being5. Professional growth6. Compensation and career advancement7. Wanderlust (the desire to travel/explore)
n = 1,543

Years of Full-time Teaching Experience
1-5 years 6-10 years 11-15 years 16-20 years 21-25 years 26-30 years 31-35 years 36-39 years 40 and more years
0%
5%
10%
15%
20%
25%
30%
n = 1,543

Years of Full-time Overseas Teaching Experience
1-5 years 6-10 years 11-15 years 16-20 years 21-25 years 26-30 years 31-35 years0%
5%
10%
15%
20%
25%
30%
35%
40%
45%
50%
n = 1,543

Less Overseas Experience: Variables valued more than experienced teachers
Opportunities for travel and cultural exploration* Availability of resources and materials/equipment for doing
job*
Safety of environment*
Social relationships with colleagues*
General work conditions*
Opportunity to make a difference in the lives of others*
Job description or responsibilities
Classroom resources
Opportunities for professional development
Opportunities for professional advancement or promotion
Job security
n = 1,543 *Significant at .001 level

More Overseas Experience: Variables valued more than those with less experience
Benefits (e.g. health insurance, retirement)* Salary* Influence over workplace policies and
practices* Support from administrators Employment for spouse
n = 1,543 *Significant at .001 level

Stages of the Recruiting Process
At the time of job decision, responses to
nearly all variables were lower than at the beginning of the process.
One variable tended to remain the same or increase at the time of job decision:
perception of how things are run at the school.

Dependents
Variables valued significantly more by those without dependents: Social relationships with colleagues* Making a difference for others* Travel and cultural exploration* How things are run at the school* Job description and responsibilities Sense of accomplishment Resources and materials Autonomy in classroom General work conditions Intellectual challenge Learning from colleagues Support from administrators
Variables valued significantly more by those with dependents: Benefits* Employment for partner* Salary Balancing personal life and work Security and safety in host country
n = 1,543 *Significant at .001 level

Gender
Variables valued significantly more by males: Employment for partner*
Variables valued significantly more by females (in order of strength of difference) Social relationships with colleagues* Resources and materials--general* Work conditions* Travel and cultural exploration* Administrative respect for teachers* Classroom resources* Job description* Safety of environment* Personal security and safety in host country* Manageability of workload Job security Sense of personal accomplishment Support from administrators Making a difference for others Professional advancement and promotion Intellectual challenge Class size The way things are run at the school Ability to balance personal life and work Autonomy over classroomn = 1,543 *Significant at .001 level

Partner
Variables valued significantly more by those with a partner:
Employment for partner*
Variables valued significantly more by those without a partner:
Social relationships with colleagues Sense of personal accomplishment Classroom resources Travel and cultural exploration Performance evaluation procedures Intellectual challenge
n = 1,543 *Significant at .001 level

Preferred Teaching Level
No patterns of difference, except candidates preferring AP/IB positions
Variables valued significantly more by those preferring AP and IB teaching: Teaching assignment/grade level
Variables valued significantly less by those preferring AP and IB teaching: Social relationships with colleagues Resources and materials for doing the job Job security Travel and cultural exploration Personal security and safety of environment
n = 1,543

Activity Three
What are the implications for recruiting at your school?

Part IV: Research on International School Teacher Turnover

NESA Region Study
What…? 248 teachers in NESA schools (2009)
Average turnover rate in 22 NESA schools was 17%, ranging
from 0% to 60%
Strongest correlate in retention was supportive head of schoolOther correlates:
Age
Satisfaction with salary
Mancuso, S., Roberts, L., & White, G.P. (2010). Teacher retention in international schools: The key role of school leadership. Journal of Research in International Education, 9, 306-323.

CIS Study
What variables most influential in turnover decisions?
281 teachers from CIS database (2007)
Administrative leadership
Compensation
Personal characteristics
Odland, G., & Ruzicka, M. (2009). An investigation into teacher turnover in international schools. Journal of Research in International Education, 8, 5-29.

Tanganyika Case Study
What recruitment and retention factors influence international teacher employment decisions?
(To be added…)
Wood, P.D. (2007). Factors affecting faculty turnover at an international school. Unpublished master’s thesis, University of Bath, Bath,
United Kingdom.

Part V: Implications

What does it mean?
The relationship with school leaders is critical, especially for closing the deal
Differentiated approaches to recruitment make sense
Hiring prior to fairs is a significant trendWhat attracts a candidate and what closes
the deal are not the sameExperience changes teacher priorities in
recruitment: personal vs. career focusSalary and benefits are “pass/fail” criteria?

Studies of International Teacher Recruitment and Turnover
Cox, D. (2011). A global study of international teacher recruitment. Unpublished doctoral dissertation, Lehigh University, Bethlehem, PA.
Hardman, J. (2001). Improving recruitment and retention of quality overseas teachers. In S. Blandford, & M. Shaw (Eds.), Managing International Schools (pp. 123-135). New York: Routledge.
Mancuso, S., Roberts, L., & White, G.P. (2010). Teacher retention in international schools: The key role of school leadership. Journal of Research in International
Education, 9, 306-323.
Odland, G., & Ruzicka, M. (2009). An investigation into teacher turnover in international schools. Journal of Research in International Education, 8, 5-29.
Wood, P.D. (2007). Factors affecting faculty turnover at an international school. Unpublished master’s thesis, University of Bath, Bath, United Kingdom.
Author contact for additional information about this study: [email protected]