Embed Size (px)
Citation preview
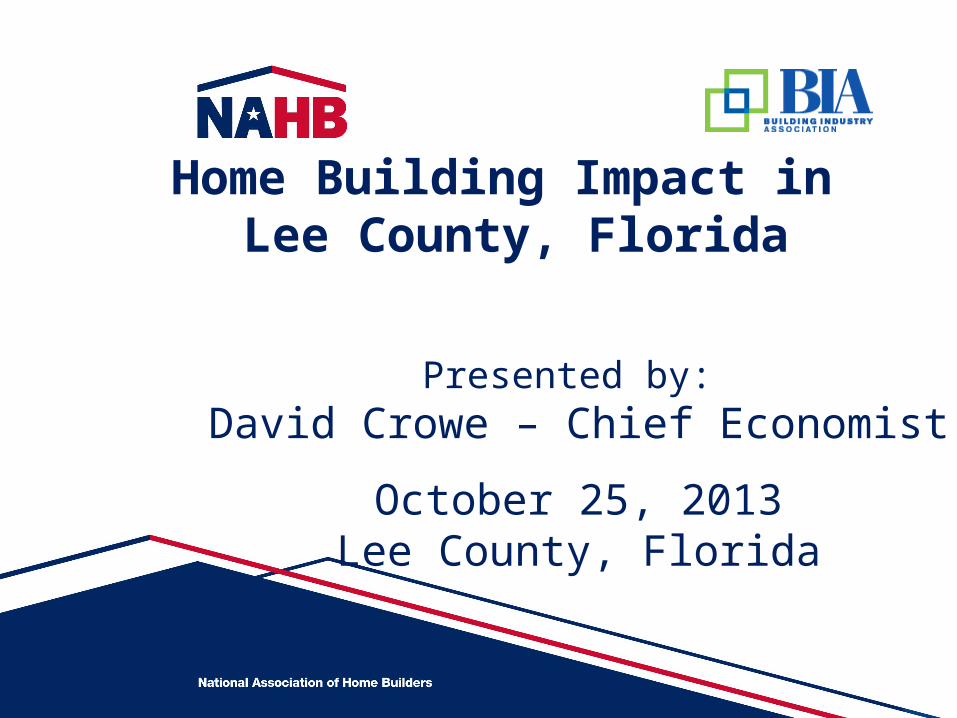
Presented by: David Crowe – Chief Economist
October 25, 2013Lee County, Florida
Home Building Impact in Lee County, Florida
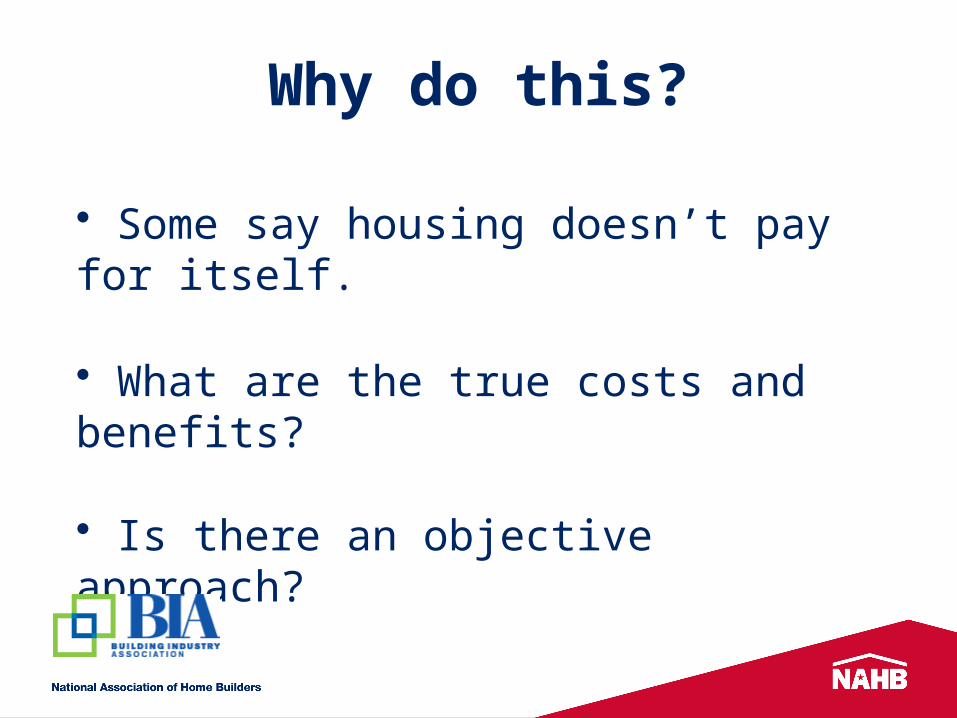
Why do this?
• Some say housing doesn’t pay for itself.
• What are the true costs and benefits?
• Is there an objective approach?
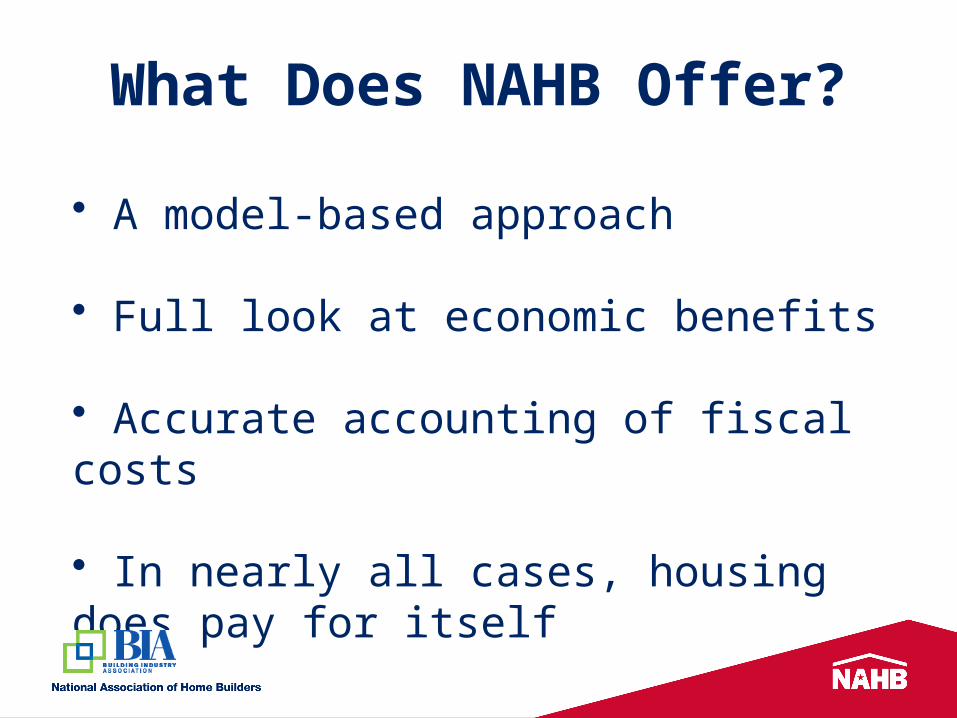
What Does NAHB Offer?
• A model-based approach
• Full look at economic benefits
• Accurate accounting of fiscal costs
• In nearly all cases, housing does pay for itself
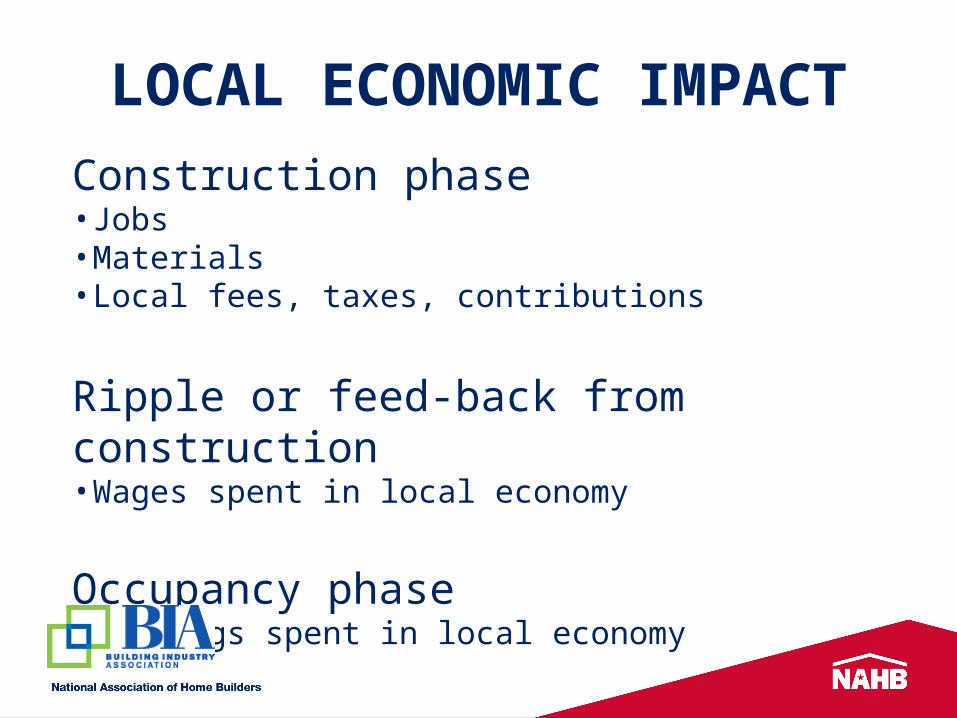
LOCAL ECONOMIC IMPACTConstruction phase
• Jobs• Materials• Local fees, taxes, contributions
Ripple or feed-back from construction• Wages spent in local economy
Occupancy phase• Earnings spent in local economy
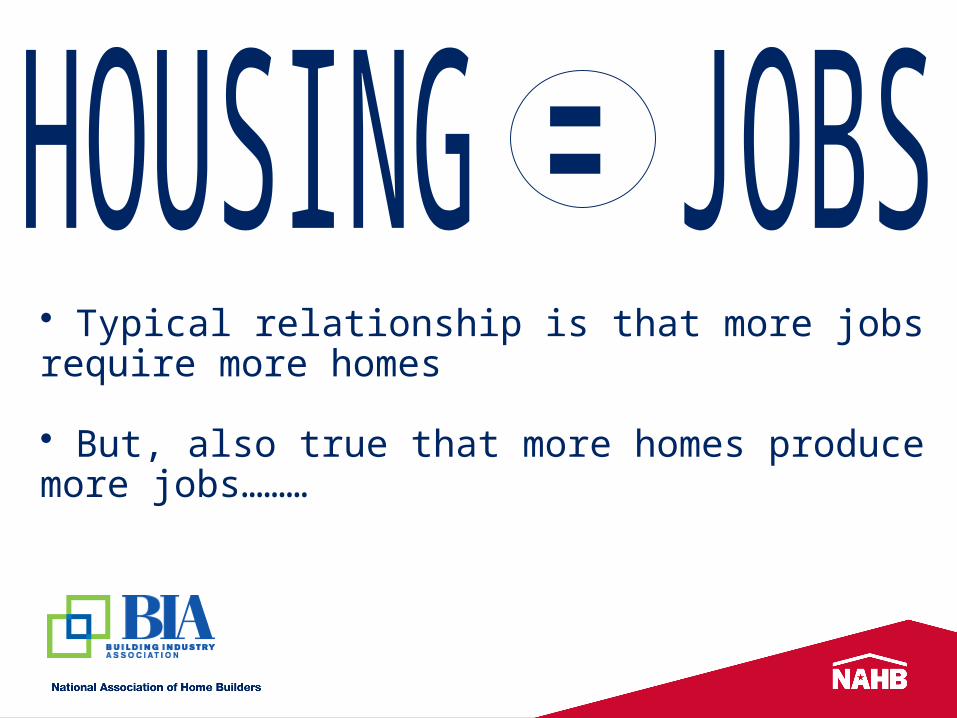
• Typical relationship is that more jobs require more homes
• But, also true that more homes produce more jobs………
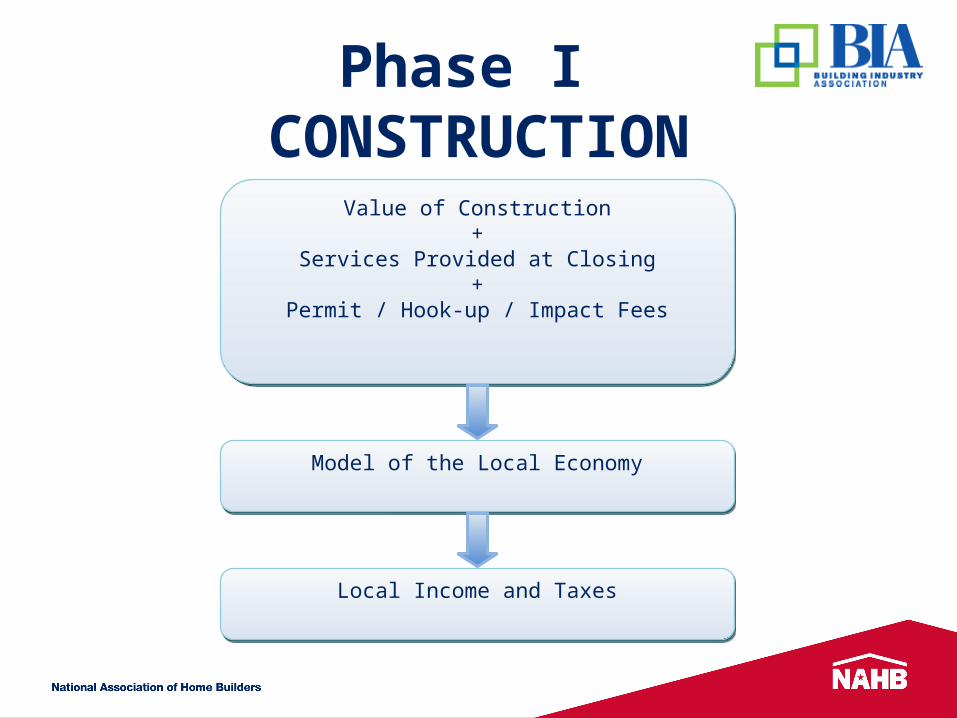
Phase I CONSTRUCTION
Value of Construction+
Services Provided at Closing+
Permit / Hook-up / Impact Fees
Value of Construction+
Services Provided at Closing+
Permit / Hook-up / Impact Fees
Model of the Local EconomyModel of the Local Economy
Local Income and TaxesLocal Income and Taxes
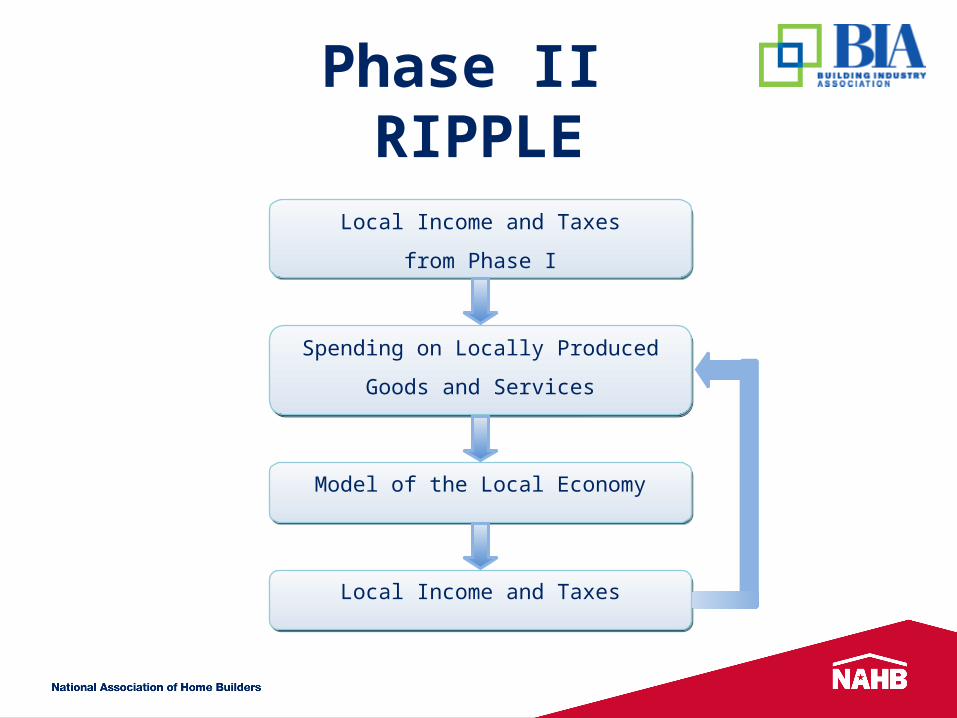
Phase II RIPPLE
Spending on Locally Produced
Goods and Services
Spending on Locally Produced
Goods and Services
Model of the Local EconomyModel of the Local Economy
Local Income and TaxesLocal Income and Taxes
Local Income and Taxes
from Phase I
Local Income and Taxes
from Phase I
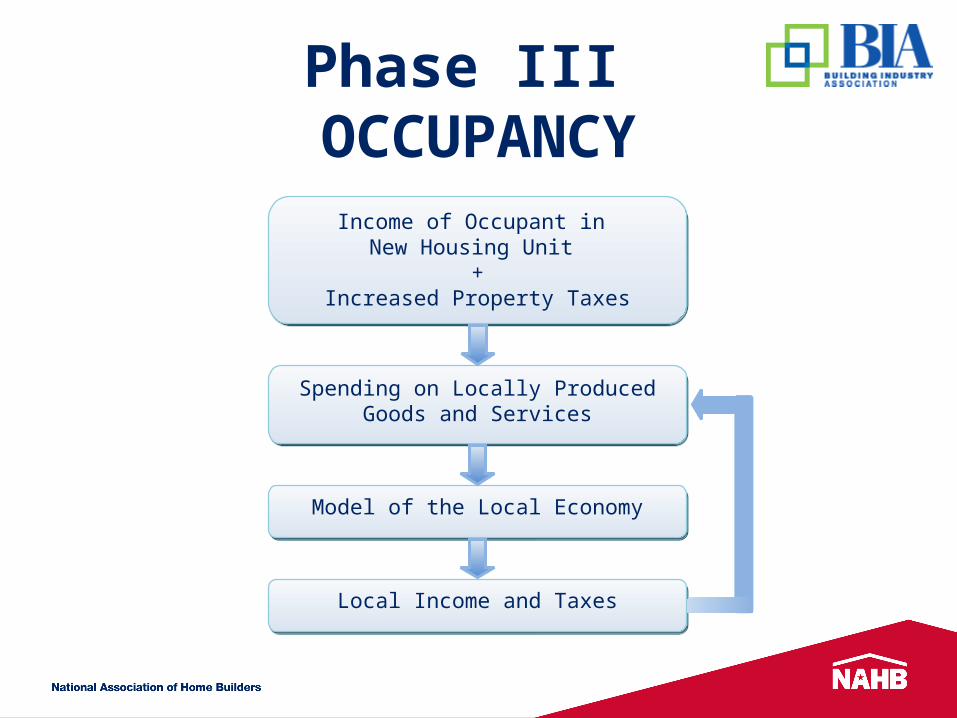
Phase III OCCUPANCY
Spending on Locally ProducedGoods and Services
Spending on Locally ProducedGoods and Services
Model of the Local EconomyModel of the Local Economy
Local Income and TaxesLocal Income and Taxes
Income of Occupant in New Housing Unit
+Increased Property Taxes
Income of Occupant in New Housing Unit
+Increased Property Taxes
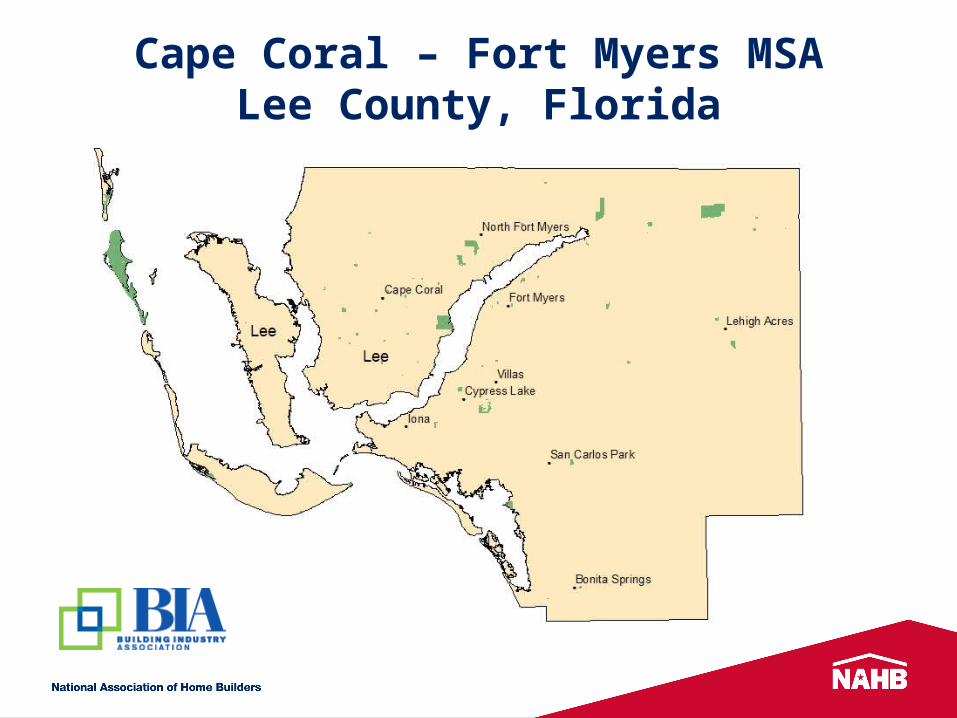
Cape Coral – Fort Myers MSALee County, Florida
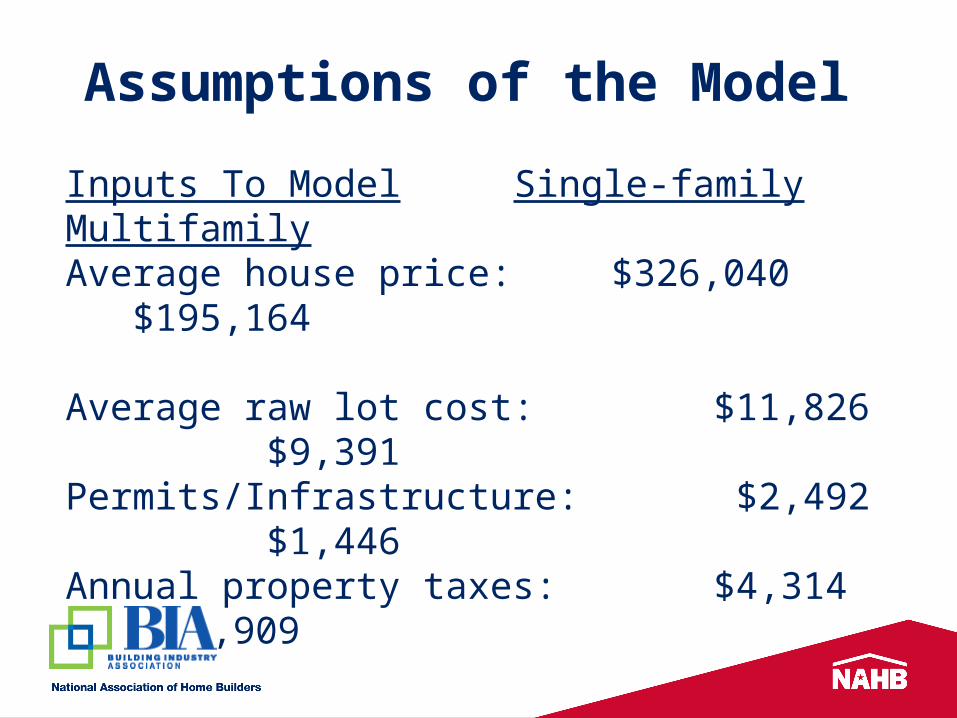
Assumptions of the Model
Inputs To Model Single-family MultifamilyAverage house price: $326,040 $195,164
Average raw lot cost: $11,826 $9,391Permits/Infrastructure: $2,492 $1,446 Annual property taxes: $4,314
$2,909
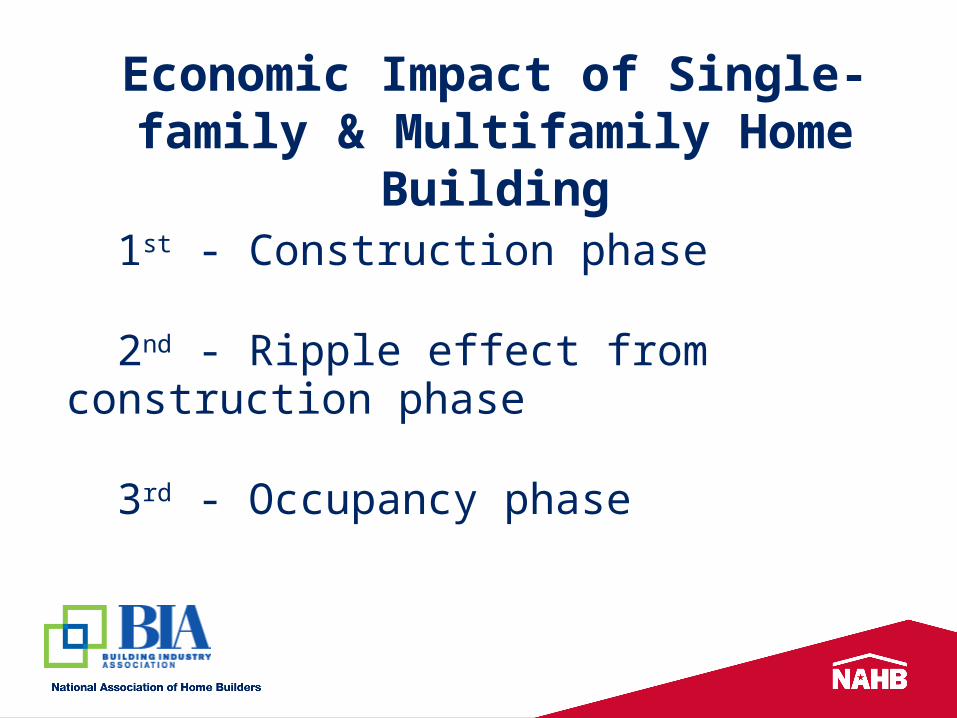
Economic Impact of Single-family & Multifamily Home
Building 1st - Construction phase
2nd - Ripple effect from construction phase
3rd - Occupancy phase
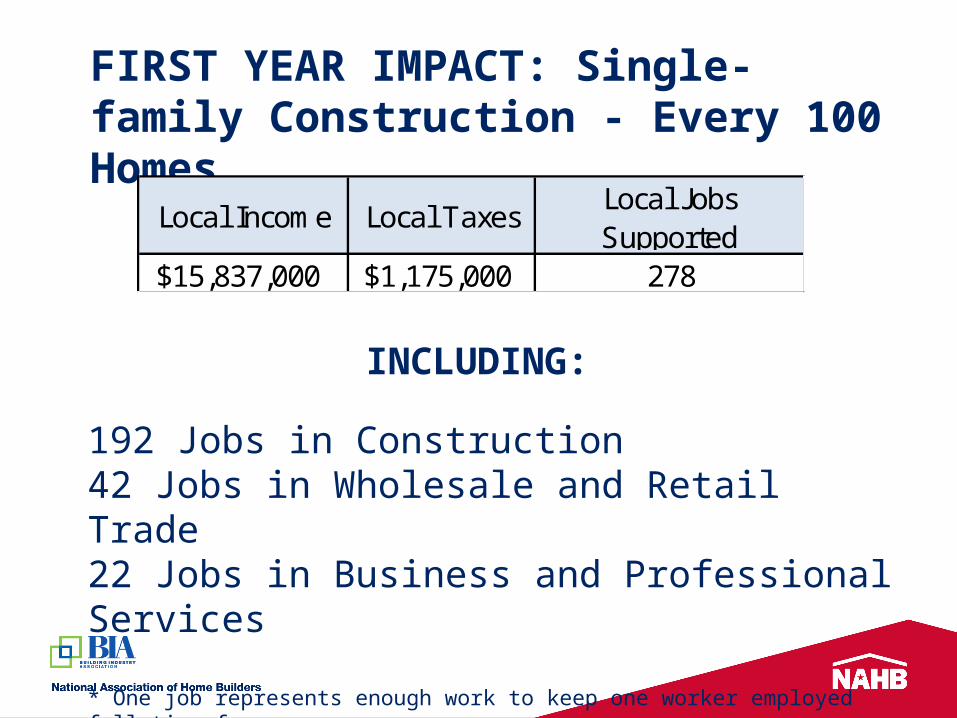
FIRST YEAR IMPACT: Single-family Construction - Every 100 Homes
INCLUDING:
192 Jobs in Construction42 Jobs in Wholesale and Retail Trade22 Jobs in Business and Professional Services
* One job represents enough work to keep one worker employed full-time for a year.
Local Income Local TaxesLocal Jobs Supported
$15,837,000 $1,175,000 278
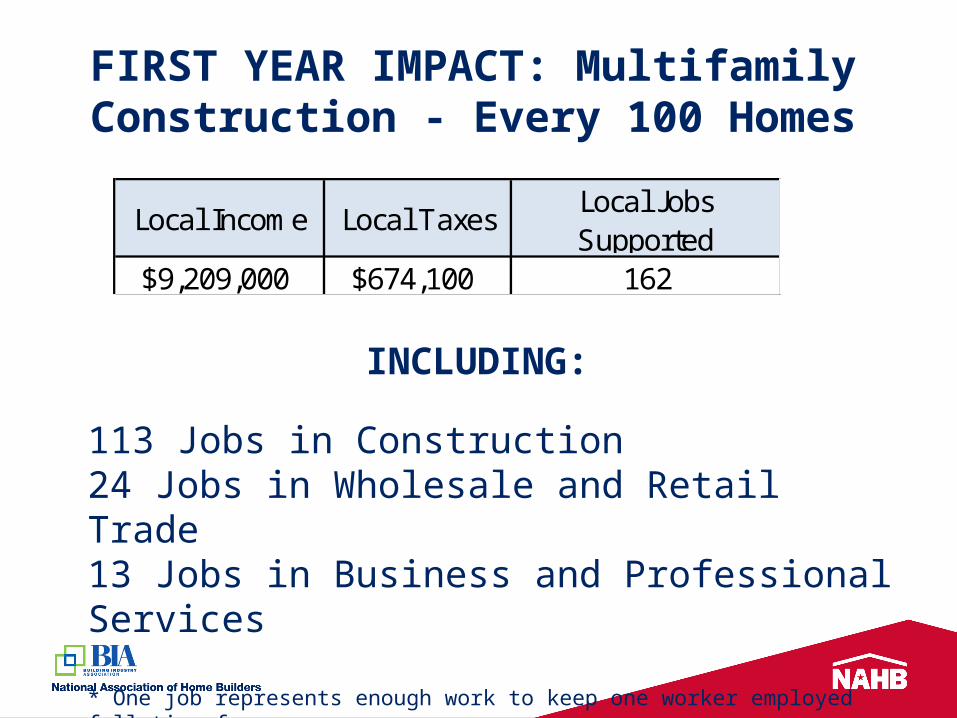
FIRST YEAR IMPACT: Multifamily Construction - Every 100 Homes
INCLUDING:
113 Jobs in Construction24 Jobs in Wholesale and Retail Trade13 Jobs in Business and Professional Services
* One job represents enough work to keep one worker employed full-time for a year.
Local Income Local TaxesLocal Jobs Supported
$9,209,000 $674,100 162
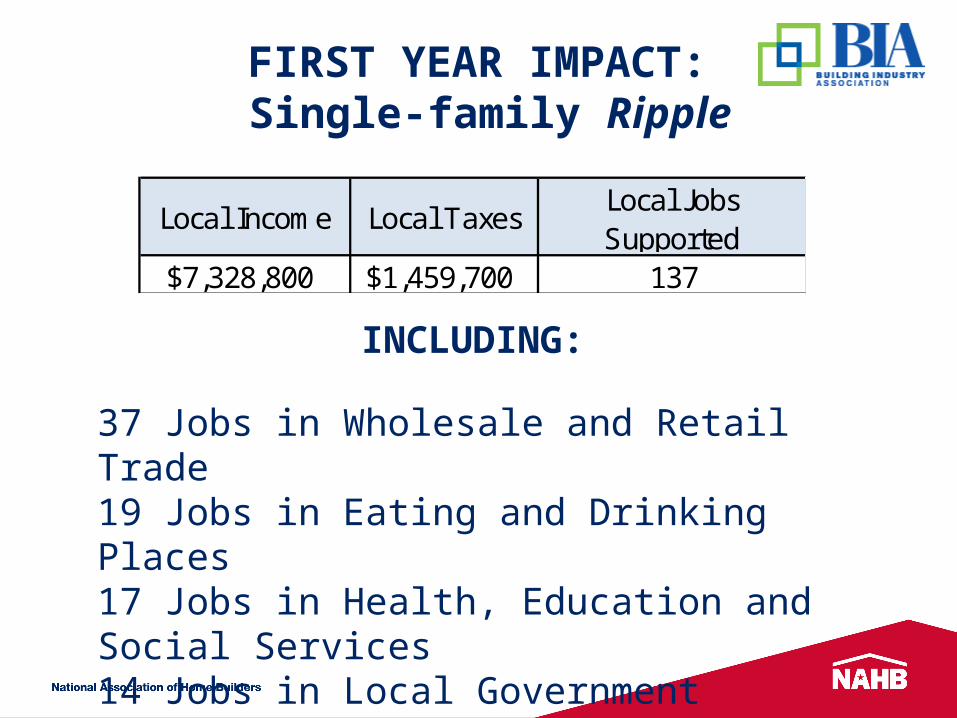
FIRST YEAR IMPACT: Single-family Ripple
INCLUDING:
37 Jobs in Wholesale and Retail Trade19 Jobs in Eating and Drinking Places17 Jobs in Health, Education and Social Services 14 Jobs in Local Government
Local Income Local TaxesLocal Jobs Supported
$7,328,800 $1,459,700 137
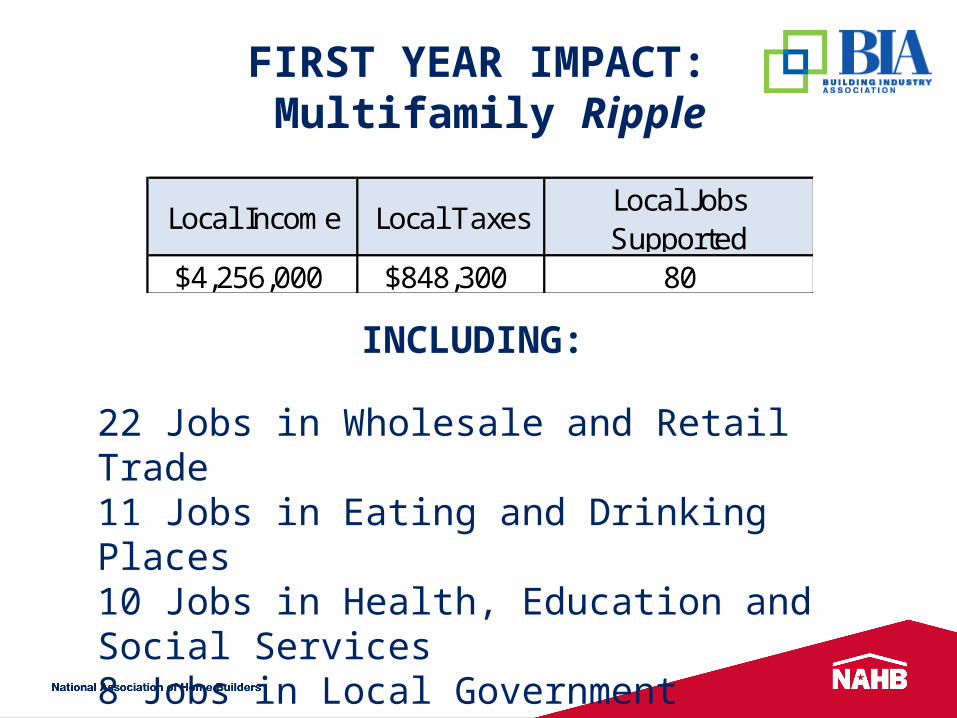
FIRST YEAR IMPACT: Multifamily Ripple
INCLUDING:
22 Jobs in Wholesale and Retail Trade11 Jobs in Eating and Drinking Places10 Jobs in Health, Education and Social Services 8 Jobs in Local Government
Local Income Local TaxesLocal Jobs Supported
$4,256,000 $848,300 80
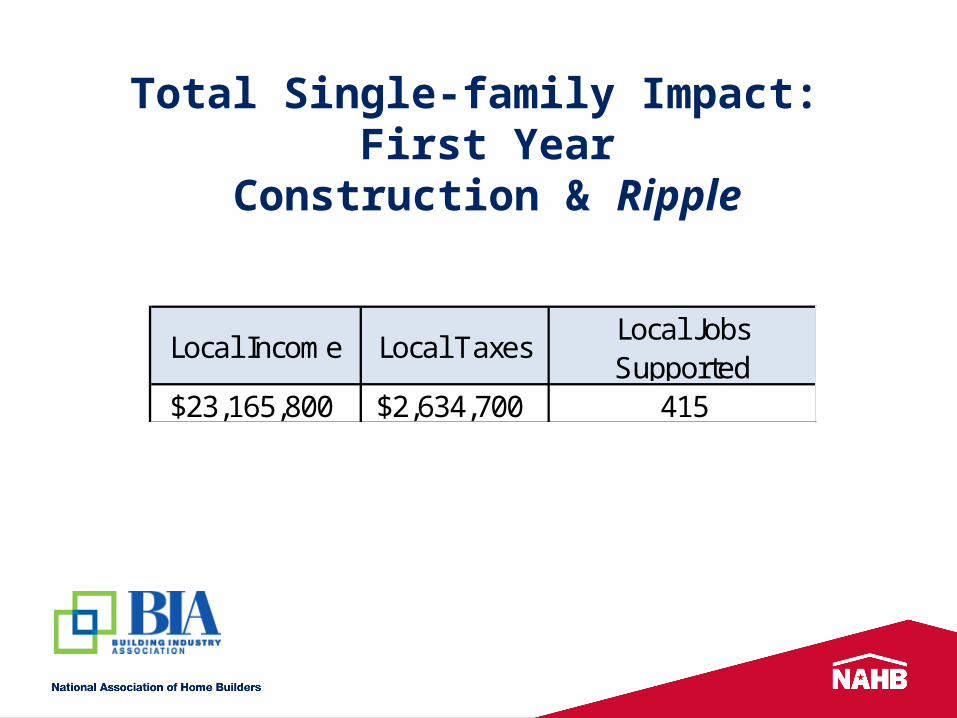
Total Single-family Impact: First Year
Construction & Ripple
Local Income Local TaxesLocal Jobs Supported
$23,165,800 $2,634,700 415
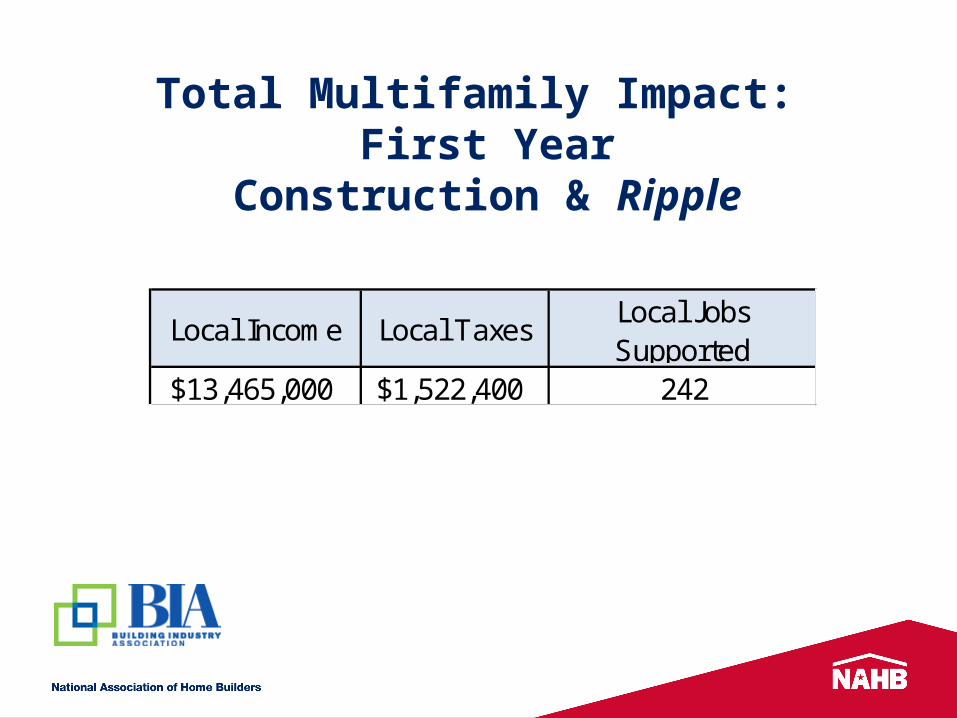
Total Multifamily Impact: First Year
Construction & Ripple
Local Income Local TaxesLocal Jobs Supported
$13,465,000 $1,522,400 242
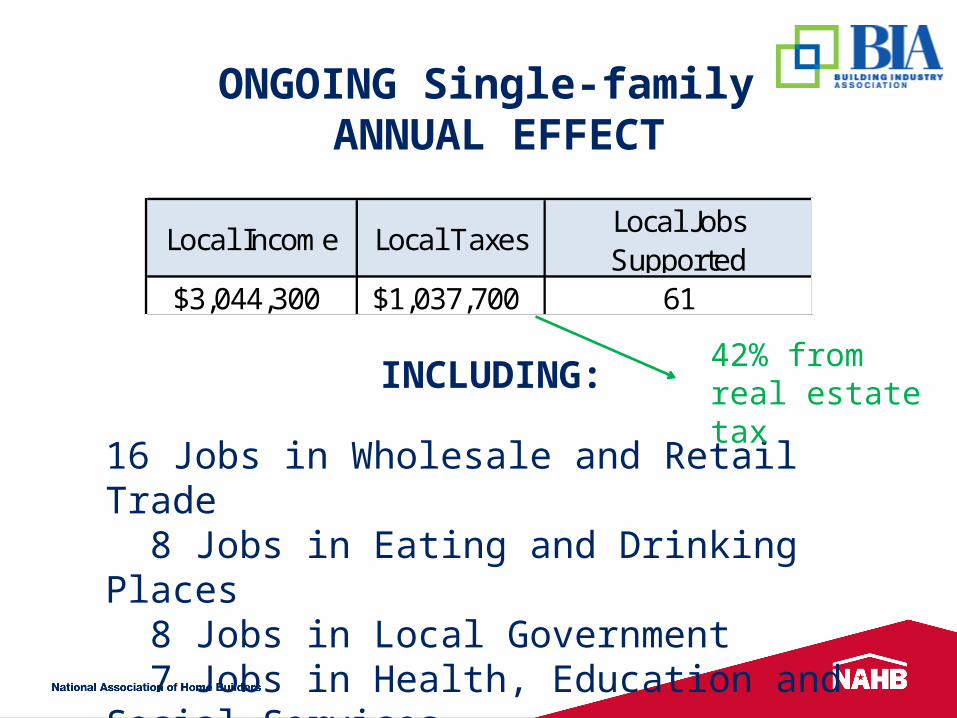
ONGOING Single-family ANNUAL EFFECT
INCLUDING:
16 Jobs in Wholesale and Retail Trade 8 Jobs in Eating and Drinking Places 8 Jobs in Local Government 7 Jobs in Health, Education and Social Services
Local Income Local TaxesLocal Jobs Supported
$3,044,300 $1,037,700 61
42% from real estate tax
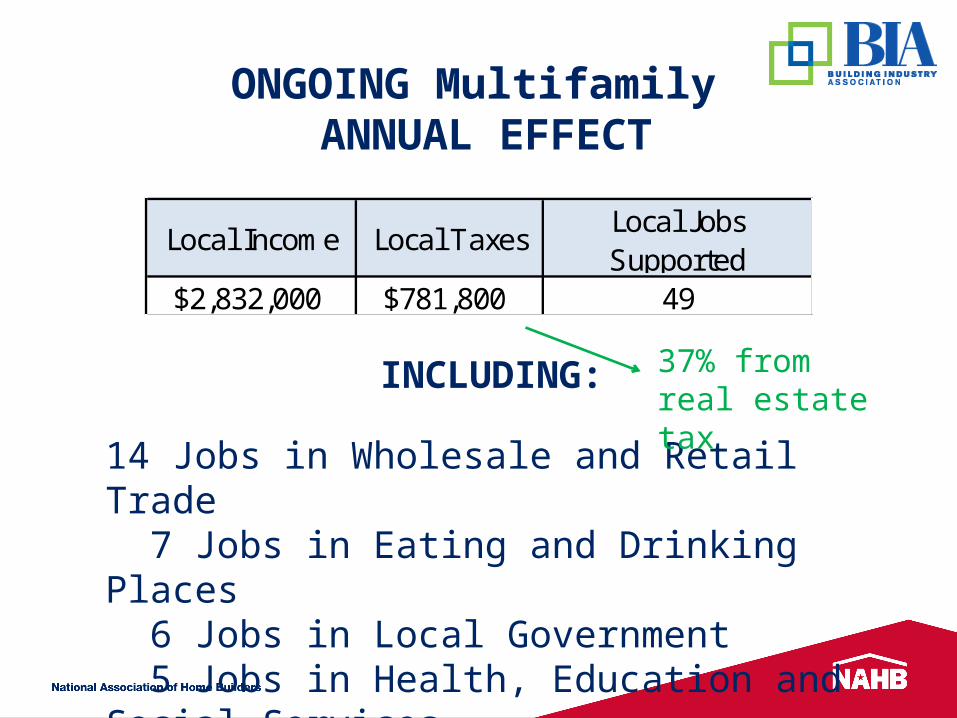
ONGOING Multifamily ANNUAL EFFECT
INCLUDING:
14 Jobs in Wholesale and Retail Trade 7 Jobs in Eating and Drinking Places 6 Jobs in Local Government 5 Jobs in Health, Education and Social Services
Local Income Local TaxesLocal Jobs Supported
$2,832,000 $781,800 49
37% from real estate tax
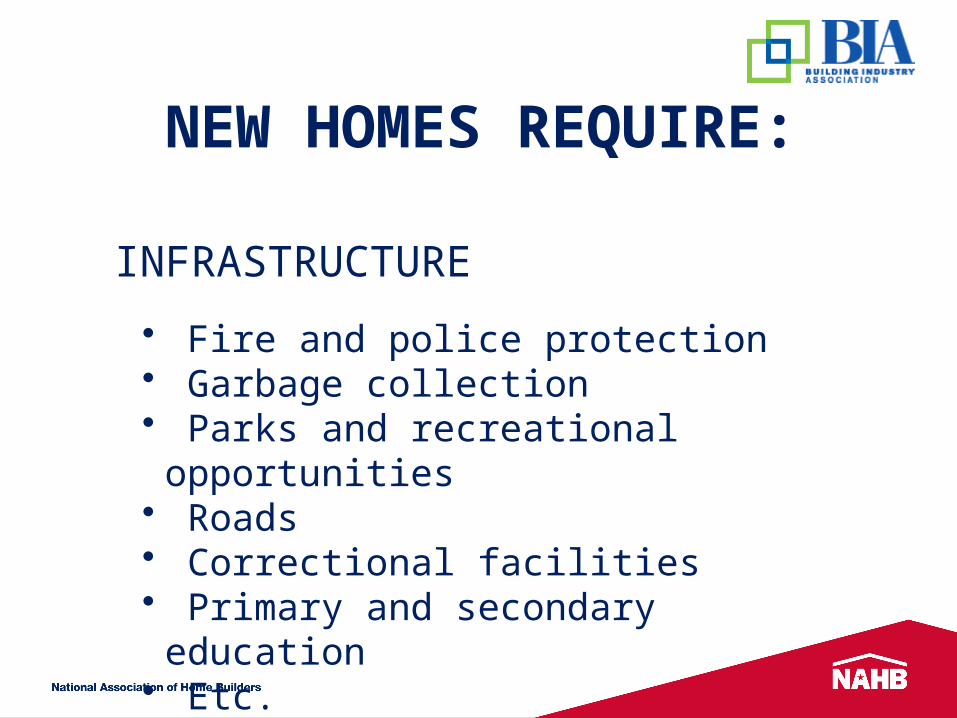
NEW HOMES REQUIRE:
• Fire and police protection• Garbage collection• Parks and recreational opportunities
• Roads• Correctional facilities• Primary and secondary education • Etc.
INFRASTRUCTURE
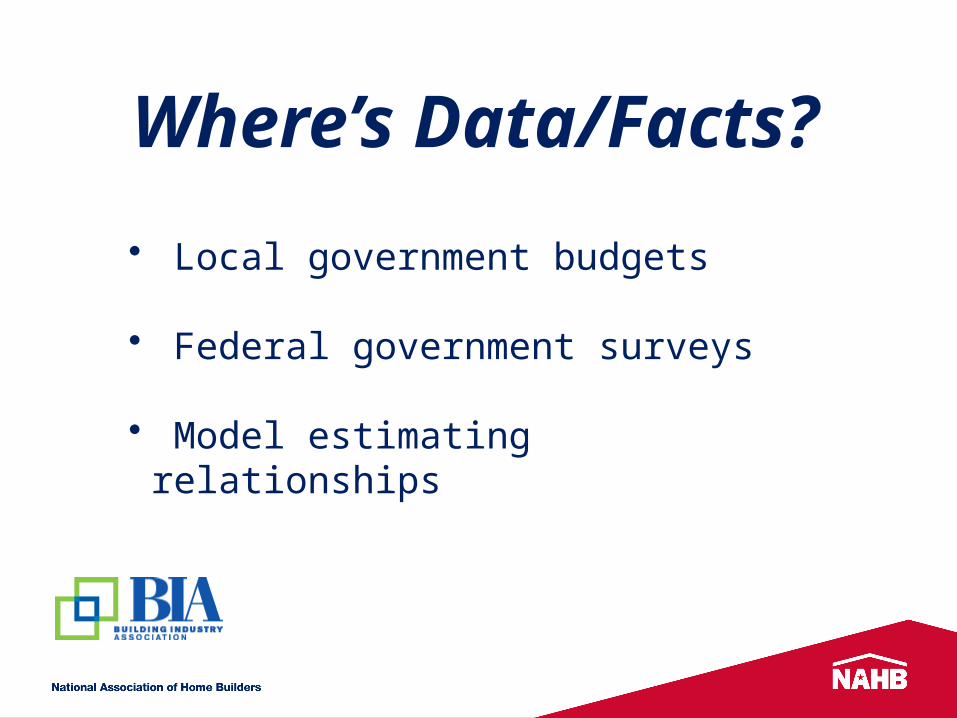
Where’s Data/Facts?
• Local government budgets
• Federal government surveys
• Model estimating relationships
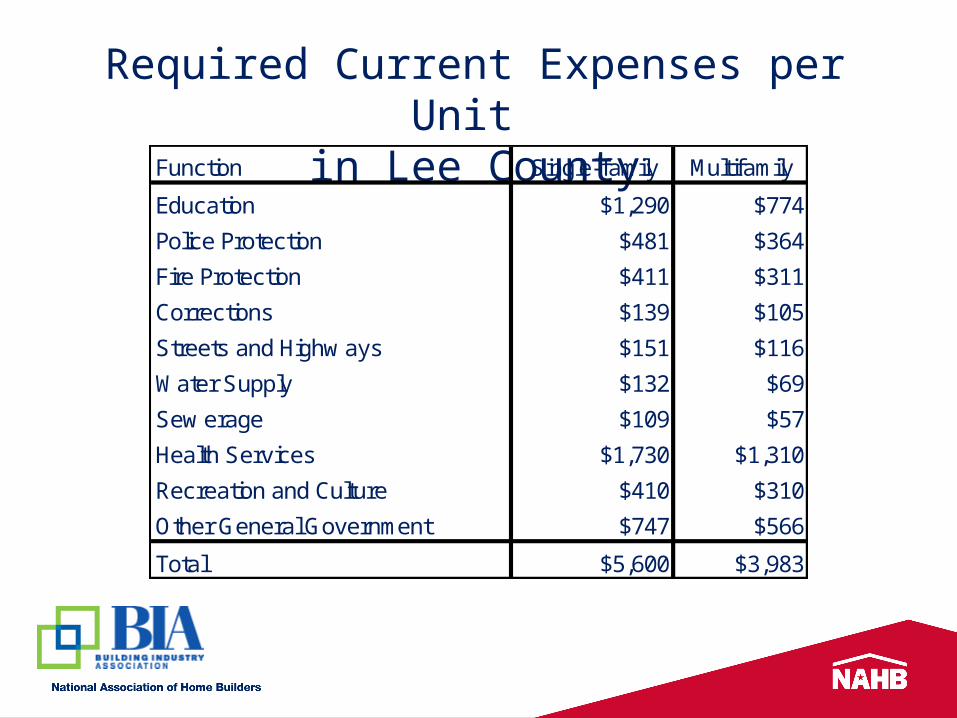
Required Current Expenses per Unit in Lee County
Function Single-family Multifamily
Education $1,290 $774
Police Protection $481 $364
Fire Protection $411 $311
Corrections $139 $105
Streets and Highw ays $151 $116
Water Supply $132 $69
Sew erage $109 $57
Health Services $1,730 $1,310
Recreation and Culture $410 $310
Other General Government $747 $566
Total $5,600 $3,983
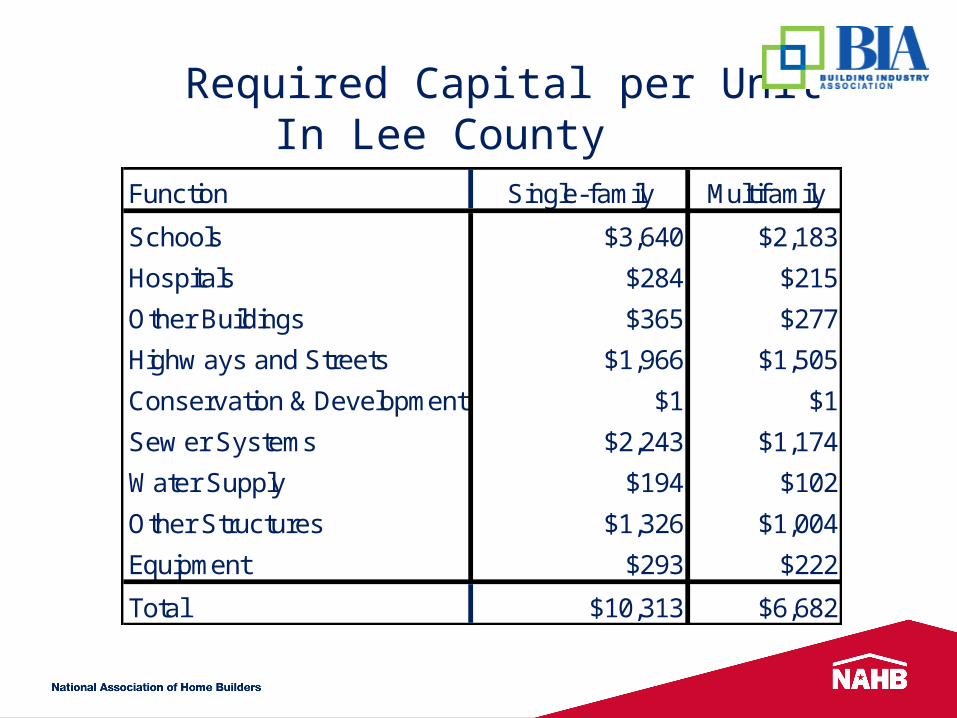
Required Capital per UnitIn Lee County
Function Single-family Multifamily
Schools $3,640 $2,183
Hospitals $284 $215
Other Buildings $365 $277
Highw ays and Streets $1,966 $1,505
Conservation & Development $1 $1
Sew er Systems $2,243 $1,174
Water Supply $194 $102
Other Structures $1,326 $1,004
Equipment $293 $222
Total $10,313 $6,682
Does new construction pay for itself?
The benefits of construction
&
The costs of construction
Now that we know:
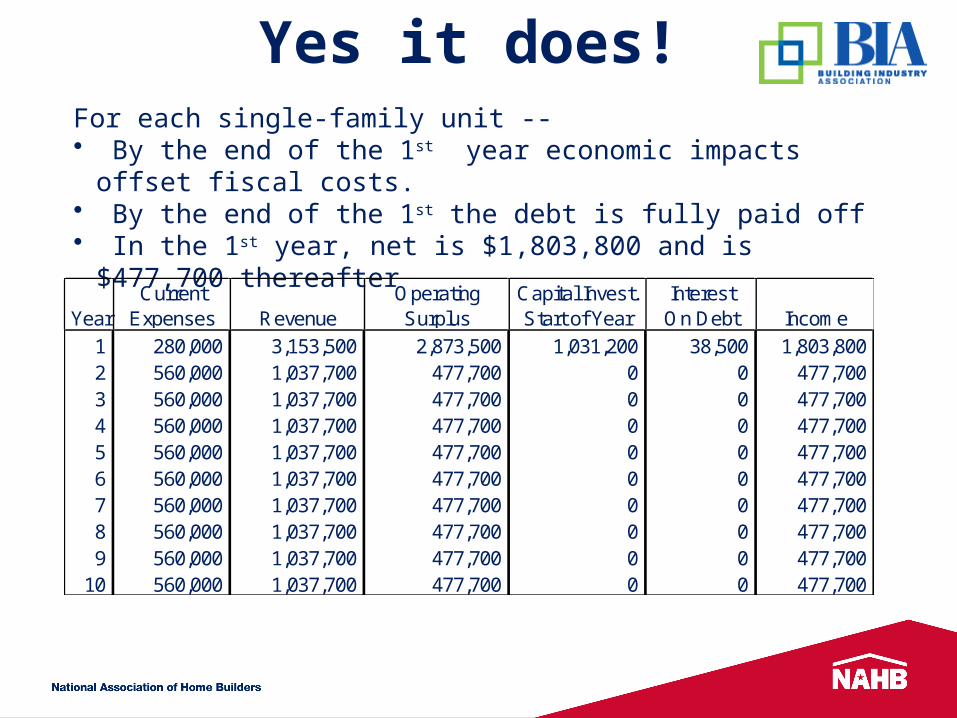
For each single-family unit -- • By the end of the 1st year economic impacts offset fiscal
costs.• By the end of the 1st the debt is fully paid off• In the 1st year, net is $1,803,800 and is $477,700
thereafter
Yes it does!
YearCurrent
Expenses RevenueOperating Surplus
Capital Invest. Start of Year
Interest On Debt Income
1 280,000 3,153,500 2,873,500 1,031,200 38,500 1,803,800 2 560,000 1,037,700 477,700 0 0 477,700 3 560,000 1,037,700 477,700 0 0 477,700 4 560,000 1,037,700 477,700 0 0 477,700 5 560,000 1,037,700 477,700 0 0 477,700 6 560,000 1,037,700 477,700 0 0 477,700 7 560,000 1,037,700 477,700 0 0 477,700 8 560,000 1,037,700 477,700 0 0 477,700 9 560,000 1,037,700 477,700 0 0 477,700
10 560,000 1,037,700 477,700 0 0 477,700
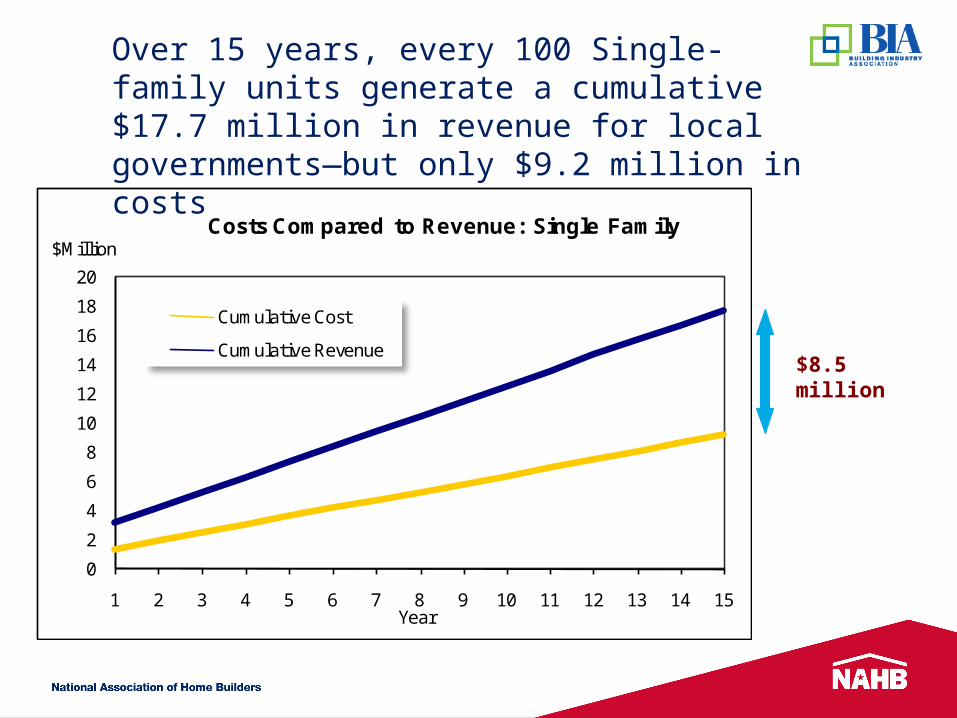
Over 15 years, every 100 Single-family units generate a cumulative $17.7 million in revenue for local governments—but only $9.2 million in costs
$8.5 million
0
2
4
6
8
10
12
14
16
18
20
1 2 3 4 5 6 7 8 9 10 11 12 13 14 15
$Million
Year
Costs Compared to Revenue: Single Family
Cumulative Cost
Cumulative Revenue
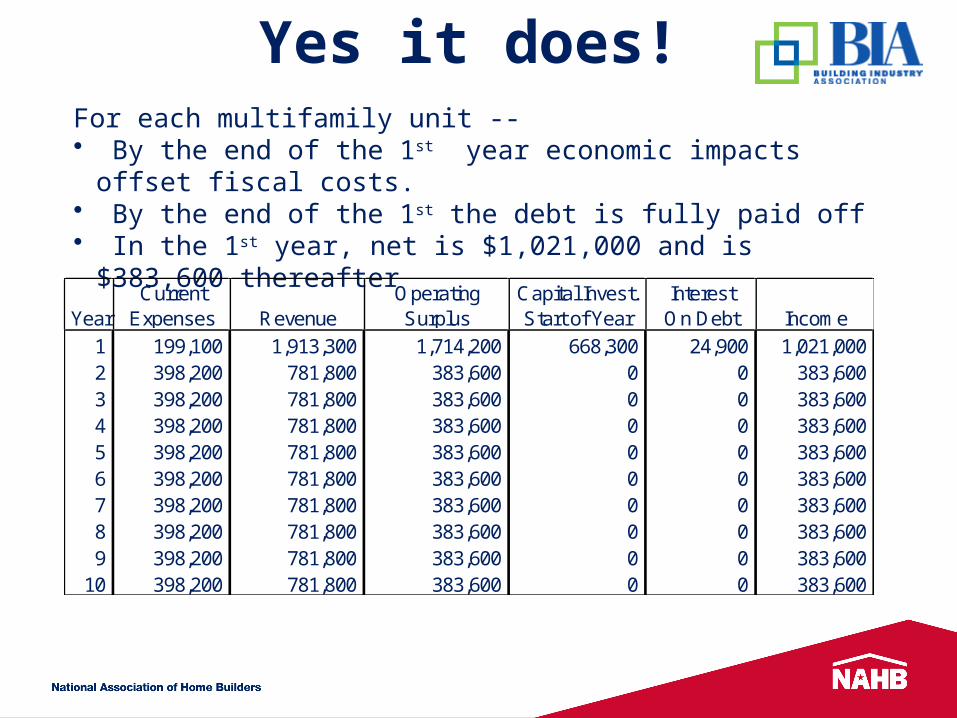
For each multifamily unit -- • By the end of the 1st year economic impacts offset fiscal
costs.• By the end of the 1st the debt is fully paid off• In the 1st year, net is $1,021,000 and is $383,600
thereafter
Yes it does!
YearCurrent
Expenses RevenueOperating Surplus
Capital Invest. Start of Year
Interest On Debt Income
1 199,100 1,913,300 1,714,200 668,300 24,900 1,021,000 2 398,200 781,800 383,600 0 0 383,600 3 398,200 781,800 383,600 0 0 383,600 4 398,200 781,800 383,600 0 0 383,600 5 398,200 781,800 383,600 0 0 383,600 6 398,200 781,800 383,600 0 0 383,600 7 398,200 781,800 383,600 0 0 383,600 8 398,200 781,800 383,600 0 0 383,600 9 398,200 781,800 383,600 0 0 383,600
10 398,200 781,800 383,600 0 0 383,600
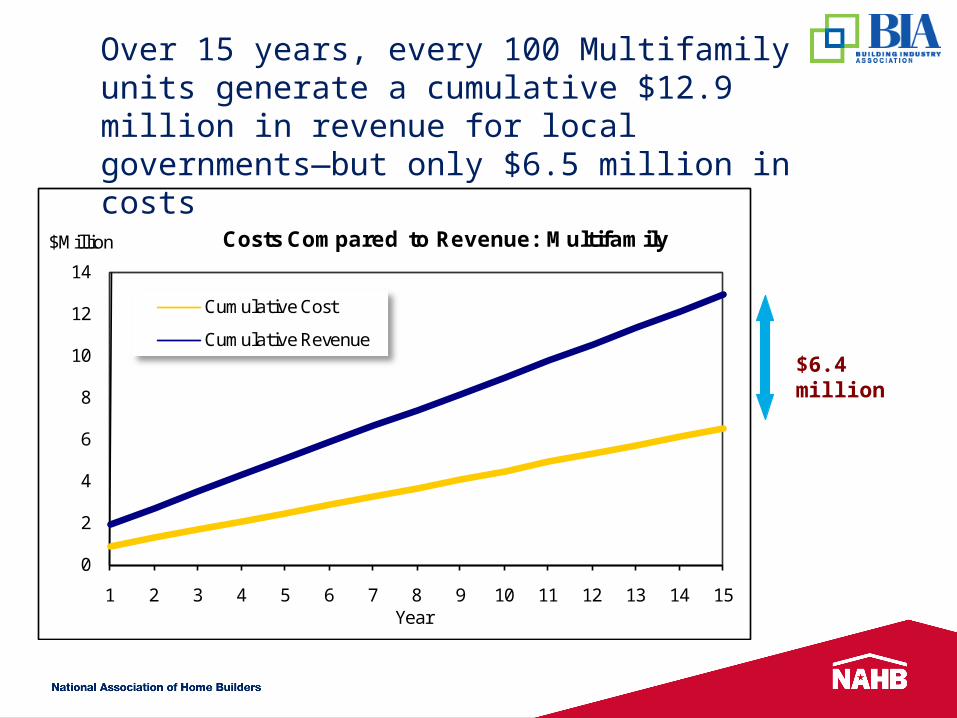
Over 15 years, every 100 Multifamily units generate a cumulative $12.9 million in revenue for local governments—but only $6.5 million in costs
$6.4 million
0
2
4
6
8
10
12
14
1 2 3 4 5 6 7 8 9 10 11 12 13 14 15
$Million
Year
Costs Compared to Revenue: Multifamily
Cumulative Cost
Cumulative Revenue
David Crowe
The Lee County Impact of Home Building