Embed Size (px)
Citation preview

Presented by:Presented by:Dean FindleyDean Findley
THE AMERICAS THE NETHERLANDS AUSTRALIA CHINA
INDEPENDENT PROJECT ANALYSIS, INCORPORATED

Labor Productivity Phase II INDEPENDENT PROJECT ANALYSIS2
Why Labor Productivity?
•
This is the second report back on a three year IBC study of construction labor productivity
•
Why worry about productivity:
–
About one-quarter of all construction cost is field labor
–
Labor is usually the largest non-material cost in a project
–
Very little is really understood about how to best measure field productivity or how to influence it
–
In developed economies of Europe and North America construction labor shortages will become more and more common as the population ages
–
In low wage countries, poor labor productivity is the primary obstacle to low cost manufacturing facilities

Labor Productivity Phase II INDEPENDENT PROJECT ANALYSIS3
Goals of This Research
•
Phase I Goals
–
Develop and validate a reliable approach to measuring labor cost and productivity
–
Understand the relationships between labor productivity and the project practices that IPA has traditionally gathered (FEL, etc.)
•
Phase II Goals
–
Explore the relationship between engineering and construction execution practices and labor productivity in high wage countries
•
Phase III Goals
–
Explore the relationship between engineering and construction execution practices and labor productivity in low wage countries
Labor Productivity Phase II INDEPENDENT PROJECT ANALYSIS4
Outline
•
Measuring labor productivity
•
Review of first year’s work
•
More Practices and Productivity
•
Productivity in Europe v. North America
•
Doing something about the weather
•
Conclusions

INDEPENDENT PROJECT ANALYSIS- Labor Productivity Phase II 5
Labor Productivity Database
W. USGC5%
US Midwest4%
Europe27%
US Northeast15%
US S. East10%
E. USGC14%
N. Calif.2%
Greater Houston20%
S. Calif3%
•
1185 projects in the United States and Europe •
103 companies represented

INDEPENDENT PROJECT ANALYSIS- Labor Productivity Phase II 6
European Labor Productivity Database
United Kingdom33%
Belgium4%
France34%
Netherlands17% Spain
4%Germany8%
•
295 projects in Europe •
35 companies represented
INDEPENDENT PROJECT ANALYSIS- Labor Productivity Phase II 7
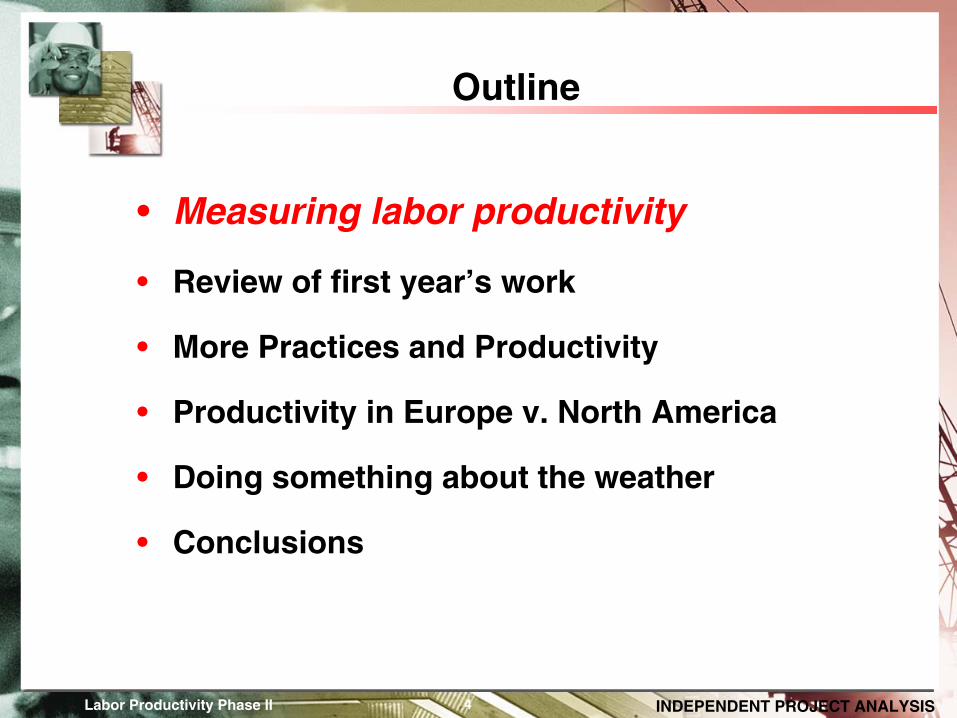
Labor Productivity Database
Project Size
Start Year of Construction
$36.6 MM
1995
Average Median Range
$12 MM
1996
$0.054 MM -
$1547.07 MM
1972 -
2001
1988 USD basis

INDEPENDENT PROJECT ANALYSIS- Labor Productivity Phase II 8
Labor Productivity Database
Revamp32%
Expansion21%
Add-on24%
Greenfield/Colocated23%

Labor Productivity Phase II INDEPENDENT PROJECT ANALYSIS9
Defining Labor Cost
•
Labor cost
is the amount of money spent on field
construction, including
–
Wages
–
Benefits
–
Small tools
–
Subcontractor profits and fees
–
Overtime premiums
•
Does
not
include
–
Construction equipment (e.g. cranes, bulldozers, backhoes, etc.)
–
Construction supervision
–
Field engineering

Labor Productivity Phase II INDEPENDENT PROJECT ANALYSIS10
Methodology (1)
•
Projects were again grouped according to process type and project type to minimize scope variations
•
A base location was created in Europe
•
Database was increased from 570 to 1100
•
Both large and small projects were added
•
Labor cost breakouts were available for all projects

Labor Productivity Phase II INDEPENDENT PROJECT ANALYSIS11
Methodology (2)
•
Each group provides a good like-for-like field work to be performed
•
Modular projects were excluded to minimize error
•
Each group has good dispersal of projects geographically
•
Each group has a good sample of projects in Greater Houston to provide a US Gulf Coast anchor
•
As the methodology develops, other “anchors”
will
be developed and become interchangeable–
Rotterdam has been added this year
– Singapore and São Paulo will be added next year
Labor Productivity Phase II INDEPENDENT PROJECT ANALYSIS12
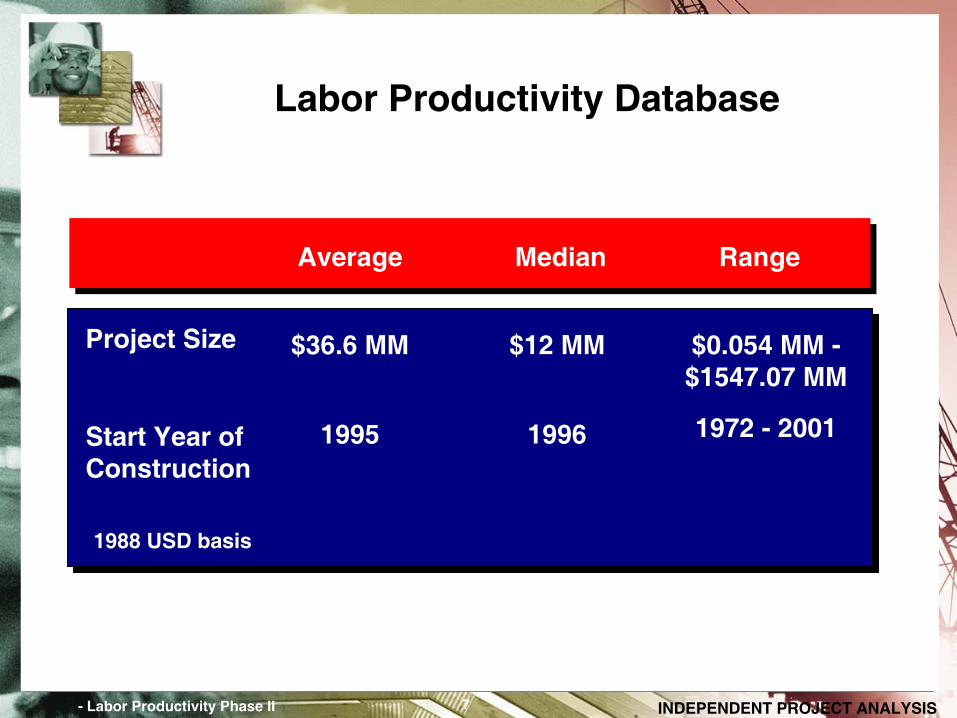
Methodology (3)
•
Effective Labor Cost Index compares the amount of labor required within each group; groups are then aggregated
–
The Labor Cost Index
measures the relative
amount of money
a project spent on field labor
–
Greater Houston is set equal to 1.0
•
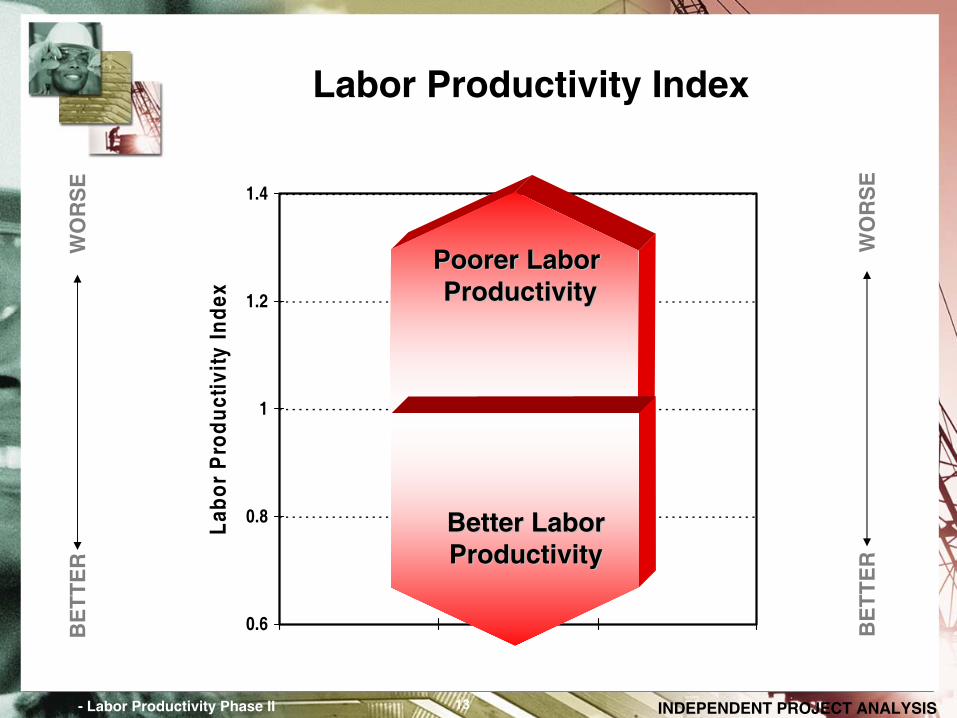
The Labor Productivity Index
is created by
adjusting the all-in wages to the same US dollar basis
–
The Labor Productivity Index measures the comparative number of labor hours
that like scope
required to complete
INDEPENDENT PROJECT ANALYSIS- Labor Productivity Phase II 13
0.6
0.8
1
1.2
1.4La
bor
Pro
duct
ivity
Inde
x
Labor Productivity Index
Poorer Labor Poorer Labor ProductivityProductivity
Better LaborBetter LaborProductivityProductivity
BE
TT
ER
WO
RS
E
BE
TT
ER
WO
RS
E

Labor Productivity Phase II INDEPENDENT PROJECT ANALYSIS14
Outline
•
Measuring labor productivity
•
Review of first year’s work
•
More Practices and Productivity
•
Productivity in Europe v. North America
•
Doing something about the weather
•
Conclusions
Labor Productivity Phase II INDEPENDENT PROJECT ANALYSIS15
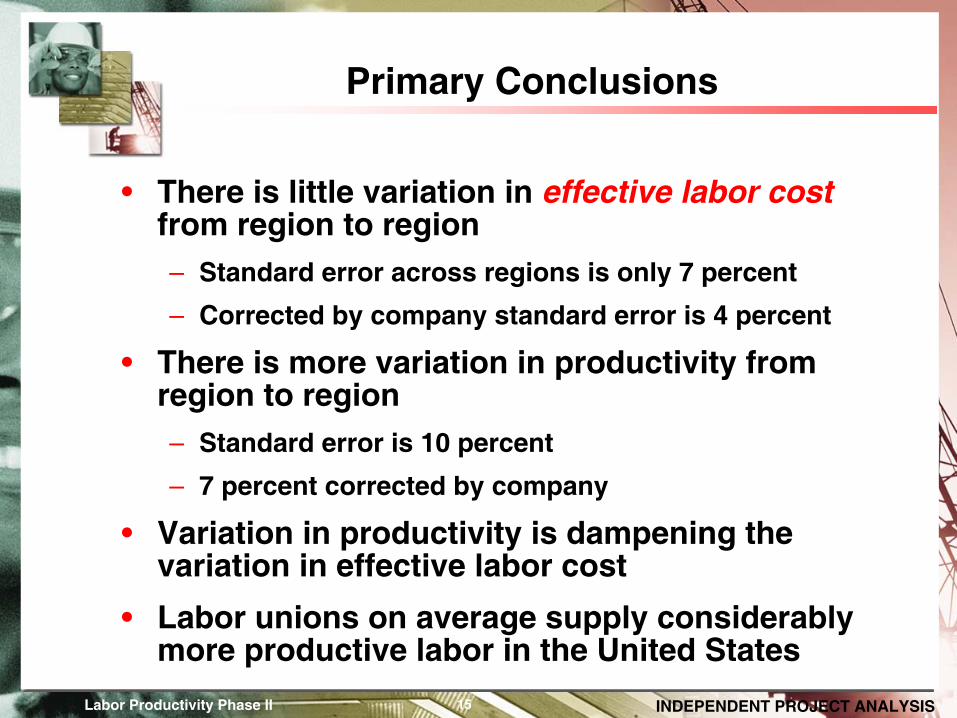
Primary Conclusions
•
There is little variation in effective labor cost
from region to region–
Standard error across regions is only 7 percent
–
Corrected by company standard error is 4 percent
•
There is more variation in productivity from region to region–
Standard error is 10 percent
–
7 percent corrected by company
•
Variation in productivity is dampening the variation in effective labor cost
•
Labor unions on average supply considerably more productive labor in the United States

Labor Productivity Phase II INDEPENDENT PROJECT ANALYSIS16
Conclusions About Regional Variation
•
Very little true region-to-region variation in cost, especially in the same general labor market
–
Contradicts perceptions of many company estimators
–
Because they extrapolate their company’s experiences or listen to contractors’
whining
–
Accords better with economic theory
•
Average productivity differences probably driven by differential skill levels
•
Much of the regional variation is really variation by company

INDEPENDENT PROJECT ANALYSIS- Labor Productivity Phase II 17
0.90
0.95
1.00
1.05
1.10
1.15
2 2.5 3 3.5 4 4.5 5 5.5 6 6.5 7 7.5 8 8.5 9 9.5
Labo
r C
ost I
ndex
FEL Drives Labor Cost Index
POORFAIRGOODBEST PracticalTOO MUCH
FEL Index
Pr < .001

Labor Productivity Phase II INDEPENDENT PROJECT ANALYSIS18
FEL Drives Labor Productivity
•
Significant components are:
–
Definition of soils
–
Definition of health and safety
–
Engineering status
•
By far the most important FEL Component for Productivity is Execution PlanningExecution Planning

INDEPENDENT PROJECT ANALYSIS- Labor Productivity Phase II 19
0.90
0.95
1.00
1.05
1.10
1.15
0 0 . 5 1 1 . 5 2
Lab
or
Pro
du
ctiv
ity
Ind
ex
Execution Planning Drives Productivity
AssumedAssumed PreliminaryPreliminary DefinitiveDefinitive
Pr <.006
8 percent better than average

INDEPENDENT PROJECT ANALYSIS- Labor Productivity Phase II 20
0.90
0.95
1.00
1.05
1.10
0 0.5 1 1 .5 2
Lab
or
Co
st In
dex
MilestoneMilestoneScheduleSchedule
Critical PathCritical PathIntegratedIntegrated
ResourceResource--loadedloaded
Pr < .001
The Effects of Detailed Scheduling All Projects

INDEPENDENT PROJECT ANALYSIS- Labor Productivity Phase II 21
0.90
0.95
1.00
1.05
1.10
1.15
0 0 . 5 1 1 . 5 2
Lab
or
Co
st In
dex
MilestoneMilestoneScheduleSchedule
Critical PathCritical PathIntegratedIntegrated
ResourceResource--loadedloaded
Resource loading is not necessary to improve labor productivity on small projects. (But it does produce shorter schedules).
The Effects of Detailed Scheduling Small Projects

Labor Productivity Phase II INDEPENDENT PROJECT ANALYSIS22
Labor Productivity and the VIPs
•
Value engineering
+ 5 percent
•
Predictive maintenance
+ 7 percent
•
Design to Capacity
+ 9 percent
•
3D CAD
+ 7 percent (and up)
•
No other relationships with VIPs, including no relationship with Constructability Reviews!

Labor Productivity Phase II INDEPENDENT PROJECT ANALYSIS23
Outline
•
Measuring labor productivity
•
Review of first year’s work
•
More Practices and Productivity–
contracting
–
teams
–
planning and control
–
construction supervision
–
use of overtime
•
Productivity in Europe v. North America
•
Doing something about the weather
•
Conclusions
Labor Productivity Phase II INDEPENDENT PROJECT ANALYSIS24
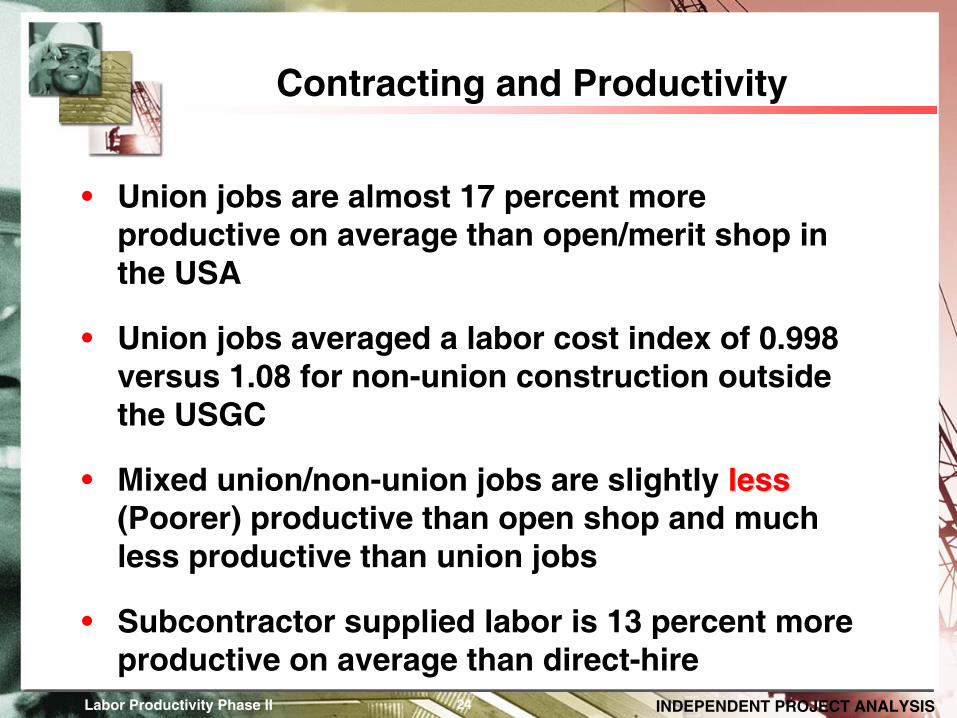
Contracting and Productivity
•
Union jobs are almost 17 percent more productive on average than open/merit shop in the USA
•
Union jobs averaged a labor cost index of 0.998 versus 1.08 for non-union construction outside the USGC
•
Mixed union/non-union jobs are slightly
lessless
(Poorer)
productive than open shop and much
less productive than union jobs
•
Subcontractor supplied labor is 13 percent more productive on average than direct-hire
Labor Productivity Phase II INDEPENDENT PROJECT ANALYSIS25
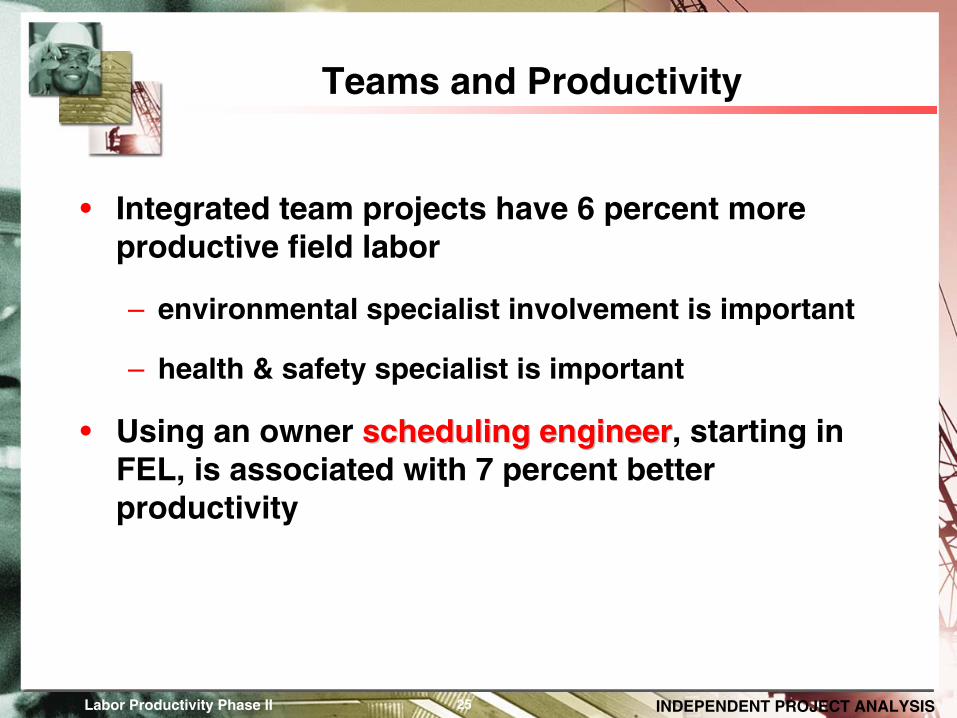
Teams and Productivity
•
Integrated team projects have 6 percent more productive field labor
–
environmental specialist involvement is important
–
health & safety specialist is important
•
Using an owner scheduling engineerscheduling engineer, starting in FEL, is associated with 7 percent better productivity

INDEPENDENT PROJECT ANALYSIS- Labor Productivity Phase II 26
Whose Cost/Schedule Control Plan?
0.8
0.9
1
1.1
1.2
Owneronly
“Integrated”owner
contractor
SeparateOwner &
contractor
Contractoronly
Pro
du
ctiv
ity
Ind
ex
BE
TT
ER
WO
RS
E

INDEPENDENT PROJECT ANALYSIS- Labor Productivity Phase II 27
Any Deviation from Construction Plan Drives Poor Productivity
Percent Schedule Deviation in Construction
0.90
0.95
1.00
1.05
1.10
-30 -25 -20 -15 -10 -5 0 5 10 15 20
Pro
duct
ivity
Inde
x
BE
TT
ER
WO
RS
E

INDEPENDENT PROJECT ANALYSIS- Labor Productivity Phase II 28
Ratio of Workers to Supervisors
0.85
0.90
0.95
1.00
1.05
1.10
5 6 7 8 9 10
Pro
duct
ivity
Inde
x
BE
TT
ER
WO
RS
EAdded Supervision
Improves Productivity
Below 5-to-1, productivity risesbut labor costs increase

Labor Productivity Phase II INDEPENDENT PROJECT ANALYSIS29
•
The use of overtime is the most common way to recover slipped schedules and accelerate projects that are schedule-driven
•
Overtime is also sometimes used to attract labor when shortages occur
•
Overtime was used on over a third of North American projects and a quarter of European projects
•
The use of overtime is increasing
•
The adverse effect of overtime on productivity is accepted as fact despite the dearth of empirical analysis, especially for the process industries
The Effect of Overtime on Productivity
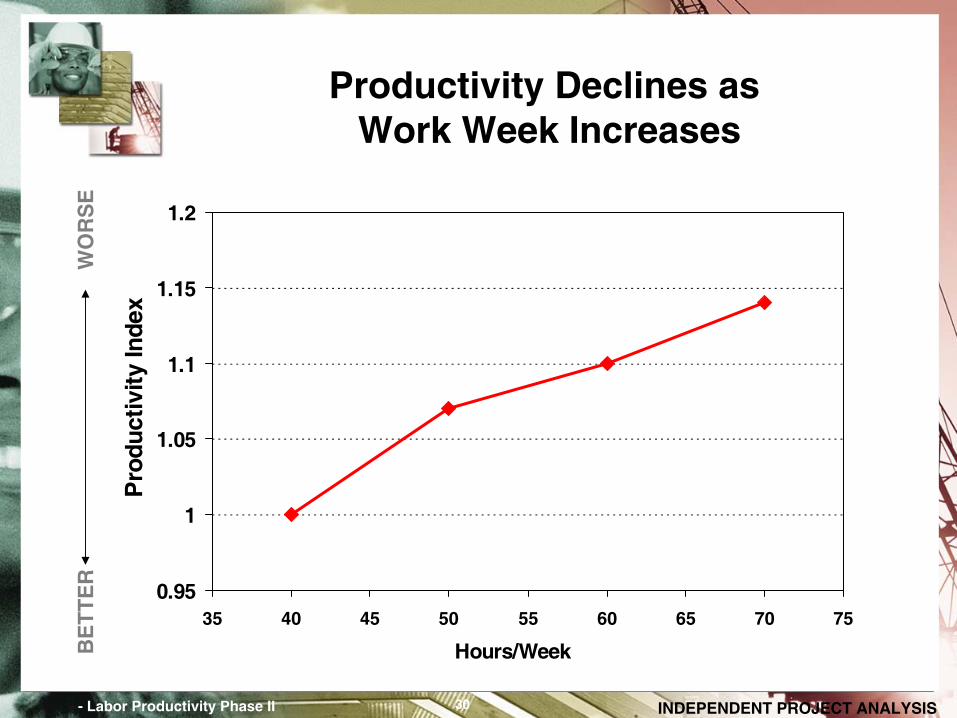
INDEPENDENT PROJECT ANALYSIS- Labor Productivity Phase II 30
Hours/Week
0.95
1
1.05
1.1
1.15
1.2
35 40 45 50 55 60 65 70 75
Pro
duct
ivity
Inde
x
BE
TT
ER
WO
RS
EProductivity Declines as
Work Week Increases

INDEPENDENT PROJECT ANALYSIS- Labor Productivity Phase II 31
The Effect of Extended 50 Hour Weeks
0.9
1.0
1.1
1.2
1.3
1.4
1 2 3 4 5 6Months of 50-Hour Weeks
Pro
duct
ivity
Inde
x
55 hours pay for 40 hours of work equivalent
Start with 8 percent loss
55 hours pay for 46 hours of workequivalent

Labor Productivity Phase II INDEPENDENT PROJECT ANALYSIS32
Outline
•
Measuring labor productivity
•
Review of first year’s work
•
More Practices and Productivity
•
Productivity in Europe v. North America
•
Doing something about the weather
•
Conclusions

Labor Productivity Phase II INDEPENDENT PROJECT ANALYSIS33
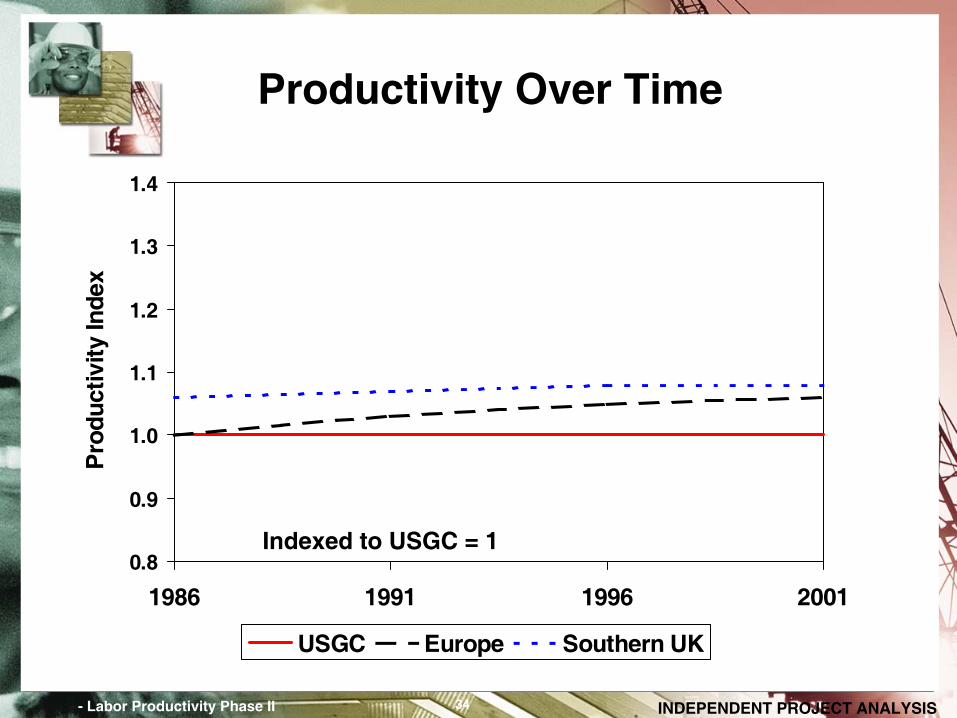
Europe v. North America
•
Differences are generally not large
•
The relationships between practices and productivity results are virtually identical
–
same effect of FEL
–
same VIPs, etc.
•
One interesting difference:
–
Environmentally-driven projects on the USGC are characterized by poor labor productivity (+12 percent)
–
Such projects in Europe are characterized by excellent productivity
INDEPENDENT PROJECT ANALYSIS- Labor Productivity Phase II 34
0.8
0.9
1.0
1.1
1.2
1.3
1.4
1986 1991 1996 2001
Pro
duct
ivity
Inde
x
USGC Europe Southern UK
Productivity Over Time
Indexed to USGC = 1

Labor Productivity Phase II INDEPENDENT PROJECT ANALYSIS35
Regional Variation Within Europe
Region
Effective
Relative Labor Cost
Productivity
At 1 March 2002 exchange rates
+ Result is driven by a performance of single company++One company is influential
Northern UK
1.04
1.10+Southern UK
1.05
1.12Belgium
0.97
0.97+France
1.12
1.13West Germany
1.15
1.10++East Germany
1.12
1.15++Netherlands
1.06
0.96Spain
0.89
1.16
INDEPENDENT PROJECT ANALYSIS- Labor Productivity Phase II 36
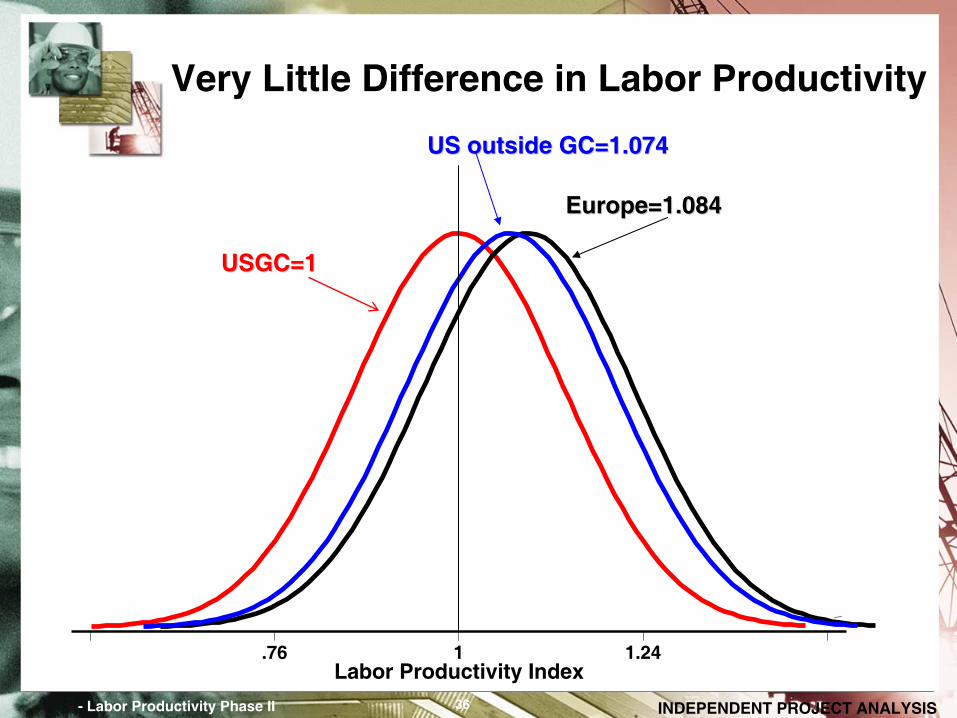
Very Little Difference in Labor Productivity
Labor Productivity Index.76 1 1.24
USGC=1USGC=1
US outside GC=1.074US outside GC=1.074
Europe=1.084Europe=1.084
Labor Productivity Phase II INDEPENDENT PROJECT ANALYSIS37
Outline
•
Measuring labor productivity
•
Review of first year’s work
•
Productivity in Europe v. North America
•
More Practices and Productivity
•
Doing something about the weather
•
Conclusions

Labor Productivity Phase II INDEPENDENT PROJECT ANALYSIS38
Why Worry About the Weather?
•
The weather is a significant risk factor for many projects
•
The weather is an important estimating issue between owners and contractors and is sometimes used by contractors to “fatten”
estimates on
reimbursable or negotiated lump-sum contracts
•
Therefore, establishing some quantitative data around the effects of specific weather on productivity should be useful

Labor Productivity Phase II INDEPENDENT PROJECT ANALYSIS39
Weather data
•
The US National Oceanographic and Atmospheric Administration (NOAA) keeps very detailed records of weather at most construction locations in the USA
•
We purchased daily weather information in electronic form for the construction periods of approximately 50 percent US projects in our productivity database
•
We then matched weather results to productivity
Labor Productivity Phase II INDEPENDENT PROJECT ANALYSIS40
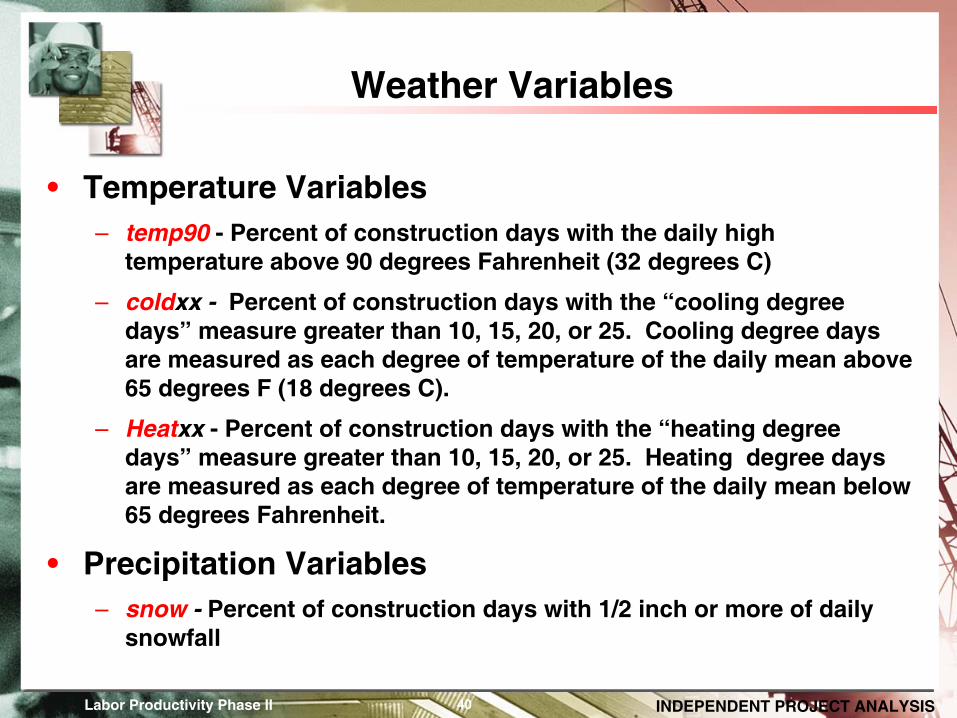
Weather Variables
•
Temperature Variables–
temp90
-
Percent of construction days with the daily high temperature above 90 degrees Fahrenheit (32 degrees C)
–
coldxx -
Percent of construction days with the “cooling degree days”
measure greater than 10, 15, 20, or 25. Cooling degree days are measured as each degree of temperature of the daily mean above 65 degrees F (18 degrees C).
–
Heatxx -
Percent of construction days with the “heating degree days”
measure greater than 10, 15, 20, or 25. Heating degree days are measured as each degree of temperature of the daily mean below 65 degrees Fahrenheit.
•
Precipitation Variables–
snow
-
Percent of construction days with 1/2 inch or more of daily snowfall
Labor Productivity Phase II INDEPENDENT PROJECT ANALYSIS41
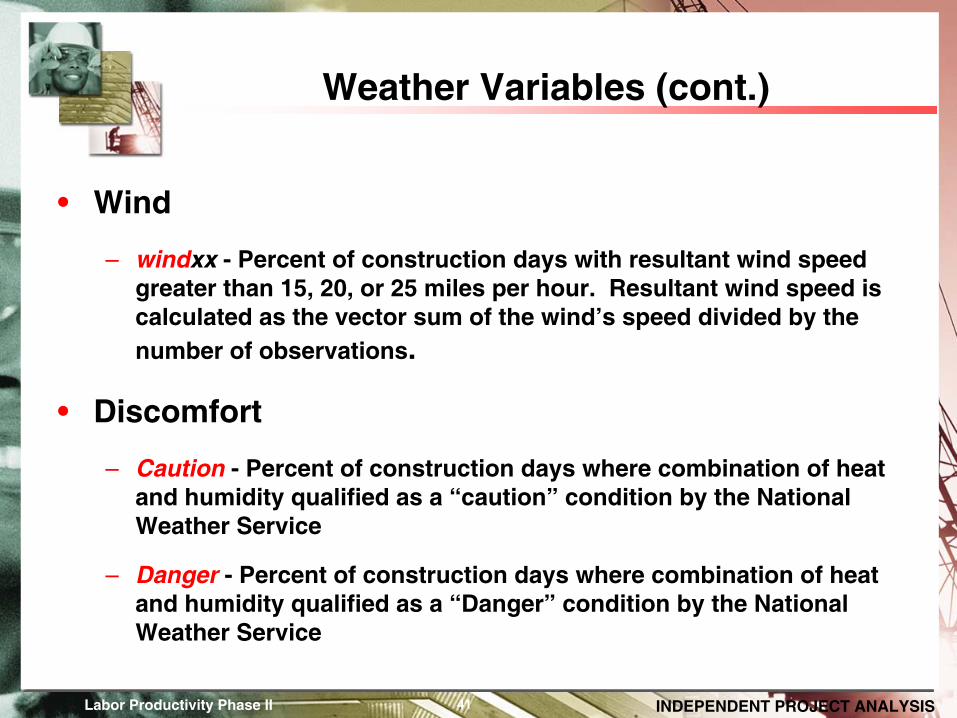
Weather Variables (cont.)
•
Wind
–
windxx
-
Percent of construction days with resultant wind speed greater than 15, 20, or 25 miles per hour. Resultant wind speed
is calculated as the vector sum of the wind’s speed divided by the number of observations.
•
Discomfort
–
Caution -
Percent of construction days where combination of heat and humidity qualified as a “caution”
condition by the National Weather Service
–
Danger -
Percent of construction days where combination of heat and humidity qualified as a “Danger”
condition by the National Weather Service
INDEPENDENT PROJECT ANALYSIS- Labor Productivity Phase II 42
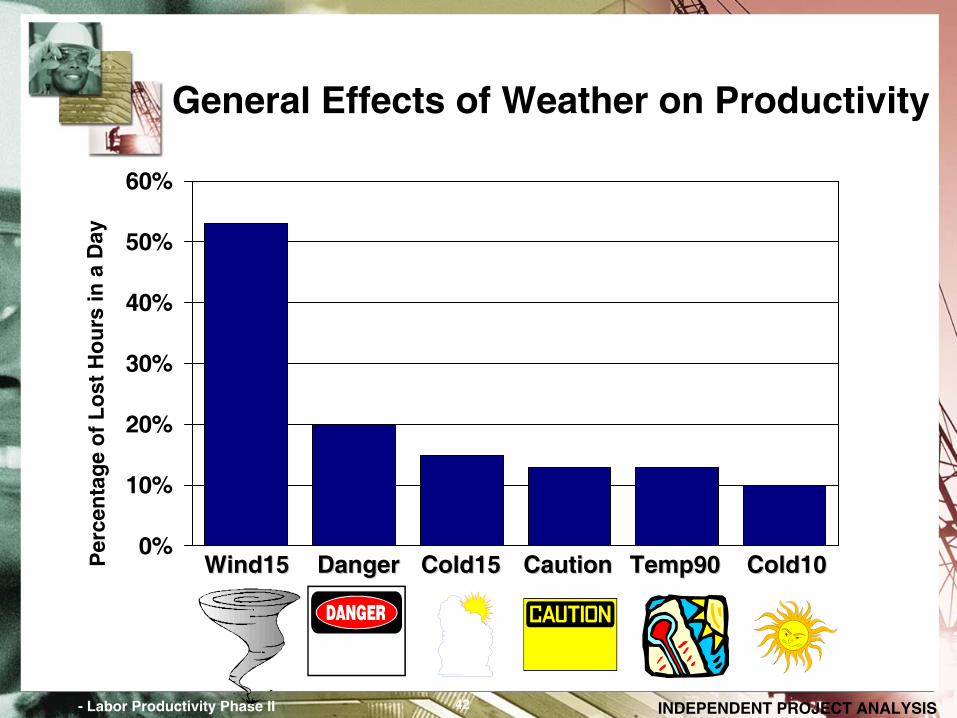
General Effects of Weather on Productivity
0%
10%
20%
30%
40%
50%
60%
Per
cen
tag
e o
f L
ost
Ho
urs
in a
Day
Wind15Wind15 DangerDanger CautionCautionCold15Cold15 Temp90Temp90 Cold10Cold10

INDEPENDENT PROJECT ANALYSIS- Labor Productivity Phase II 43
Weather Effects in Warmer Regions
0%
5%
10%
15%
20%
25%
Per
cen
tag
e o
f L
ost
Ho
urs
in a
Day
DangerDanger CautionCaution Cold15Cold15

INDEPENDENT PROJECT ANALYSIS- Labor Productivity Phase II 44
Weather Effects in Northern US
30%
35%
40%
45%
50%
55%
60%
65%
70%
Per
cen
tag
e o
f L
ost
Ho
urs
in a
Day
Wind20Wind20 SnowSnow Heat25Heat25 Heat20Heat20
Labor Productivity Phase II INDEPENDENT PROJECT ANALYSIS45
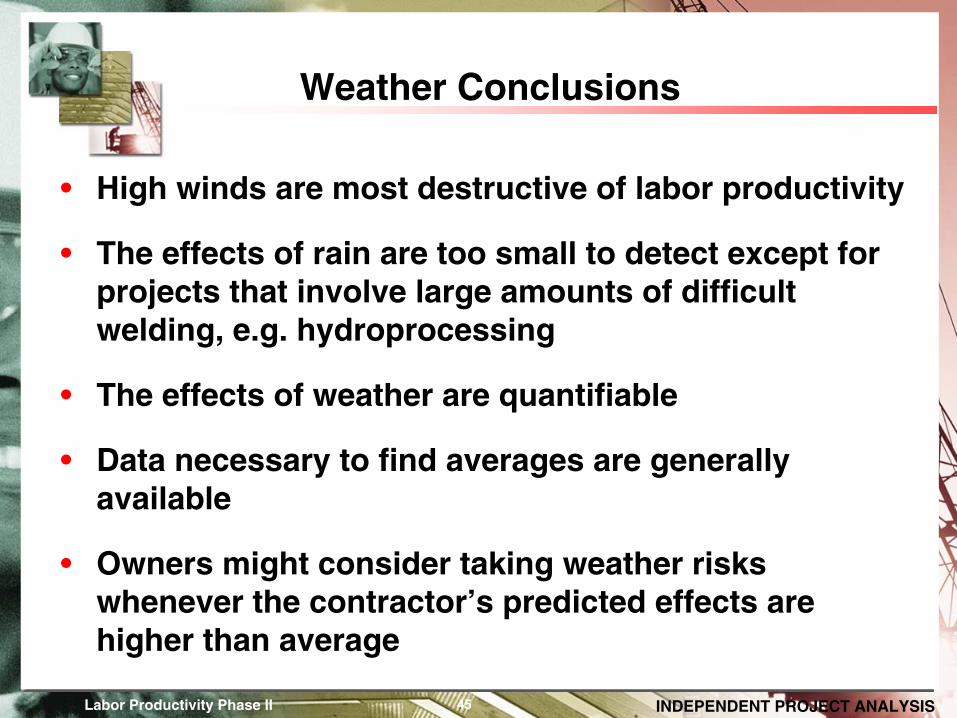
Weather Conclusions
•
High winds are most destructive of labor productivity
•
The effects of rain are too small to detect except for projects that involve large amounts of difficult welding, e.g. hydroprocessing
•
The effects of weather are quantifiable
•
Data necessary to find averages are generally available
•
Owners might consider taking weather risks whenever the contractor’s predicted effects are higher than average

Labor Productivity Phase II INDEPENDENT PROJECT ANALYSIS46
Outline
•
Measuring labor productivity
•
Review of first year’s work
•
Productivity in Europe v. North America
•
More Practices and Productivity
•
Doing something about the weather
•
Conclusions

Labor Productivity Phase II INDEPENDENT PROJECT ANALYSIS47
Conclusions
•
Overall project-to-project variation in labor productivity is 24 percent on a single standard deviation
•
Even within highly homogeneous projects in the same region, the variation is about 15 percent
•
This means there is a substantial gain available in improved labor productivity
•
Good labor productivity does more than reduce cost
–
Improves schedule
–
Improves quality

Labor Productivity Phase II INDEPENDENT PROJECT ANALYSIS48
Keys to Better Productivity
•
Detailed execution planning is the single most important driver of better field productivity
•
Execution planning has been progressively outsourced to contractors
•
But the data are clear: owner execution planning and control are central to securing good labor productivity
•
The principal role of the engineering contractor is to provide timely, high-quality engineering documents to construction; it is not to take the place of the owner in the execution planning process

Labor Productivity Phase II INDEPENDENT PROJECT ANALYSIS49
Path Forward --
Phase III
•
Work will continue on the collection of more detailed practices in the field that may affect productivity
•
Regional focus for IBC 2003 will be Latin America and Asia
•
Main emphasis will be on low-wage, generally lower skilled labor situations in which major cost swings can be achieved