Embed Size (px)
Citation preview

Presented by Steve Fall
January 15, 2011
SABR Regional Meeting
1

What is a True Champion? A True Champion wins the World Series and has a great regular season
2

Does the New Playoff Structure Benefit Teams that are Merely Good, but not Great?
Percentage of clubs with 92 or fewer regular season victories winning WS:
Old Format: 25 percent (6 times in 24 postseasons)
Current Format: 50 percent (8 of 16)
3

Advantages of the Current Playoff Structure
Keeps more teams in the playoff races Eliminates the possibility of great 100-
win teams missing the postseason due to a tough division
More playoff baseball!
But it falls short in one area…
4

Identifying Dominant Teams 100-Win Teams – in most cases – are
Major League’s best and most dominant Usually only one or two clubs reach this
elite level each season Such regular season dominance should
lead to postseason success, but has it?
5
First a Look Back
From 1969 through 1993, under the four-team postseason structure, 25 playoff teams won 100 games during the regular season
Eight prevailed as World Series Champions, or 32.0 percent
6

But Everything Changed in 1994 The new postseason structure debuted
in 1995 with the extra round of playoffs Since then, dominant regular season
teams have faced a tough challenge each October
Under the new format, 20 teams have won 100 games since 1995
Just two prevailed as WS Champs, or 10 percent (1998 and 2009 Yankees)
7

Percentage of 100-Win Teams Prevailing as World ChampionsOld Format: 32.0 percent (8 of 25)
Current Format: 10.0 percent (2 of 20)
Adding the 1995 Braves (90-54) boosts the latter figure to 14.3 percent (3 of 21)
Still considerably lower than the previous percentage
8

How Can This Happen? Even if a dramatically superior team
defeats an inferior club 65 percent of the time in a playoff series, the new PS is no cakewalk
.65 x .65 x .65 = 27.5 percent So their odds of winning it all are just
over one in four despite having a decisive edge in all three confrontations
And teams are almost never dramatically superior in all three rounds
9

What about Projected or Pythagorean Records? Run differential and the Pythagorean
Theorem of Winning Percentage do a better job of identifying elite teams than regular winning percentage
Does this change the results?
10

Percentage of Projected 100-Win Teams Prevailing as WS ChampsOld Format: 27.3 percent (9 of 33)Current Format: 15.8 percent (3 of 19)
The three teams with a 100-win projected record to prevail: 1998 Yankees, 2002 Angels and 2007 Red Sox
Though not as extreme a difference, we get similar results as when using actual won-lost records
11

Comparing Teams with the Best Record Each Postseason How have the teams with the best won-
lost record fared in the postseason? This method works well in seasons with
multiple 100-win teams (such as expansion seasons like 1998)
12
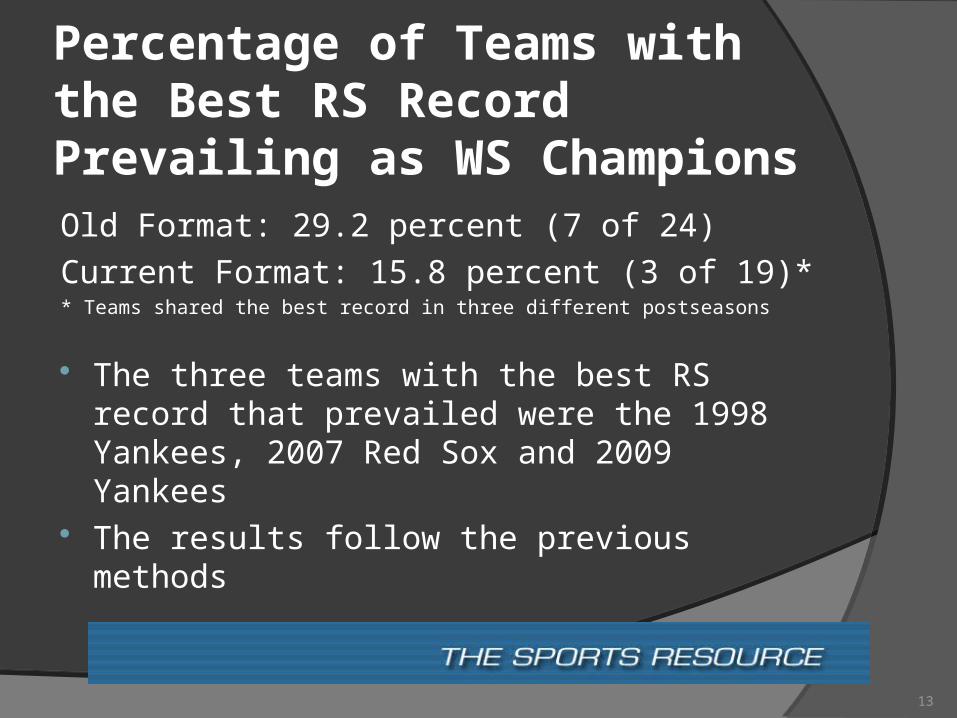
Percentage of Teams with the Best RS Record Prevailing as WS ChampionsOld Format: 29.2 percent (7 of 24)
Current Format: 15.8 percent (3 of 19)** Teams shared the best record in three different postseasons
The three teams with the best RS record that prevailed were the 1998 Yankees, 2007 Red Sox and 2009 Yankees
The results follow the previous methods
13

The Plight of the Atlanta Braves From 1995 through 2005, the Braves won
11 straight Division Titles, won 100+ games 5 times and averaged 98.1 wins
Yet they won only 1 World Series Went 48-44 in PS games Went 10-10 in PS series A .500 record in PS series projects to win
1 in 8 times now vs. 1 in 4 before
14

Summary of Research
In the expanded postseason, dominant regular season teams have won the World Series roughly half as often as before (from 1969-93)
Is the new format solely to blame?
15

Other Possible Theories
1) Finishing Strong
2) The Secret Sauce
3) Super Divisions
4) Flipping the Switch
5) A Drop in Quality
16

Finishing Strong
Some teams – often fortified by deadline trades – can be better than 100-win teams without having as good a record
For example, the 92-70 Giants and 90-72 Rangers from 2010
Both strengthened their clubs at the trade deadline and thereafter
17

The Secret Sauce Baseball Prospectus has developed a
formula that summarizes the team attributes that enhance the odds of postseason success
Are some teams built for the postseason?
In general, teams with top heavy rotations tend to fare well
The ability to generate offense without power also appears key
18
The Super Division
AL East teams in recent seasons face such fierce competition all season that they are much better clubs than their records indicate
For example, the 2007 Red Sox had a 96-66 record but steamrolled PS competition
19

Flipping the Switch Some great teams may sleepwalk
through the regular season and win just enough to reach playoffs
The 2000 Yankees went just 87-74 and won the World Series
Had winning in 1998 and 1999 made them complacent?
If so, this impacts their regular season record
20

A Drop in Quality Perhaps 100-win teams just aren’t as
good Has division realignment and/or
expansion made it easier to win 100 regular season games since 1995?
The number of 100-win teams has increased under the new format: 1.31 per postseason versus 1.13 under the old structure
21

Postseason Record of 100-Win Regular Season Teams
Seasons Won Lost Pct.1969-1993 113 86 .5681995-2010 103 88 .539
22

Postseason Record of Teams with the Best Regular Season Record
Seasons Won Lost Pct.1969-1993 112 86 .5661995-2010 103 83 .554
23
Conclusion
While other factors have had some impact on the results, the most successful regular season teams have a much tougher time prevailing as World Series Champions due to the extra round of playoffs they must survive
24


![Optimizing SABR delivery for synchronous multiple lung ... · have been treated radically using stereotactic ablative radio-therapy (SABR) [1–3]. SABR to multiple lung targets has](https://img.pdfslide.net/doc/110x75/602978eef386213e667256eb/optimizing-sabr-delivery-for-synchronous-multiple-lung-have-been-treated-radically.jpg)