Embed Size (px)
Citation preview
JPods Transportation System at West Point:
Final Decision BriefPresented by The Dream Team
November 30, 2011

The Dream Team
•CDT Hana Lee
–A-2, 2012–International Relations major
–Project Manager
•CDT Ali Chouhdry
–B-1, 2012–International Relations major
–Systems Modeling and Design
•CDT Jeremy Provencher
–A-2, 2012–Defense & Strategic Studies major
–Team Liaison Officer with Client and Stakeholders
•CDT Romedy Murr
–A-1, 2012–International Relations major–Technical Writer
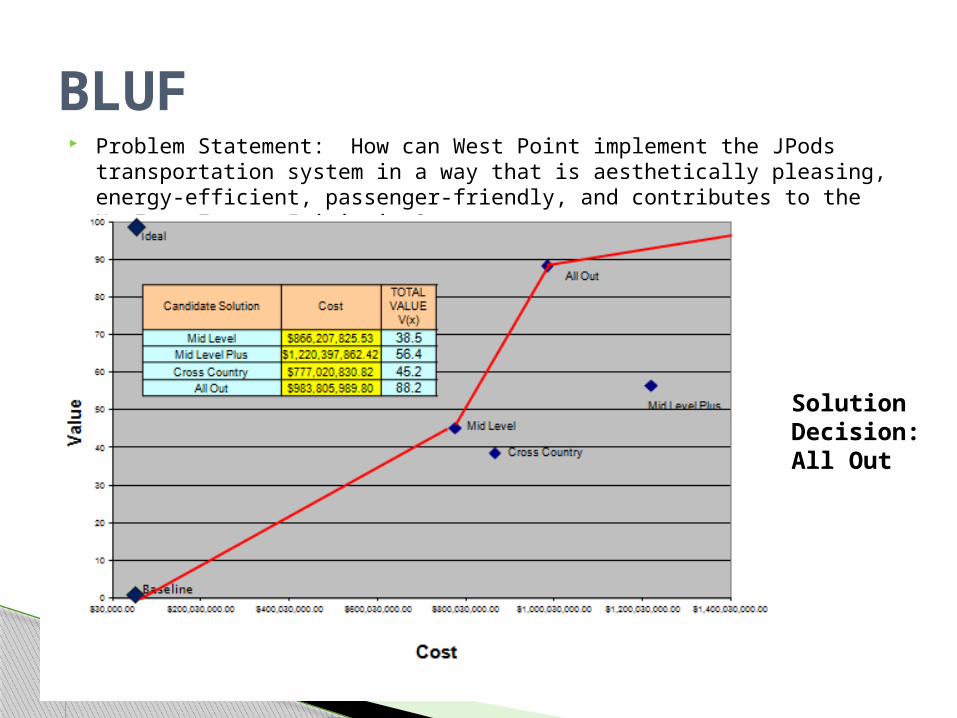
BLUF Problem Statement: How can West Point implement the JPods
transportation system in a way that is aesthetically pleasing, energy-efficient, passenger-friendly, and contributes to the NetZero Energy Initiative?
Solution Decision:All Out

Initial Problem Statement Problem Definition Value Hierarchy Swing Weight Matrix Alternatives Raw Data Matrix Screening Criteria Feasibility Screening Matrix Candidate Solutions Additive Value Model Candidate Solutions - $$$ Value Focused Thinking Cost vs. Value Sensitivity Analysis Conclusion Bibliography Questions
Agenda
What is the best way to implement the JPods system in and around West Point?
Initial Problem Statement
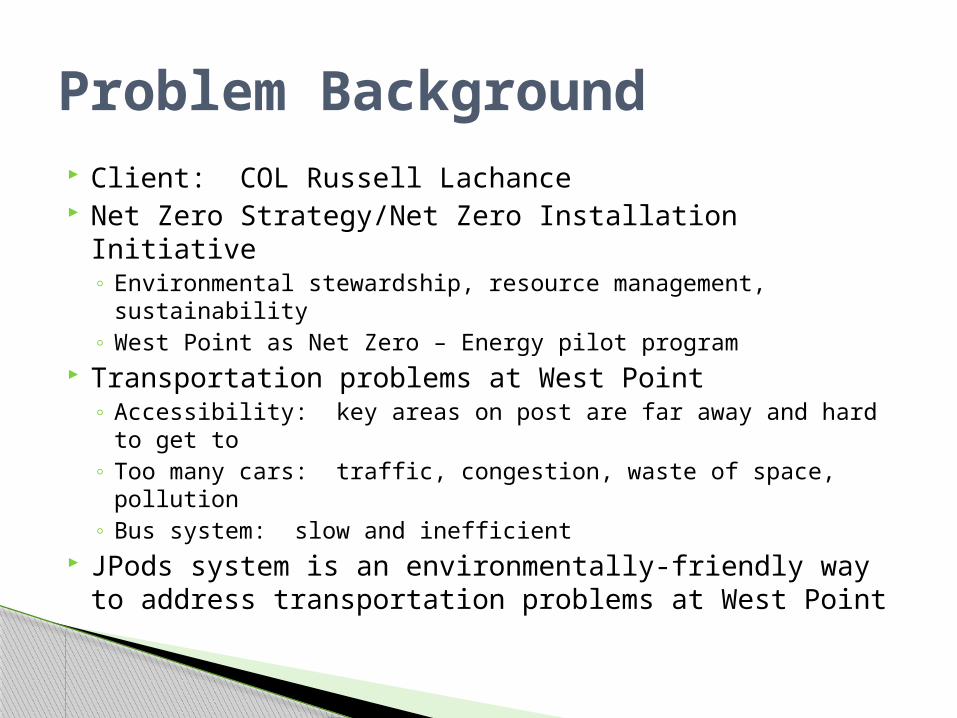
Client: COL Russell Lachance Net Zero Strategy/Net Zero Installation Initiative
◦ Environmental stewardship, resource management, sustainability
◦ West Point as Net Zero – Energy pilot program Transportation problems at West Point
◦ Accessibility: key areas on post are far away and hard to get to
◦ Too many cars: traffic, congestion, waste of space, pollution
◦ Bus system: slow and inefficient JPods system is an environmentally-friendly way
to address transportation problems at West Point
Problem Background
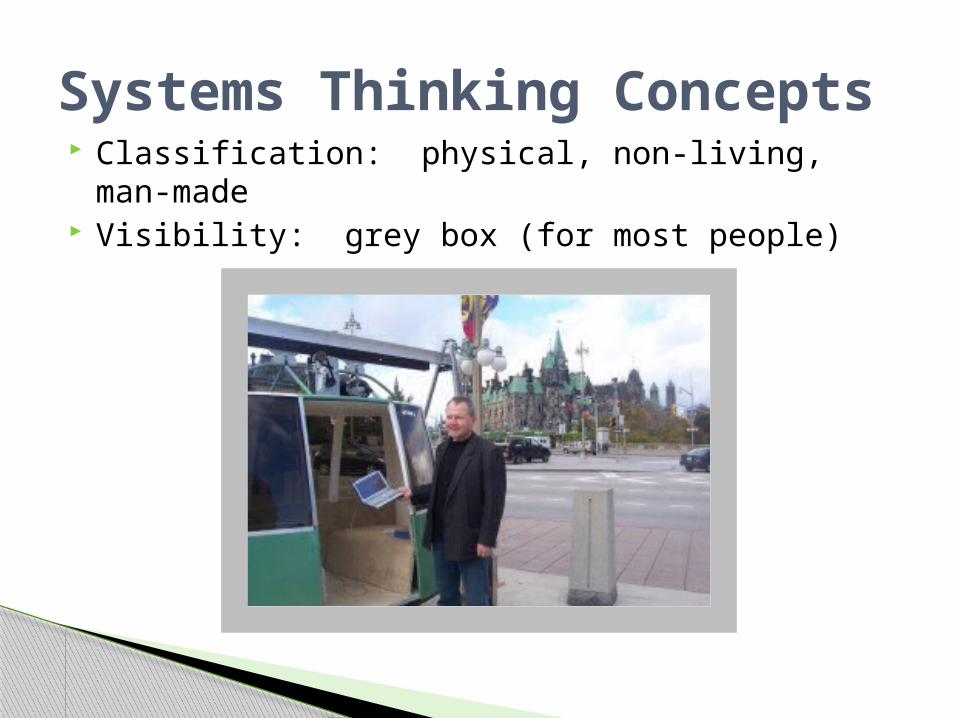
Systems Thinking Concepts Classification: physical, non-living, man-made Visibility: grey box (for most people)
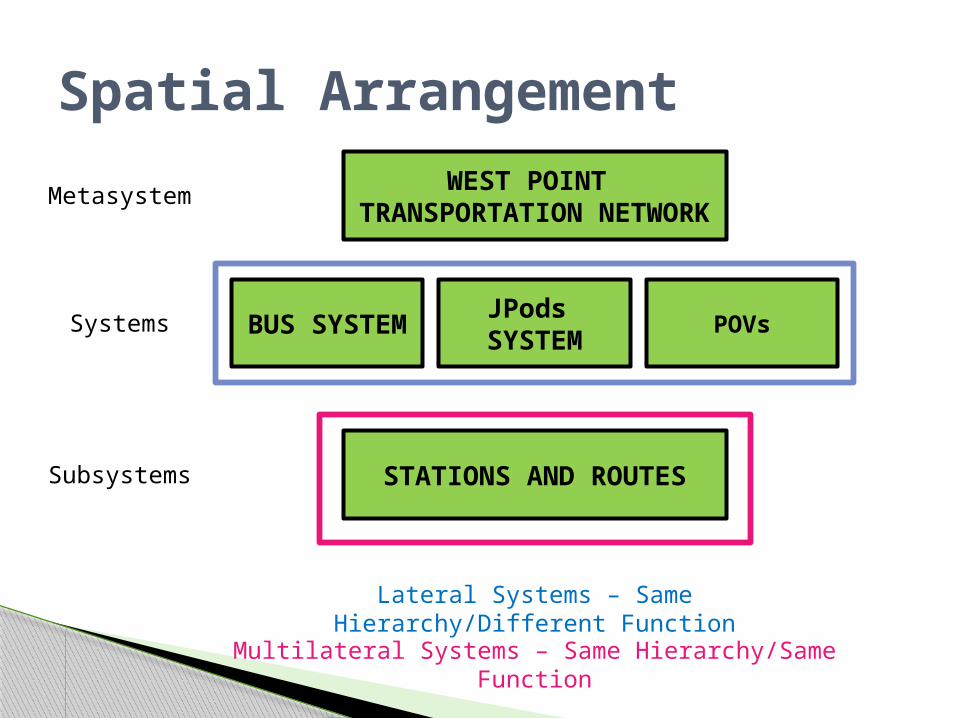
Spatial Arrangement
WEST POINT TRANSPORTATION NETWORK
JPods SYSTEMBUS SYSTEM POVs
STATIONS AND ROUTES
Metasystem
Systems
Subsystems
Lateral Systems – Same Hierarchy/Different Function
Multilateral Systems – Same Hierarchy/Same Function
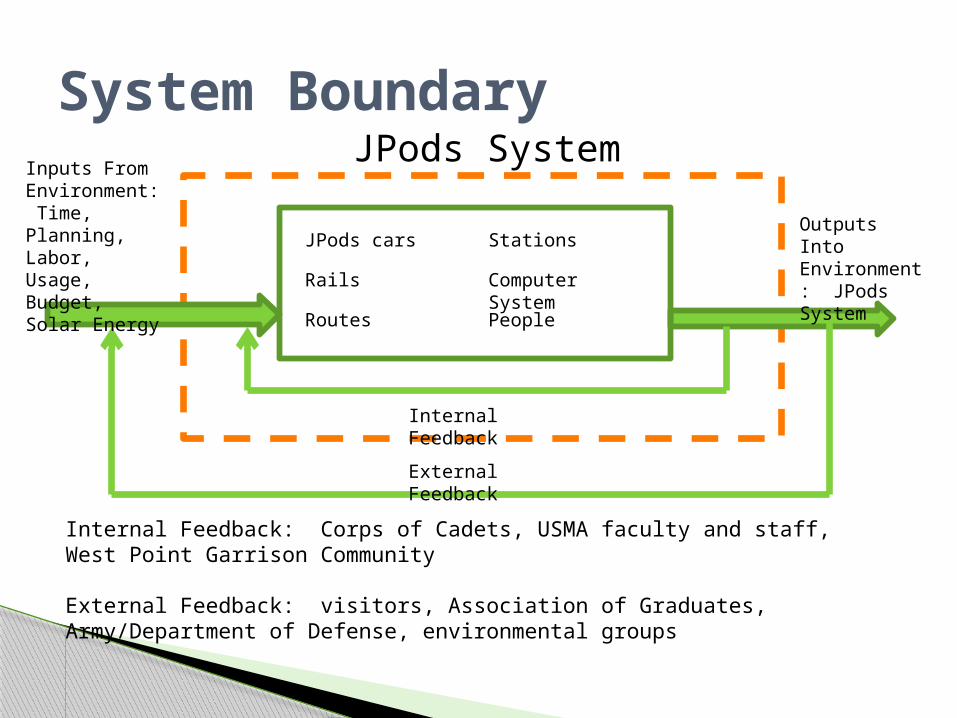
System Boundary
Internal Feedback: Corps of Cadets, USMA faculty and staff, West Point Garrison Community
External Feedback: visitors, Association of Graduates, Army/Department of Defense, environmental groups
JPods System
JPods cars Stations
Rails
PeopleRoutes
Computer System
Inputs From Environment: Time, Planning, Labor, Usage, Budget, Solar Energy
Outputs Into Environment: JPods System
Internal Feedback
External Feedback
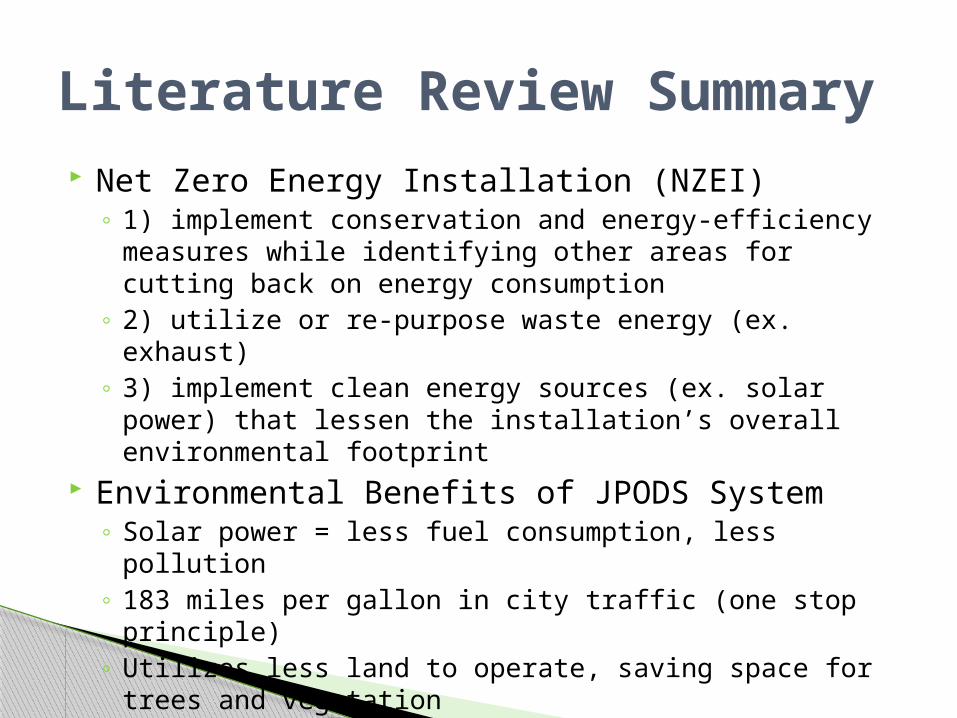
Net Zero Energy Installation (NZEI)◦ 1) implement conservation and energy-efficiency
measures while identifying other areas for cutting back on energy consumption
◦ 2) utilize or re-purpose waste energy (ex. exhaust)◦ 3) implement clean energy sources (ex. solar power) that
lessen the installation’s overall environmental footprint Environmental Benefits of JPODS System
◦ Solar power = less fuel consumption, less pollution◦ 183 miles per gallon in city traffic (one stop principle)◦ Utilizes less land to operate, saving space for trees and
vegetation
Literature Review Summary
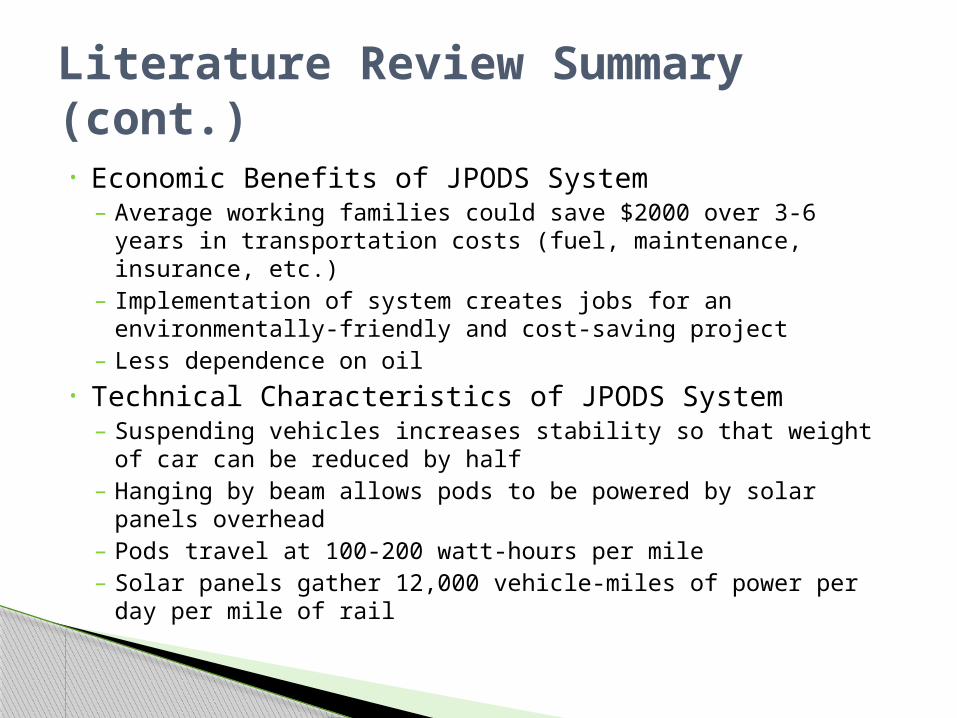
• Economic Benefits of JPODS System– Average working families could save $2000 over 3-6 years in
transportation costs (fuel, maintenance, insurance, etc.)– Implementation of system creates jobs for an
environmentally-friendly and cost-saving project– Less dependence on oil
• Technical Characteristics of JPODS System– Suspending vehicles increases stability so that weight of car
can be reduced by half– Hanging by beam allows pods to be powered by solar panels
overhead– Pods travel at 100-200 watt-hours per mile– Solar panels gather 12,000 vehicle-miles of power per day
per mile of rail
Literature Review Summary (cont.)
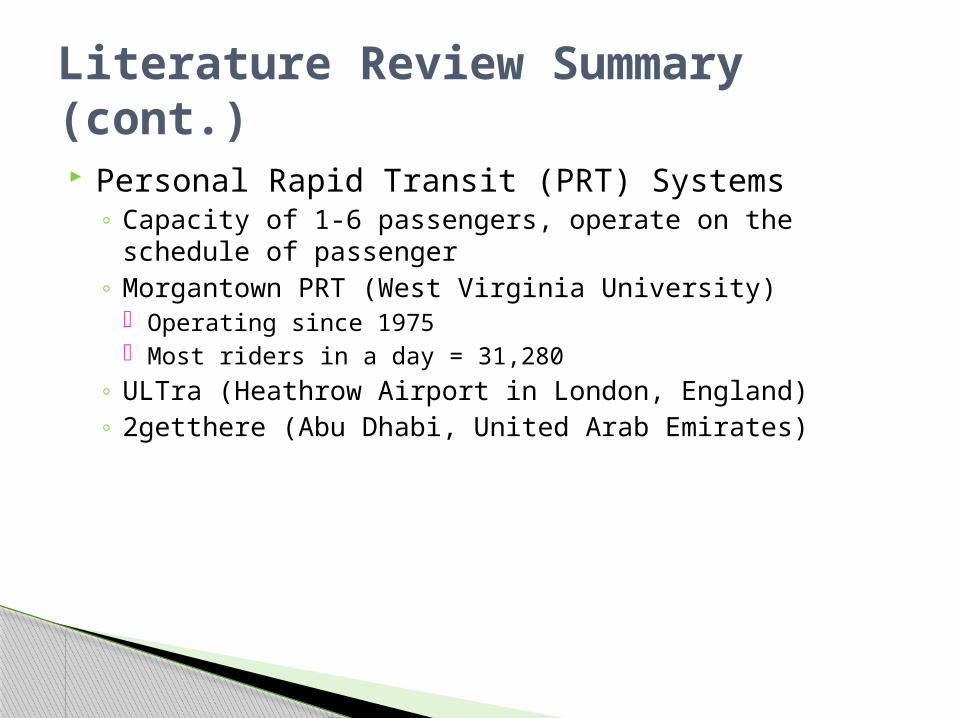
Personal Rapid Transit (PRT) Systems◦ Capacity of 1-6 passengers, operate on the schedule of
passenger◦ Morgantown PRT (West Virginia University)
Operating since 1975 Most riders in a day = 31,280
◦ ULTra (Heathrow Airport in London, England)◦ 2getthere (Abu Dhabi, United Arab Emirates)
Literature Review Summary (cont.)

List of Stakeholders COL Russell Lachance Mr. Michael Tesik, State Historical
Preservation Office (SHPO) Village of Cold Springs Mr. Rasmussen, Chief of Transportation and
Maintenance Division for West Point Corps of Cadets West Point staff and faculty West Point Garrison Community
Stakeholder Analysis
Stakeholder Analysis (cont.)
Stakeholder Analysis (cont.)
Stakeholder Analysis (cont.)
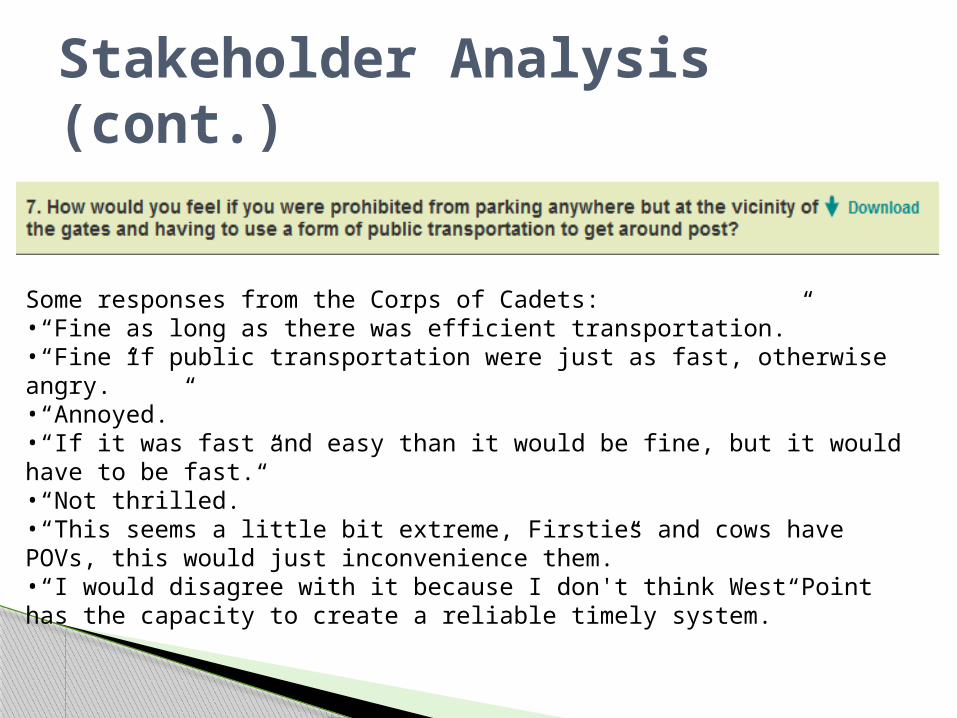
Some responses from the Corps of Cadets:•“Fine as long as there was efficient transportation.”•“Fine if public transportation were just as fast, otherwise angry.”•“Annoyed.”•“If it was fast and easy than it would be fine, but it would have to be fast.”•“Not thrilled.”•“This seems a little bit extreme, Firsties and cows have POVs, this would just inconvenience them.”•“I would disagree with it because I don't think West Point has the capacity to create a reliable timely system.”

Stakeholder Analysis (cont.)Findings Conclusions Recommendations
Aesthetics: Traditional “look and feel” of West Point must be maintained.Environment: West Point is home to many significant species of wildlife and vegetation.
Transportation system must appeal to users.
Route for transportation system will stop at the
same key areas that the bus system currently visits.
People factor in environmental-friendliness
into their transportation options.
Approximately 125 people use bus system per month. New transportation system
must be at least as effective as bus system.
Route for transportation system will travel along
roads and walkways already established to avoid harming wildlife and
vegetation.
Approximately 1/3 of all workers park in central parking areas.
95% of people can find parking.
New transportation system must aesthetically
compliment the traditional West Point “look and feel.”
JPods system will replace bus system. Cadet satisfaction with bus
service is 4.58 (on scale of 1-10). New system must not
disrupt native wildlife and vegetation in the Hudson
River area.
87% of cadets use bus system less than once a month.
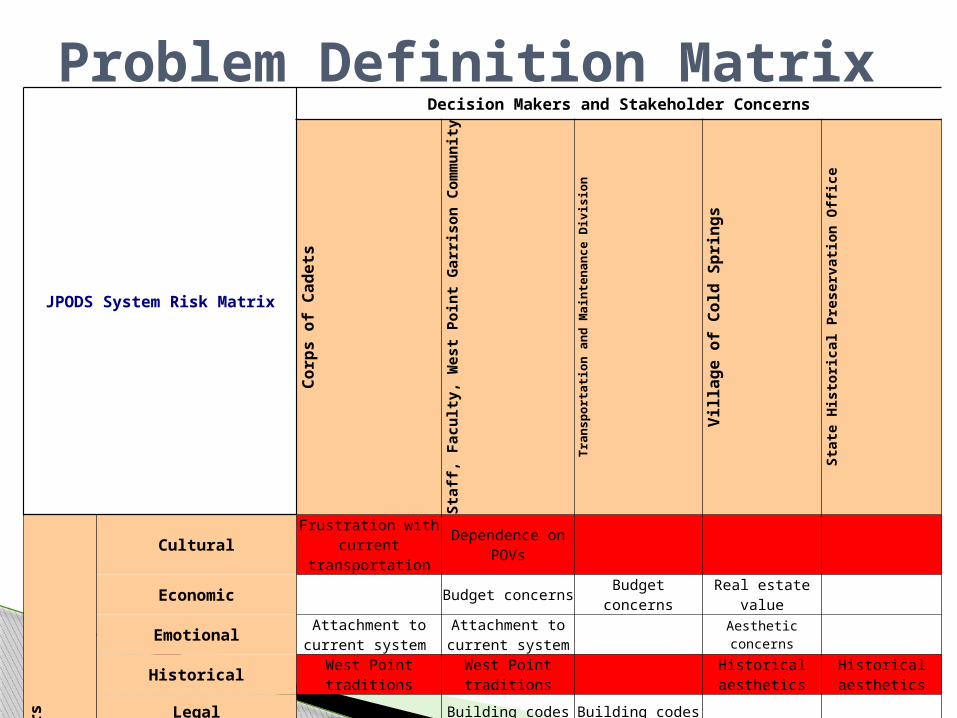
Problem Definition MatrixJPODS System Risk Matrix
Decision Makers and Stakeholder Concerns
Corps of Cadets
Staff, Faculty, West Point Garrison
Community
Transportation and Maintenance Division
Village of Cold Springs
State Historical Preservation
Office
Environmental Factors
Cultural Frustration with current transportation
Dependence on POVs
Economic Budget concerns Budget concerns Real estate value
Emotional Attachment to current system
Attachment to current system
Aesthetic concerns
Historical West Point traditions West Point traditions
Historical aesthetics
Historical aesthetics
Legal Building codes Building codes
Moral/Ethical
Natural Environment Look and feel of West Point
Look and feel of West Point
Look and feel of West Point
Preserving landscape
Preserving landscape
Organizational Changing SOP for usage
Changing SOP for usage
Incorporating JPODS into
existing systems
Political Civil-Military Relations
Department within USMA bureaucracy
Civil-Military Relations
Security
Social Cadet culture “Corps has” mentality
Technological User-friendly for people of all ages
Building new technology

How can West Point implement the JPods transportation system in a way that is aesthetically pleasing, energy-efficient, passenger-friendly, and contributes to the NetZero Energy Initiative?
Redefined Problem Statement
+ =
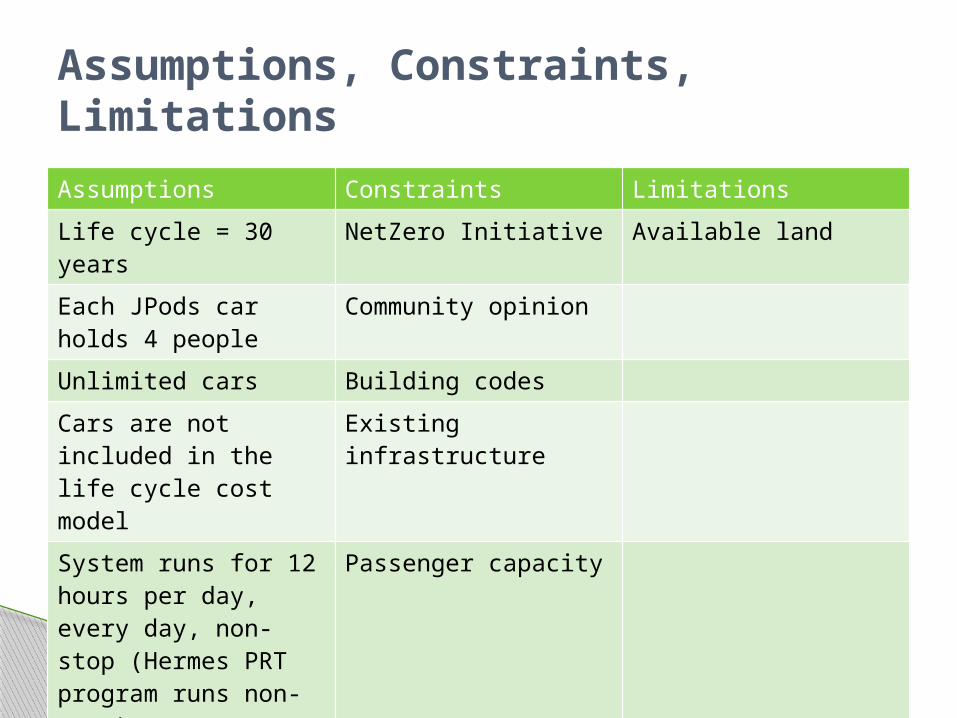
Assumptions, Constraints, Limitations
Assumptions Constraints Limitations
Life cycle = 30 years NetZero Initiative Available land
Each JPods car holds 4 people
Community opinion
Unlimited cars Building codes
Cars are not included in the life cycle cost model
Existing infrastructure
System runs for 12 hours per day, every day, non-stop (Hermes PRT program runs non-stop)
Passenger capacity

Functional Hierarchy
Implement JPods System at West Point
(1) Transport People
(3) Conserve Energy
(2) Enhance Transportation
Experience
1.1 – Measure length of track in each route1.2 – Analyze
usage of system compared to
older methods
3.1 – Research NetZero Initiative
3.2 – Assess energy usage
2.1 – Develop schedule for
Pods2.2 – Assess
improvement to current system
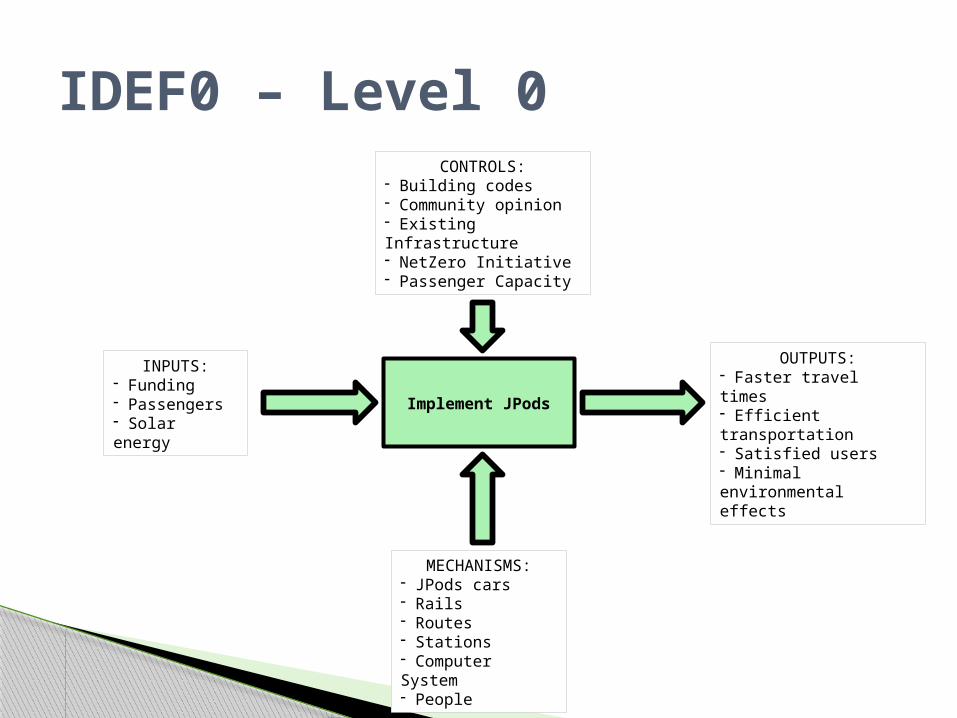
IDEF0 – Level 0
Implement JPods
CONTROLS:- Building codes- Community opinion- Existing Infrastructure- NetZero Initiative- Passenger Capacity
INPUTS:- Funding- Passengers- Solar energy
MECHANISMS:- JPods cars- Rails- Routes- Stations- Computer System- People
OUTPUTS:- Faster travel times- Efficient transportation- Satisfied users- Minimal environmental effects
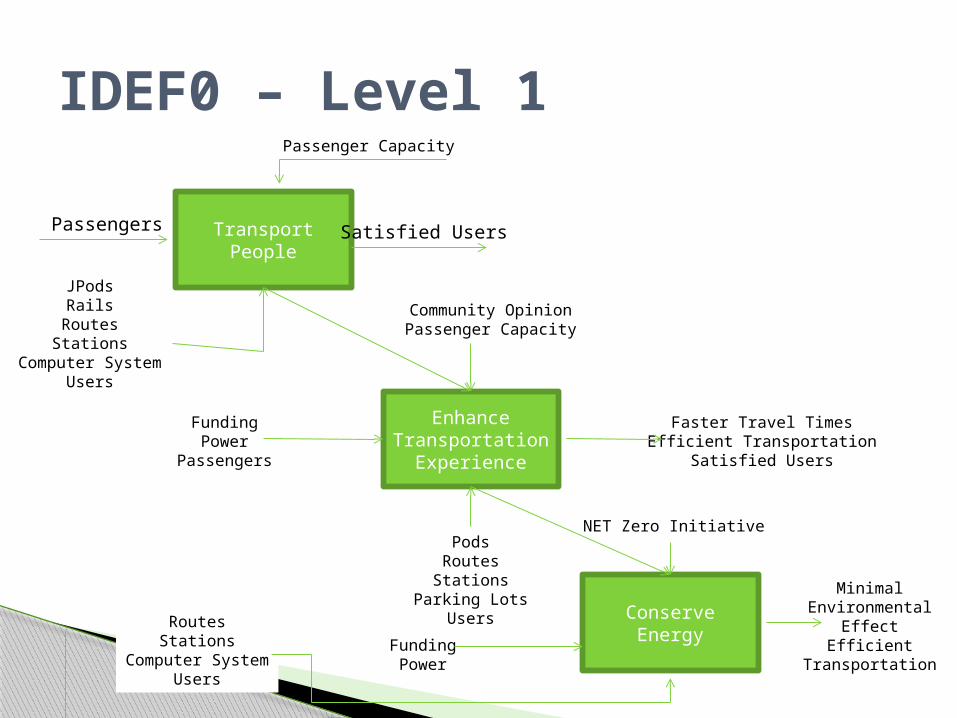
IDEF0 – Level 1
Transport People
Enhance Transportation
Experience
Conserve Energy
Passengers Satisfied Users
Faster Travel TimesEfficient Transportation
Satisfied Users
Passenger Capacity
Community OpinionPassenger Capacity
FundingPower
Passengers
FundingPower
RoutesStations
Computer SystemUsers
PodsRoutes
StationsParking Lots
Users
NET Zero Initiative
JPodsRails
RoutesStations
Computer SystemUsers
Minimal Environmental
EffectEfficient
Transportation
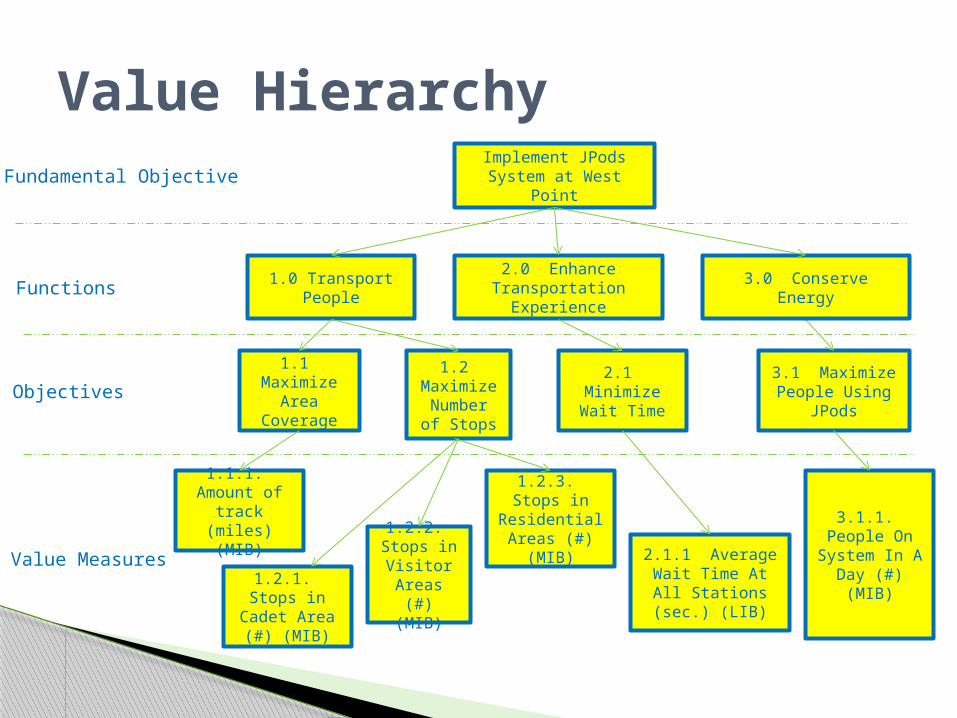
Value HierarchyImplement JPods
System at West Point
2.0 Enhance Transportation
Experience
1.0 Transport People
Fundamental Objective
Functions
Objectives
Value Measures
3.1 Maximize People Using
JPods
1.1 Maximize
Area Coverage
2.1 Minimize Wait Time
1.2 Maximize Number of
Stops
2.1.1 Average Wait Time At All Stations (sec.)
(LIB)
1.1.1. Amount of
track (miles) (MIB)
1.2.1. Stops in Cadet Area
(#) (MIB)
1.2.2. Stops in Visitor
Areas (#) (MIB)
1.2.3. Stops in Residential
Areas (#) (MIB)
3.1.1. People On
System In A Day (#)
(MIB)
3.0 Conserve Energy

Swing Weight Matrix
Level of importance of the value measure
Very Important Swt Mwt Important Swt Mwt Less Important Swt Mwt
Variation in measure
range
High
People On System In A Day 100 0.260 Stops in
Residential Areas 65 0.169
Medium
Amount of Track 90 0.234 Stops in Cadet Area 60 0.156 Average Wait Time
At All Stations 20 0.052
Low
Stops in Visitor Areas 50 0.130
Swing Weight Sum: 385
Normalized Measure Weight Sum Check: 1.000
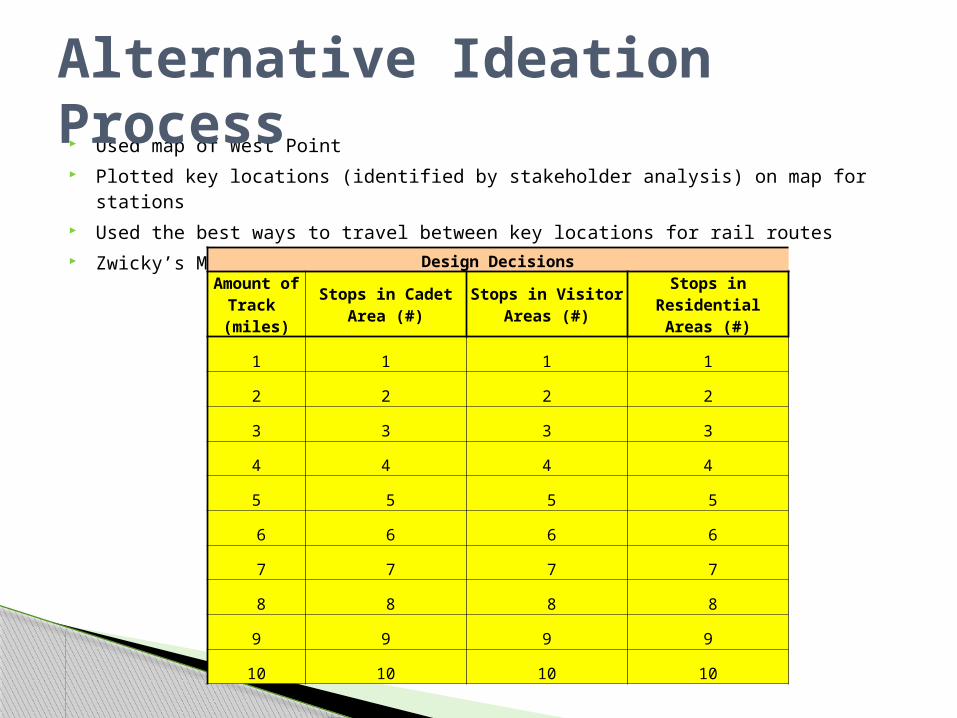
Used map of West Point Plotted key locations (identified by stakeholder analysis) on map for stations Used the best ways to travel between key locations for rail routes Zwicky’s Morphological Box
Alternative Ideation Process
Design DecisionsAmount of
Track (miles)
Stops in Cadet Area (#)
Stops in Visitor Areas (#)
Stops in Residential Areas (#)
1 1 1 1
2 2 2 2
3 3 3 3
4 4 4 4
5 5 5 5
6 6 6 6
7 7 7 7
8 8 8 8
9 9 9 9
10 10 10 10

Bare Minimum Bare Minimum Plus Mid Level Mid Level Plus Cross Country All Out
Alternatives
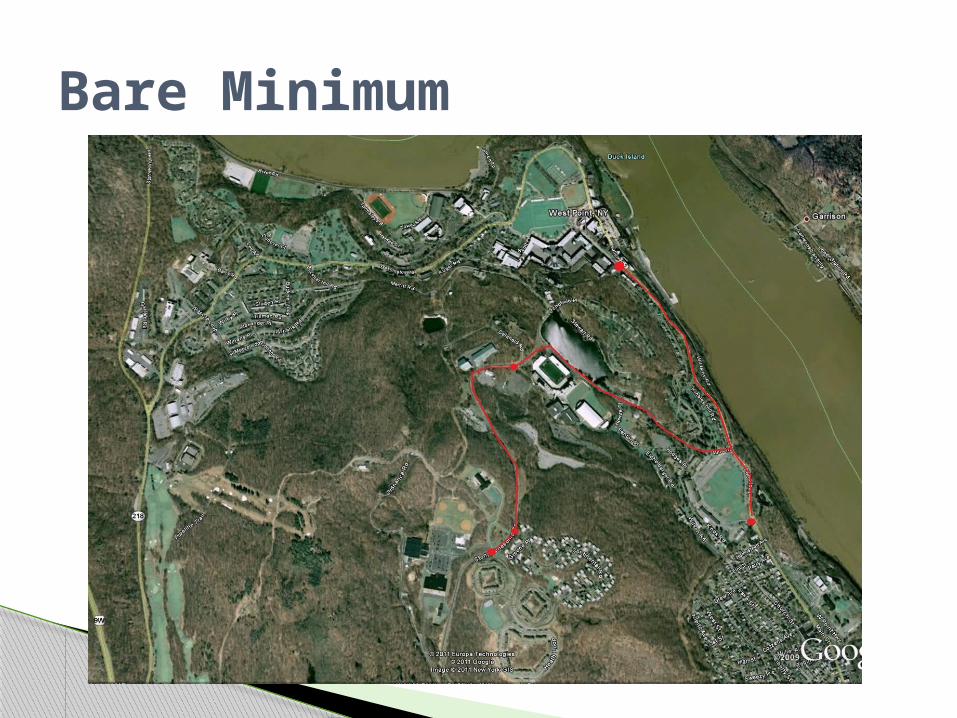
Bare Minimum
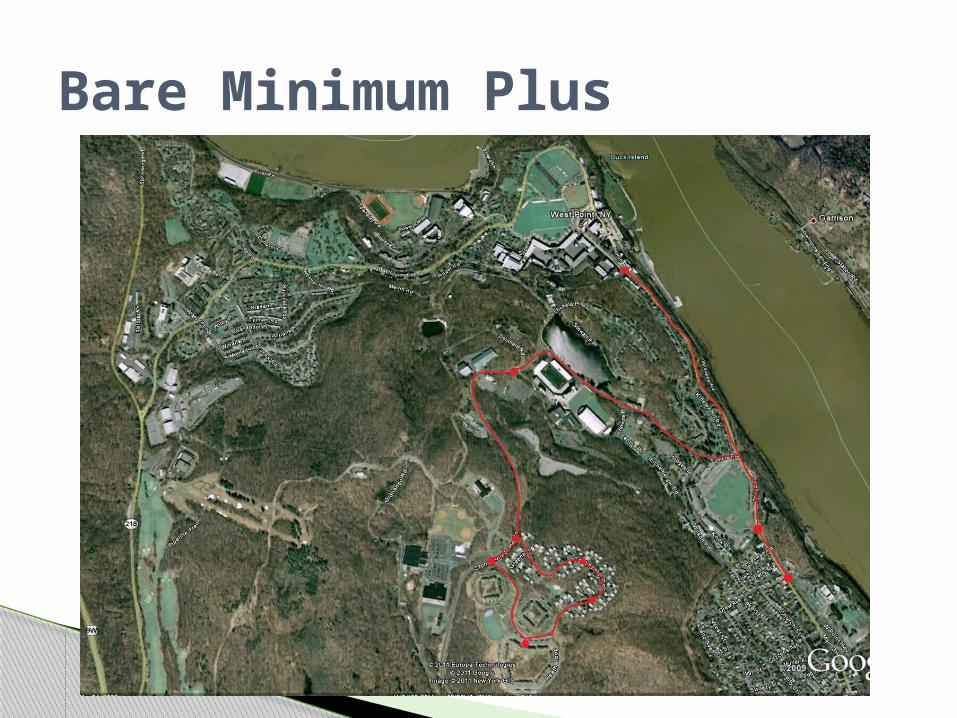
Bare Minimum Plus
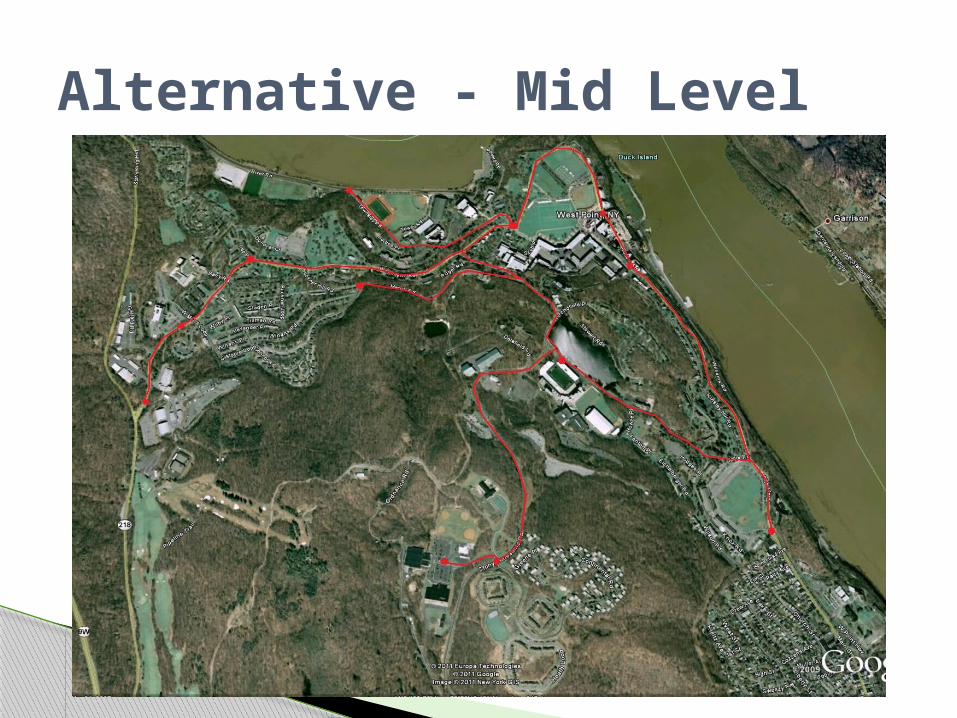
Alternative - Mid Level
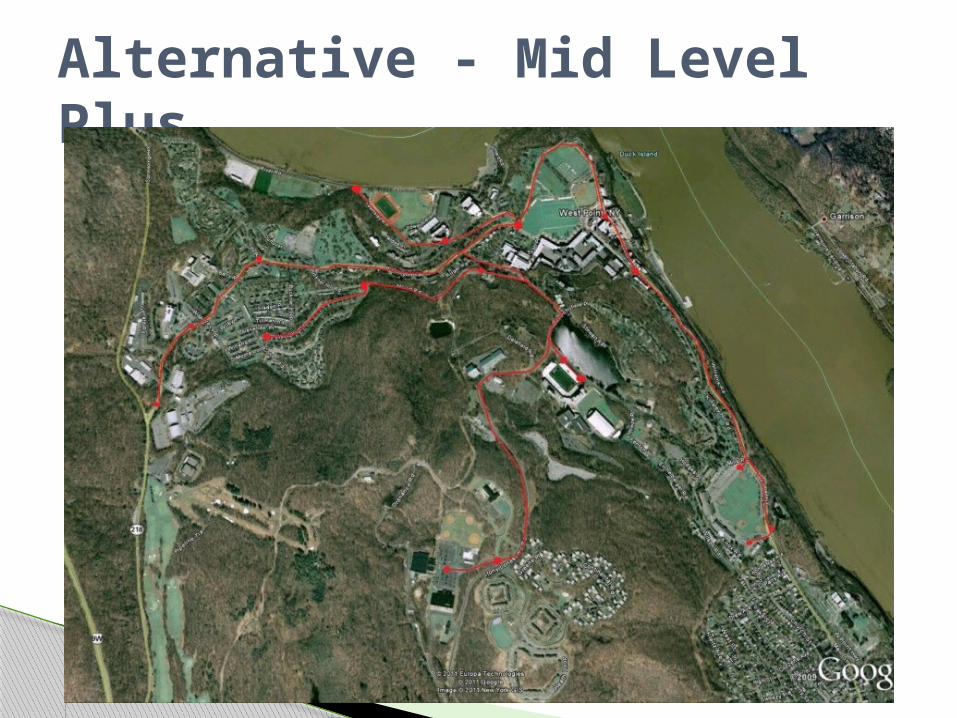
Alternative - Mid Level Plus
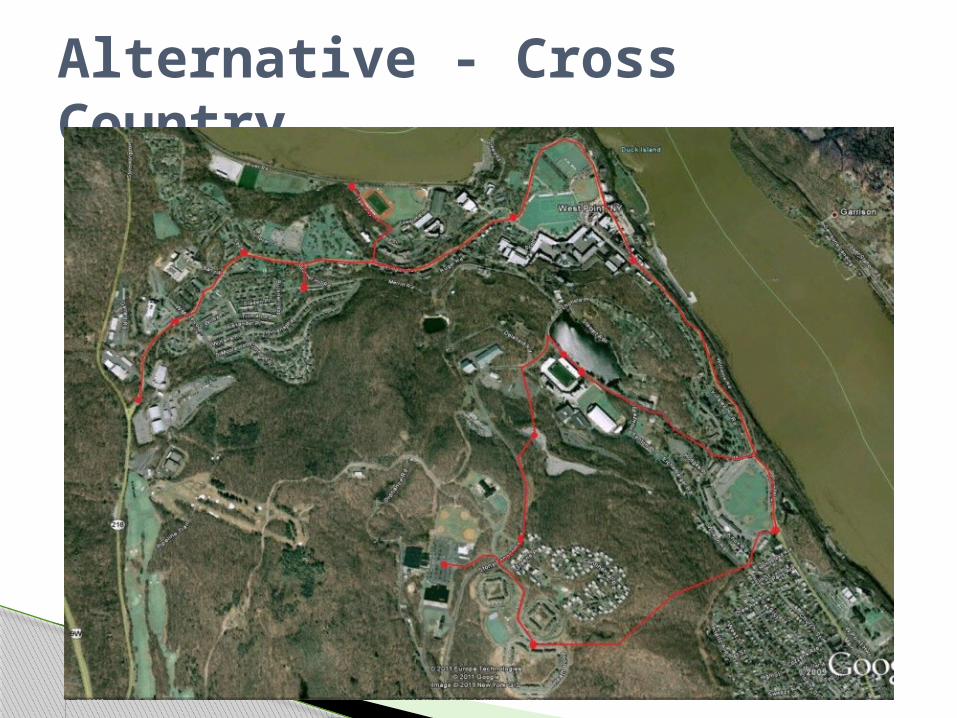
Alternative - Cross Country
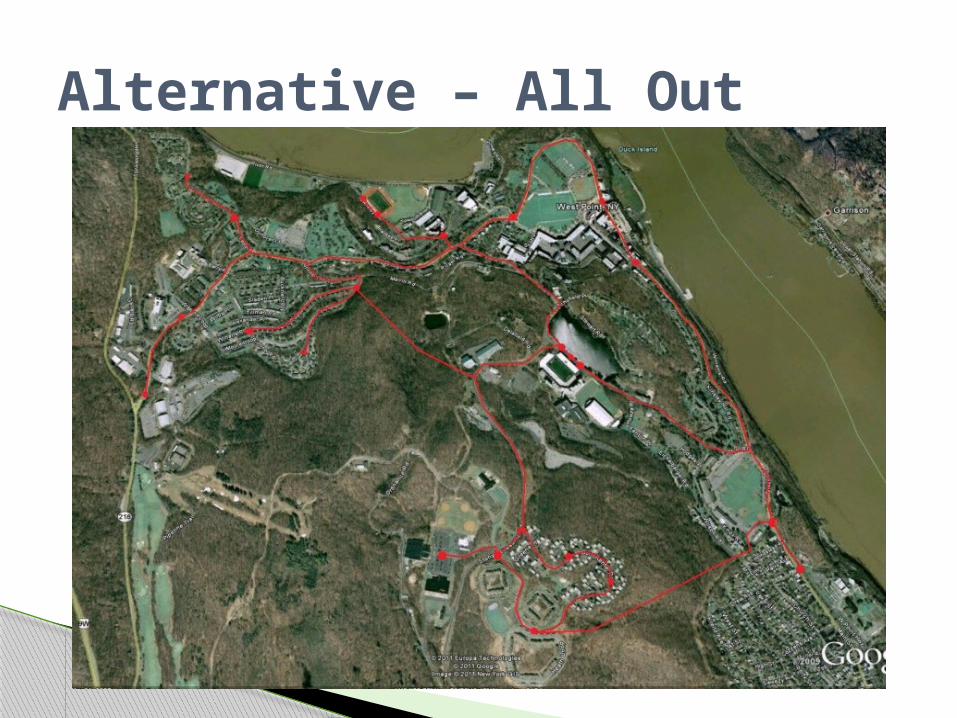
Alternative – All Out
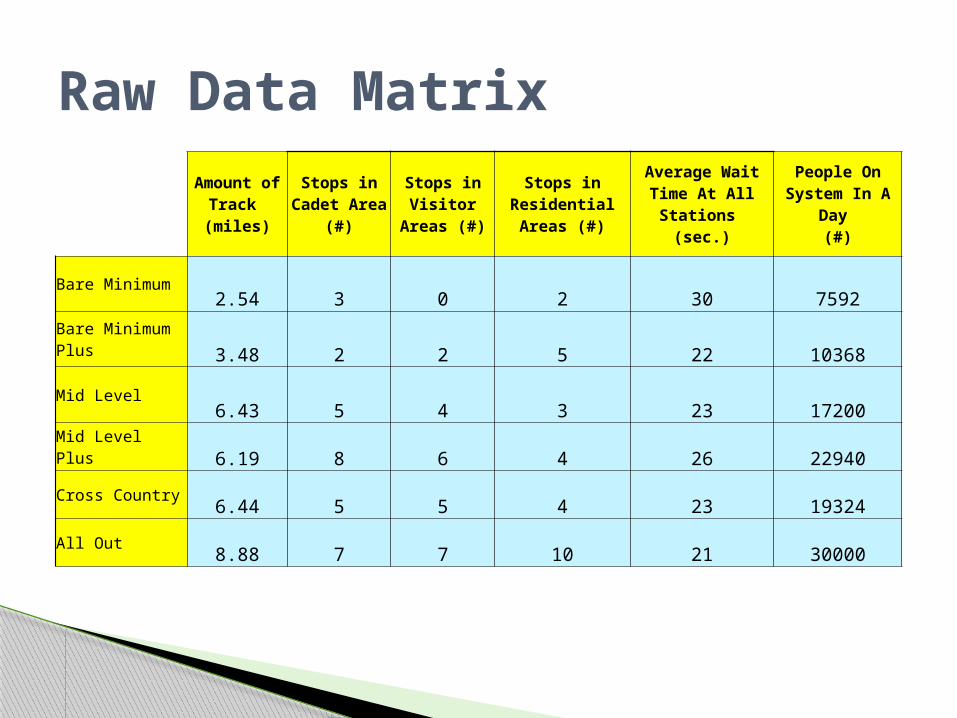
Raw Data Matrix
Amount of Track (miles)
Stops in Cadet Area
(#)
Stops in Visitor Areas
(#)
Stops in Residential Areas
(#)
Average Wait Time At All Stations
(sec.)
People On System In A Day
(#)
Bare Minimum2.54 3 0 2 30 7592
Bare Minimum Plus 3.48 2 2 5 22 10368
Mid Level6.43 5 4 3 23 17200
Mid Level Plus6.19 8 6 4 26 22940
Cross Country6.44 5 5 4 23 19324
All Out8.88 7 7 10 21 30000
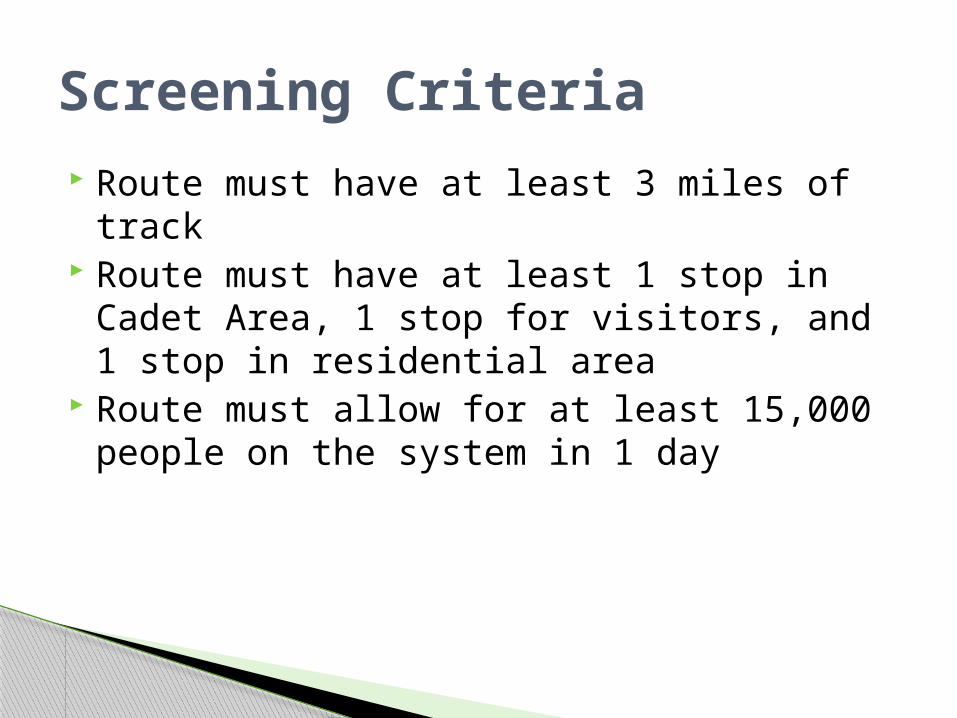
Route must have at least 3 miles of track Route must have at least 1 stop in Cadet
Area, 1 stop for visitors, and 1 stop in residential area
Route must allow for at least 15,000 people on the system in 1 day
Screening Criteria
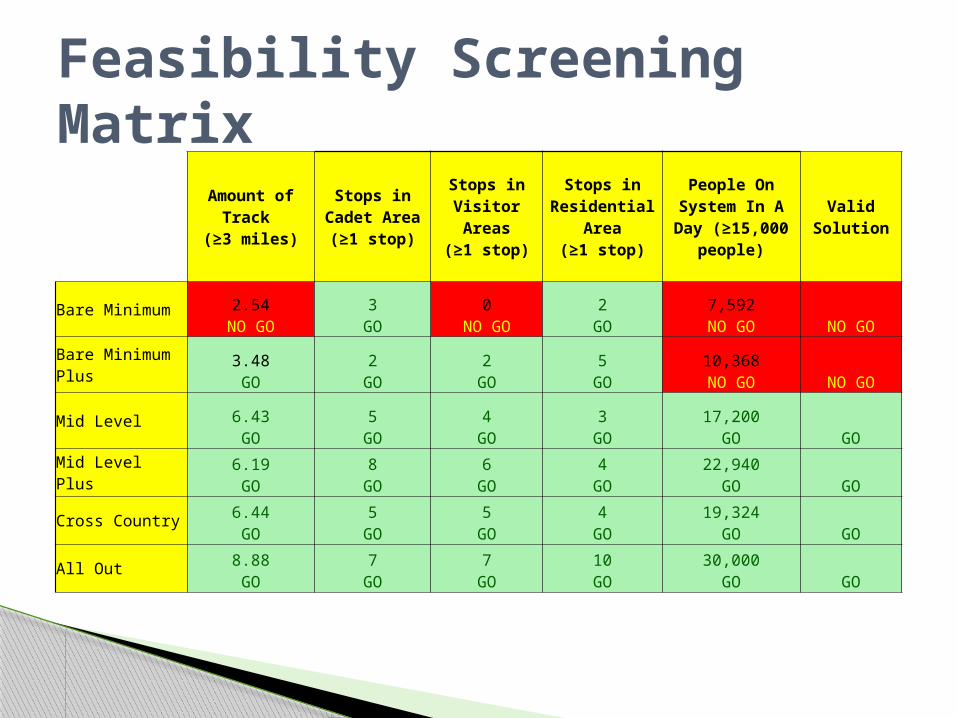
Feasibility Screening Matrix
Amount of Track (≥3 miles)
Stops in Cadet Area
(≥1 stop)
Stops in Visitor Areas
(≥1 stop)
Stops in Residential
Area(≥1 stop)
People On System In A Day (≥15,000 people)
Valid Solution
Bare Minimum 2.54NO GO
3GO
0NO GO
2GO
7,592NO GO NO GO
Bare Minimum Plus 3.48
GO2
GO2
GO5
GO10,368NO GO NO GO
Mid Level 6.43GO
5GO
4GO
3GO
17,200GO GO
Mid Level Plus 6.19GO
8GO
6GO
4GO
22,940GO GO
Cross Country 6.44GO
5GO
5GO
4GO
19,324GO GO
All Out 8.88GO
7GO
7GO
10GO
30,000GO GO

Mid Level Mid Level Plus Cross Country All Out
Candidate Solutions

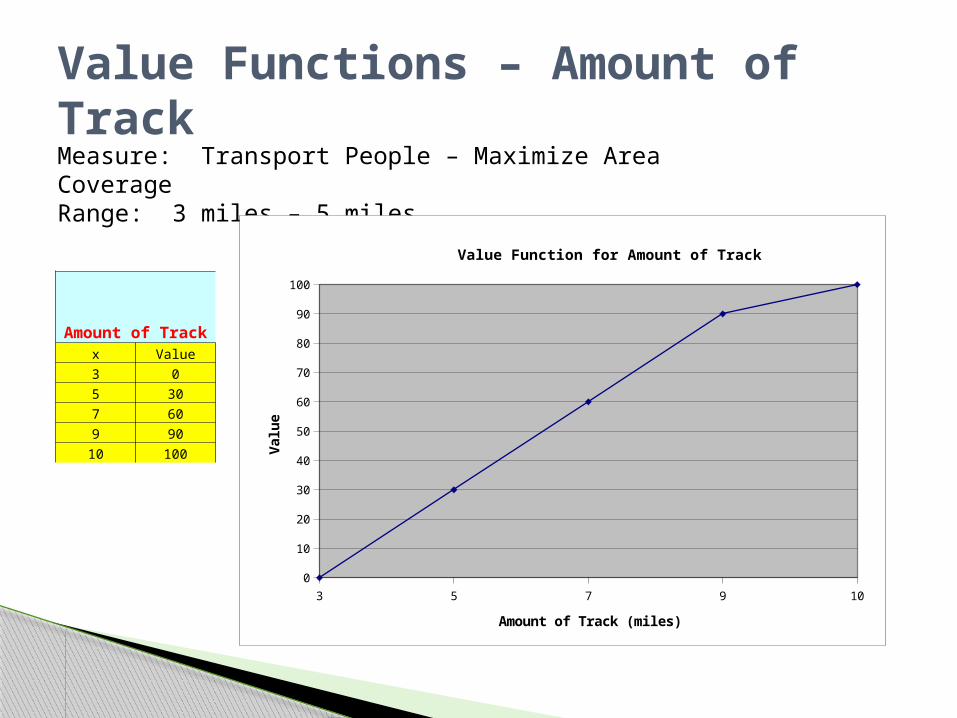
Example: Value Functions – Amount of TrackMeasure: Transport People – Maximize Area CoverageRange: 3 miles – 5 miles
Amount of Trackx Value
3 0
5 30
7 60
9 90
10 100
3 5 7 9 100
10
20
30
40
50
60
70
80
90
100
Value Function for Amount of Track
Amount of Track (miles)
Va
lue

Additive Value ModelValues attained from inputting raw data into Value Functions,
Candidate SolutionsAmount of
Track (miles)
Stops in Cadet Area (#)
Stops in Visitor Areas
(#)
Stops in Residential Areas (#)
Average Wait Time At All Stations
(sec.)
People On System In A
Day (#)
Mid Level 51.5 50.0 40.0 30.0 89.0 14.7
Mid Level Plus 47.9 80.0 60.0 40.0 86.0 52.9
Cross Country 51.6 50.0 50.0 40.0 89.0 28.8
All Out 88.2 70.0 70.0 100.0 91.0 100.0
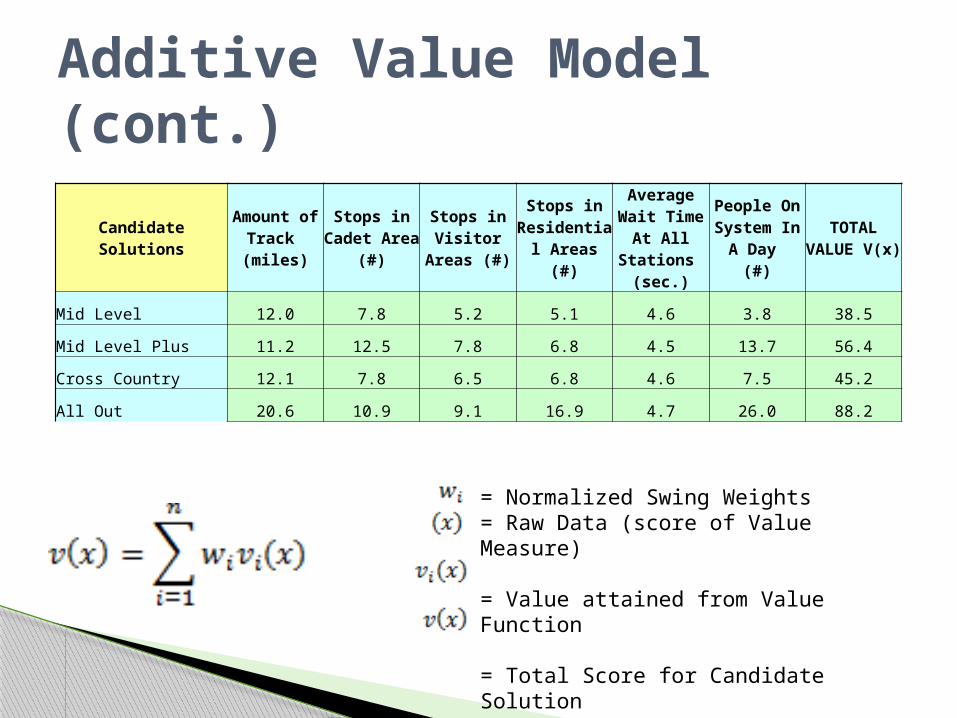
Additive Value Model (cont.)
Candidate SolutionsAmount of
Track (miles)
Stops in Cadet Area
(#)
Stops in Visitor
Areas (#)
Stops in Residential Areas (#)
Average Wait Time At All Stations
(sec.)
People On System In A
Day (#)
TOTAL VALUE V(x)
Mid Level 12.0 7.8 5.2 5.1 4.6 3.8 38.5
Mid Level Plus 11.2 12.5 7.8 6.8 4.5 13.7 56.4
Cross Country 12.1 7.8 6.5 6.8 4.6 7.5 45.2
All Out 20.6 10.9 9.1 16.9 4.7 26.0 88.2
= Normalized Swing Weights= Raw Data (score of Value Measure)
= Value attained from Value Function
= Total Score for Candidate Solution
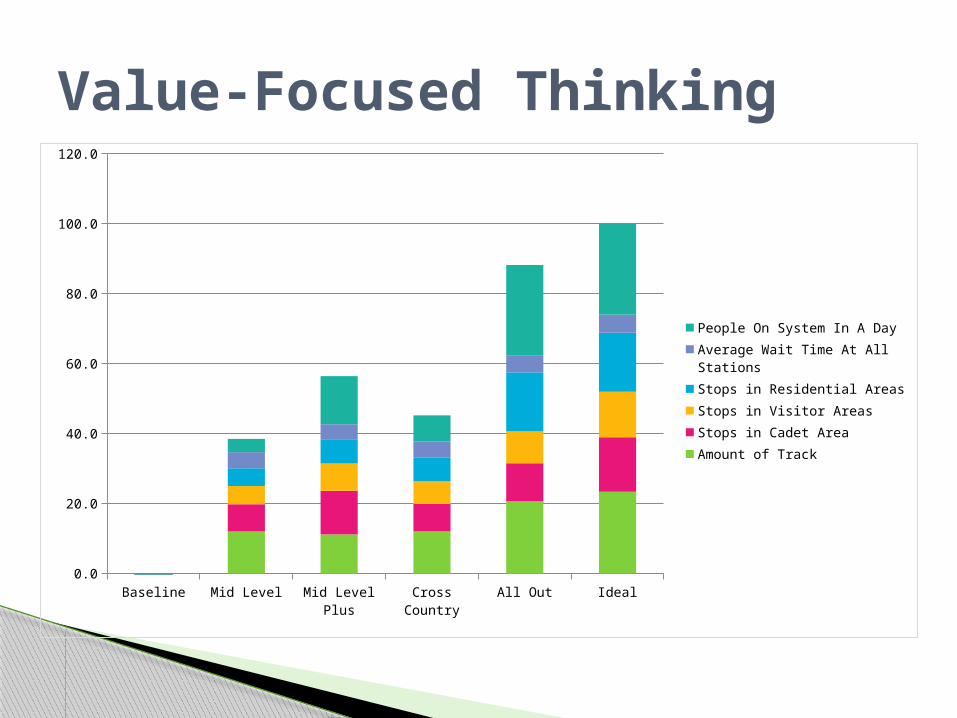
Value-Focused Thinking
Basel
ine
Mid Le
vel
Mid Le
vel P
lus
Cross
Cou
ntry
All Out
Idea
l0.0
20.0
40.0
60.0
80.0
100.0
120.0
People On System In A DayAverage Wait Time At All StationsStops in Residential AreasStops in Visitor AreasStops in Cadet AreaAmount of Track
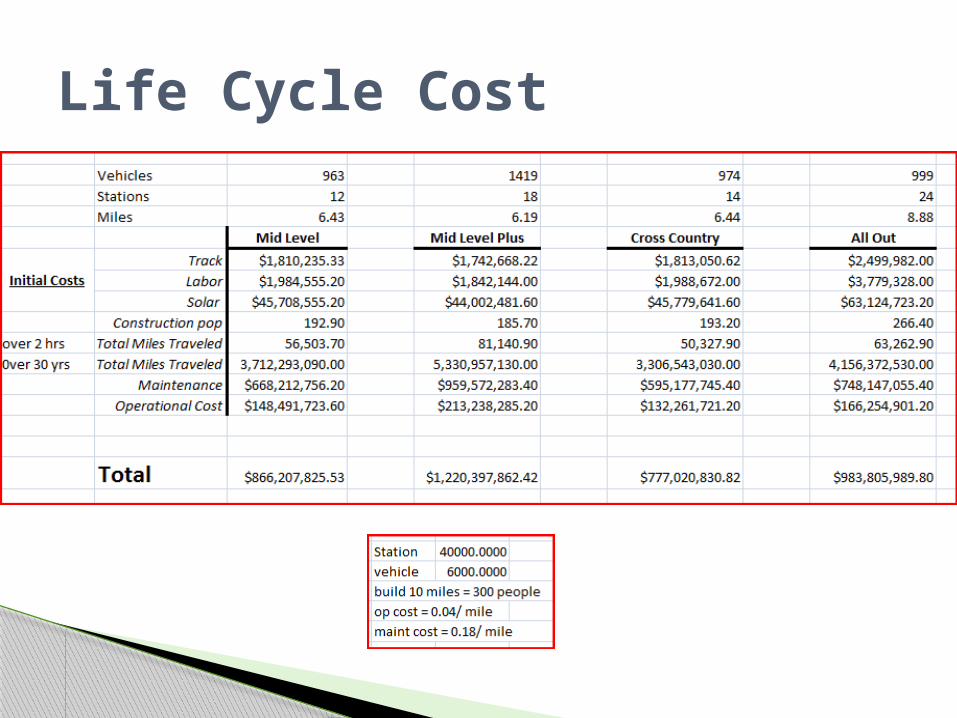
Life Cycle Cost
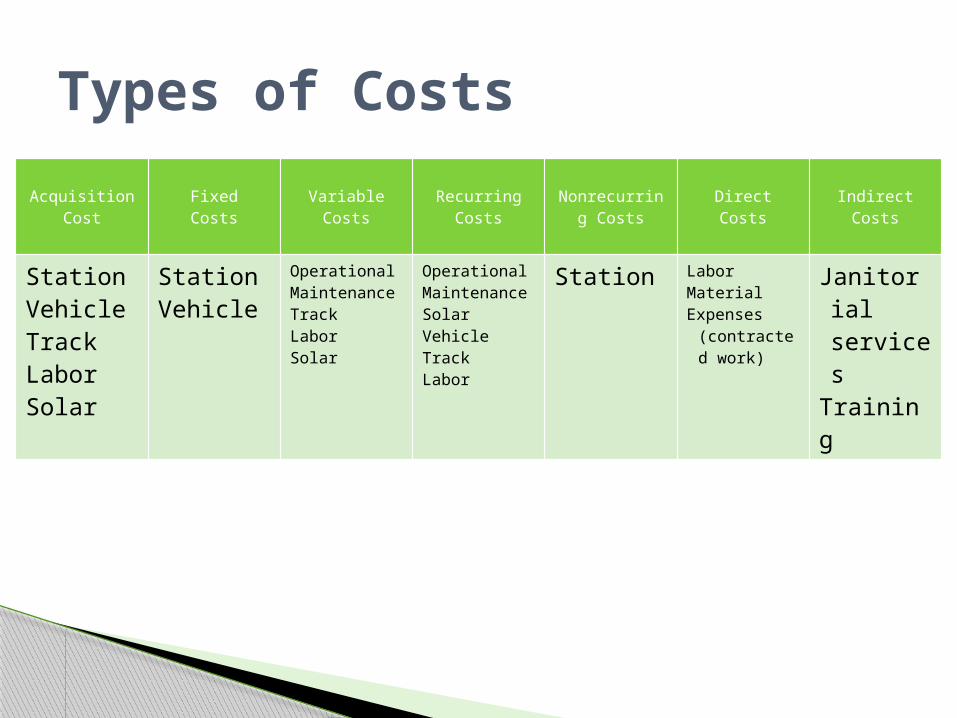
Types of Costs
Acquisition Cost
FixedCosts
Variable Costs
Recurring Costs
Nonrecurring Costs
Direct Costs Indirect Costs
StationVehicle TrackLaborSolar
StationVehicle
OperationalMaintenanceTrackLaborSolar
OperationalMaintenanceSolarVehicle TrackLabor
Station
LaborMaterialExpenses
(contracted work)
Janitorial services
Training

Cost vs. Value

Sensitivity Analysis - People On System In A Day
Not sensitive, not significant, most important value measure, large range
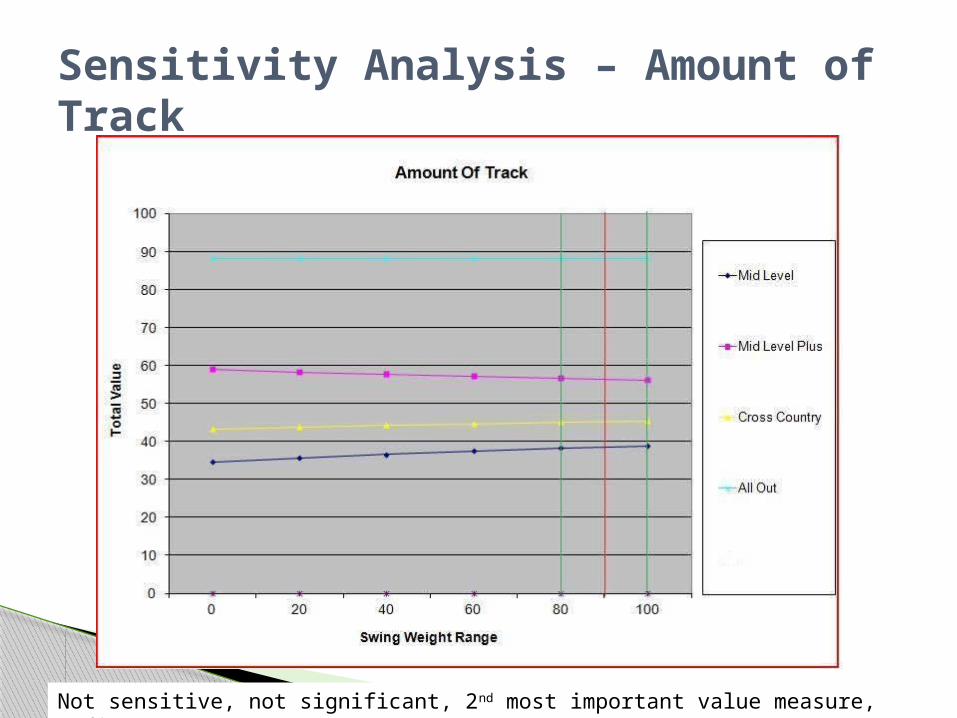
Sensitivity Analysis – Amount of Track
Not sensitive, not significant, 2nd most important value measure, medium range
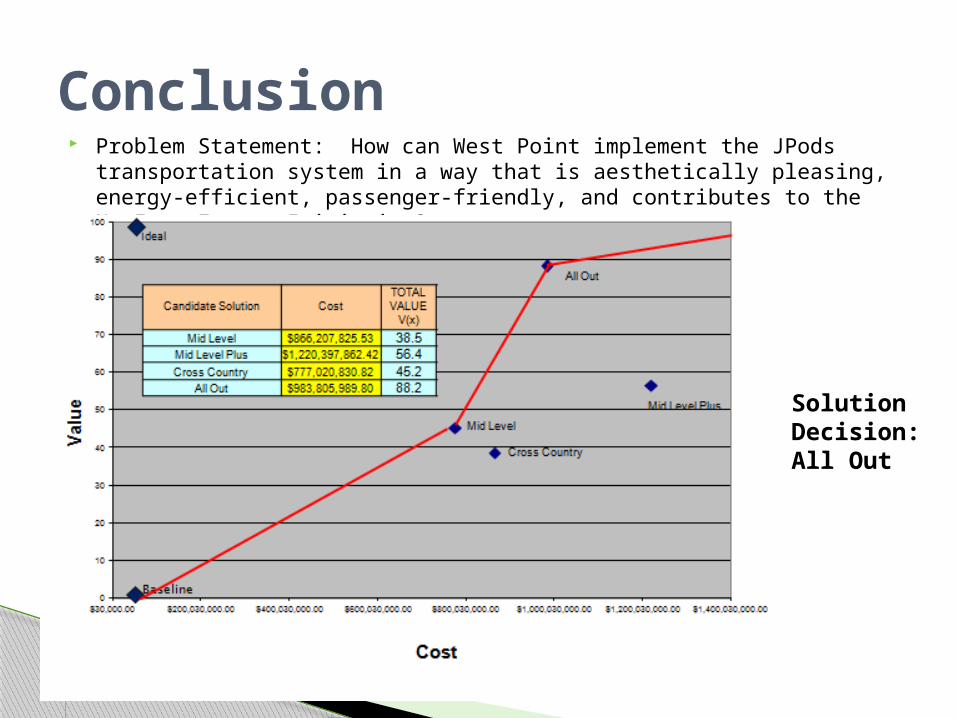
Conclusion Problem Statement: How can West Point implement the JPods
transportation system in a way that is aesthetically pleasing, energy-efficient, passenger-friendly, and contributes to the NetZero Energy Initiative?
Solution Decision:All Out
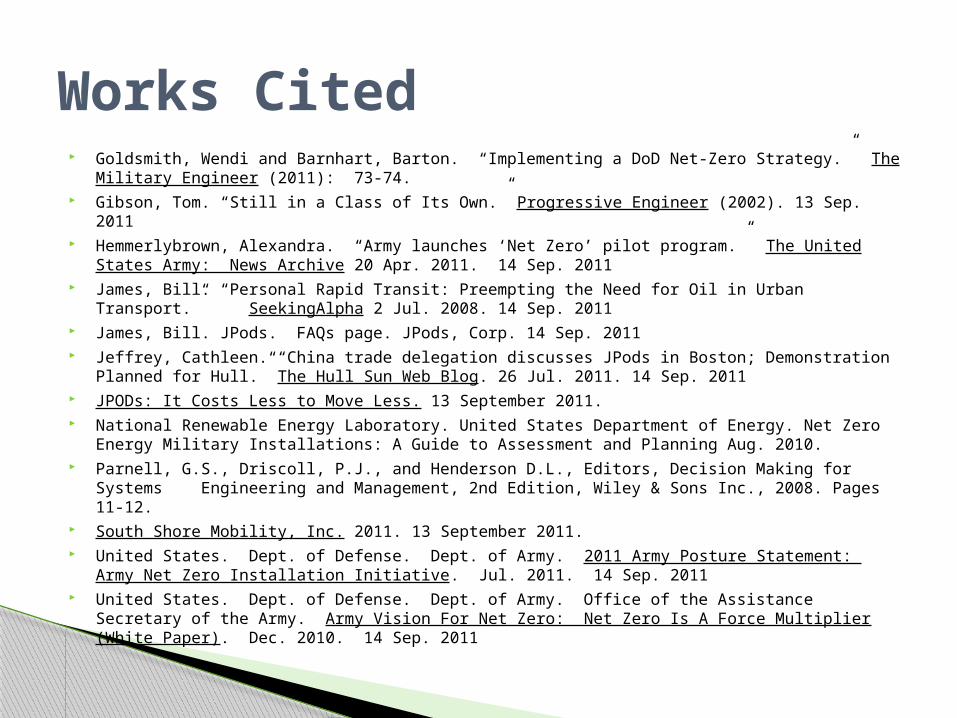
Goldsmith, Wendi and Barnhart, Barton. “Implementing a DoD Net-Zero Strategy.” The Military Engineer (2011): 73-74.
Gibson, Tom. “Still in a Class of Its Own.” Progressive Engineer (2002). 13 Sep. 2011 Hemmerlybrown, Alexandra. “Army launches ‘Net Zero’ pilot program.” The United States Army:
News Archive 20 Apr. 2011. 14 Sep. 2011 James, Bill. “Personal Rapid Transit: Preempting the Need for Oil in Urban Transport.”
SeekingAlpha 2 Jul. 2008. 14 Sep. 2011 James, Bill. JPods. FAQs page. JPods, Corp. 14 Sep. 2011 Jeffrey, Cathleen. “China trade delegation discusses JPods in Boston; Demonstration Planned for
Hull.” The Hull Sun Web Blog. 26 Jul. 2011. 14 Sep. 2011 JPODs: It Costs Less to Move Less. 13 September 2011. National Renewable Energy Laboratory. United States Department of Energy. Net Zero Energy
Military Installations: A Guide to Assessment and Planning Aug. 2010. Parnell, G.S., Driscoll, P.J., and Henderson D.L., Editors, Decision Making for Systems Engineering
and Management, 2nd Edition, Wiley & Sons Inc., 2008. Pages 11-12. South Shore Mobility, Inc. 2011. 13 September 2011. United States. Dept. of Defense. Dept. of Army. 2011 Army Posture Statement: Army Net Zero
Installation Initiative. Jul. 2011. 14 Sep. 2011 United States. Dept. of Defense. Dept. of Army. Office of the Assistance Secretary of the Army.
Army Vision For Net Zero: Net Zero Is A Force Multiplier (White Paper). Dec. 2010. 14 Sep. 2011
Works Cited

Questions?
Value Functions – Amount of TrackMeasure: Transport People – Maximize Area CoverageRange: 3 miles – 5 miles
Amount of Trackx Value
3 0
5 30
7 60
9 90
10 100
3 5 7 9 100
10
20
30
40
50
60
70
80
90
100
Value Function for Amount of Track
Amount of Track (miles)
Va
lue
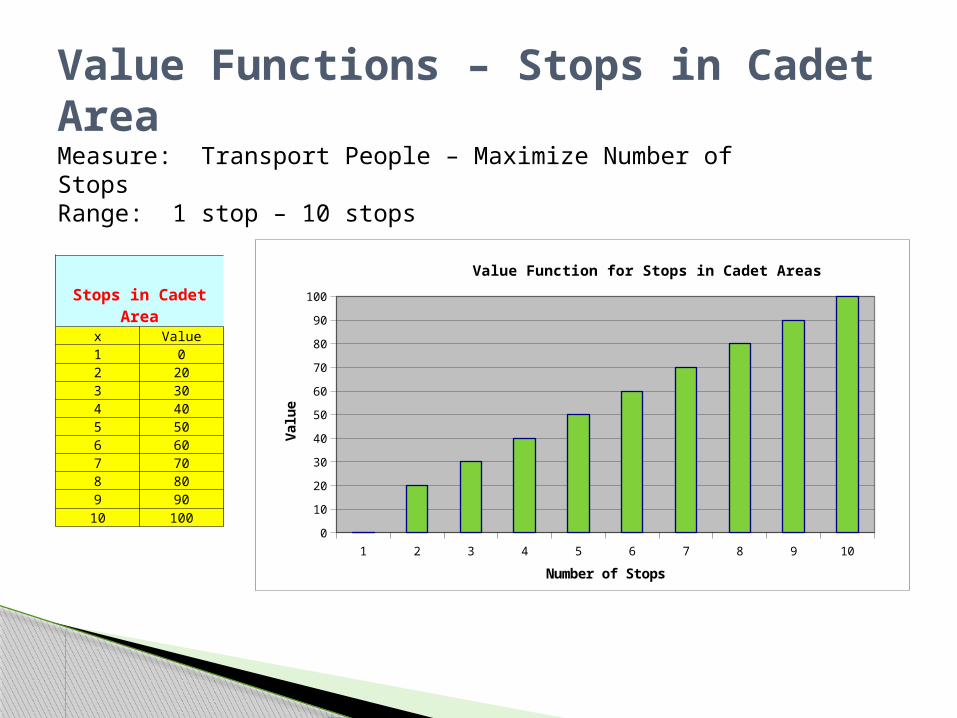
Value Functions – Stops in Cadet AreaMeasure: Transport People – Maximize Number of StopsRange: 1 stop – 10 stops
Stops in Cadet Areax Value1 02 203 304 405 506 607 708 809 90
10 100
1 2 3 4 5 6 7 8 9 100
10
20
30
40
50
60
70
80
90
100
Value Function for Stops in Cadet Areas
Number of Stops
Va
lue
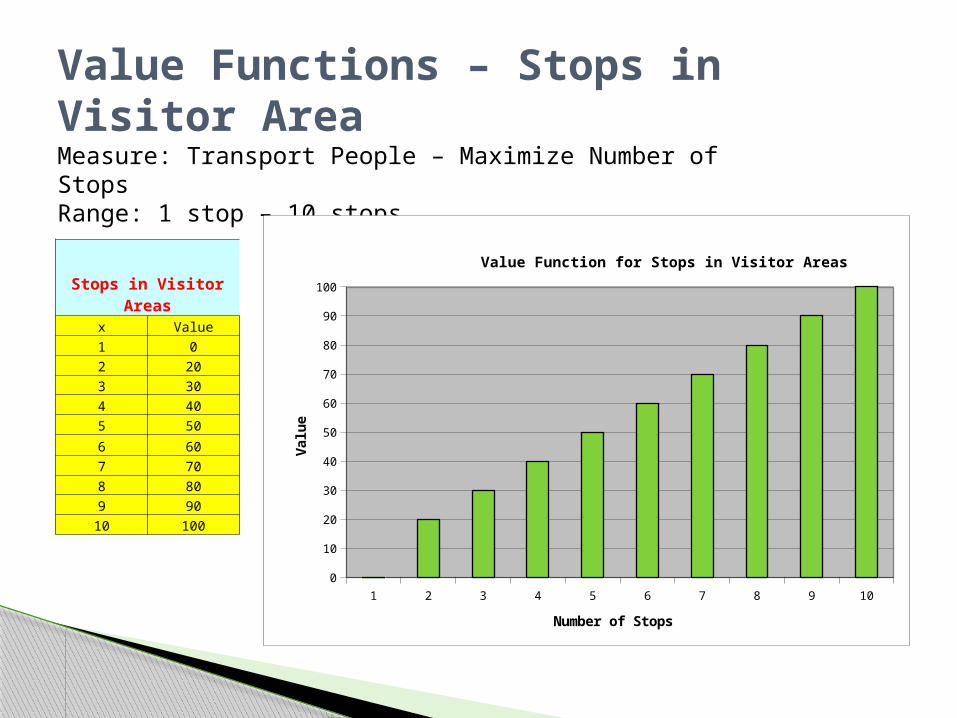
Value Functions – Stops in Visitor AreaMeasure: Transport People – Maximize Number of StopsRange: 1 stop – 10 stops
Stops in Visitor Areasx Value
1 0
2 20
3 30
4 40
5 50
6 60
7 70
8 80
9 90
10 100
1 2 3 4 5 6 7 8 9 100
10
20
30
40
50
60
70
80
90
100
Value Function for Stops in Visitor Areas
Number of Stops
Va
lue
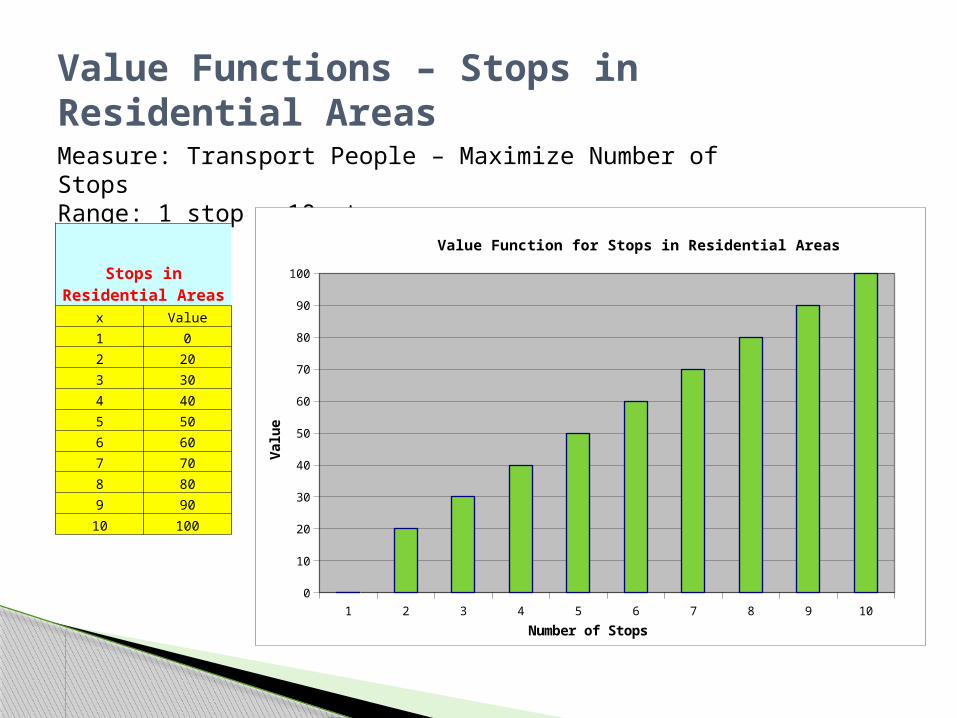
Value Functions – Stops in Residential AreasMeasure: Transport People – Maximize Number of StopsRange: 1 stop – 10 stops
Stops in Residential Areas
x Value
1 0
2 20
3 30
4 40
5 50
6 60
7 70
8 80
9 90
10 100
1 2 3 4 5 6 7 8 9 100
10
20
30
40
50
60
70
80
90
100
Value Function for Stops in Residential Areas
Number of Stops
Va
lue
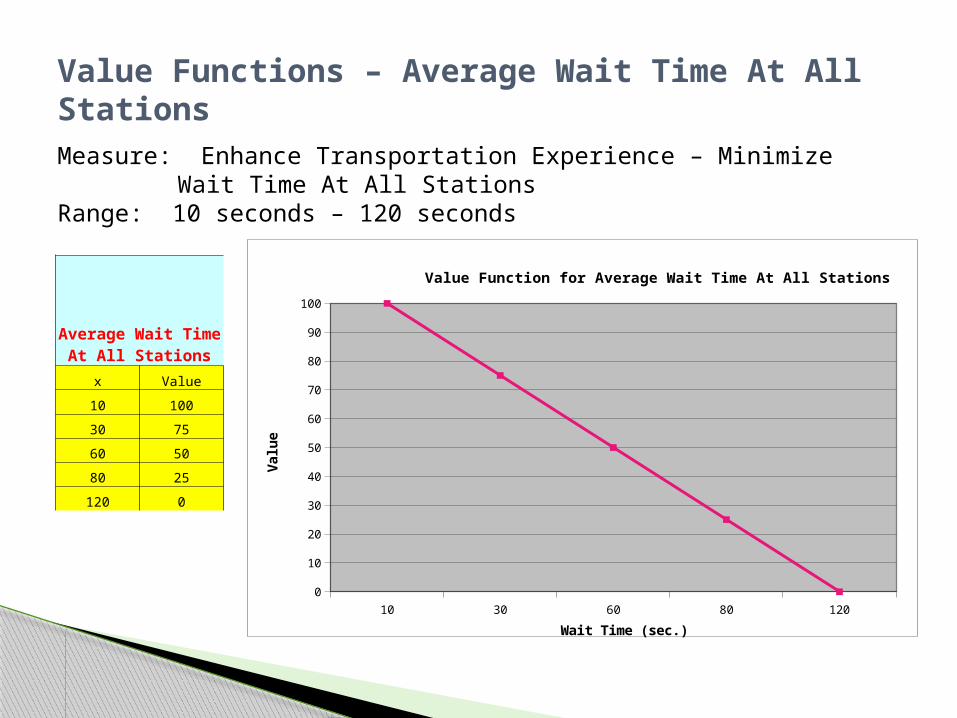
Value Functions – Average Wait Time At All StationsMeasure: Enhance Transportation Experience – Minimize Wait Time
At All StationsRange: 10 seconds – 120 seconds
Average Wait Time At All Stations
x Value
10 100
30 75
60 50
80 25
120 0
10 30 60 80 1200
10
20
30
40
50
60
70
80
90
100
Value Function for Average Wait Time At All Stations
Wait Time (sec.)
Va
lue
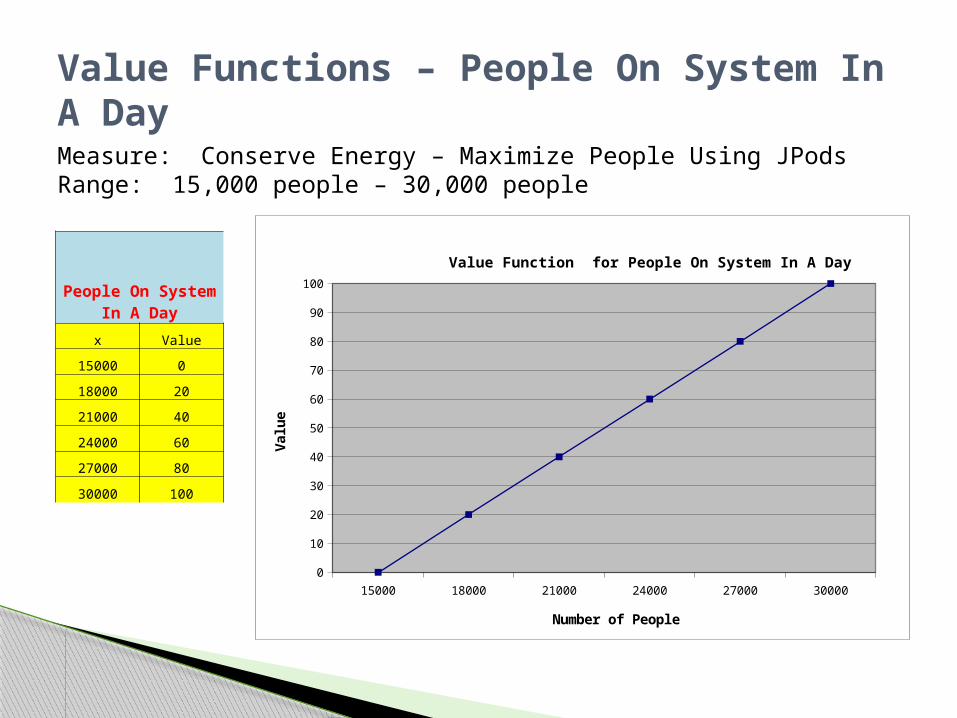
Value Functions – People On System In A DayMeasure: Conserve Energy – Maximize People Using JPodsRange: 15,000 people – 30,000 people
People On System In A Day
x Value
15000 0
18000 20
21000 40
24000 60
27000 80
30000 100
15000 18000 21000 24000 27000 300000
10
20
30
40
50
60
70
80
90
100
Value Function for People On System In A Day
Number of People
Va
lue