Embed Size (px)
Citation preview

Presenting Your Analysis Data in Autodesk® Revit® Architecture 2011
Harry MattisonPrincipal Engineer – Revit API, Autodesk

How do you go from this…

To this?

The Answer is…
The Revit Analysis Visualization Framework

Analysis Visualization Framework (AVF) Is:
1) New in 2011
2) Able to display data on faces, curves, and free points
3) Data and display are not persistent in the Revit model.
4) Images can be saved in the Revit model or exported.

Wide Range of AVF Uses
Avatech Solutions Scan To BIM Imports 3D laser scanning data
to Revit

Wide Range of AVF Uses
Autodesk Solar Radiation Technology Preview Compute and display impact of solar energy

Wide Range of AVF Uses
Display image on Revit geometryhttp://thebuildingcoder.typepad.com/blog/2010/06/display-webcam-image-on-building-element-face.html

A Video Overview

Some Key Classes
1) SpatialFieldManagerCreate or reuse this manager object for the desired view
2) AddSpatialFieldPrimitiveCreate an empty analysis results container
3) FieldDomainPoints Base class for points where results will be displayed
4) FieldValuesOne or more values at each domain point

Basic AVF Example
SpatialFieldManager sfm = SpatialFieldManager.CreateSpatialFieldManager(doc.ActiveView, 1);
int primitiveIndex = sfm.AddSpatialFieldPrimitive();
IList<XYZ> pts = new List<XYZ>();
pts.Add(new XYZ(0, 0, 0)); // one point of data at origin
FieldDomainPointsByXYZ pnts = new FieldDomainPointsByXYZ(pts);
// ByXYZ for points in 3-space, ByUV for points on face,
// ByParameter for points on curve
List<double> doubleList = new List<double>();
doubleList.Add(0); // one value corresponding to the one point in the pts list
IList<ValueAtPoint> valueList = new List<ValueAtPoint>();
ValueList.Add(new ValueAtPoint(doubleList)); // create ValueAtPoint list that contains doubleList
FieldValues fieldValues = new FieldValues(valueList); // create FieldValues container for the ValueList
sfm.UpdateSpatialFieldPrimitive(primitiveIndex, pnts, fieldValues); // Update the primitive

But First Your View Needs a Display Style
If no Analysis Display Style is set, your results will not be shown
Document doc = commandData.Application.ActiveUIDocument.Document;
AnalysisDisplayMarkersAndTextSettings markerSettings = new AnalysisDisplayMarkersAndTextSettings();
// AnalysisDisplayColoredSurfaceSettings can be used for display on a face
AnalysisDisplayColorSettings colorSettings = new AnalysisDisplayColorSettings();
AnalysisDisplayLegendSettings legendSettings = new AnalysisDisplayLegendSettings();
AnalysisDisplayStyle ads = AnalysisDisplayStyle.CreateAnalysisDisplayStyle(doc, "Markers 1", markerSettings, colorSettings, legendSettings);
// create the display style
doc.ActiveView.AnalysisDisplayStyleId = ads.Id;
// apply the style to a view (in this case, the active view)

AnalysisDisplayMarkersAndTextSettings
double MarkerSize MarkerType (circle, square, triangle) double Rounding bool ShowText TextTypeId / SetTextTypeId
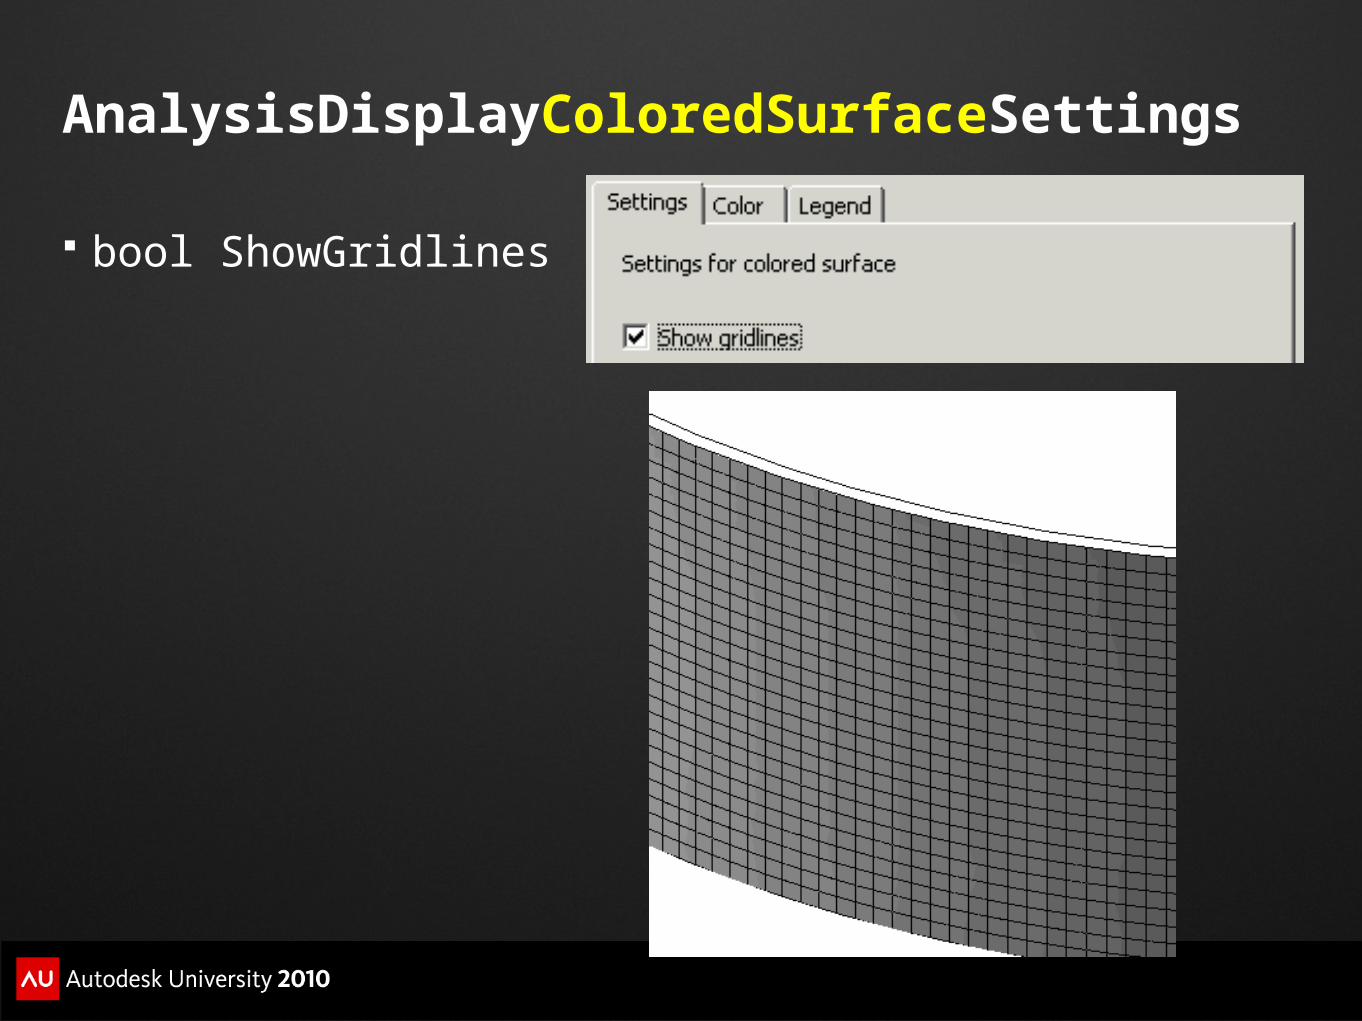
AnalysisDisplayColoredSurfaceSettings
bool ShowGridlines

AnalysisDisplayColorSettings
ColorSettingsType (Gradient, Solid Color) MaxColor MinColor Get/SetIntermediateColors
colorSettings.ColorSettingsType =
AnalysisDisplayStyleColorSettingsType.GradientColor;
colorSettings.MaxColor = new Color(10, 10, 10);
colorSettings.MinColor = new Color(250, 250, 250);
IList<AnalysisDisplayColorEntry> intermediateColorList = new List<AnalysisDisplayColorEntry>();
intermediateColorList.Add(new AnalysisDisplayColorEntry(new Color(200, 200, 200)));
intermediateColorList.Add(new AnalysisDisplayColorEntry(new Color(150, 150, 150)));
intermediateColorList.Add(new AnalysisDisplayColorEntry(new Color(100, 100, 100)));
colorSettings.SetIntermediateColors(intermediateColorList);

AnalysisDisplayLegendSettings
int NumberOfSteps double Rounding bool ShowDataDescription bool ShowDataName bool ShowLegend bool ShowUnits TextTypeId / SetTextTypeId

Units and Multipliers
Results data can be displayed using one or moreunit types
IList<string> unitNames = new List<string>();unitNames.Add(“Feet");unitNames.Add("Inches");
IList<double> multipliers = new List<double>();multipliers.Add(1);multipliers.Add(12);
spatialFieldManager.SetUnits(unitNames, multipliers);

Multiple Measurements Per Point
Each point can have one or more associated values. The “Name” property of the Analysis Results controls which set of values are shown.

Multiple Measurements Per Point
SpatialFieldManager sfm = SpatialFieldManager.CreateSpatialFieldManager(view3D, 3);
IList<string> measureNames = new List<string>();measureNames.Add("January");measureNames.Add("April");measureNames.Add("July");sfm.SetMeasurementNames(measureNames);
List<double> doubleList = new List<double>();IList<ValueAtPoint> valueList = new List<ValueAtPoint>();doubleList.Add(u);doubleList.Add(u + 15);doubleList.Add(u + 30);valueList.Add(new ValueAtPoint(doubleList));
# of measurementsper point

How to Offset Results from Curve or Face
// find center of face
UV min = face.GetBoundingBox().Min;
UV max = face.GetBoundingBox().Max;
UV faceCenter = new UV((max.U + min.U) / 2, (max.V + min.V) / 2);
// create transform 2.5 feet from face
Transform computeDerivatives = face.ComputeDerivatives(faceCenter);
XYZ faceCenterNormal = computeDerivatives.BasisZ.Normalize().Multiply(2.5);
Transform transform = Transform.get_Translation(faceCenterNormal);
int idx = sfm.AddSpatialFieldPrimitive(face, transform);

Tips & Tricks
Can't create a manager if the view already has one, so check before creating one
SpatialFieldManager sfm = SpatialFieldManager.GetSpatialFieldManager(doc.ActiveView);
if (sfm != null) sfm.Clear(); // clear any existing results
else sfm = SpatialFieldManager.CreateSpatialFieldManager(doc.ActiveView, 1);
Find existing display styleFilteredElementCollector collector = new FilteredElementCollector(doc);
ICollection<Element> collection = collector.OfClass(typeof(AnalysisDisplayStyle)).ToElements();
var displayStyle = from element in collection where element.Name == "Colored Surface" select element;
if (displayStyle.Count() == 1) view3D.AnalysisDisplayStyleId = displayStyle.First().Id;

Improving Performance
Don’t put too many points in any one Spatial Field Primitivefor (int i = 0; i < 10000; i++)
{
points.Add(new XYZ(i, 0, 0));
doubleList.Add(i);
valList.Add(new ValueAtPoint(doubleList));
doubleList.Clear();
if (i % 1000 == 0) // only put 1,000 points in each primitive
{
sfm.UpdateSpatialFieldPrimitive(primitiveIndex,
new FieldDomainPointsByXYZ(points), new FieldValues(valList));
valList.Clear();
points.Clear();
primitiveIndex = sfm.AddSpatialFieldPrimitive();
}
}

Save View to File to Retain Results Display
transaction.Start();ImageExportOptions options = new ImageExportOptions();options.ViewName = "Saved View";ElementId viewId = doc.SaveToProjectAsImage(options);transaction.Commit();

Marker Size = 0 for Smallest Possible Markers
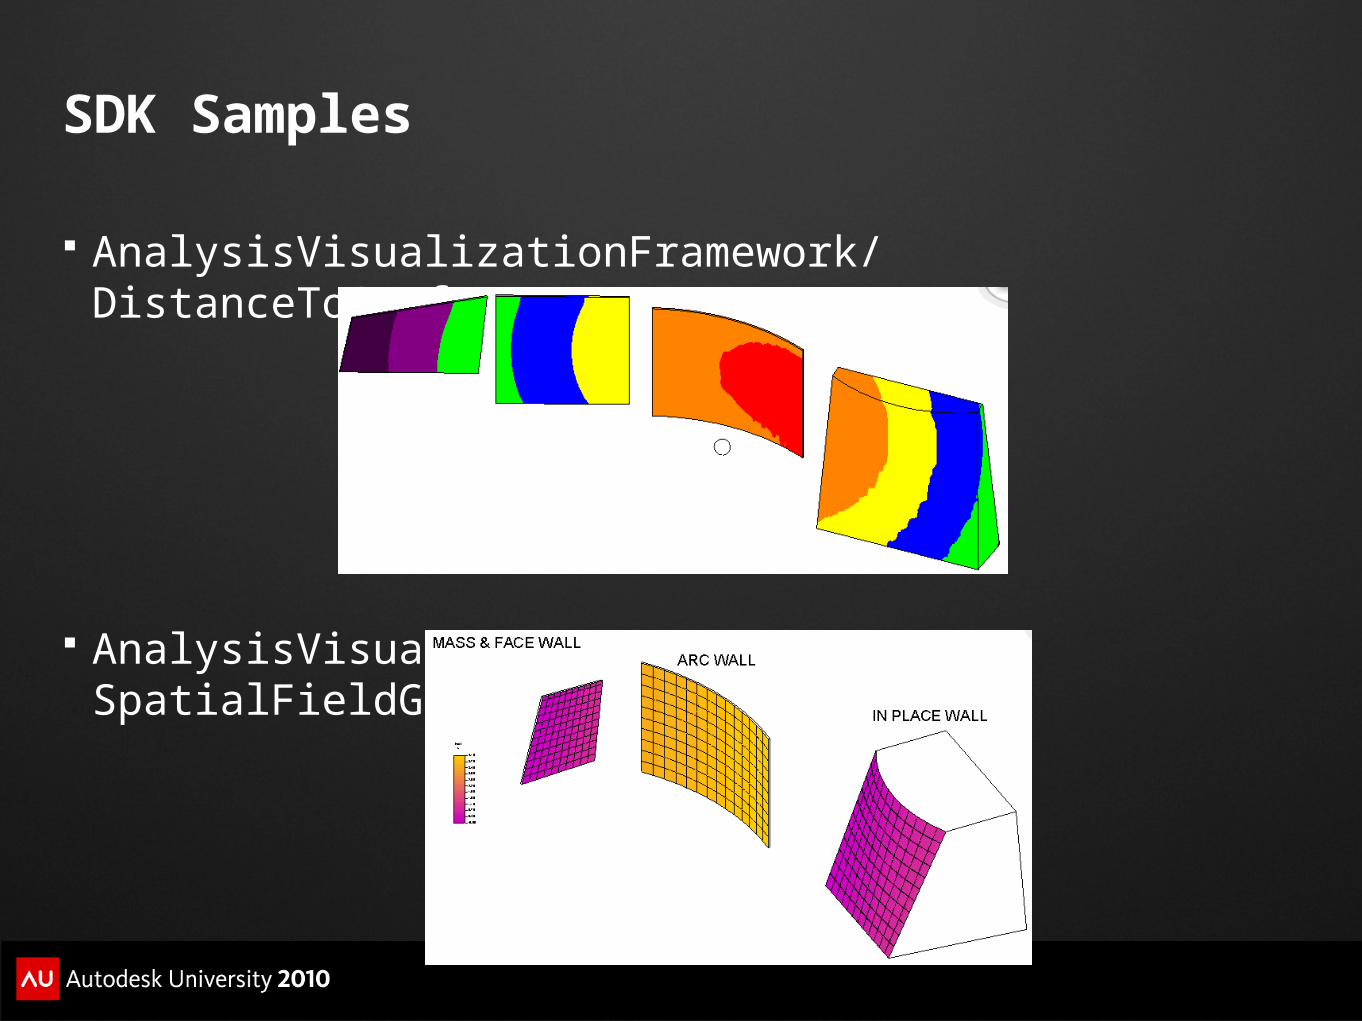
SDK Samples
AnalysisVisualizationFramework/DistanceToSurfaces
AnalysisVisualizationFramework/SpatialFieldGradient