Embed Size (px)
Citation preview
Press Release
Management, Preparationand Disclosure of the
Report on Economic andFinancial Analysis and the
Consolidated FinancialStatements of Bradesco
Organization
8
Press Release
4 Report on Economic and Financial Analysis – December 2010
Highlights
The main figures obtained by Bradesco in 2010 are presented below:
1. Book Net Income(1) in the year was R$10.022 billion (an increase of 25.1% compared to the R$8.012 billion in the same period of 2009), corresponding to earnings per share of R$2.66, and Return on Average Shareholders’ Equity(2) of 22.7%.
2. Book Net Income was composed of R$7.104 billion from financial activities, which represented 70.9% of the total, and R$2.918 billion from insurance, private pension and savings bond operations, which accounted for 29.1% of the total.
3. On December 31, 2010, Bradesco’s market capitalization stood at R$109.759 billion(3), while the value of preferred shares rose by 12.1%(4) in 2010, against the 1.0% appreciation in the Ibovespa index.
4. Total Assets stood at R$637.485 billion in December 2010, an increase of 25.9% from the balance in the same period in 2009. Return on Average Assets was 1.7%.
5. The Expanded Loan Portfolio(5) stood at R$293.555 billion in December 2010, up 23.0% from the same period in 2009. Operations with individuals totaled R$98.122 billion (up 19.5%), while operations with companies totaled R$195.433 billion (up 24.9%).
6. Total Assets under Management stood at R$872.514 billion, an increase of 24.3% from December 2009.
7. Shareholders’ Equity was R$48.043 billion in December 2010, increasing by 15.1% from the balance in the same period a year earlier. The Capital Adequacy Ratio (Basel II) stood at
14.7% in December 2010, 13.1% of which under Tier I Capital.
8. In 2010, Interest on Shareholders’ Equity and Dividends were paid and provisioned to shareholders, of which R$3.369 billion were related to income generated in 2010, of which R$1.095 billion as interim and monthly dividends paid and R$2.274 billion provisioned.
9. The Financial Margin reached R$33,056 million, up 11.1% on 2009.
10. The delinquency ratio over 90 days stood at 3.6%, down for the fifth consecutive quarter.
11. The Efficiency Ratio(6) stood at 42.7% in December 2010 (40.5% in December 2009) and the “adjusted-to-risk” ratio stood at 52.4% in December 2010 (55.9% in December 2009).
12. Insurance Written Premium, Pension Plan Contributions and Savings Bonds Income totaled R$31.078 billion(7) in 2010, up by 18.0% over 2009. Technical provisions stood at R$87.177 billion, equal to 30.6% of the Brazilian insurance market (base date: November/10).
13. Investments in infrastructure, information technology and telecommunication amounted to R$3.920 billion in 2010, growth of 13.4% compared to the previous year.
14. Taxes and contributions, including social security, paid or provisioned, amounted to R$15.782 billion, of which R$6.793 billion corresponded to taxes withheld and collected from third parties and R$8.989 billion corresponded to taxes levied on the activities of Bradesco Organization, equal to 89.7% of Book Net Income.
(1) According to what has been disclosed in chapter 6 of this Report on Economic and Financial Analysis; (2) Excludes mark-to-market effects of available-for-sale securities registered under Shareholders’ Equity; (3) R$122.831 billion considering the closing quote for preferred shares (most liquid share) on last day in the year; (4) Considering the reinvestment of dividends/interest on shareholders' equity; (5) Includes sureties and guarantees, advances of credit card receivables and credit assignments (receivables-backed investment funds and mortgage-backed receivables) and operations with Credit Risk – Commercial Portfolio (expanded criteria), which includes debentures and promissory notes; (6) Accumulated over 12 months; (7) Not considering the effect of RN 206/09 (ANS), in the total amount of R$406 million (Health); and (8) Banco24Horas ATMs + ATM terminals shared among Bradesco, Banco do Brasil and Banco Santander.
Press Release
Bradesco 5
Highlights
15. Banco Bradesco has an extensive distribution network in Brazil, with 6,551 Service Points (3,628 Branches, 1,263 PABs and 1,660 PAAs). Customers can also use 1,557 PAEs, 26,104 Bradesco Expresso service points, 6,203 Banco Postal (Postal Bank) branches, 32,015 own ATMs in the Bradesco Dia&Noite network and 11,057 ATMs shared with other banks(8).
16. The employees’ payroll plus charges and benefits totaled R$7.844 billion. Social benefits provided to the 95,248 employees of Bradesco Organization and their dependents amounted to R$1.856 billion, while investments in training and development programs totaled R$107.105 million.
17. As resolved at the December 17, 2010 Extraordinary Shareholders' Meeting, Bradesco is increasing its capital stock by R$1.5 billion, from R$28.5 billion to R$30.0 billion.
18. In November 2010, Bradesco became the first national sponsor of the Rio 2016 Olympic Games, as the exclusive financial service ad insurance provider.
19. Main Awards and Recognitions in the fourth quarter of 2010:
Elected the Bank of the Year 2010 in the Relatório Bancário (Bank Report) Award, which recognized the Institution’s contribution to develop society through its products and services, supported by an innovative and cutting-edge technological platform (Relatório Bancário Magazine);
Best Bank in Personnel Management, placing second among companies with more than 10,000 employees, in 2010 (Valor Carreira magazine / Valor Econômico newspaper);
Bradesco was considered the most valuable brand in the financial segment (Superbrands);
For the third consecutive year, it received the Prêmio Intangíveis Brasil 2010 (2010 Brazil Intangible Award), in the category “Information Technology and Internet” (Consumidor Moderno magazine);
It was one of the 20 model companies in corporate social responsibility in Brazil according to Guia Exame de Sustentabilidade 2010 (2010 Exame Sustainability Guide)/Exame Magazine;
It is one of the 42 companies to comprise the “Carbon Efficient Index” (ICO2) of the BM&FBovespa;
For the sixth straight year, Bradesco shares were included in the “Corporate Sustainability Index (ISE),” of the BM&FBovespa;
In 2010, Bradesco Corretora topped the main rankings of the Brazilian market’s most profitable stock portfolios (Valor Econômico/InfoMoney/Exame); and
Bradesco Asset Management (BRAM) was the best institutional fund manager in a ranking prepared by Investidor Institucional magazine.
20. In relation to sustainability, Bradesco divides its actions into three pillars: (i) Sustainable Finances, with a focus on banking inclusion, social and environmental variables for loan approvals and the offering of social and environmental products; (ii) Responsible Management, focused on valuing professionals, improving the workplace and adopting eco-efficient practices; and (iii) Social and Environmental Investments, focused on education, the environment, culture and sports. The highlight in this area is Fundação Bradesco, which has been developing a broad social and educational program that operates 40 schools throughout Brazil, operating in several educational fields. In 2010, it served 646 thousand people, 115 thousand of which through its own schools, in Basic Education, from Kindergarten to High School and Technical Professional Education in High School Level; Education for Youth and Adults and Preliminary and Continued Education. In the Virtual School - Fundação Bradesco’s e-learning portal - , at the CIDs – Digital Inclusion Centers and through programs conducted under strategic partnerships, like Educa+Ação, 531 thousand students were served. Basic Education students receive uniforms, school supplies, meals and medical and dental assistance free of charge. In its 54 years of service, Fundação Bradesco has provided formal, free, quality education to over 2 million students, which, combined with the other on-site and distance courses offered, rises to more than 4 million.
Press Release
6 Report on Economic and Financial Analysis – December 2010
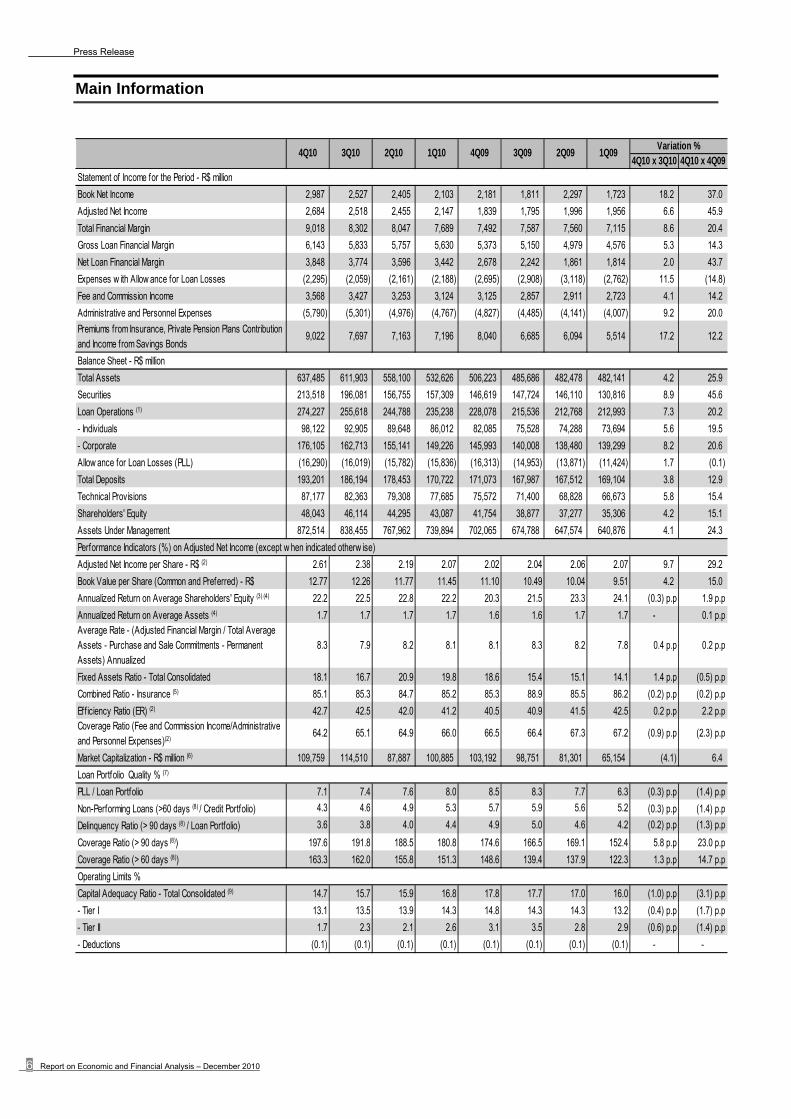
Main Information
4Q10 x 3Q10 4Q10 x 4Q09
Statement of Income for the Period - R$ million
Book Net Income 2,987 2,527 2,405 2,103 2,181 1,811 2,297 1,723 18.2 37.0
Adjusted Net Income 2,684 2,518 2,455 2,147 1,839 1,795 1,996 1,956 6.6 45.9
Total Financial Margin 9,018 8,302 8,047 7,689 7,492 7,587 7,560 7,115 8.6 20.4
Gross Loan Financial Margin 6,143 5,833 5,757 5,630 5,373 5,150 4,979 4,576 5.3 14.3
Net Loan Financial Margin 3,848 3,774 3,596 3,442 2,678 2,242 1,861 1,814 2.0 43.7
Expenses w ith Allow ance for Loan Losses (2,295) (2,059) (2,161) (2,188) (2,695) (2,908) (3,118) (2,762) 11.5 (14.8)
Fee and Commission Income 3,568 3,427 3,253 3,124 3,125 2,857 2,911 2,723 4.1 14.2
Administrative and Personnel Expenses (5,790) (5,301) (4,976) (4,767) (4,827) (4,485) (4,141) (4,007) 9.2 20.0
Premiums from Insurance, Private Pension Plans Contribution and Income from Savings Bonds
9,022 7,697 7,163 7,196 8,040 6,685 6,094 5,514 17.2 12.2
Balance Sheet - R$ million
Total Assets 637,485 611,903 558,100 532,626 506,223 485,686 482,478 482,141 4.2 25.9
Securities 213,518 196,081 156,755 157,309 146,619 147,724 146,110 130,816 8.9 45.6
Loan Operations (1) 274,227 255,618 244,788 235,238 228,078 215,536 212,768 212,993 7.3 20.2
- Individuals 98,122 92,905 89,648 86,012 82,085 75,528 74,288 73,694 5.6 19.5
- Corporate 176,105 162,713 155,141 149,226 145,993 140,008 138,480 139,299 8.2 20.6
Allow ance for Loan Losses (PLL) (16,290) (16,019) (15,782) (15,836) (16,313) (14,953) (13,871) (11,424) 1.7 (0.1)
Total Deposits 193,201 186,194 178,453 170,722 171,073 167,987 167,512 169,104 3.8 12.9
Technical Provisions 87,177 82,363 79,308 77,685 75,572 71,400 68,828 66,673 5.8 15.4
Shareholders' Equity 48,043 46,114 44,295 43,087 41,754 38,877 37,277 35,306 4.2 15.1
Assets Under Management 872,514 838,455 767,962 739,894 702,065 674,788 647,574 640,876 4.1 24.3
Performance Indicators (%) on Adjusted Net Income (except w hen indicated otherw ise)
Adjusted Net Income per Share - R$ (2) 2.61 2.38 2.19 2.07 2.02 2.04 2.06 2.07 9.7 29.2
Book Value per Share (Common and Preferred) - R$ 12.77 12.26 11.77 11.45 11.10 10.49 10.04 9.51 4.2 15.0
Annualized Return on Average Shareholders' Equity (3) (4) 22.2 22.5 22.8 22.2 20.3 21.5 23.3 24.1 (0.3) p.p 1.9 p.p
Annualized Return on Average Assets (4) 1.7 1.7 1.7 1.7 1.6 1.6 1.7 1.7 - 0.1 p.pAverage Rate - (Adjusted Financial Margin / Total Average Assets - Purchase and Sale Commitments - Permanent Assets) Annualized
8.3 7.9 8.2 8.1 8.1 8.3 8.2 7.8 0.4 p.p 0.2 p.p
Fixed Assets Ratio - Total Consolidated 18.1 16.7 20.9 19.8 18.6 15.4 15.1 14.1 1.4 p.p (0.5) p.p
Combined Ratio - Insurance (5) 85.1 85.3 84.7 85.2 85.3 88.9 85.5 86.2 (0.2) p.p (0.2) p.p
Efficiency Ratio (ER) (2) 42.7 42.5 42.0 41.2 40.5 40.9 41.5 42.5 0.2 p.p 2.2 p.pCoverage Ratio (Fee and Commission Income/Administrative and Personnel Expenses)(2)
64.2 65.1 64.9 66.0 66.5 66.4 67.3 67.2 (0.9) p.p (2.3) p.p
Market Capitalization - R$ million (6) 109,759 114,510 87,887 100,885 103,192 98,751 81,301 65,154 (4.1) 6.4
Loan Portfolio Quality % (7)
PLL / Loan Portfolio 7.1 7.4 7.6 8.0 8.5 8.3 7.7 6.3 (0.3) p.p (1.4) p.p
Non-Performing Loans (>60 days (8) / Credit Portfolio) 4.3 4.6 4.9 5.3 5.7 5.9 5.6 5.2 (0.3) p.p (1.4) p.p
Delinquency Ratio (> 90 days (8) / Loan Portfolio) 3.6 3.8 4.0 4.4 4.9 5.0 4.6 4.2 (0.2) p.p (1.3) p.p
Coverage Ratio (> 90 days (8)) 197.6 191.8 188.5 180.8 174.6 166.5 169.1 152.4 5.8 p.p 23.0 p.p
Coverage Ratio (> 60 days (8)) 163.3 162.0 155.8 151.3 148.6 139.4 137.9 122.3 1.3 p.p 14.7 p.p
Operating Limits %
Capital Adequacy Ratio - Total Consolidated (9) 14.7 15.7 15.9 16.8 17.8 17.7 17.0 16.0 (1.0) p.p (3.1) p.p
- Tier I 13.1 13.5 13.9 14.3 14.8 14.3 14.3 13.2 (0.4) p.p (1.7) p.p
- Tier II 1.7 2.3 2.1 2.6 3.1 3.5 2.8 2.9 (0.6) p.p (1.4) p.p
- Deductions (0.1) (0.1) (0.1) (0.1) (0.1) (0.1) (0.1) (0.1) - -
4Q10 3Q10 2Q10 1Q10Variation %
4Q09 3Q09 2Q09 1Q09

Press Release
Bradesco 7
Main Information
Variation %Dec10 x Sep10
Dec10 x Dec09
Structural Information - Units
Service Points 54,884 52,015 49,154 46,570 44,577 42,563 41,003 39,275 5.5 23.1
- Branches 3,628 3,498 3,476 3,455 3,454 3,419 3,406 3,375 3.7 5.0
- Advanced Service Branch (PAAs) (10) 1,660 1,643 1,592 1,451 1,371 1,338 1,260 1,183 1.0 21.1
- Mini-Branches (PABs) (10) 1,263 1,233 1,215 1,200 1,190 1,194 1,192 1,184 2.4 6.1
- Electronic Service Branch (PAEs) (10) 1,557 1,559 1,565 1,564 1,551 1,539 1,528 1,512 (0.1) 0.4
- Outplaced Bradesco ATM Netw ork Terminals (11) 3,891 4,104 3,827 3,664 3,577 3,569 3,516 3,389 (5.2) 8.8
- Shared Netw ork ATM Terminals (11) (12) 9,765 8,113 7,358 6,912 6,486 5,980 5,558 5,068 20.4 50.6
- Banco Postal (Postal Bank) 6,203 6,194 6,177 6,110 6,067 6,038 6,011 5,959 0.1 2.2
- Bradesco Expresso (Correspondent Banks) 26,104 24,887 23,190 21,501 20,200 18,722 17,699 16,710 4.9 29.2
- Bradesco Promotora de Vendas 801 773 743 702 670 753 822 884 3.6 19.6
- Branches/Subsidiaries Abroad 12 11 11 11 11 11 11 11 9.1 9.1
ATM terminals 43,072 41,007 39,766 38,772 37,957 37,178 36,430 35,443 5.0 13.5
- Ow n Netw ork 32,015 31,759 31,387 30,909 30,657 30,414 30,191 29,764 0.8 4.4
- ATM terminals shared w ith other banks (12) 11,057 9,248 8,379 7,863 7,300 6,764 6,239 5,679 19.6 51.5
Credit and Debit Cards (13) - in million 145.2 140.7 137.8 135.6 132.9 88.4 86.3 85.2 3.2 9.3
Employees (14) 95,248 92,003 89,204 88,080 87,674 85,027 85,871 86,650 3.5 8.6
Employees and Interns 9,999 9,796 8,913 9,605 9,589 9,606 9,439 9,292 2.1 4.3
Foundation Employees (15) 3,693 3,756 3,734 3,713 3,654 3,696 3,645 3,674 (1.7) 1.1
Customers - in millions
Checking Accounts 23.1 22.5 21.9 21.2 20.9 20.7 20.4 20.2 2.7 10.5
Savings Accounts (16) 41.1 38.5 37.1 36.2 37.7 35.1 33.9 34.2 6.8 9.0
Insurance Group 36.2 34.6 33.9 33.8 30.8 30.3 29.1 28.6 4.6 17.5
- Policyholders 31.5 30.0 29.3 29.2 26.3 25.8 24.6 24.1 5.0 19.8
- Pension Plan Participants 2.0 2.0 2.0 2.0 2.0 2.0 2.0 2.0 - -
- Savings Bond Customers 2.7 2.6 2.6 2.6 2.5 2.5 2.5 2.5 3.8 8.0
Bradesco Financiamentos 3.3 3.4 3.5 3.8 4.0 4.1 4.0 4.2 (2.9) (17.5)
Dec10 Sep10 Mar09Jun10 Mar10 Dec09 Sep09 Jun09
(1) Includes sureties and guarantees, advances of credit card receivables and credit assignments (receivables-backed investment funds and mortgage-backed receivables). If we also included the operations with Credit Risk – Commercial Portfolio (expanded criteria), which includes debentures and promissory notes, the balance of the expanded loan portfolio would be R$293,555 million in December 2010, R$270,691 million in September 2010 and R$238,606 million in December 2009;
(2) In the last 12 months; (3) Excludes mark-to-market effect of available-for-sale securities recorded under Shareholders’ Equity; (4) Adjusted net income in the period; (5) Excluding additional provisions; (6) Number of shares (less treasury shares) multiplied by the closing price of the common and preferred shares on the period’s last trading day; (7) Excludes Sureties and Guarantees, advanced payment of credit card receivables and loan assignments (mortgage-backed receivables and
receivables-backed investment funds); (8) Credits overdue; (9) Calculated in accordance with the new Basel Capital Accord(BIS II); (10) PAB: Branch located on the premises of a company and with Bradesco employees; PAE: ATM located on the premises of a company; PAA:
service point located in a municipality without a Bank branch; (11) Including overlapping ATMs within the Bank’s own and shared network: In December 2010 – 1,999, September 2010 – 1,670, June 2010 -
1,547, March 2010 – 1,490, December 2009 – 1,455, September 2009 – 1,452, June 2009 – 1,431 and March 2009 – 1,379; (12) Shared ATM network: Banco24Horas ATMs + ATM terminals shared among Bradesco, Banco do Brasil and Banco Santander, since
November 2010; (13) Includes pre-paid, Private Label, Pague Fácil and Banco Ibi as of December 2009; (14) It started including Ibi Promotora employees as of December 2009; (15) Fundação Bradesco, Digestive System and Nutritional Disorder Foundation (Fimaden) and Bradesco Sports and Recreation Center (ADC
Bradesco); and (16) Number of accounts.
Press Release
8 Report on Economic and Financial Analysis – December 2010
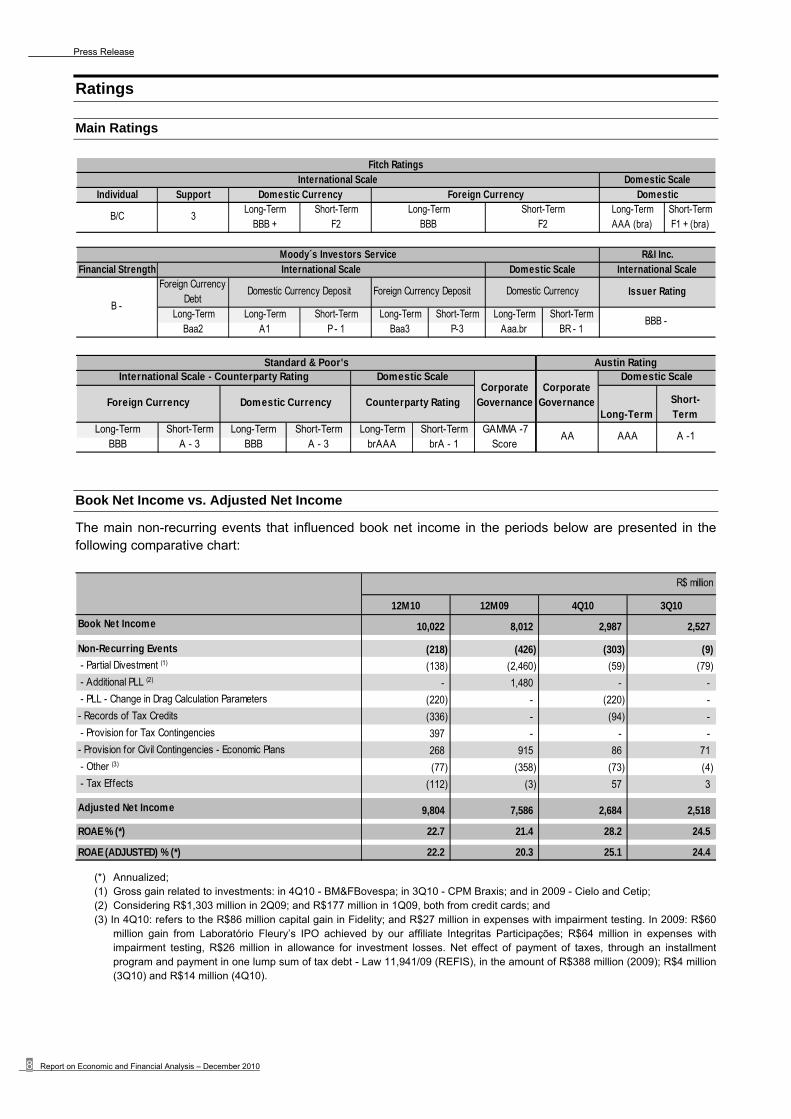
Ratings
Main Ratings
Individual SupportLong-Term Short-Term Long-Term Short-Term
BBB + F2 AAA (bra) F1 + (bra)*
Financial StrengthForeign Currency
DebtForeign Currency Deposit
Long-Term Long-Term Short-Term Long-Term Short-Term Long-Term Short-TermBaa2 A1 P - 1 Baa3 P-3 Aaa.br BR - 1
B/C 3
Moody´s Investors ServiceInternational Scale Domestic Scale
Long-Term Short-TermBBB F2
Domestic Currency
Fitch RatingsInternational Scale Domestic Scale
Foreign Currency Domestic
R&I Inc.International Scale
Issuer Rating
BBB - B -
Domestic Currency Deposit Domestic Currency
*
Long-TermShort-Term
Long-Term Short-Term Long-Term Short-Term Long-Term Short-Term GAMMA -7BBB A - 3 BBB A - 3 brAAA brA - 1 Score
Corporate Governance
Standard & Poor'sDomestic ScaleInternational Scale - Counterparty Rating Domestic Scale
Foreign Currency Domestic Currency Counterparty Rating
AA AAA A -1
Austin Rating
Corporate Governance
Book Net Income vs. Adjusted Net Income
The main non-recurring events that influenced book net income in the periods below are presented in the following comparative chart:
R$ million
12M10 12M09 4Q10 3Q10
Book Net Income 10,022 8,012 2,987 2,527
Non-Recurring Events (218) (426) (303) (9)
- Partial Divestment (1) (138) (2,460) (59) (79)
- Additional PLL (2) - 1,480 - -
- PLL - Change in Drag Calculation Parameters (220) - (220) -
- Records of Tax Credits (336) - (94) -
- Provision for Tax Contingencies 397 - - -
- Provision for Civil Contingencies - Economic Plans 268 915 86 71
- Other (3) (77) (358) (73) (4)
- Tax Effects (112) (3) 57 3
Adjusted Net Income 9,804 7,586 2,684 2,518
ROAE % (*) 22.7 21.4 28.2 24.5
ROAE (ADJUSTED) % (*) 22.2 20.3 25.1 24.4
(*) Annualized; (1) Gross gain related to investments: in 4Q10 - BM&FBovespa; in 3Q10 - CPM Braxis; and in 2009 - Cielo and Cetip; (2) Considering R$1,303 million in 2Q09; and R$177 million in 1Q09, both from credit cards; and (3) In 4Q10: refers to the R$86 million capital gain in Fidelity; and R$27 million in expenses with impairment testing. In 2009: R$60
million gain from Laboratório Fleury’s IPO achieved by our affiliate Integritas Participações; R$64 million in expenses with impairment testing, R$26 million in allowance for investment losses. Net effect of payment of taxes, through an installment program and payment in one lump sum of tax debt - Law 11,941/09 (REFIS), in the amount of R$388 million (2009); R$4 million (3Q10) and R$14 million (4Q10).
Press Release
Bradesco 9
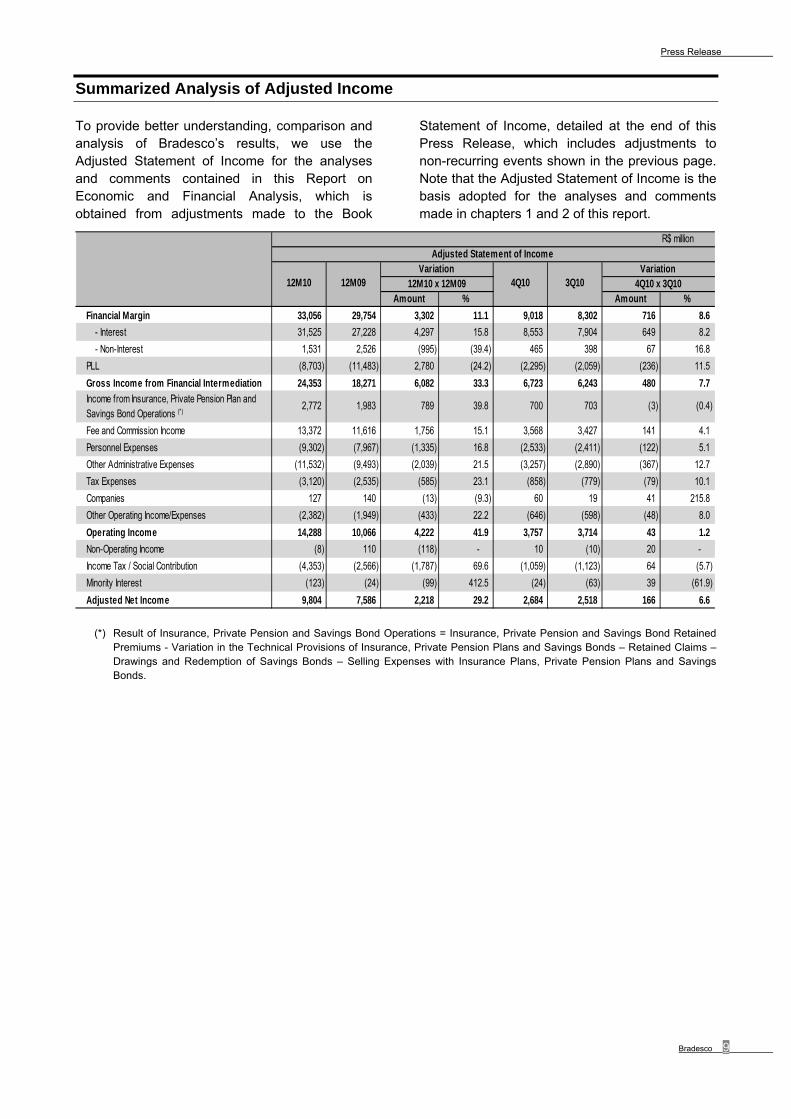
Summarized Analysis of Adjusted Income
To provide better understanding, comparison and analysis of Bradesco’s results, we use the Adjusted Statement of Income for the analyses and comments contained in this Report on Economic and Financial Analysis, which is obtained from adjustments made to the Book
Statement of Income, detailed at the end of this Press Release, which includes adjustments to non-recurring events shown in the previous page. Note that the Adjusted Statement of Income is the basis adopted for the analyses and comments made in chapters 1 and 2 of this report.
R$ million Adjusted Statement of Income
Variation Variation12M10 x 12M09 4Q10 x 3Q10
Amount % Amount %
Financial Margin 33,056 29,754 3,302 11.1 9,018 8,302 716 8.6
- Interest 31,525 27,228 4,297 15.8 8,553 7,904 649 8.2
- Non-Interest 1,531 2,526 (995) (39.4) 465 398 67 16.8
PLL (8,703) (11,483) 2,780 (24.2) (2,295) (2,059) (236) 11.5
Gross Income from Financial Intermediation 24,353 18,271 6,082 33.3 6,723 6,243 480 7.7
Income from Insurance, Private Pension Plan and Savings Bond Operations (*)
2,772 1,983 789 39.8 700 703 (3) (0.4)
Fee and Commission Income 13,372 11,616 1,756 15.1 3,568 3,427 141 4.1
Personnel Expenses (9,302) (7,967) (1,335) 16.8 (2,533) (2,411) (122) 5.1
Other Administrative Expenses (11,532) (9,493) (2,039) 21.5 (3,257) (2,890) (367) 12.7
Tax Expenses (3,120) (2,535) (585) 23.1 (858) (779) (79) 10.1
Companies 127 140 (13) (9.3) 60 19 41 215.8
Other Operating Income/Expenses (2,382) (1,949) (433) 22.2 (646) (598) (48) 8.0
Operating Income 14,288 10,066 4,222 41.9 3,757 3,714 43 1.2
Non-Operating Income (8) 110 (118) - 10 (10) 20 -
Income Tax / Social Contribution (4,353) (2,566) (1,787) 69.6 (1,059) (1,123) 64 (5.7)
Minority Interest (123) (24) (99) 412.5 (24) (63) 39 (61.9)
Adjusted Net Income 9,804 7,586 2,218 29.2 2,684 2,518 166 6.6
12M10 12M09 4Q10 3Q10
(*) Result of Insurance, Private Pension and Savings Bond Operations = Insurance, Private Pension and Savings Bond Retained Premiums - Variation in the Technical Provisions of Insurance, Private Pension Plans and Savings Bonds – Retained Claims – Drawings and Redemption of Savings Bonds – Selling Expenses with Insurance Plans, Private Pension Plans and Savings Bonds.

Press Release
10 Report on Economic and Financial Analysis – December 2010
Summarized Analysis of Adjusted Income
Adjusted Net Income and Profitability
In the fourth quarter of 2010, Bradesco’s adjusted net income stood at R$2,684 million, an increase of 6.6% or R$166 million from the previous quarter, which was primarily impacted by: (i) the growth in financial margin, due to the increased volume of operations; (ii) higher fee and commission income; offset by: (iii) the increase in allowance for loan losses; and (iv) increased personnel and administrative expenses.
Accumulated over 2010, adjusted net income totaled R$9,804 million, an increase of 29.2% from the R$2,218 million in 2009.
The main reasons for this result are described below in the analysis of the main income statement items, with the consolidation of the income accounts of Banco Ibi as of November 2009.
Shareholders’ Equity was R$48,043 million in December 2010, increasing 15.1% from 2009. The Capital Adequacy Ratio stood at 14.7%, of which 13.1% was under Tier I Capital.
Total assets stood at R$637,485 million in December 2010, up 25.9% over 2009, driven by the expansion of business volume. Return on average assets (ROAA) remained stable, hovering near 1.7%.
* Last 12 months
33% 32% 34% 33%33% 29% 29% 29%
1,956 1,996 1,795 1,839
2,147
2,455 2,518
2,684
2.07 2.06 2.04 2.02 2.072.19
2.382.61
1Q09 2Q 3Q 4Q 1Q10 2Q 3Q 4Q
R$ million
Insurance Share Adjusted Net Income Earnings per Share (R$)*
35,306 37,277 38,877 41,754 43,087 44,295 46,114 48,043
24.1%23.3%
21.5%20.3%
22.2% 22.8% 22.5% 22.2%
Mar09 Jun Sep Dec Mar10 Jun Sep Dec
R$ million
Shareholders' Equity ROAE (Adjusted Net Income)
482,141 482,478 485,686 506,223 532,626
558,100 611,903
637,485
1.7% 1.7% 1.6% 1.6% 1.7% 1.7% 1.7% 1.7%
Mar09 Jun Sep Dec Mar10 Jun Sep Dec
R$ million
Total Assets ROAA (Adjusted Net Income)

Press Release
Bradesco 11
Summarized Analysis of Adjusted Income
Efficiency Ratio (ER)
The ER calculated on an “adjusted-to-risk” basis to reflect the impact of risk in loan operations(2) dropped for the fourth consecutive quarter, reaching 52.4% in the fourth quarter of 2010, up 0.9 p.p. compared to the previous quarter and 3.5 p.p. in the year. This behavior is in line with the results of previous quarters, mainly due to decreased delinquency.
As for the ER – accumulated over 12 months(1), increases seen in the last few quarters are mainly due to exceptional treasury gains and a decline in advertising and publicity expenses in 2009 which led to an increase in the periods’ indicators, in addition to higher expenses in 2010 resulting from the expansion of service points (from 44,577 in December 2009 to 54,884 in December 2010).
The quarterly ER increased from 43.0% in the third quarter of 2010 to 44.0% in the fourth quarter of 2010, mainly due to: (i) increased personnel expenses due to higher salary levels and growth in total staff resulting from investments in the expansion of Service Points and improvements in business segmentation; and (ii) higher administrative expenses, mainly due to the seasonal effect of this quarter and organic growth in the period.
(1) Efficiency Ratio (ER) = (Personnel Expenses – Employee Profit Sharing (PLR) + Administrative Expenses) / (Financial Margin + Fee and Commission Income + Income from Insurance + Equity in the Earnings
(Losses) of Unconsolidated Companies + Other Operating Income – Other Operating Expenses). Considering the ratio between: (i) total administrative costs (Personnel Expenses + Administrative Expenses + Other
Operating Expenses + Tax Expenses not related to revenue generation) and (ii) revenue net of related taxes (not considering Claims Expenses from the Insurance Group), our Efficiency Ratio in the fourth quarter of
2010 was 43.3%; and
(2) Including PLL expenses, adjusted for granted discounts, loan recovery and sale of foreclosed assets, among others.
39.0% 38.0%41.1%
43.7%41.9% 41.5% 43.0% 44.0%
42.5% 41.5% 40.9% 40.5% 41.2% 42.0% 42.5% 42.7%
54.6% 55.1% 55.8% 55.9% 55.4% 54.6%53.3% 52.4%
1Q09 2Q 3Q 4Q 1Q10 2Q 3Q 4Q
Efficiency Ratio - Quarterly
Efficiency Ratio (ER) - Accumualted 12 months (1)
Efficiency Ratio Adjusted to Risk - Accumulated 12 months (2)
Press Release
12 Report on Economic and Financial Analysis – December 2010
Summarized Analysis of Adjusted Income
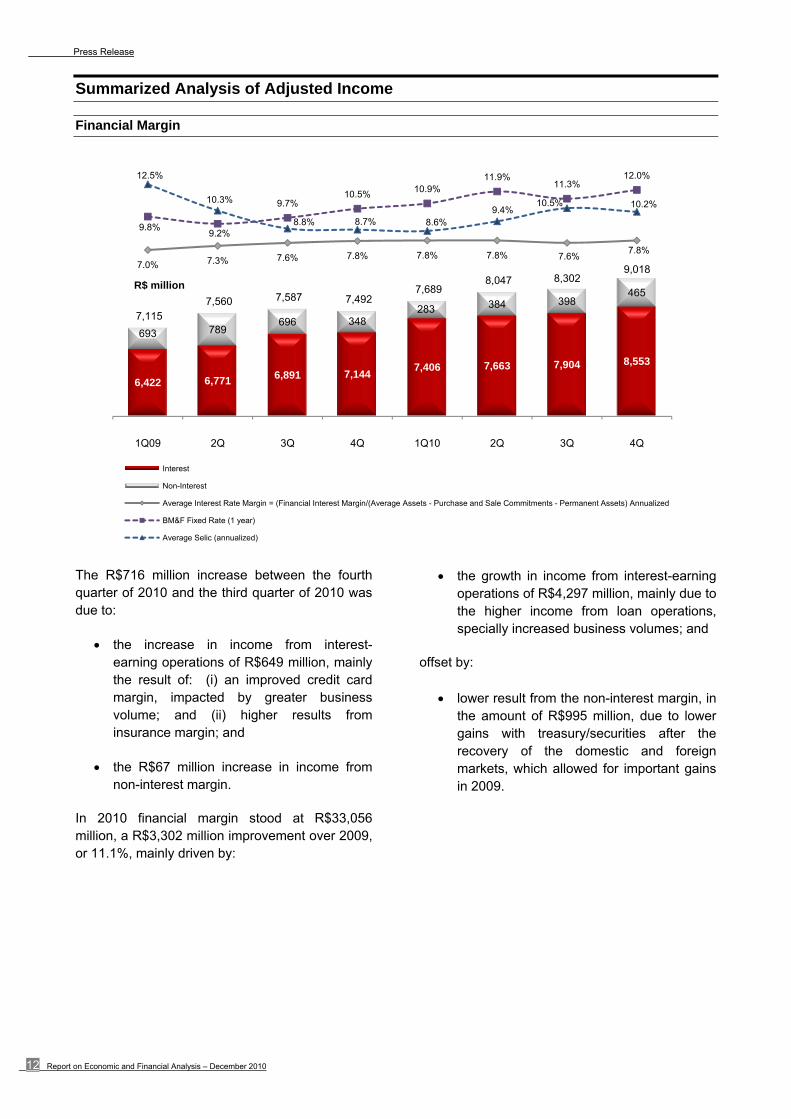
Financial Margin
The R$716 million increase between the fourth quarter of 2010 and the third quarter of 2010 was due to:
the increase in income from interest-earning operations of R$649 million, mainly the result of: (i) an improved credit card margin, impacted by greater business volume; and (ii) higher results from insurance margin; and
the R$67 million increase in income from non-interest margin.
In 2010 financial margin stood at R$33,056 million, a R$3,302 million improvement over 2009, or 11.1%, mainly driven by:
the growth in income from interest-earning operations of R$4,297 million, mainly due to the higher income from loan operations, specially increased business volumes; and
offset by:
lower result from the non-interest margin, in the amount of R$995 million, due to lower gains with treasury/securities after the recovery of the domestic and foreign markets, which allowed for important gains in 2009.
6,422 6,771 6,891 7,144 7,406 7,663 7,904 8,553
693 789 696 348
283 384 398 465
7,115 7,560 7,587 7,492
7,689 8,047 8,302
9,018 7.0% 7.3% 7.6% 7.8% 7.8% 7.8% 7.6%7.8%
9.8%9.2%
9.7%10.5%
10.9%11.9%
11.3%12.0%12.5%
10.3%
8.8% 8.7% 8.6%9.4%
10.5% 10.2%
1Q09 2Q 3Q 4Q 1Q10 2Q 3Q 4Q
R$ million
Interest
Non-Interest
Average Interest Rate Margin = (Financial Interest Margin/(Average Assets - Purchase and Sale Commitments - Permanent Assets) Annualized
BM&F Fixed Rate (1 year)
Average Selic (annualized)
Press Release
Bradesco 13
Summarized Analysis of Adjusted Income
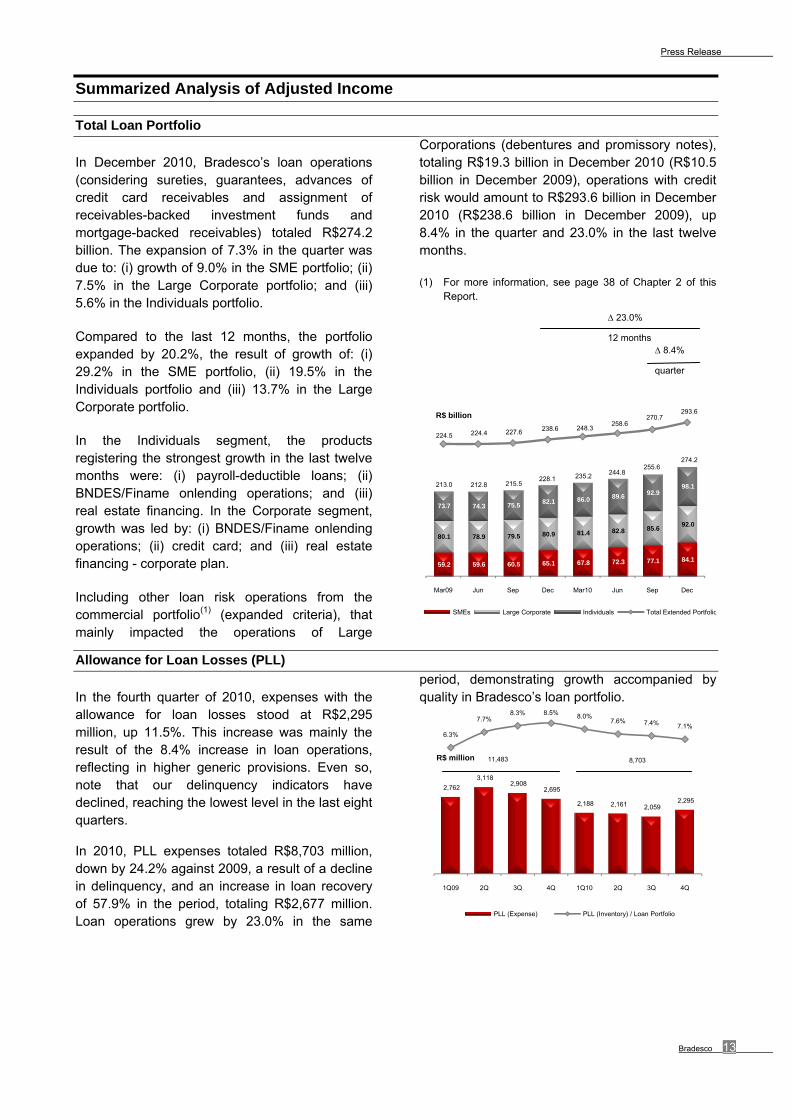
Total Loan Portfolio
In December 2010, Bradesco’s loan operations (considering sureties, guarantees, advances of credit card receivables and assignment of receivables-backed investment funds and mortgage-backed receivables) totaled R$274.2 billion. The expansion of 7.3% in the quarter was due to: (i) growth of 9.0% in the SME portfolio; (ii) 7.5% in the Large Corporate portfolio; and (iii) 5.6% in the Individuals portfolio.
Compared to the last 12 months, the portfolio expanded by 20.2%, the result of growth of: (i) 29.2% in the SME portfolio, (ii) 19.5% in the Individuals portfolio and (iii) 13.7% in the Large Corporate portfolio.
In the Individuals segment, the products registering the strongest growth in the last twelve months were: (i) payroll-deductible loans; (ii) BNDES/Finame onlending operations; and (iii) real estate financing. In the Corporate segment, growth was led by: (i) BNDES/Finame onlending operations; (ii) credit card; and (iii) real estate financing - corporate plan.
Including other loan risk operations from the commercial portfolio(1) (expanded criteria), that mainly impacted the operations of Large
Corporations (debentures and promissory notes), totaling R$19.3 billion in December 2010 (R$10.5 billion in December 2009), operations with credit risk would amount to R$293.6 billion in December 2010 (R$238.6 billion in December 2009), up 8.4% in the quarter and 23.0% in the last twelve months.
(1) For more information, see page 38 of Chapter 2 of this Report.
∆ 23.0%
12 months ∆ 8.4%
quarter
Allowance for Loan Losses (PLL)
In the fourth quarter of 2010, expenses with the allowance for loan losses stood at R$2,295 million, up 11.5%. This increase was mainly the result of the 8.4% increase in loan operations, reflecting in higher generic provisions. Even so, note that our delinquency indicators have declined, reaching the lowest level in the last eight quarters.
In 2010, PLL expenses totaled R$8,703 million, down by 24.2% against 2009, a result of a decline in delinquency, and an increase in loan recovery of 57.9% in the period, totaling R$2,677 million. Loan operations grew by 23.0% in the same
period, demonstrating growth accompanied by quality in Bradesco’s loan portfolio.
59.2 59.6 60.5 65.1 67.8 72.3 77.1 84.1
80.1 78.9 79.5 80.9 81.4 82.8 85.6 92.0
73.7 74.3 75.5 82.1 86.0 89.6 92.9 98.1 213.0 212.8 215.5
228.1 235.2 244.8 255.6
274.2
224.5 224.4 227.6 238.6 248.3 258.6
270.7 293.6
Mar09 Jun Sep Dec Mar10 Jun Sep Dec
R$ billion
SMEs Large Corporate Individuals Total Extended Portfolio
2,762
3,118 2,908
2,695
2,188 2,161 2,059 2,295
6.3%
7.7%8.3% 8.5% 8.0%
7.6% 7.4% 7.1%
1Q09 2Q 3Q 4Q 1Q10 2Q 3Q 4Q
R$ million
PLL (Expense) PLL (Inventory) / Loan Portfolio
8,703 11,483
Press Release
14 Report on Economic and Financial Analysis – December 2010
Summarized Analysis of Adjusted Income
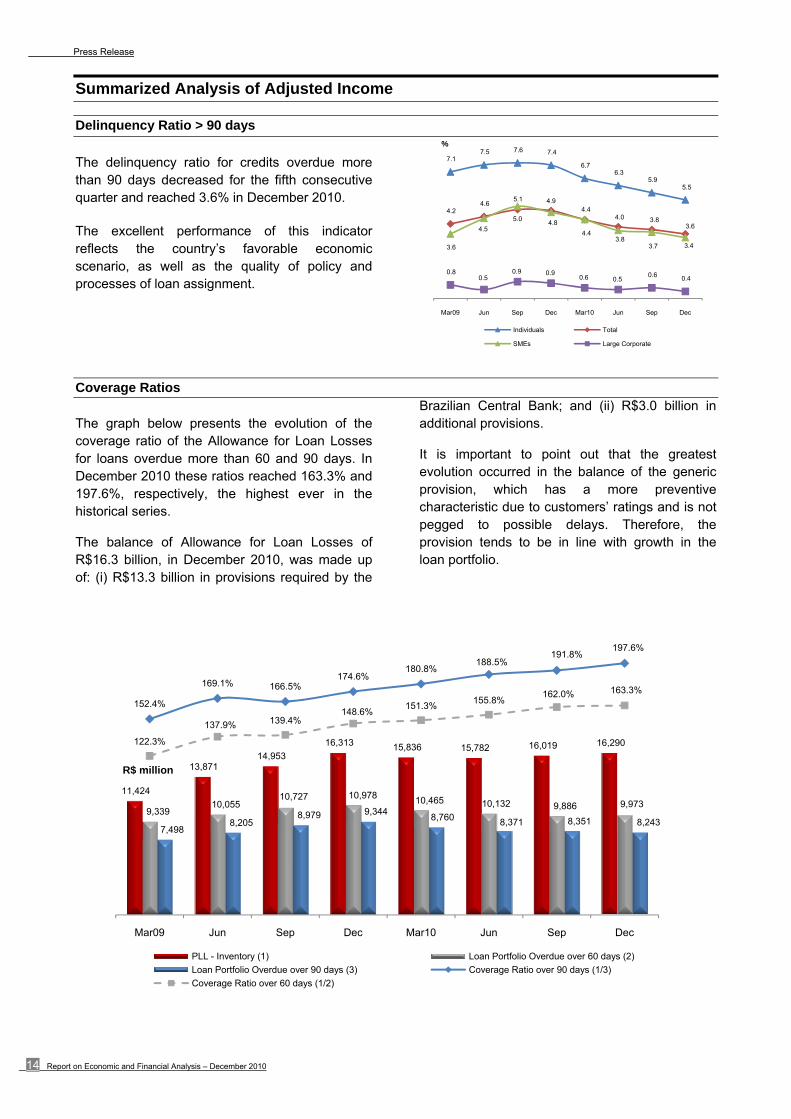
Delinquency Ratio > 90 days
The delinquency ratio for credits overdue more than 90 days decreased for the fifth consecutive quarter and reached 3.6% in December 2010.
The excellent performance of this indicator reflects the country’s favorable economic scenario, as well as the quality of policy and processes of loan assignment.
Coverage Ratios The graph below presents the evolution of the coverage ratio of the Allowance for Loan Losses for loans overdue more than 60 and 90 days. In December 2010 these ratios reached 163.3% and 197.6%, respectively, the highest ever in the historical series.
The balance of Allowance for Loan Losses of R$16.3 billion, in December 2010, was made up of: (i) R$13.3 billion in provisions required by the
Brazilian Central Bank; and (ii) R$3.0 billion in additional provisions.
It is important to point out that the greatest evolution occurred in the balance of the generic provision, which has a more preventive characteristic due to customers’ ratings and is not pegged to possible delays. Therefore, the provision tends to be in line with growth in the loan portfolio.
7.1 7.5 7.6 7.4
6.7 6.3
5.9 5.5
4.2 4.6
5.0
4.9 4.4
4.0 3.8 3.6
3.6
4.5
5.1
4.8
4.4 3.8
3.7 3.4
0.8 0.5
0.9 0.9 0.6 0.5
0.6 0.4
Mar09 Jun Sep Dec Mar10 Jun Sep Dec
%
Individuals Total
SMEs Large Corporate
11,424
13,871 14,953
16,313 15,836 15,782 16,019 16,290
9,339 10,055
10,727 10,978 10,465 10,132 9,886 9,973
7,498 8,205
8,979 9,344 8,760 8,371 8,351 8,243
152.4%
169.1% 166.5%174.6%
180.8%188.5%
191.8%197.6%
122.3%
137.9% 139.4%148.6%
151.3%155.8%
162.0% 163.3%
Mar09 Jun Sep Dec Mar10 Jun Sep Dec
R$ million
PLL - Inventory (1) Loan Portfolio Overdue over 60 days (2)
Loan Portfolio Overdue over 90 days (3) Coverage Ratio over 90 days (1/3)
Coverage Ratio over 60 days (1/2)
Press Release
Bradesco 15
Summarized Analysis of Adjusted Income
Results of Insurance, Private Pension and Savings Bonds Operations
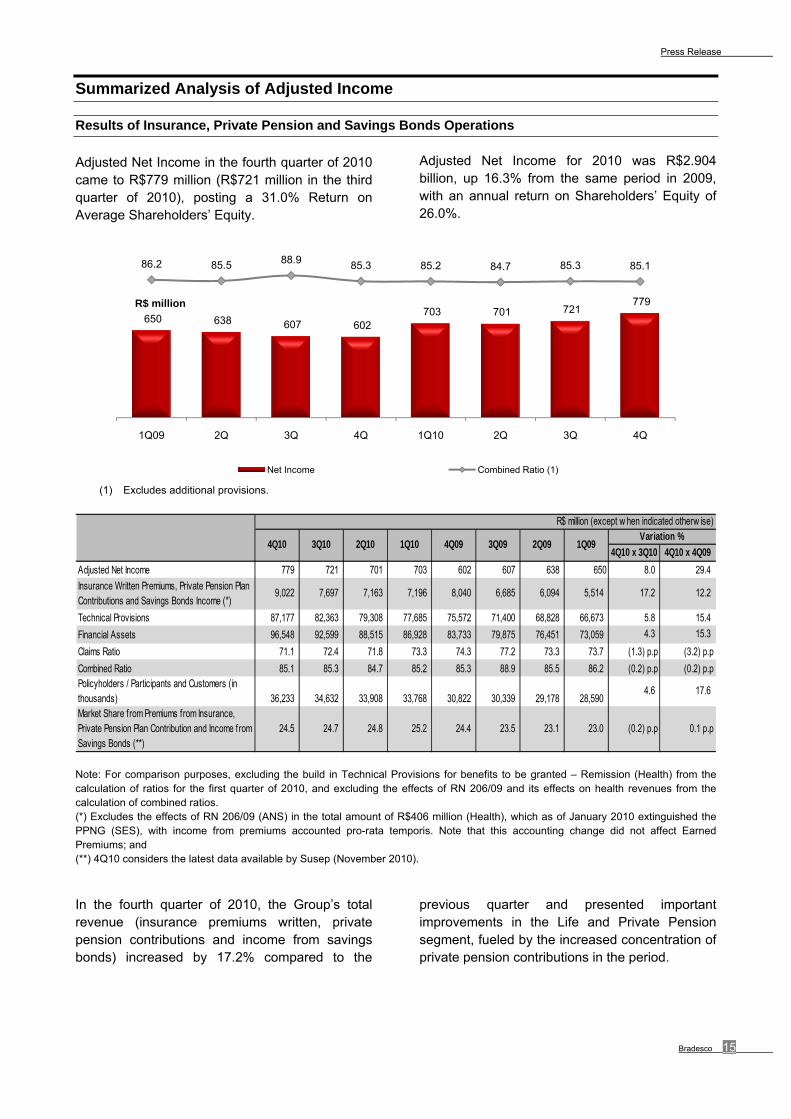
Adjusted Net Income in the fourth quarter of 2010 came to R$779 million (R$721 million in the third quarter of 2010), posting a 31.0% Return on Average Shareholders’ Equity.
Adjusted Net Income for 2010 was R$2.904 billion, up 16.3% from the same period in 2009, with an annual return on Shareholders’ Equity of 26.0%.
(1) Excludes additional provisions.
4Q10 x 3Q10 4Q10 x 4Q09
Adjusted Net Income 779 721 701 703 602 607 638 650 8.0 29.4
Insurance Written Premiums, Private Pension Plan Contributions and Savings Bonds Income (*)
9,022 7,697 7,163 7,196 8,040 6,685 6,094 5,514 17.2 12.2
Technical Provisions 87,177 82,363 79,308 77,685 75,572 71,400 68,828 66,673 5.8 15.4
Financial Assets 96,548 92,599 88,515 86,928 83,733 79,875 76,451 73,059 4.3 15.3
Claims Ratio 71.1 72.4 71.8 73.3 74.3 77.2 73.3 73.7 (1.3) p.p (3.2) p.p
Combined Ratio 85.1 85.3 84.7 85.2 85.3 88.9 85.5 86.2 (0.2) p.p (0.2) p.pPolicyholders / Participants and Customers (in thousands) 36,233 34,632 33,908 33,768 30,822 30,339 29,178 28,590
4.6 17.6
Market Share from Premiums from Insurance, Private Pension Plan Contribution and Income from Savings Bonds (**)
24.5 24.7 24.8 25.2 24.4 23.5 23.1 23.0 (0.2) p.p 0.1 p.p
2Q10Variation %
3Q10
R$ million (except w hen indicated otherw ise)
4Q10 1Q092Q093Q094Q091Q10
Note: For comparison purposes, excluding the build in Technical Provisions for benefits to be granted – Remission (Health) from the calculation of ratios for the first quarter of 2010, and excluding the effects of RN 206/09 and its effects on health revenues from the calculation of combined ratios. (*) Excludes the effects of RN 206/09 (ANS) in the total amount of R$406 million (Health), which as of January 2010 extinguished the PPNG (SES), with income from premiums accounted pro-rata temporis. Note that this accounting change did not affect Earned Premiums; and (**) 4Q10 considers the latest data available by Susep (November 2010).
In the fourth quarter of 2010, the Group’s total revenue (insurance premiums written, private pension contributions and income from savings bonds) increased by 17.2% compared to the
previous quarter and presented important improvements in the Life and Private Pension segment, fueled by the increased concentration of private pension contributions in the period.
650 638 607 602 703 701 721
779
86.2 85.5 88.9 85.3 85.2 84.7 85.3 85.1
1Q09 2Q 3Q 4Q 1Q10 2Q 3Q 4Q
R$ million
Net Income Combined Ratio (1)
Press Release
16 Report on Economic and Financial Analysis – December 2010
Summarized Analysis of Adjusted Income
Accumulated up to December 2010, production grew by 18.0% from the same period in 2009. This increase was fueled by the high performance of Savings Bonds, Auto, Health and Life products, which increased by 24.8%, 20.0%, 22.6% and 17.7%, respectively.
The 8.0% increase in net income in the fourth quarter of 2010, compared to the previous quarter, was mainly as a result of: (i) a 17.2% increase in revenue; (ii) an improvement in claims of 1.3 p.p.; (iii) improvement in the administrative efficiency index of 0.5 p.p.; and (iv) greater financial result and equity income.
Comparing the adjusted net income for 2010 with the same period in 2009, the Insurance Group grew by 16.3%, mainly due to: (i) the 18.0% increase in revenues; (ii) greater financial result; and (iii) a drop in claims of 2.6 p.p.
The Insurance Group’s technical provisions represented 30.6% of the insurance industry in November 2010, according to Susep and the National Supplementary Health Agency (ANS).
In terms of solvency, Grupo Bradesco de Seguros e Previdência complies with the Susep rules that took effect on January 1, 2008, and international standards (Solvency II). The financial leverage ratio stood at 2.6 times Shareholders’ Equity.
Press Release
Bradesco 17
Summarized Analysis of Adjusted Income
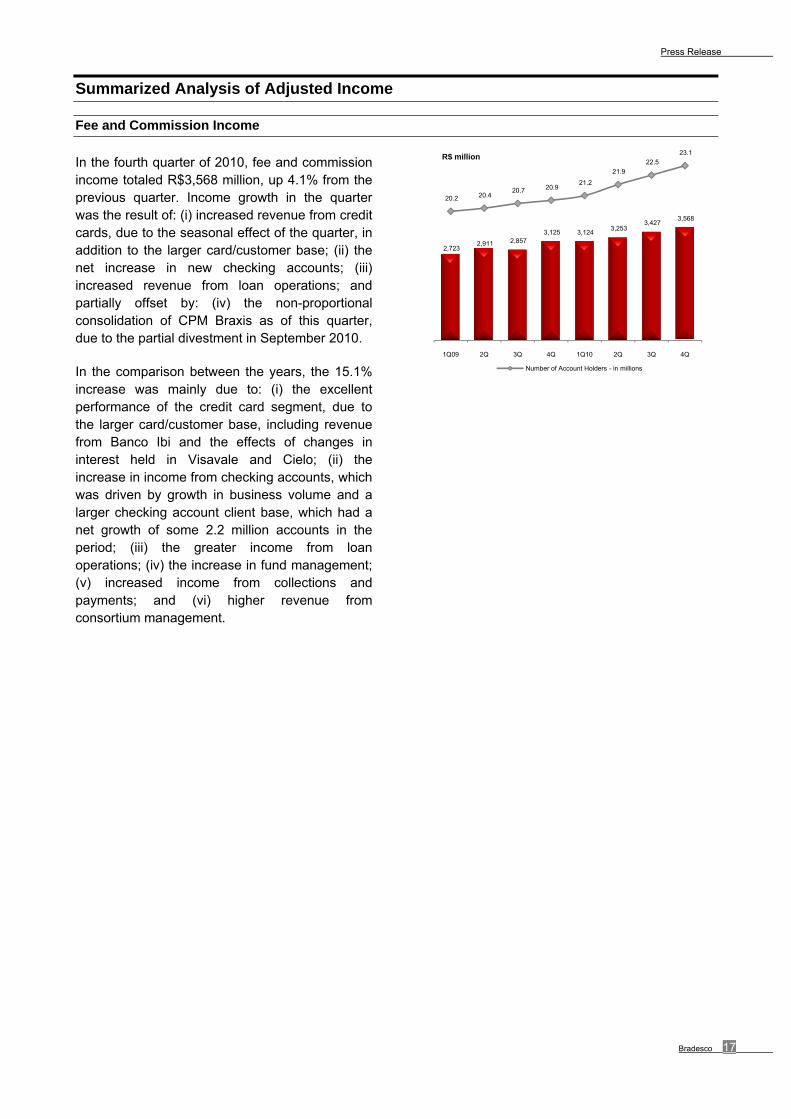
Fee and Commission Income
In the fourth quarter of 2010, fee and commission income totaled R$3,568 million, up 4.1% from the previous quarter. Income growth in the quarter was the result of: (i) increased revenue from credit cards, due to the seasonal effect of the quarter, in addition to the larger card/customer base; (ii) the net increase in new checking accounts; (iii) increased revenue from loan operations; and partially offset by: (iv) the non-proportional consolidation of CPM Braxis as of this quarter, due to the partial divestment in September 2010.
In the comparison between the years, the 15.1% increase was mainly due to: (i) the excellent performance of the credit card segment, due to the larger card/customer base, including revenue from Banco Ibi and the effects of changes in interest held in Visavale and Cielo; (ii) the increase in income from checking accounts, which was driven by growth in business volume and a larger checking account client base, which had a net growth of some 2.2 million accounts in the period; (iii) the greater income from loan operations; (iv) the increase in fund management; (v) increased income from collections and payments; and (vi) higher revenue from consortium management.
2,723 2,911 2,857
3,125 3,124 3,253
3,427 3,568
20.2 20.4 20.7 20.9
21.2
21.9
22.5
23.1
1Q09 2Q 3Q 4Q 1Q10 2Q 3Q 4Q
R$ million
Number of Account Holders - in millions
Press Release
18 Report on Economic and Financial Analysis – December 2010
Summarized Analysis of Adjusted Income
Administrative Expenses
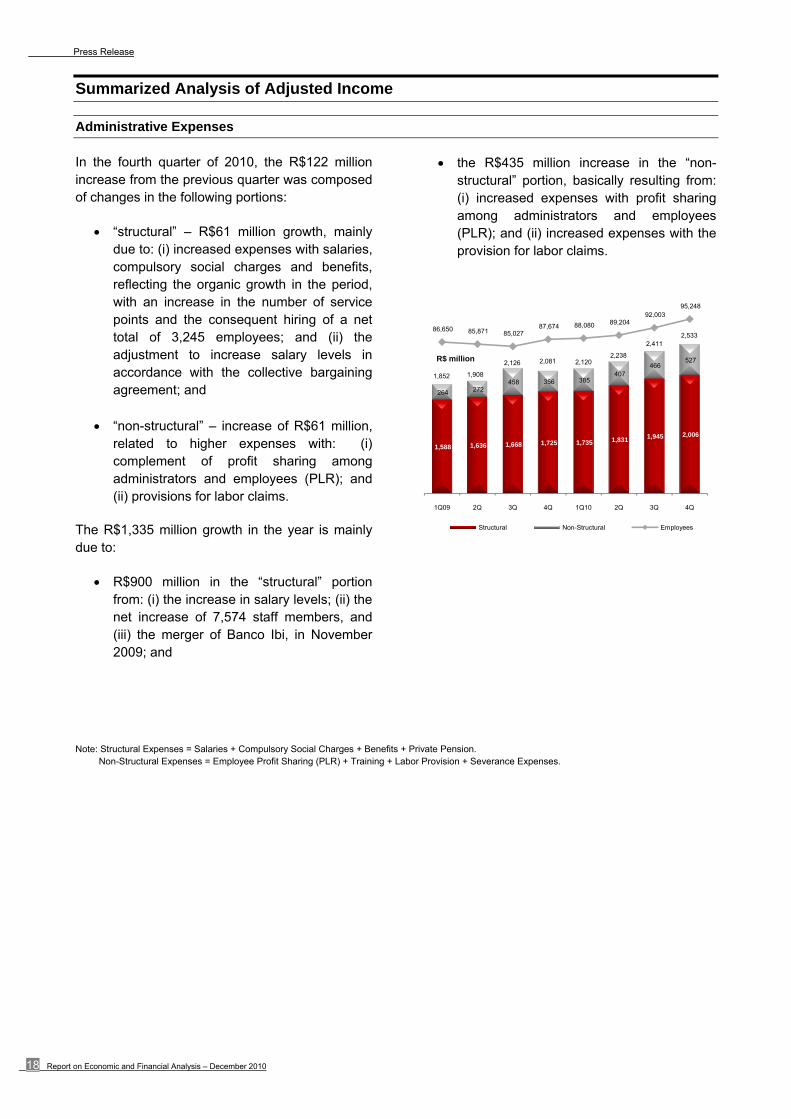
In the fourth quarter of 2010, the R$122 million increase from the previous quarter was composed of changes in the following portions:
“structural” – R$61 million growth, mainly due to: (i) increased expenses with salaries, compulsory social charges and benefits, reflecting the organic growth in the period, with an increase in the number of service points and the consequent hiring of a net total of 3,245 employees; and (ii) the adjustment to increase salary levels in accordance with the collective bargaining agreement; and
“non-structural” – increase of R$61 million,
related to higher expenses with: (i) complement of profit sharing among administrators and employees (PLR); and (ii) provisions for labor claims.
The R$1,335 million growth in the year is mainly due to:
R$900 million in the “structural” portion from: (i) the increase in salary levels; (ii) the net increase of 7,574 staff members, and (iii) the merger of Banco Ibi, in November 2009; and
the R$435 million increase in the “non-structural” portion, basically resulting from: (i) increased expenses with profit sharing among administrators and employees (PLR); and (ii) increased expenses with the provision for labor claims.
Note: Structural Expenses = Salaries + Compulsory Social Charges + Benefits + Private Pension. Non-Structural Expenses = Employee Profit Sharing (PLR) + Training + Labor Provision + Severance Expenses.
1,588 1,636 1,668 1,725 1,735 1,831 1,945 2,006
264 272 458 356 385
407 466
527
1,852 1,908
2,126 2,081 2,120 2,238
2,411 2,533
86,650 85,871 85,027 87,674 88,080 89,204
92,003 95,248
1Q09 2Q 3Q 4Q 1Q10 2Q 3Q 4Q
R$ million
Structural Non-Structural Employees

Press Release
Bradesco 19
Summarized Analysis of Adjusted Income
Administrative Expenses
In the fourth quarter of 2010, the 12.7% increase in administrative expenses in relation to the third quarter of 2010 was mainly due to: (i) outsourced services, related to: (a) partial outsourcing of credit card processing (Fidelity); (b) upgrading and expansion of customer service structure (i.e. Call Center); and c) variable expenses related to revenue (i.e. Bradesco Expresso and Banco Postal); (ii) advertising and publicity; (iii) data processing; and (iv) communication. The seasonality of the quarter also had an important impact in administrative expenses, due to the higher business and service volume, in addition to the organic growth of service points by 2,869 new units: 130 branches, 45 PAB/PAE/PAA stations, 1,217 Bradesco Expresso branches and 1,477 other service points.
In the annual comparison, the 21.5% increase is essentially due to: (i) the impact of Banco Ibi merger, in November 2009 (if the merger were excluded, administrative expenses would have increased by 15.6%); (ii) greater expenses with advertising and marketing in 2010, given that these expenses presented a significant drop in
2009; (iii) growth in business and service volume; (iv) the increase in variable expenses tied to revenue (i.e. Bradesco Expresso and Banco Postal); (v) increased expenses with legal advisory services, related to the 60% growth in recoveries in 2010; and (vi) the expansion of the Customer Service Network by 10,307 new units: 174 branches, 368 PAB/PAE/PAA, 5,904 Bradesco Expresso branches and 3,861 other service points, amounting to 54,884 on December 31, 2010.
Other Income and Operating Expenses
Other operating expenses, net of other operating income, totaled R$646 million in the fourth quarter of 2010, up 8.0% or R$48 million over previous quarter.
In the annual comparison, the R$433 million increase in other operating expenses net of other operating income basically reflects higher expenses with: (i) the recording of operating provisions, especially for civil contingencies; (ii) goodwill amortization; and (iii) the operating expenses resulting from Banco Ibi merger in November 2009.
2,155 2,233 2,359
2,746 2,647 2,738
2,890
3,257 39,275 41,003
42,563 44,577
46,570 49,154
52,015 54,884
1Q09 2Q 3Q 4Q 1Q10 2Q 3Q 4Q
R$ million
Service Points - units
(412)
(459)
(539) (539) (550)
(588) (598)
(646)
1Q09 2Q 3Q 4Q 1Q10 2Q 3Q 4Q
R$ million

Press Release
20 Report on Economic and Financial Analysis – December 2010
Summarized Analysis of Adjusted Income
Income Tax and Social Contribution
In the fourth quarter of 2010, expenses with income tax and social contribution remained practically steady in comparison with the previous quarter.
In the annual comparison, the increase of 69.6%, or R$1,787 million, was due to greater taxable income in the year.
Tax credits from previous periods due to the increase of Social Contribution rates to 15% are recorded in the financial statements, up to the limit of corresponding consolidated tax requirements. The unused balance currently stands at R$227 million. More details are available in note 34 of the Financial Statements.
Unrealized Gains
Unrealized gains totaled R$10,556 million in the fourth quarter of 2010, a R$612 million decrease from the previous quarter. This was mainly due to: (i) the decrease in unrealized gains of loan and leasing, resulting from an increase in interest rates; and (ii) the drop seen in the stock market (Ibovespa), which affected some of our equity investments, especially those in Cielo stock; (iii) the increase in unrealized losses in subordinated debts, due to the drop in foreign market’s interest rates; and partially offset by: (iv) appreciation of the mark to market of securities, particularly fixed-Income bonds pegged to the IPCA.
723 717
607
519
1,010 1,161 1,123 1,059
1Q09 2Q 3Q 4Q 1Q10 2Q 3Q 4Q
R$ million
1,293
8,654
10,162 10,123 10,911
9,226
11,168 10,556
Mar09 Jun Sep Dec Mar10 Jun Sep Dec
R$ million
Press Release
Bradesco 21
Economic Scenario The recovery of the major developed economies continues to be marked by a number of risk factors, particularly a depressed labor market, the financial deleverage of households and high levels of government indebtedness. Nonetheless, the developing countries are continuing to record strong growth and are gaining recognition in global decision-making forums. China in particular continues to exercise its role as the driver of global growth, even though inflationary pressure and excesses in the real estate market have forced local authorities to adopt measures to contain excessive growth, indicating a moderate slowdown in 2011. China continues to stand out because of its demand for commodities, in addition to becoming Brazil’s main trading partner in 2010. Commodity prices, especially in the agricultural area, were up at the close of the year due to heated Chinese demand, as well as adverse weather situations.
On the domestic front, if expected GDP growth of 7.8% is confirmed, 2010 will record the highest growth for the last 25 years. The expected deceleration to 4.3% in 2011 should not be seen in a negative light, as it is important that Brazil’s economy better reflects its growth potential. Despite the country’s undoubted export strength, its main performance driver has been - and continues to be - domestic demand. The sustainable recovery of investments resulted from improved business confidence, the opportunities related to the sporting events in 2014 and 2016 and the exploration of the pre-salt layer. Household consumption continues to grow at a robust pace, supported by the buoyant job market, income gains and the generation of formal jobs.
The country’s strong economic expansion was characterized by differences in performance between the different quarters, highlighting several bottlenecks. The increasing gap between supply and demand led the Brazilian Central Bank
to normalize monetary policy, the easing of which during the global crisis brought the Selic to its lowest ever level. Despite the expected slowdown in 2011, latent inflation pressure will remain a cause for concern, not only because of the recent commodity price hikes, but also because of the healthy job market and its impact on prices in the service sector. Thus, we should expect another cycle of monetary tightening, though to a lesser degree than we have seen in the recent past, due to greater expected coordination with fiscal policy.
Credit, employment and income will continue to grow robustly in 2011, albeit at a more moderate pace than in the previous year. With no signs of excessive commitment of income on the part of borrowers and with continuing social mobility, the outlook for the Brazilian banking system remains favorable. The recently adopted cautionary measures to avoid the excessive expansion of credit should be effective in achieving their proposed objectives, although they will not prevent bank loan balances from recording double-digit growth, probably around 15% for the year.
On the political front, the recent presidential elections went off without any major problems that could have affected economic agents’ investment and consumption decisions, proving that the economic achievements of the last few years will be preserved, along with relevant gains on the social front, despite government cycles. Bradesco continues to believe that the prospects for the Brazilian economy in the coming years are favorable, and growth may even take root more rapidly than expected through increased investments in education and infrastructure.

Press Release
22 Report on Economic and Financial Analysis – December 2010
Main Economic Indicators
Interbank Deposit Certif icate (CDI) 2.56 2.61 2.22 2.02 2.12 2.18 2.37 2.89 9.75 9.88
Ibovespa (0.18) 13.94 (13.41) 2.60 11.49 19.53 25.75 8.99 1.04 82.66
USD – Commercial Rate (1.65) (5.96) 1.15 2.29 (2.08) (8.89) (15.70) (0.93) (4.31) (25.49)
General Price Index - Market (IGP-M) 3.18 2.09 2.84 2.77 (0.11) (0.37) (0.32) (0.92) 11.32 (1.72)
CPI (IPCA – IBGE) 2.23 0.50 1.00 2.06 1.06 0.63 1.32 1.23 5.91 4.31
Federal Government Long-Term Interest Rate (TJLP) 1.48 1.48 1.48 1.48 1.48 1.48 1.54 1.54 6.04 6.17
Reference Interest Rate (TR) 0.22 0.28 0.11 0.08 0.05 0.12 0.16 0.37 0.69 0.71
Savings Accounts 1.73 1.79 1.62 1.59 1.56 1.63 1.67 1.89 6.90 6.92
Business Days (number) 63 65 62 61 63 65 61 61 251 250
Indicators (Closing Rate) Dec10 Sep10 Jun10 Mar10 Dec09 Sep09 Jun09 Mar09 12M10 12M09
USD – Commercial Selling Rate – (R$) 1.6662 1.6942 1.8015 1.7810 1.7412 1.7781 1.9516 2.3152 1.6662 1.7412
Euro – (R$) 2.2280 2.3104 2.2043 2.4076 2.5073 2.6011 2.7399 3.0783 2.2280 2.5073
Country Risk (points) 189 206 248 185 192 234 284 425 189 192
Basic Selic Rate Copom (% p.a.) 10.75 10.75 10.25 8.75 8.75 8.75 9.25 11.25 10.75 8.75BM&F Fixed Rate (% p.a.) 12.03 11.28 11.86 10.85 10.46 9.65 9.23 9.79 12.03 10.46
12M10 12M09Main Indicators (%) 3Q09 2Q09 1Q094Q10 2Q103Q10 4Q091Q10
Projections through 2013
% 2011 2012 2013
USD - Commercial Rate (year-end) - R$ 1.70 1.74 1.78
Extended Consumer Price Index (IPCA) 5.20 4.50 4.50
General Price Index - Market (IGP-M) 6.50 4.50 4.50
Selic (year-end) 12.25 11.25 10.25
Gross Domestic Product (GDP) 4.30 4.40 4.80
Press Release
Bradesco 23
Guidance
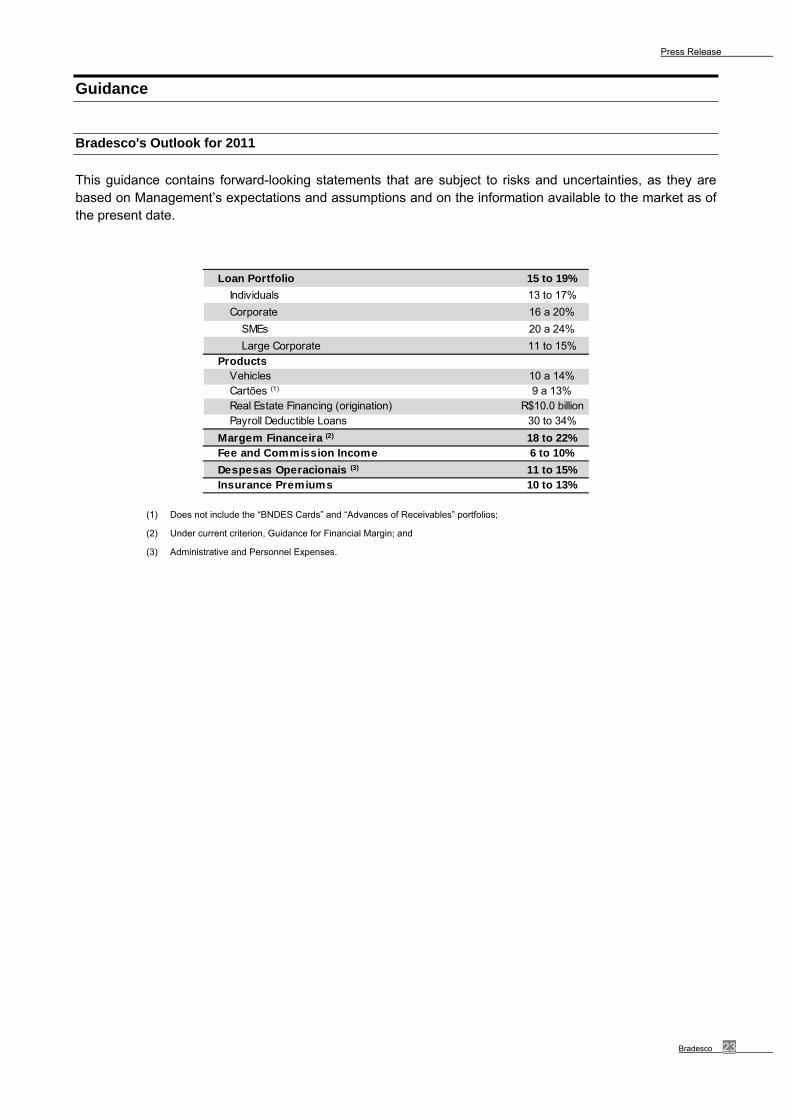
Bradesco's Outlook for 2011
This guidance contains forward-looking statements that are subject to risks and uncertainties, as they are based on Management’s expectations and assumptions and on the information available to the market as of the present date.
Loan Portfolio 15 to 19%
Individuals 13 to 17%
Corporate 16 a 20%
SMEs 20 a 24%
Large Corporate 11 to 15%
ProductsVehicles 10 a 14%Cartões (1) 9 a 13%Real Estate Financing (origination) R$10.0 billionPayroll Deductible Loans 30 to 34%
Margem Financeira (2) 18 to 22%Fee and Commission Income 6 to 10%
Despesas Operacionais (3) 11 to 15%Insurance Premiums 10 to 13%
(1) Does not include the “BNDES Cards” and “Advances of Receivables” portfolios;
(2) Under current criterion, Guidance for Financial Margin; and
(3) Administrative and Personnel Expenses.

Press Release
24 Report on Economic and Financial Analysis – December 2010
Statement of Income – Book vs. Managerial vs. Adjusted
Analytical Breakdown of Statement of Book vs. Managerial vs. Adjusted Income
Fourth quarter of 2010
R$ million
(1) (2) (3) (4) (5) (6) (7)
Financial Margin 9,904 (114) 32 (110) (492) - - - (202) 9,018 - 9,018
PLL (2,299) - - - 309 (85) - - - (2,075) (220) (2,295)
Gross Income from Financial Intermediation 7,605 (114) 32 (110) (183) (85) - - (202) 6,943 (220) 6,723
Income from Insurance, Private Pension Plan and Savings Bond Operations (*) 700 - - - - - - - - 700 - 700
Fee and Commission Income 3,471 - - - - - 97 - - 3,568 - 3,568
Personnel Expenses (2,533) - - - - - - - - (2,533) - (2,533)
Other Administrative Expenses (3,159) - - - - - - (98) - (3,257) - (3,257)
Tax Expenses (880) - - - - - - - 22 (858) (858)
Equity in the Earnings (Losses) of Unconsolidated Companies 60 - - - - - - - - 60 - 60
Other Operating Income/Expenses (1,120) 114 (32) 110 183 - (97) 98 - (744) 98 (646)
Operating Income 4,144 - - - - (85) - - (180) 3,879 (122) 3,757
Non-Operating Income 70 - - - - 85 - - - 155 (145) 10
Income Tax / Social Contribution and Minority Interest (1,227) - - - - - - - 180 (1,047) (36) (1,083)
Net Income 2,987 - - - - - - - - 2,987 (303) 2,684
Non-Recurring Events (9)
Book Statement of Income
4Q10Book
Statement of Income
Fiscal Hedge (8)
Managerial Statement of Income
Reclassifications
(1) Commission Expenses on the placement of loans and financing were reclassified from the item “Other Operating Expenses” to the item “Financial Margin”; (2) Interest Income/Expenses from the insurance segment were reclassified from the item “Other Operating Revenues/Expenses” to the item “Financial Margin”; (3) Interest Income/Expenses from the financial segment were reclassified from the item “Other Operating Revenues/Expenses” to the item “Financial Margin”; (4) Revenue from Loan Recovery classified under the item “Financial Margin”; Expenses with Discounts Granted classified under the item “Other Operating Revenues/Expenses” and Expenses with Write-offs of Leasing
Operations classified under the item “Financial Margin” were reclassified to the item “PLL Expenses - Allowance for Loan Losses”; (5) Losses from the Sale of Foreclosed Assets – BNDU classified under the item “Non-Operating Income” were reclassified to the item “PLL Expenses - Allowance for Loan Losses”; (6) Income from Commissions and Credit Card Fees, Insurance Premium Commissions and Insurance Policy Fees classified under the item “Other Operating Revenues/Expenses” were reclassified to the item “Fee and
Commission Income”; (7) Credit Card Operation Interchange Expenses classified under the item “Other Operating Revenues/Expenses” were reclassified to the item “Other Administrative Expenses”; (8) The partial result of Derivatives used to hedge investments abroad, which simply cancels the tax effects (IR/CS and PIS/Cofins) of this hedge strategy in terms of Net Income; and (9) For more information see page 08 of this chapter.
(*) Result of Insurance, Private Pension and Savings Bond Operations = Insurance, Private Pension and Savings Bond Retained Premiums - Variation in the Technical Provisions of Insurance, Private Pension Plans and Savings
Bonds – Retained Claims – Drawings and Redemption of Savings Bonds – Selling Expenses with Insurance Plans, Private Pension Plans and Savings Bonds.
Press Release
Bradesco 25
Statement of Income – Book vs. Managerial vs. Adjusted
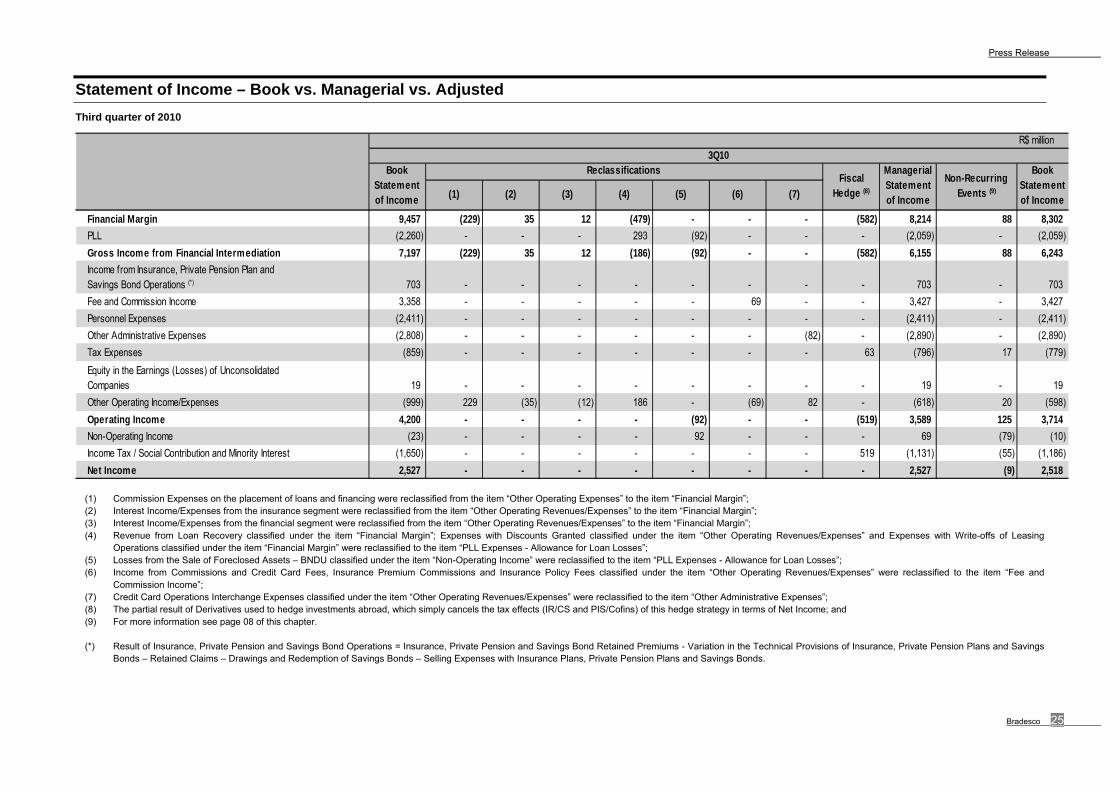
Third quarter of 2010
R$ million
(1) (2) (3) (4) (5) (6) (7)
Financial Margin 9,457 (229) 35 12 (479) - - - (582) 8,214 88 8,302
PLL (2,260) - - - 293 (92) - - - (2,059) - (2,059)
Gross Income from Financial Intermediation 7,197 (229) 35 12 (186) (92) - - (582) 6,155 88 6,243
Income from Insurance, Private Pension Plan and Savings Bond Operations (*) 703 - - - - - - - - 703 - 703
Fee and Commission Income 3,358 - - - - - 69 - - 3,427 - 3,427
Personnel Expenses (2,411) - - - - - - - - (2,411) - (2,411)
Other Administrative Expenses (2,808) - - - - - - (82) - (2,890) - (2,890)
Tax Expenses (859) - - - - - - - 63 (796) 17 (779)
Equity in the Earnings (Losses) of Unconsolidated Companies 19 - - - - - - - - 19 - 19
Other Operating Income/Expenses (999) 229 (35) (12) 186 - (69) 82 - (618) 20 (598)
Operating Income 4,200 - - - - (92) - - (519) 3,589 125 3,714
Non-Operating Income (23) - - - - 92 - - - 69 (79) (10)
Income Tax / Social Contribution and Minority Interest (1,650) - - - - - - - 519 (1,131) (55) (1,186)
Net Income 2,527 - - - - - - - - 2,527 (9) 2,518
3Q10
Non-Recurring Events (9)
Book Statement of Income
Book Statement of Income
ReclassificationsFiscal
Hedge (8)
Managerial Statement of Income
(1) Commission Expenses on the placement of loans and financing were reclassified from the item “Other Operating Expenses” to the item “Financial Margin”; (2) Interest Income/Expenses from the insurance segment were reclassified from the item “Other Operating Revenues/Expenses” to the item “Financial Margin”; (3) Interest Income/Expenses from the financial segment were reclassified from the item “Other Operating Revenues/Expenses” to the item “Financial Margin”; (4) Revenue from Loan Recovery classified under the item “Financial Margin”; Expenses with Discounts Granted classified under the item “Other Operating Revenues/Expenses” and Expenses with Write-offs of Leasing
Operations classified under the item “Financial Margin” were reclassified to the item “PLL Expenses - Allowance for Loan Losses”; (5) Losses from the Sale of Foreclosed Assets – BNDU classified under the item “Non-Operating Income” were reclassified to the item “PLL Expenses - Allowance for Loan Losses”; (6) Income from Commissions and Credit Card Fees, Insurance Premium Commissions and Insurance Policy Fees classified under the item “Other Operating Revenues/Expenses” were reclassified to the item “Fee and
Commission Income”; (7) Credit Card Operations Interchange Expenses classified under the item “Other Operating Revenues/Expenses” were reclassified to the item “Other Administrative Expenses”; (8) The partial result of Derivatives used to hedge investments abroad, which simply cancels the tax effects (IR/CS and PIS/Cofins) of this hedge strategy in terms of Net Income; and (9) For more information see page 08 of this chapter.
(*) Result of Insurance, Private Pension and Savings Bond Operations = Insurance, Private Pension and Savings Bond Retained Premiums - Variation in the Technical Provisions of Insurance, Private Pension Plans and Savings
Bonds – Retained Claims – Drawings and Redemption of Savings Bonds – Selling Expenses with Insurance Plans, Private Pension Plans and Savings Bonds.

Press Release
26 Report on Economic and Financial Analysis – December 2010
Statement of Income – Book vs. Managerial vs. Adjusted
Fiscal Year 2010
R$ million 12M10
(1) (2) (3) (4) (5) (6) (7)
Financial Margin 35,890 (419) 143 (307) (1,658) - - - (681) 32,968 88 33,056
PLL (9,037) - - - 940 (386) - - - (8,483) (220) (8,703)
Gross Income from Financial Intermediation 26,853 (419) 143 (307) (718) (386) - - (681) 24,485 (132) 24,353
Income from Insurance, Private Pension Plan and Savings Bond Operations (*) 2,772 - - - - - - - - 2,772 - 2,772
Fee and Commission Income 13,102 - - - - - 270 - - 13,372 - 13,372
Personnel Expenses (9,302) - - - - - - - - (9,302) - (9,302)
Other Administrative Expenses (11,193) - - - - - - (339) - (11,532) - (11,532)
Tax Expenses (3,211) - - - - - - - 74 (3,137) 17 (3,120)
Equity in the Earnings (Losses) of Unconsolidated Companies 127 - - - - - - - - 127 - 127
Other Operating Income/Expenses (4,378) 419 (143) 307 718 - (270) 339 - (3,008) 626 (2,382)
Operating Income 14,770 - - - - (386) - - (607) 13,777 511 14,288
Non-Operating Income (170) - - - - 386 - - - 216 (224) (8)
Income Tax / Social Contribution and Minority Interest (4,578) - - - - - - - 607 (3,971) (505) (4,476)
Net Income 10,022 - - - - - - - - 10,022 (218) 9,804
Non-Recurring Events (9)
Book Statement of Income
Managerial Statement of Income
Book Statement of Income
ReclassificationsFiscal
Hedge (8)
(1) Commission Expenses on the placement of loans and financing were reclassified from the item “Other Operating Expenses” to the item “Financial Margin”; (2) Interest Income/Expenses from the insurance segment were reclassified from the item “Other Operating Revenues/Expenses” to the item “Financial Margin”; (3) Interest Income/Expenses from the financial segment were reclassified from the item “Other Operating Revenues/Expenses” to the item “Financial Margin”; (4) Revenue from Loan Recovery classified under the item “Financial Margin”; Expenses with Discounts Granted classified under the item “Other Operating Revenues/Expenses” and Expenses with Write-offs of Leasing
Operations classified under the item “Financial Margin” were reclassified to the item “PLL Expenses - Allowance for Loan Losses”; (5) Losses from the Sale of Foreclosed Assets – BNDU classified under the item “Non-Operating Income” were reclassified to the item “PLL Expenses - Allowance for Loan Losses”; (6) Income from Commissions and Credit Card Fees, Insurance Premium Commissions and Insurance Policy Fees classified under the item “Other Operating Revenues/Expenses” were reclassified to the item “Fee and
Commission Income”; (7) Credit Card Operations Interchange Expenses classified under the item “Other Operating Revenues/Expenses” were reclassified to the item “Other Administrative Expenses”; (8) The partial result of Derivatives used to hedge investments abroad, which simply cancels the tax effects (IR/CS and PIS/Cofins) of this hedge strategy in terms of Net Income; and (9) For more information see page 08 of this chapter.
(*) Result of Insurance, Private Pension and Savings Bond Operations = Insurance, Private Pension and Savings Bond Retained Premiums - Variation in the Technical Provisions of Insurance, Private Pension Plans and Savings
Bonds – Retained Claims – Drawings and Redemption of Savings Bonds – Selling Expenses with Insurance Plans, Private Pension Plans and Savings Bonds.
Press Release
Bradesco 27
Statement of Income – Book vs. Managerial vs. Adjusted
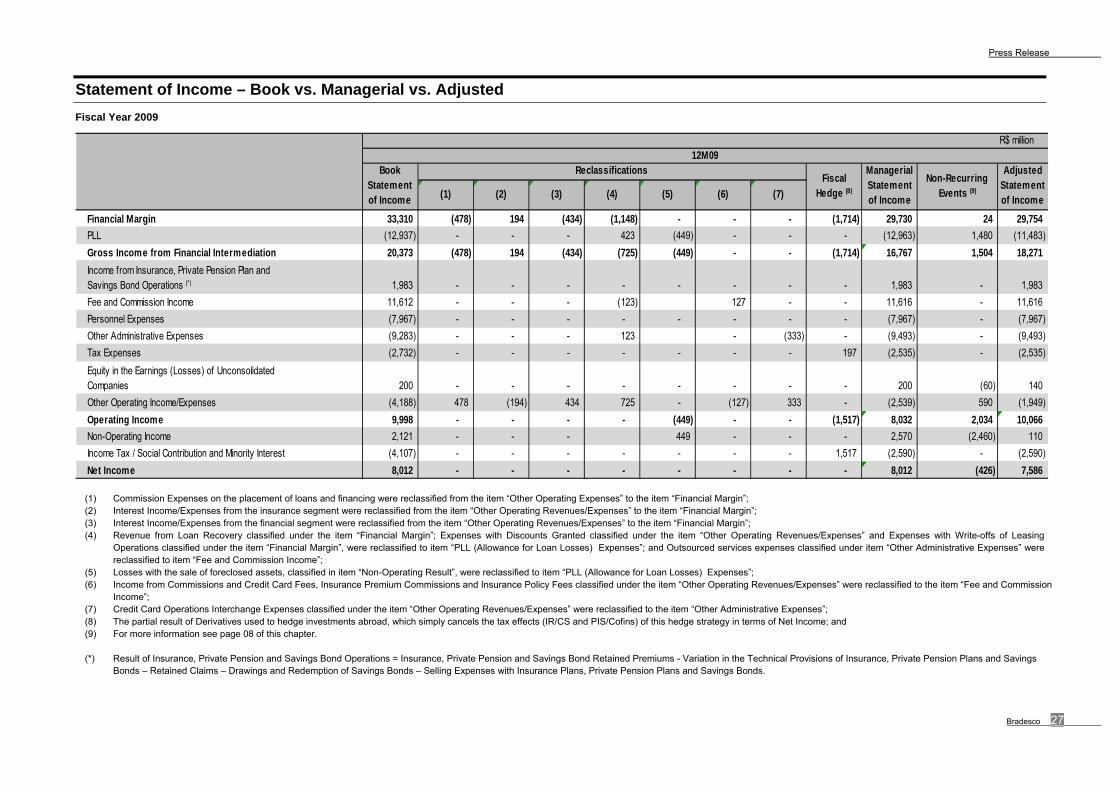
Fiscal Year 2009
R$ million
(1) (2) (3) (4) (5) (6) (7)
Financial Margin 33,310 (478) 194 (434) (1,148) - - - (1,714) 29,730 24 29,754
PLL (12,937) - - - 423 (449) - - - (12,963) 1,480 (11,483)
Gross Income from Financial Intermediation 20,373 (478) 194 (434) (725) (449) - - (1,714) 16,767 1,504 18,271
Income from Insurance, Private Pension Plan and Savings Bond Operations (*) 1,983 - - - - - - - - 1,983 - 1,983
Fee and Commission Income 11,612 - - - (123) 127 - - 11,616 - 11,616
Personnel Expenses (7,967) - - - - - - - - (7,967) - (7,967)
Other Administrative Expenses (9,283) - - - 123 - (333) - (9,493) - (9,493)
Tax Expenses (2,732) - - - - - - - 197 (2,535) - (2,535)
Equity in the Earnings (Losses) of Unconsolidated Companies 200 - - - - - - - - 200 (60) 140
Other Operating Income/Expenses (4,188) 478 (194) 434 725 - (127) 333 - (2,539) 590 (1,949)
Operating Income 9,998 - - - - (449) - - (1,517) 8,032 2,034 10,066
Non-Operating Income 2,121 - - - 449 - - - 2,570 (2,460) 110
Income Tax / Social Contribution and Minority Interest (4,107) - - - - - - - 1,517 (2,590) - (2,590)
Net Income 8,012 - - - - - - - - 8,012 (426) 7,586
Non-Recurring Events (9)
Fiscal Hedge (8)
12M09Book
Statement of Income
Reclassifications Managerial Statement of Income
Adjusted Statement of Income
(1) Commission Expenses on the placement of loans and financing were reclassified from the item “Other Operating Expenses” to the item “Financial Margin”; (2) Interest Income/Expenses from the insurance segment were reclassified from the item “Other Operating Revenues/Expenses” to the item “Financial Margin”; (3) Interest Income/Expenses from the financial segment were reclassified from the item “Other Operating Revenues/Expenses” to the item “Financial Margin”; (4) Revenue from Loan Recovery classified under the item “Financial Margin”; Expenses with Discounts Granted classified under the item “Other Operating Revenues/Expenses” and Expenses with Write-offs of Leasing
Operations classified under the item “Financial Margin”, were reclassified to item “PLL (Allowance for Loan Losses) Expenses”; and Outsourced services expenses classified under item “Other Administrative Expenses” were reclassified to item “Fee and Commission Income”;
(5) Losses with the sale of foreclosed assets, classified in item “Non-Operating Result”, were reclassified to item “PLL (Allowance for Loan Losses) Expenses”; (6) Income from Commissions and Credit Card Fees, Insurance Premium Commissions and Insurance Policy Fees classified under the item “Other Operating Revenues/Expenses” were reclassified to the item “Fee and Commission
Income”; (7) Credit Card Operations Interchange Expenses classified under the item “Other Operating Revenues/Expenses” were reclassified to the item “Other Administrative Expenses”; (8) The partial result of Derivatives used to hedge investments abroad, which simply cancels the tax effects (IR/CS and PIS/Cofins) of this hedge strategy in terms of Net Income; and (9) For more information see page 08 of this chapter.
(*) Result of Insurance, Private Pension and Savings Bond Operations = Insurance, Private Pension and Savings Bond Retained Premiums - Variation in the Technical Provisions of Insurance, Private Pension Plans and Savings
Bonds – Retained Claims – Drawings and Redemption of Savings Bonds – Selling Expenses with Insurance Plans, Private Pension Plans and Savings Bonds.