Embed Size (px)
Citation preview

www.mergermarket.com
press releasemergermarket M&A Round-up for Year End 2011
January 3 2012, for immediate release
PRESS CONTACTS
EMEA: Flora Wilke Americas: Dara Silverstein Asia-Pacific: Michel [email protected] [email protected] [email protected]: +44 207 059 6348 Tel: +1 646 3783118 Tel: +852 2158 9706
Press Release: www.mergermarket.com 2mergermarket M&A Round-up for Year End 2011
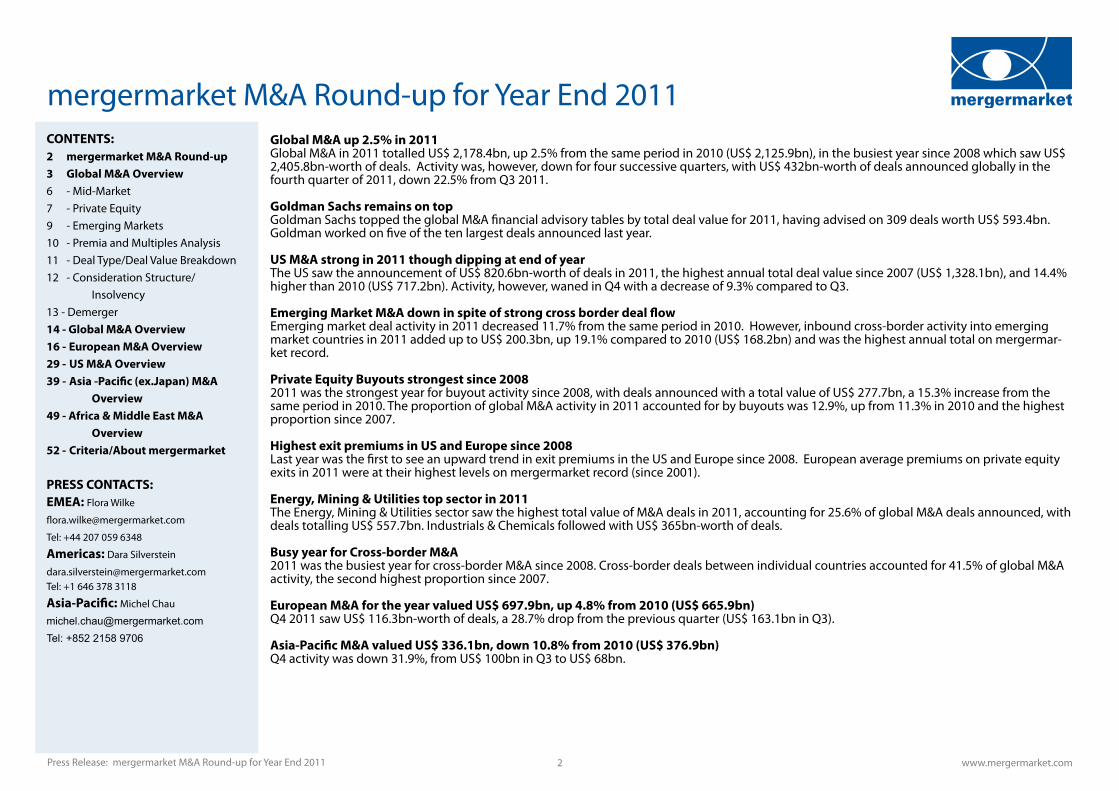
Global M&A up 2.5% in 2011Global M&A in 2011 totalled US$ 2,178.4bn, up 2.5% from the same period in 2010 (US$ 2,125.9bn), in the busiest year since 2008 which saw US$ 2,405.8bn-worth of deals. Activity was, however, down for four successive quarters, with US$ 432bn-worth of deals announced globally in the fourth quarter of 2011, down 22.5% from Q3 2011.
Goldman Sachs remains on topGoldman Sachs topped the global M&A financial advisory tables by total deal value for 2011, having advised on 309 deals worth US$ 593.4bn. Goldman worked on five of the ten largest deals announced last year.
US M&A strong in 2011 though dipping at end of yearThe US saw the announcement of US$ 820.6bn-worth of deals in 2011, the highest annual total deal value since 2007 (US$ 1,328.1bn), and 14.4% higher than 2010 (US$ 717.2bn). Activity, however, waned in Q4 with a decrease of 9.3% compared to Q3.
Emerging Market M&A down in spite of strong cross border deal flowEmerging market deal activity in 2011 decreased 11.7% from the same period in 2010. However, inbound cross-border activity into emerging market countries in 2011 added up to US$ 200.3bn, up 19.1% compared to 2010 (US$ 168.2bn) and was the highest annual total on mergermar-ket record.
Private Equity Buyouts strongest since 20082011 was the strongest year for buyout activity since 2008, with deals announced with a total value of US$ 277.7bn, a 15.3% increase from the same period in 2010. The proportion of global M&A activity in 2011 accounted for by buyouts was 12.9%, up from 11.3% in 2010 and the highest proportion since 2007.
Highest exit premiums in US and Europe since 2008Last year was the first to see an upward trend in exit premiums in the US and Europe since 2008. European average premiums on private equity exits in 2011 were at their highest levels on mergermarket record (since 2001).
Energy, Mining & Utilities top sector in 2011 The Energy, Mining & Utilities sector saw the highest total value of M&A deals in 2011, accounting for 25.6% of global M&A deals announced, with deals totalling US$ 557.7bn. Industrials & Chemicals followed with US$ 365bn-worth of deals.
Busy year for Cross-border M&A2011 was the busiest year for cross-border M&A since 2008. Cross-border deals between individual countries accounted for 41.5% of global M&A activity, the second highest proportion since 2007.
European M&A for the year valued US$ 697.9bn, up 4.8% from 2010 (US$ 665.9bn)Q4 2011 saw US$ 116.3bn-worth of deals, a 28.7% drop from the previous quarter (US$ 163.1bn in Q3).
Asia-Pacific M&A valued US$ 336.1bn, down 10.8% from 2010 (US$ 376.9bn)Q4 activity was down 31.9%, from US$ 100bn in Q3 to US$ 68bn.
mergermarket M&A Round-up for Year End 2011 CONTENTS:2 mergermarket M&A Round-up3 Global M&A Overview 6 - Mid-Market 7 - Private Equity9 - Emerging Markets10 - Premia and Multiples Analysis 11 - Deal Type/Deal Value Breakdown 12 - Consideration Structure/
Insolvency 13 - Demerger 14 - Global M&A Overview 16 - European M&A Overview 29 - US M&A Overview 39 - Asia -Pacific (ex.Japan) M&A
Overview 49 - Africa & Middle East M&A
Overview 52 - Criteria/About mergermarket
PRESS CONTACTS:EMEA: Flora Wilke
Tel: +44 207 059 6348
Americas: Dara Silverstein
[email protected]: +1 646 378 3118
Asia-Pacific: Michel Chau
[email protected]: +852 2158 9706
0
250
500
750
1,000
1,250
1,500
1,750
2,000
2,250
2,500
2,750
3,000
3,250
3,500
3,750
4,000
4,250
4,500
0
100
200
300
400
500
600
700
800
900
1,000
1,100
1,200
1,300
Volu
me o
f Dea
ls
Valu
e of D
eals
(US$
bn)
Global M&A Activity - Quarterly
RoW M&A
Asia-Pacif ic ex Jp M&A
US M&A
European M&A
Volume
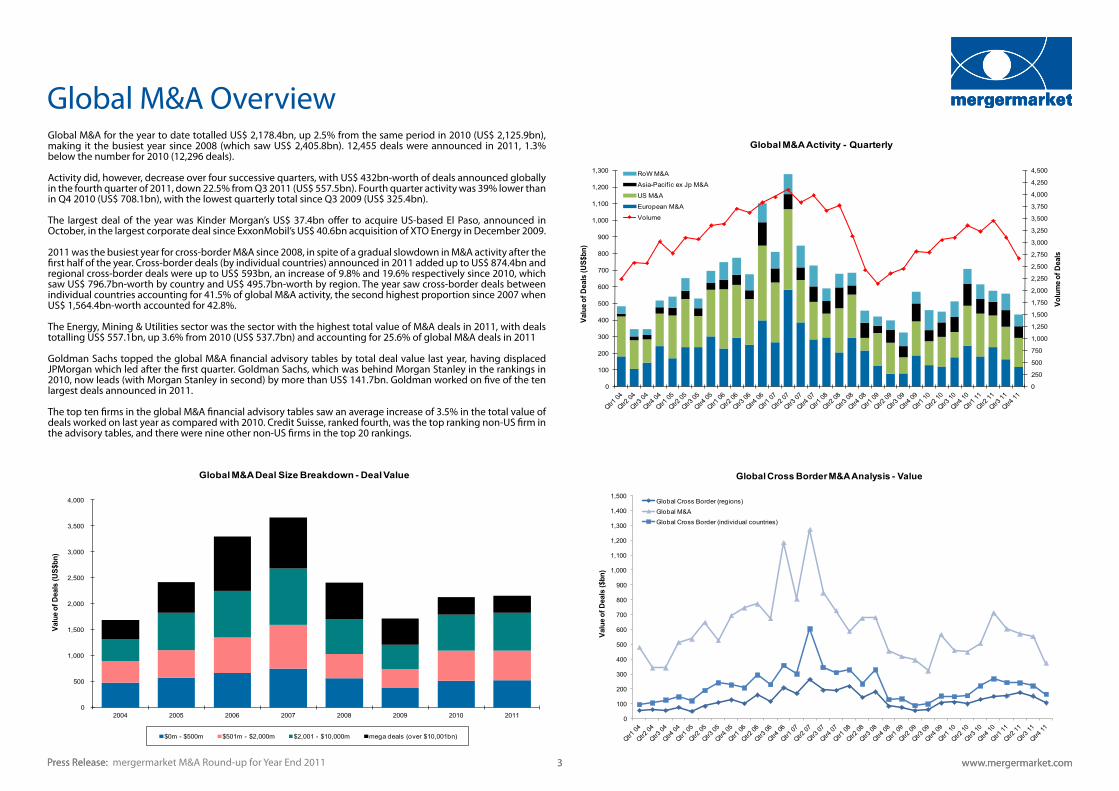
Global M&A for the year to date totalled US$ 2,178.4bn, up 2.5% from the same period in 2010 (US$ 2,125.9bn), making it the busiest year since 2008 (which saw US$ 2,405.8bn). 12,455 deals were announced in 2011, 1.3% below the number for 2010 (12,296 deals).
Activity did, however, decrease over four successive quarters, with US$ 432bn-worth of deals announced globally in the fourth quarter of 2011, down 22.5% from Q3 2011 (US$ 557.5bn). Fourth quarter activity was 39% lower than in Q4 2010 (US$ 708.1bn), with the lowest quarterly total since Q3 2009 (US$ 325.4bn).
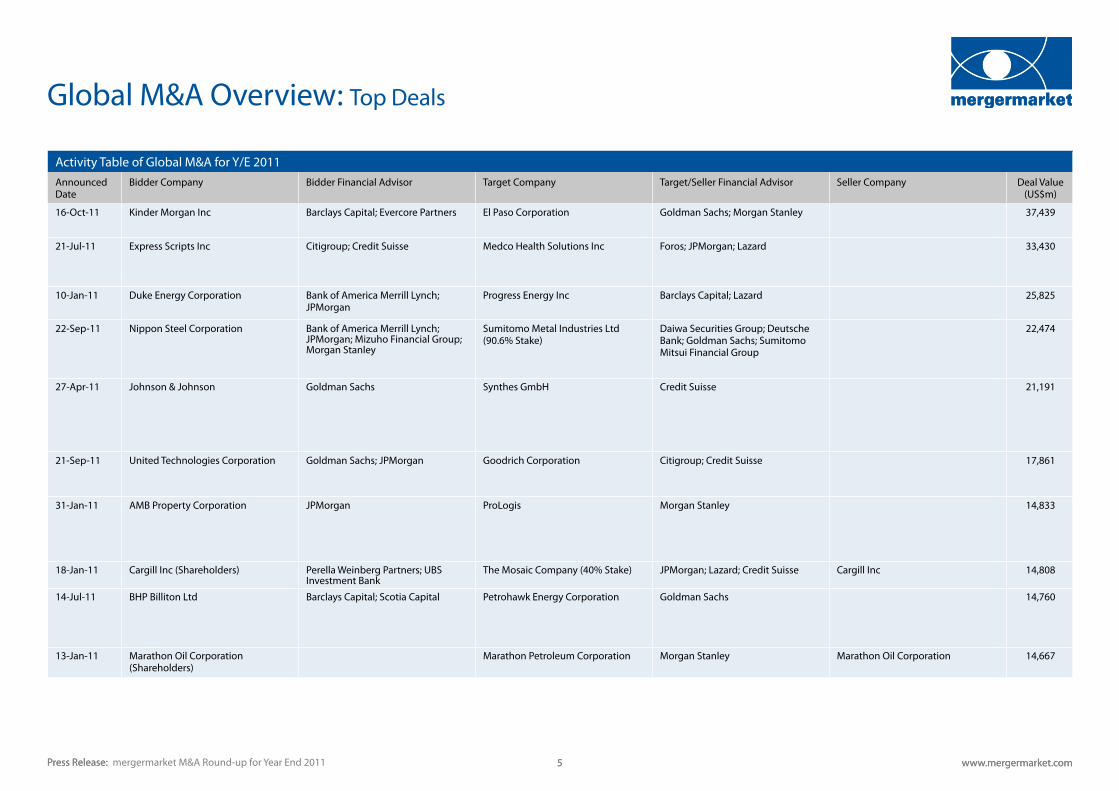
The largest deal of the year was Kinder Morgan’s US$ 37.4bn offer to acquire US-based El Paso, announced in October, in the largest corporate deal since ExxonMobil’s US$ 40.6bn acquisition of XTO Energy in December 2009.
2011 was the busiest year for cross-border M&A since 2008, in spite of a gradual slowdown in M&A activity after the first half of the year. Cross-border deals (by individual countries) announced in 2011 added up to US$ 874.4bn and regional cross-border deals were up to US$ 593bn, an increase of 9.8% and 19.6% respectively since 2010, which saw US$ 796.7bn-worth by country and US$ 495.7bn-worth by region. The year saw cross-border deals between individual countries accounting for 41.5% of global M&A activity, the second highest proportion since 2007 when US$ 1,564.4bn-worth accounted for 42.8%.
The Energy, Mining & Utilities sector was the sector with the highest total value of M&A deals in 2011, with deals totalling US$ 557.1bn, up 3.6% from 2010 (US$ 537.7bn) and accounting for 25.6% of global M&A deals in 2011
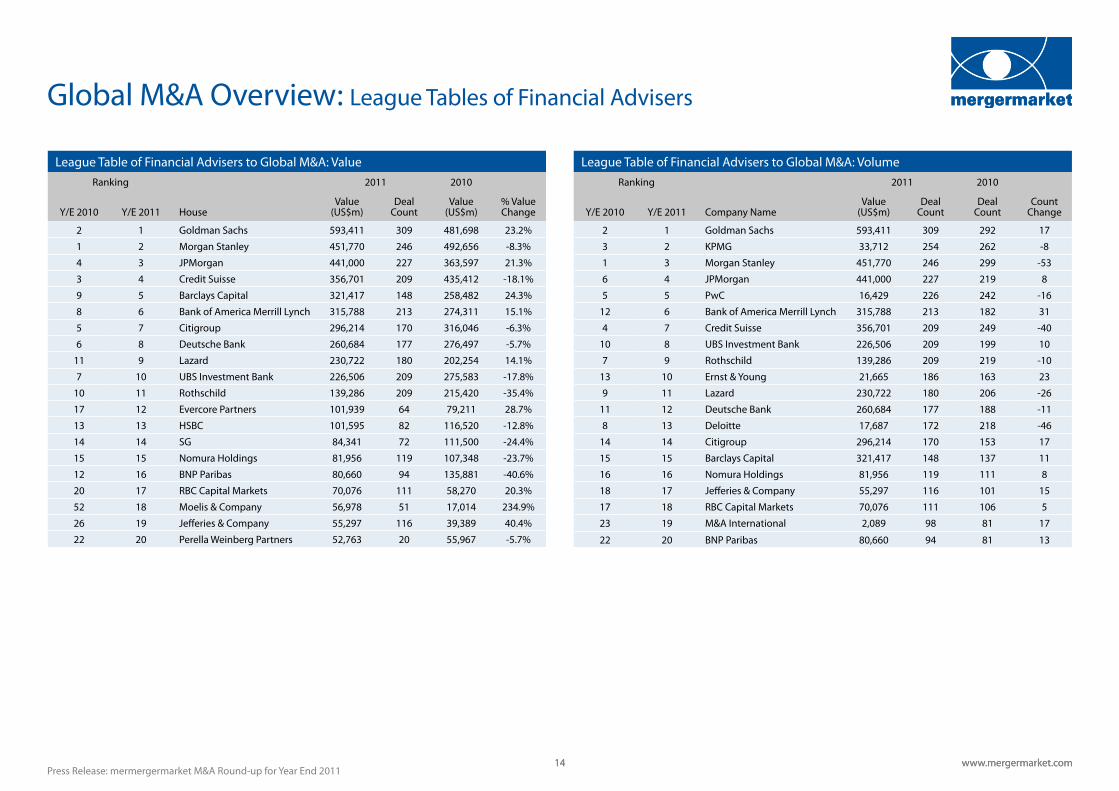
Goldman Sachs topped the global M&A financial advisory tables by total deal value last year, having displaced JPMorgan which led after the first quarter. Goldman Sachs, which was behind Morgan Stanley in the rankings in 2010, now leads (with Morgan Stanley in second) by more than US$ 141.7bn. Goldman worked on five of the ten largest deals announced in 2011.
The top ten firms in the global M&A financial advisory tables saw an average increase of 3.5% in the total value of deals worked on last year as compared with 2010. Credit Suisse, ranked fourth, was the top ranking non-US firm in the advisory tables, and there were nine other non-US firms in the top 20 rankings.
0
100
200
300
400
500
600
700
800
900
1,000
1,100
1,200
1,300
1,400
1,500
Valu
e of
Dea
ls ($
bn)
Global Cross Border M&A Analysis - Value
GlobalCrossBorder(regions)Global M&AGlobalCrossBorder(individualcountries)
0
500
1,000
1,500
2,000
2,500
3,000
3,500
4,000
2004 2005 2006 2007 2008 2009 2010 2011
Valu
e of D
eals
(US$
bn)
Global M&A Deal Size Breakdown - Deal Value
$0m- $500m $501m- $2,000m $2,001 - $10,000m megadeals(over$10,001bn)
Press Release: www.mergermarket.com 3Press Release: www.mergermarket.com 3
Global M&A Overview
mergermarket M&A Round-up for Year End 2011
NorthAmerica41.6%
Central&SouthAmerica6.1%
Western Europe17.4%
Southern Europe6.3%
Northern Europe3.2%
Central & Eastern Europe5.1%
North Asia7.6%
Japan3.1%
Australasia3.9%
South & Central Asia1.7%
South East Asia2.3%
Africa&MiddleEast1.7%
Mix of Announced Deals by Geographic Region 2011 - Value
NorthAmerica31.6%
Central&SouthAmerica4.9%
Western Europe24.8%
Southern Europe6.2%
Northern Europe5.7%
Central & Eastern Europe5.1%
North Asia7.9%
Japan2.8%
Australasia3.7%
South & Central Asia2.1%
South East Asia2.7%
Africa&MiddleEast2.5%
Mix of Announced Deals by Geographic Region 2011 - Volume
Press Release: www.mergermarket.com 4Press Release: www.mergermarket.com 4
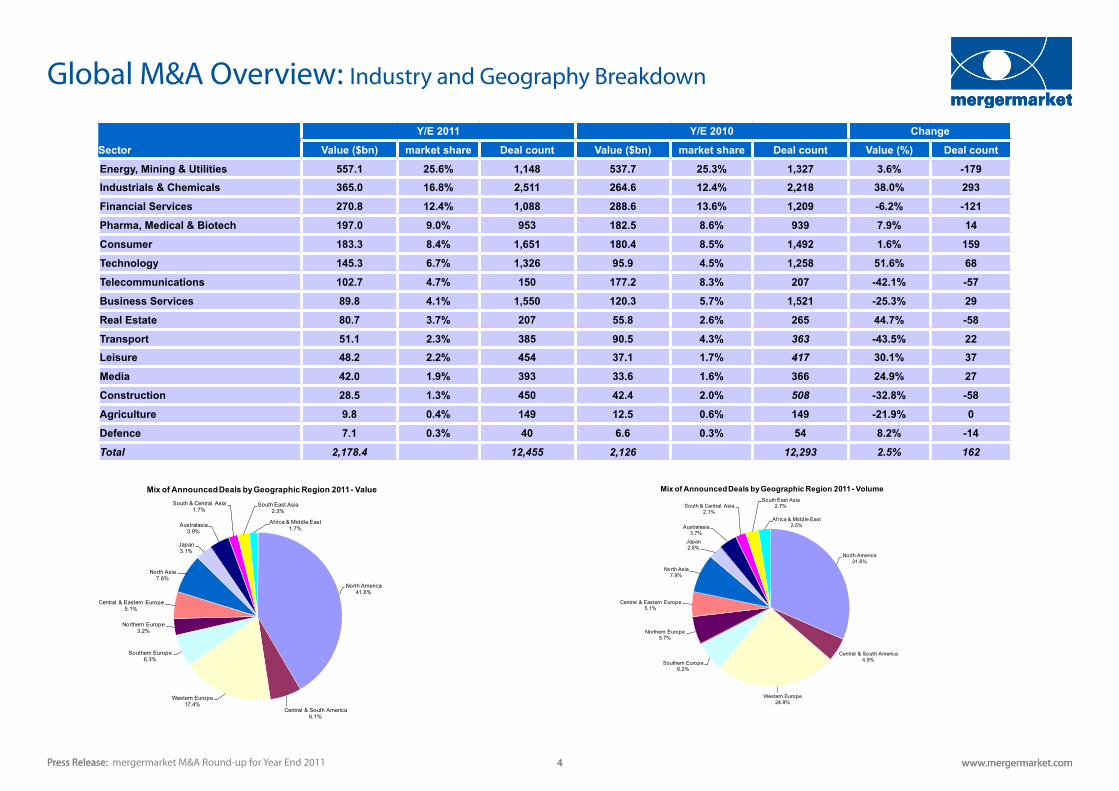
Global M&A Overview: Industry and Geography Breakdown
Y/E 2011 Y/E 2010 Change
Sector Value ($bn) market share Deal count Value ($bn) market share Deal count Value (%) Deal count
Energy, Mining & Utilities 557.1 25.6% 1,148 537.7 25.3% 1,327 3.6% -179Industrials & Chemicals 365.0 16.8% 2,511 264.6 12.4% 2,218 38.0% 293
Financial Services 270.8 12.4% 1,088 288.6 13.6% 1,209 -6.2% -121
Pharma, Medical & Biotech 197.0 9.0% 953 182.5 8.6% 939 7.9% 14
Consumer 183.3 8.4% 1,651 180.4 8.5% 1,492 1.6% 159
Technology 145.3 6.7% 1,326 95.9 4.5% 1,258 51.6% 68
Telecommunications 102.7 4.7% 150 177.2 8.3% 207 -42.1% -57
Business Services 89.8 4.1% 1,550 120.3 5.7% 1,521 -25.3% 29
Real Estate 80.7 3.7% 207 55.8 2.6% 265 44.7% -58
Transport 51.1 2.3% 385 90.5 4.3% 363 -43.5% 22Leisure 48.2 2.2% 454 37.1 1.7% 417 30.1% 37
Media 42.0 1.9% 393 33.6 1.6% 366 24.9% 27
Construction 28.5 1.3% 450 42.4 2.0% 508 -32.8% -58
Agriculture 9.8 0.4% 149 12.5 0.6% 149 -21.9% 0
Defence 7.1 0.3% 40 6.6 0.3% 54 8.2% -14
Total 2,178.4 12,455 2,126 12,293 2.5% 162
mergermarket M&A Round-up for Year End 2011
Press Release: www.mergermarket.com 5Press Release: www.mergermarket.com 5mergermarket M&A Round-up for Year End 2011
Global M&A Overview: Top Deals
Activity Table of Global M&A for Y/E 2011 Announced Date
Bidder Company Bidder Financial Advisor Target Company Target/Seller Financial Advisor Seller Company Deal Value (US$m)
16-Oct-11 Kinder Morgan Inc Barclays Capital; Evercore Partners El Paso Corporation Goldman Sachs; Morgan Stanley 37,439
21-Jul-11 Express Scripts Inc Citigroup; Credit Suisse Medco Health Solutions Inc Foros; JPMorgan; Lazard 33,430
10-Jan-11 Duke Energy Corporation Bank of America Merrill Lynch; JPMorgan
Progress Energy Inc Barclays Capital; Lazard 25,825
22-Sep-11 Nippon Steel Corporation Bank of America Merrill Lynch; JPMorgan; Mizuho Financial Group; Morgan Stanley
Sumitomo Metal Industries Ltd (90.6% Stake)
Daiwa Securities Group; Deutsche Bank; Goldman Sachs; Sumitomo Mitsui Financial Group
22,474
27-Apr-11 Johnson & Johnson Goldman Sachs Synthes GmbH Credit Suisse 21,191
21-Sep-11 United Technologies Corporation Goldman Sachs; JPMorgan Goodrich Corporation Citigroup; Credit Suisse 17,861
31-Jan-11 AMB Property Corporation JPMorgan ProLogis Morgan Stanley 14,833
18-Jan-11 Cargill Inc (Shareholders) Perella Weinberg Partners; UBS Investment Bank
The Mosaic Company (40% Stake) JPMorgan; Lazard; Credit Suisse Cargill Inc 14,808
14-Jul-11 BHP Billiton Ltd Barclays Capital; Scotia Capital Petrohawk Energy Corporation Goldman Sachs 14,760
13-Jan-11 Marathon Oil Corporation (Shareholders)
Marathon Petroleum Corporation Morgan Stanley Marathon Oil Corporation 14,667
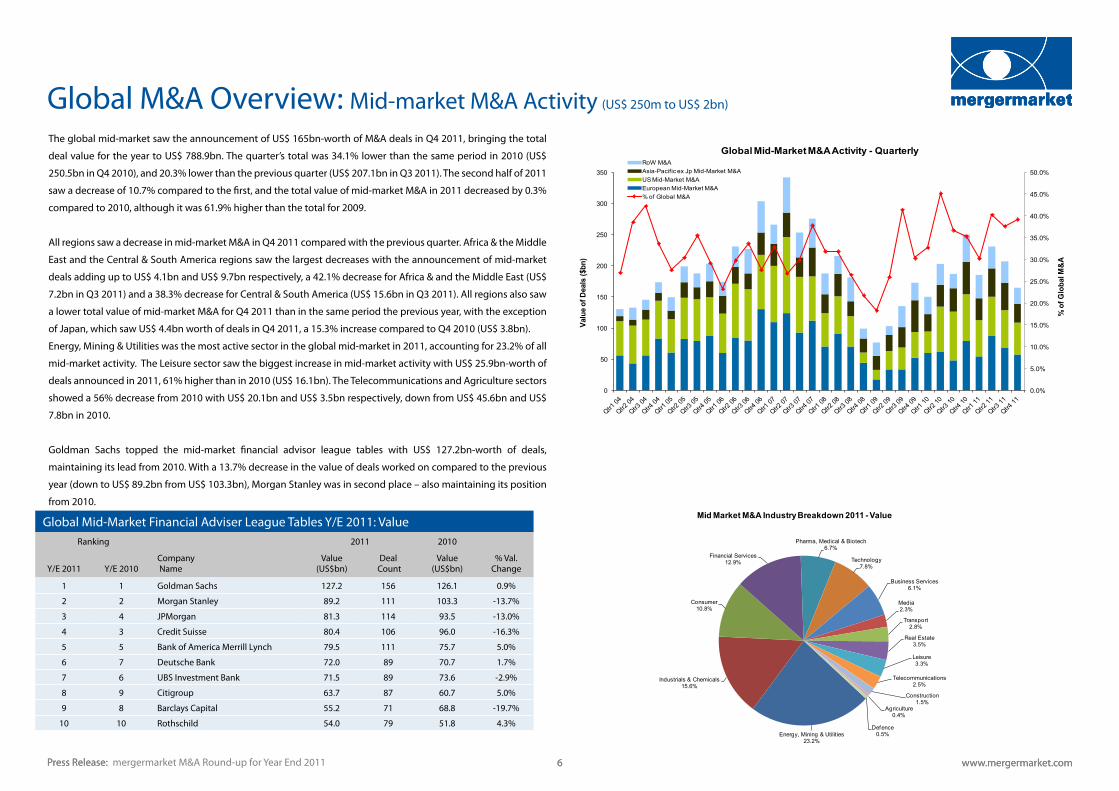
The global mid-market saw the announcement of US$ 165bn-worth of M&A deals in Q4 2011, bringing the total
deal value for the year to US$ 788.9bn. The quarter’s total was 34.1% lower than the same period in 2010 (US$
250.5bn in Q4 2010), and 20.3% lower than the previous quarter (US$ 207.1bn in Q3 2011). The second half of 2011
saw a decrease of 10.7% compared to the first, and the total value of mid-market M&A in 2011 decreased by 0.3%
compared to 2010, although it was 61.9% higher than the total for 2009.
All regions saw a decrease in mid-market M&A in Q4 2011 compared with the previous quarter. Africa & the Middle
East and the Central & South America regions saw the largest decreases with the announcement of mid-market
deals adding up to US$ 4.1bn and US$ 9.7bn respectively, a 42.1% decrease for Africa & and the Middle East (US$
7.2bn in Q3 2011) and a 38.3% decrease for Central & South America (US$ 15.6bn in Q3 2011). All regions also saw
a lower total value of mid-market M&A for Q4 2011 than in the same period the previous year, with the exception
of Japan, which saw US$ 4.4bn worth of deals in Q4 2011, a 15.3% increase compared to Q4 2010 (US$ 3.8bn).
Energy, Mining & Utilities was the most active sector in the global mid-market in 2011, accounting for 23.2% of all
mid-market activity. The Leisure sector saw the biggest increase in mid-market activity with US$ 25.9bn-worth of
deals announced in 2011, 61% higher than in 2010 (US$ 16.1bn). The Telecommunications and Agriculture sectors
showed a 56% decrease from 2010 with US$ 20.1bn and US$ 3.5bn respectively, down from US$ 45.6bn and US$
7.8bn in 2010.
Goldman Sachs topped the mid-market financial advisor league tables with US$ 127.2bn-worth of deals,
maintaining its lead from 2010. With a 13.7% decrease in the value of deals worked on compared to the previous
year (down to US$ 89.2bn from US$ 103.3bn), Morgan Stanley was in second place – also maintaining its position
from 2010.
0.0%
5.0%
10.0%
15.0%
20.0%
25.0%
30.0%
35.0%
40.0%
45.0%
50.0%
0
50
100
150
200
250
300
350
Valu
e of
Dea
ls ($
bn)
Global Mid-Market M&A Activity - QuarterlyRoW M&AAsia-PacificexJpMid-Market M&AUSMid-Market M&AEuropeanMid-Market M&A%ofGlobalM&A
% o
fGlo
bal M
&A
Global Mid-Market Financial Adviser League Tables Y/E 2011: ValueRanking 2011 2010
Y/E 2011 Y/E 2010Company Name
Value (US$bn)
Deal Count
Value (US$bn)
% Val. Change
1 1 Goldman Sachs 127.2 156 126.1 0.9%
2 2 Morgan Stanley 89.2 111 103.3 -13.7%
3 4 JPMorgan 81.3 114 93.5 -13.0%
4 3 Credit Suisse 80.4 106 96.0 -16.3%
5 5 Bank of America Merrill Lynch 79.5 111 75.7 5.0%
6 7 Deutsche Bank 72.0 89 70.7 1.7%
7 6 UBS Investment Bank 71.5 89 73.6 -2.9%
8 9 Citigroup 63.7 87 60.7 5.0%
9 8 Barclays Capital 55.2 71 68.8 -19.7%
10 10 Rothschild 54.0 79 51.8 4.3%
Press Release: www.mergermarket.com 6Press Release: www.mergermarket.com 6
Global M&A Overview: Mid-market M&A Activity (US$ 250m to US$ 2bn)
mergermarket M&A Round-up for Year End 2011
Energy,Mining&Utilities23.2%
Industrials&Chemicals15.6%
Consumer10.8%
Financial Services12.9%
Pharma,Medical&Biotech6.7%
Technology7.8%
Business Services6.1%
Media2.3%
Transport2.8%
Real Estate3.5%
Leisure3.3%
Telecommunications2.5%
Construction1.5%
Agriculture0.4%
Defence0.5%
Mid Market M&A Industry Breakdown 2011 -Value
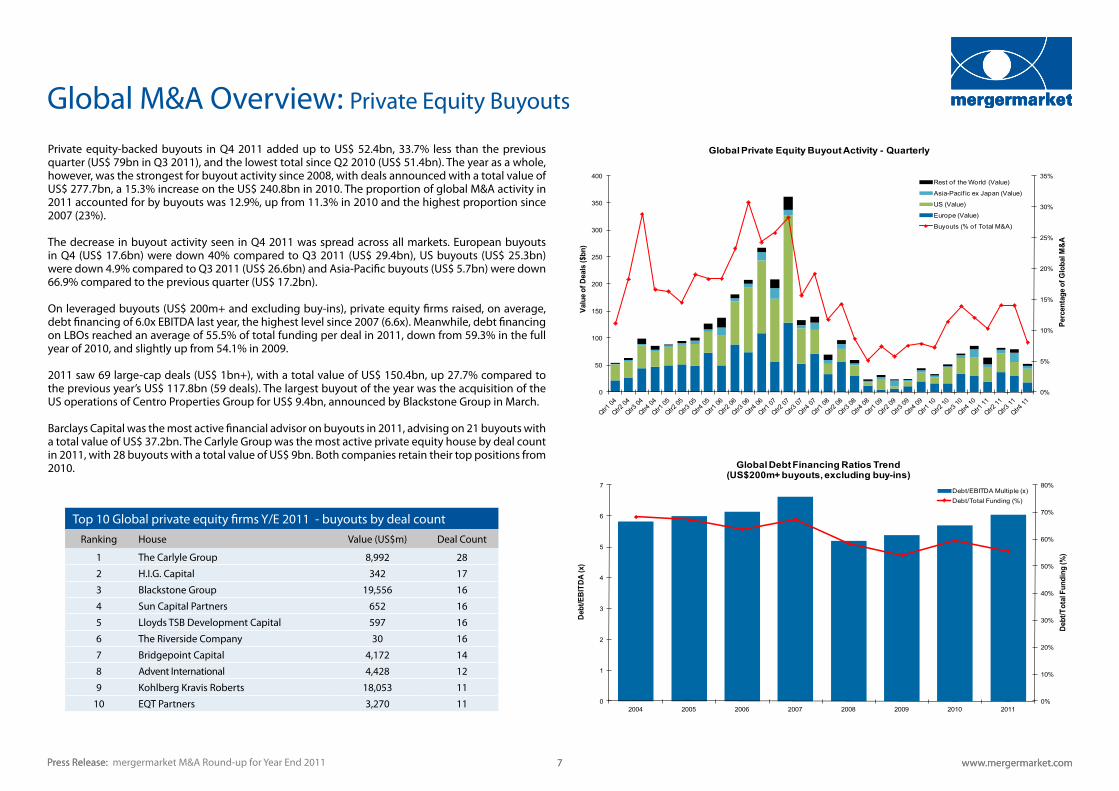
Private equity-backed buyouts in Q4 2011 added up to US$ 52.4bn, 33.7% less than the previous quarter (US$ 79bn in Q3 2011), and the lowest total since Q2 2010 (US$ 51.4bn). The year as a whole, however, was the strongest for buyout activity since 2008, with deals announced with a total value of US$ 277.7bn, a 15.3% increase on the US$ 240.8bn in 2010. The proportion of global M&A activity in 2011 accounted for by buyouts was 12.9%, up from 11.3% in 2010 and the highest proportion since 2007 (23%).
The decrease in buyout activity seen in Q4 2011 was spread across all markets. European buyouts in Q4 (US$ 17.6bn) were down 40% compared to Q3 2011 (US$ 29.4bn), US buyouts (US$ 25.3bn) were down 4.9% compared to Q3 2011 (US$ 26.6bn) and Asia-Pacific buyouts (US$ 5.7bn) were down 66.9% compared to the previous quarter (US$ 17.2bn).
On leveraged buyouts (US$ 200m+ and excluding buy-ins), private equity firms raised, on average, debt financing of 6.0x EBITDA last year, the highest level since 2007 (6.6x). Meanwhile, debt financing on LBOs reached an average of 55.5% of total funding per deal in 2011, down from 59.3% in the full year of 2010, and slightly up from 54.1% in 2009.
2011 saw 69 large-cap deals (US$ 1bn+), with a total value of US$ 150.4bn, up 27.7% compared to the previous year’s US$ 117.8bn (59 deals). The largest buyout of the year was the acquisition of the US operations of Centro Properties Group for US$ 9.4bn, announced by Blackstone Group in March.
Barclays Capital was the most active financial advisor on buyouts in 2011, advising on 21 buyouts with a total value of US$ 37.2bn. The Carlyle Group was the most active private equity house by deal count in 2011, with 28 buyouts with a total value of US$ 9bn. Both companies retain their top positions from 2010.
0%
10%
20%
30%
40%
50%
60%
70%
80%
0
1
2
3
4
5
6
7
2004 2005 2006 2007 2008 2009 2010 2011
Debt
/Tot
al F
undi
ng (%
)
Debt
/EBI
TDA
(x)
Global Debt Financing Ratios Trend(US$200m+ buyouts, excluding buy-ins)
Debt/EBITDAMultiple(x)Debt/TotalFunding(%)
0%
5%
10%
15%
20%
25%
30%
35%
0
50
100
150
200
250
300
350
400
Perc
enta
ge o
f Glo
bal M
&A
Valu
e of D
eals
($bn
)
Global Private Equity Buyout Activity - Quarterly
Restof theWorld(Value)
Asia-Pacif icexJapan(Value)
US(Value)
Europe(Value)
Buyouts(%of TotalM&A)
Top 10 Global private equity firms Y/E 2011 - buyouts by deal countRanking House Value (US$m) Deal Count
1 The Carlyle Group 8,992 28
2 H.I.G. Capital 342 17
3 Blackstone Group 19,556 16
4 Sun Capital Partners 652 16
5 Lloyds TSB Development Capital 597 16
6 The Riverside Company 30 16
7 Bridgepoint Capital 4,172 14
8 Advent International 4,428 12
9 Kohlberg Kravis Roberts 18,053 11
10 EQT Partners 3,270 11
Press Release: www.mergermarket.com 7Press Release: www.mergermarket.com 7
Global M&A Overview: Private Equity Buyouts
mergermarket M&A Round-up for Year End 2011
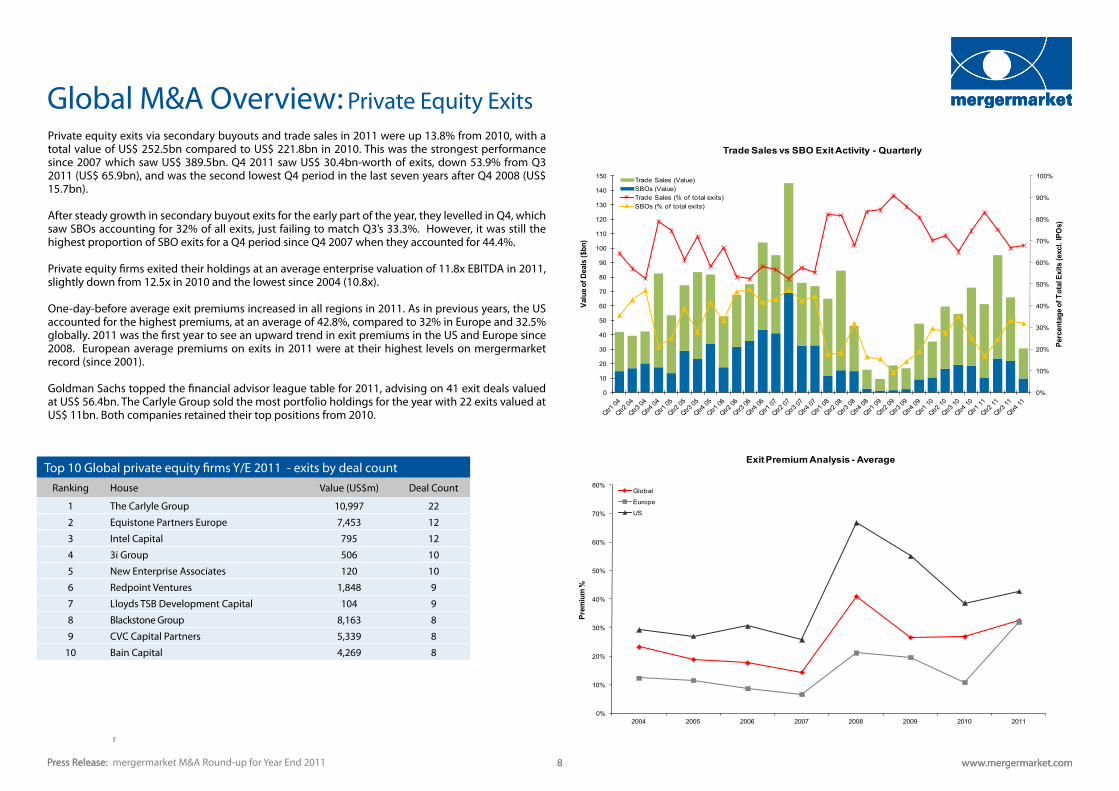
Private equity exits via secondary buyouts and trade sales in 2011 were up 13.8% from 2010, with a total value of US$ 252.5bn compared to US$ 221.8bn in 2010. This was the strongest performance since 2007 which saw US$ 389.5bn. Q4 2011 saw US$ 30.4bn-worth of exits, down 53.9% from Q3 2011 (US$ 65.9bn), and was the second lowest Q4 period in the last seven years after Q4 2008 (US$ 15.7bn).
After steady growth in secondary buyout exits for the early part of the year, they levelled in Q4, which saw SBOs accounting for 32% of all exits, just failing to match Q3’s 33.3%. However, it was still the highest proportion of SBO exits for a Q4 period since Q4 2007 when they accounted for 44.4%.
Private equity firms exited their holdings at an average enterprise valuation of 11.8x EBITDA in 2011, slightly down from 12.5x in 2010 and the lowest since 2004 (10.8x).
One-day-before average exit premiums increased in all regions in 2011. As in previous years, the US accounted for the highest premiums, at an average of 42.8%, compared to 32% in Europe and 32.5% globally. 2011 was the first year to see an upward trend in exit premiums in the US and Europe since 2008. European average premiums on exits in 2011 were at their highest levels on mergermarket record (since 2001).
Goldman Sachs topped the financial advisor league table for 2011, advising on 41 exit deals valued at US$ 56.4bn. The Carlyle Group sold the most portfolio holdings for the year with 22 exits valued at US$ 11bn. Both companies retained their top positions from 2010.
0%
10%
20%
30%
40%
50%
60%
70%
80%
2004 2005 2006 2007 2008 2009 2010 2011
Prem
ium
%
Exit Premium Analysis - Average
Global
Europe
US
0%
10%
20%
30%
40%
50%
60%
70%
80%
90%
100%
0
10
20
30
40
50
60
70
80
90
100
110
120
130
140
150
Perc
enta
ge o
f Tot
al E
xits
(exc
l. IP
Os)
Valu
e of D
eals
($bn
)
Trade Sales vs SBO Exit Activity - Quarterly
TradeSales(Value)SBOs(Value)TradeSales(%of totalexits)SBOs(%of totalexits)
Top 10 Global private equity firms Y/E 2011 - exits by deal countRanking House Value (US$m) Deal Count
1 The Carlyle Group 10,997 22
2 Equistone Partners Europe 7,453 12
3 Intel Capital 795 12
4 3i Group 506 10
5 New Enterprise Associates 120 10
6 Redpoint Ventures 1,848 9
7 Lloyds TSB Development Capital 104 9
8 Blackstone Group 8,163 8
9 CVC Capital Partners 5,339 8
10 Bain Capital 4,269 8
Press Release: www.mergermarket.com 8Press Release: www.mergermarket.com 8
Global M&A Overview: Private Equity Exits
mergermarket M&A Round-up for Year End 2011
r
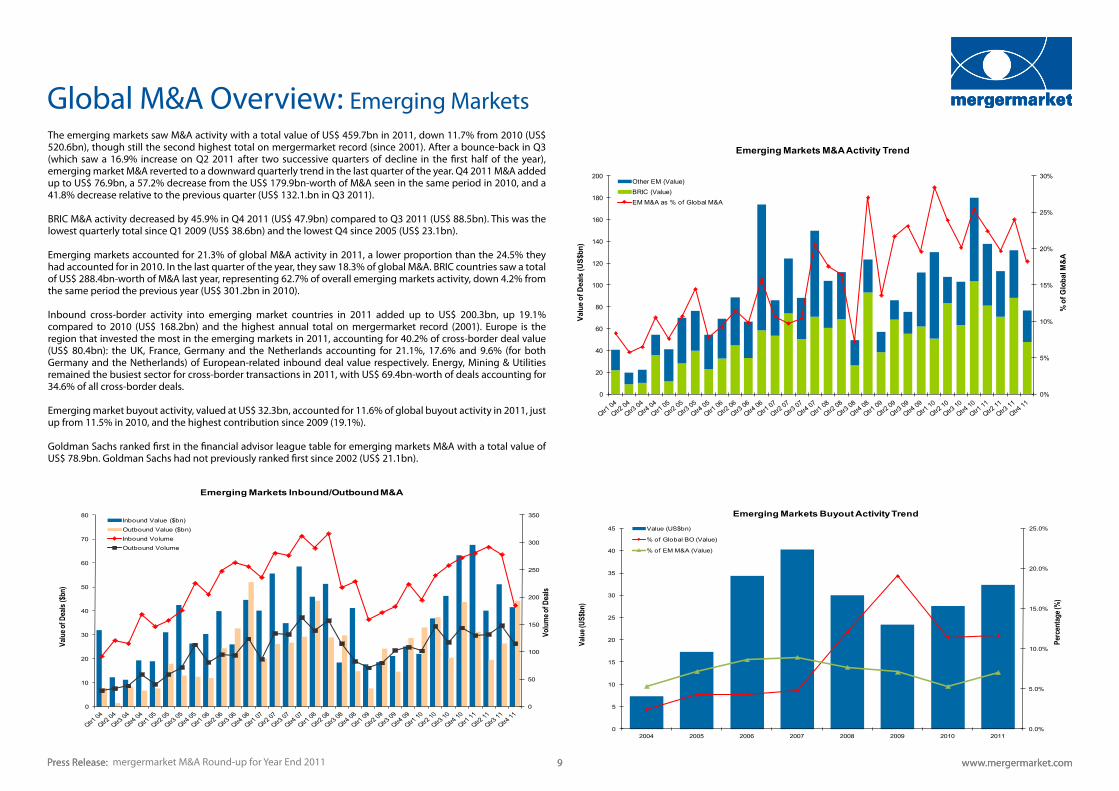
The emerging markets saw M&A activity with a total value of US$ 459.7bn in 2011, down 11.7% from 2010 (US$ 520.6bn), though still the second highest total on mergermarket record (since 2001). After a bounce-back in Q3 (which saw a 16.9% increase on Q2 2011 after two successive quarters of decline in the first half of the year), emerging market M&A reverted to a downward quarterly trend in the last quarter of the year. Q4 2011 M&A added up to US$ 76.9bn, a 57.2% decrease from the US$ 179.9bn-worth of M&A seen in the same period in 2010, and a 41.8% decrease relative to the previous quarter (US$ 132.1.bn in Q3 2011).
BRIC M&A activity decreased by 45.9% in Q4 2011 (US$ 47.9bn) compared to Q3 2011 (US$ 88.5bn). This was the lowest quarterly total since Q1 2009 (US$ 38.6bn) and the lowest Q4 since 2005 (US$ 23.1bn).
Emerging markets accounted for 21.3% of global M&A activity in 2011, a lower proportion than the 24.5% they had accounted for in 2010. In the last quarter of the year, they saw 18.3% of global M&A. BRIC countries saw a total of US$ 288.4bn-worth of M&A last year, representing 62.7% of overall emerging markets activity, down 4.2% from the same period the previous year (US$ 301.2bn in 2010).
Inbound cross-border activity into emerging market countries in 2011 added up to US$ 200.3bn, up 19.1% compared to 2010 (US$ 168.2bn) and the highest annual total on mergermarket record (2001). Europe is the region that invested the most in the emerging markets in 2011, accounting for 40.2% of cross-border deal value (US$ 80.4bn): the UK, France, Germany and the Netherlands accounting for 21.1%, 17.6% and 9.6% (for both Germany and the Netherlands) of European-related inbound deal value respectively. Energy, Mining & Utilities remained the busiest sector for cross-border transactions in 2011, with US$ 69.4bn-worth of deals accounting for 34.6% of all cross-border deals.
Emerging market buyout activity, valued at US$ 32.3bn, accounted for 11.6% of global buyout activity in 2011, just up from 11.5% in 2010, and the highest contribution since 2009 (19.1%).
Goldman Sachs ranked first in the financial advisor league table for emerging markets M&A with a total value of US$ 78.9bn. Goldman Sachs had not previously ranked first since 2002 (US$ 21.1bn).
0%
5%
10%
15%
20%
25%
30%
0
20
40
60
80
100
120
140
160
180
200
% o
f Glo
bal M
&A
Valu
e of D
eals
(US$
bn)
Emerging Markets M&A Activity Trend
OtherEM(Value)BRIC(Value)EMM&Aas%of GlobalM&A
0
50
100
150
200
250
300
350
0
10
20
30
40
50
60
70
80
Volu
me o
f Dea
ls
Valu
e of D
eals
($bn
)
Emerging Markets Inbound/Outbound M&A
InboundValue($bn)OutboundValue($bn)InboundVolumeOutboundVolume
Press Release: www.mergermarket.com 9Press Release: www.mergermarket.com 9
Global M&A Overview: Emerging Markets
mergermarket M&A Round-up for Year End 2011
0.0%
5.0%
10.0%
15.0%
20.0%
25.0%
0
5
10
15
20
25
30
35
40
45
2004 2005 2006 2007 2008 2009 2010 2011
Perc
enta
ge (%
)
Valu
e (US
$bn)
Emerging Markets Buyout Activity TrendValue(US$bn)
%of GlobalBO(Value)
%of EMM&A(Value)
0
5
10
15
20
25
30
2004 2005 2006 2007 2008 2009 2010 2011
EBIT
DA M
ultip
le (x
) -Av
erag
e
EBITDA Multiple Analysis - Average
Global
Europe
NorthAmerica
Asia-Pacif ic(excl.Japan)
Japan
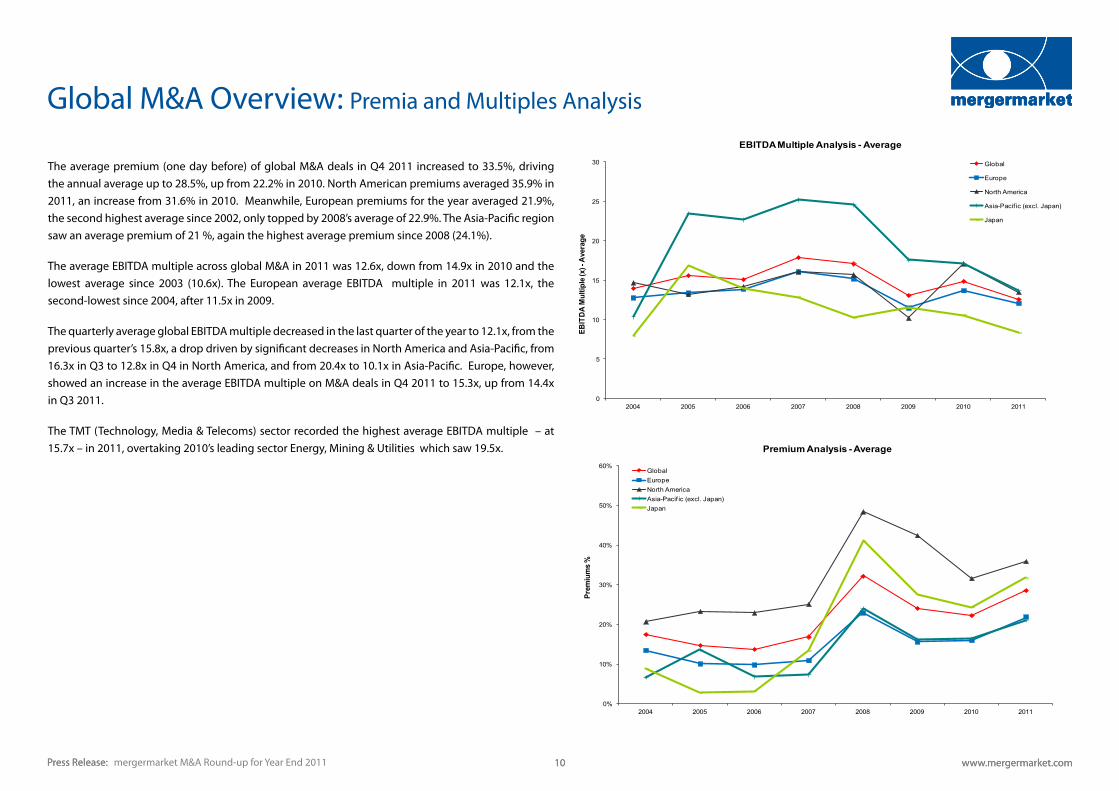
The average premium (one day before) of global M&A deals in Q4 2011 increased to 33.5%, driving the annual average up to 28.5%, up from 22.2% in 2010. North American premiums averaged 35.9% in 2011, an increase from 31.6% in 2010. Meanwhile, European premiums for the year averaged 21.9%, the second highest average since 2002, only topped by 2008’s average of 22.9%. The Asia-Pacific region saw an average premium of 21 %, again the highest average premium since 2008 (24.1%).
The average EBITDA multiple across global M&A in 2011 was 12.6x, down from 14.9x in 2010 and the lowest average since 2003 (10.6x). The European average EBITDA multiple in 2011 was 12.1x, the second-lowest since 2004, after 11.5x in 2009.
The quarterly average global EBITDA multiple decreased in the last quarter of the year to 12.1x, from the previous quarter’s 15.8x, a drop driven by significant decreases in North America and Asia-Pacific, from 16.3x in Q3 to 12.8x in Q4 in North America, and from 20.4x to 10.1x in Asia-Pacific. Europe, however, showed an increase in the average EBITDA multiple on M&A deals in Q4 2011 to 15.3x, up from 14.4x in Q3 2011.
The TMT (Technology, Media & Telecoms) sector recorded the highest average EBITDA multiple – at 15.7x – in 2011, overtaking 2010’s leading sector Energy, Mining & Utilities which saw 19.5x.
0%
10%
20%
30%
40%
50%
60%
2004 2005 2006 2007 2008 2009 2010 2011
Prem
ium
s %
Premium Analysis - Average
GlobalEuropeNorthAmericaAsia-Pacif ic(excl.Japan)Japan
Press Release: www.mergermarket.com 10Press Release: www.mergermarket.com 10 mergermarket M&A Round-up for Year End 2011
Global M&A Overview: Premia and Multiples Analysis
37.7% 41.2% 37.7%46.2%
31.7% 33.2%27.5%
36.2%
6.0%4.1% 10.1%
2.7%
10.9% 5.0%
4.1%
2.7%
1.7%6.6%
8.6%1.4%
2.4%
0.5%1.2%
0.7%
54.5%48.1%
43.6%49.7%
54.9%61.3%
67.1%60.5%
0%
10%
20%
30%
40%
50%
60%
70%
80%
90%
100%
2004 2005 2006 2007 2008 2009 2010 2011
Shar
e of t
otal
Glo
bal M
&A -D
eal V
alue
s
M&A Deal Type - Deal Value
Recommended Hostile Contested Non-public M&A
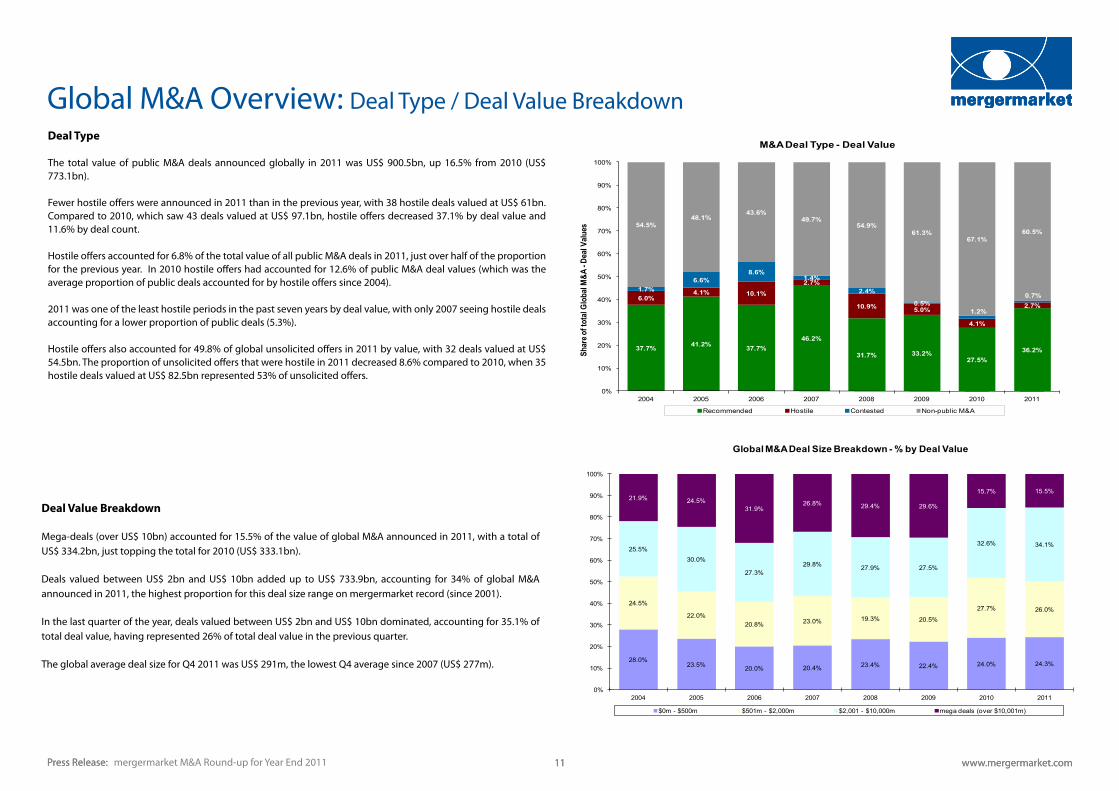
Deal Type
The total value of public M&A deals announced globally in 2011 was US$ 900.5bn, up 16.5% from 2010 (US$ 773.1bn).
Fewer hostile offers were announced in 2011 than in the previous year, with 38 hostile deals valued at US$ 61bn. Compared to 2010, which saw 43 deals valued at US$ 97.1bn, hostile offers decreased 37.1% by deal value and 11.6% by deal count.
Hostile offers accounted for 6.8% of the total value of all public M&A deals in 2011, just over half of the proportion for the previous year. In 2010 hostile offers had accounted for 12.6% of public M&A deal values (which was the average proportion of public deals accounted for by hostile offers since 2004).
2011 was one of the least hostile periods in the past seven years by deal value, with only 2007 seeing hostile deals accounting for a lower proportion of public deals (5.3%).
Hostile offers also accounted for 49.8% of global unsolicited offers in 2011 by value, with 32 deals valued at US$ 54.5bn. The proportion of unsolicited offers that were hostile in 2011 decreased 8.6% compared to 2010, when 35 hostile deals valued at US$ 82.5bn represented 53% of unsolicited offers.
28.0%23.5% 20.0% 20.4% 23.4% 22.4% 24.0% 24.3%
24.5%
22.0%20.8% 23.0% 19.3% 20.5%
27.7% 26.0%
25.5%30.0%
27.3%29.8% 27.9% 27.5%
32.6% 34.1%
21.9% 24.5%31.9%
26.8% 29.4% 29.6%
15.7% 15.5%
0%
10%
20%
30%
40%
50%
60%
70%
80%
90%
100%
2004 2005 2006 2007 2008 2009 2010 2011
Global M&A Deal Size Breakdown - % by Deal Value
$0m- $500m $501m- $2,000m $2,001 - $10,000m megadeals(over$10,001m)
Deal Value Breakdown
Mega-deals (over US$ 10bn) accounted for 15.5% of the value of global M&A announced in 2011, with a total of US$ 334.2bn, just topping the total for 2010 (US$ 333.1bn).
Deals valued between US$ 2bn and US$ 10bn added up to US$ 733.9bn, accounting for 34% of global M&A announced in 2011, the highest proportion for this deal size range on mergermarket record (since 2001).
In the last quarter of the year, deals valued between US$ 2bn and US$ 10bn dominated, accounting for 35.1% of total deal value, having represented 26% of total deal value in the previous quarter.
The global average deal size for Q4 2011 was US$ 291m, the lowest Q4 average since 2007 (US$ 277m).
Press Release: www.mergermarket.com 11Press Release: www.mergermarket.com 11 mergermarket M&A Round-up for Year End 2011
Global M&A Overview: Deal Type / Deal Value Breakdown
57.0% 58.2% 59.1%66.8% 69.8%
55.3%64.2% 65.5%
18.6% 19.2%26.3%
17.8%
23.5%
23.5%
22.5% 20.1%
24.4% 22.7%14.6% 15.4%
6.7%
21.1%13.3% 14.4%
0%
10%
20%
30%
40%
50%
60%
70%
80%
90%
100%
2004 2005 2006 2007 2008 2009 2010 2011
% o
f Glo
bal M
&A
Global Consideration Breakdown - Value %cashonlydeals%equityonlydeals%cash&equitydeals
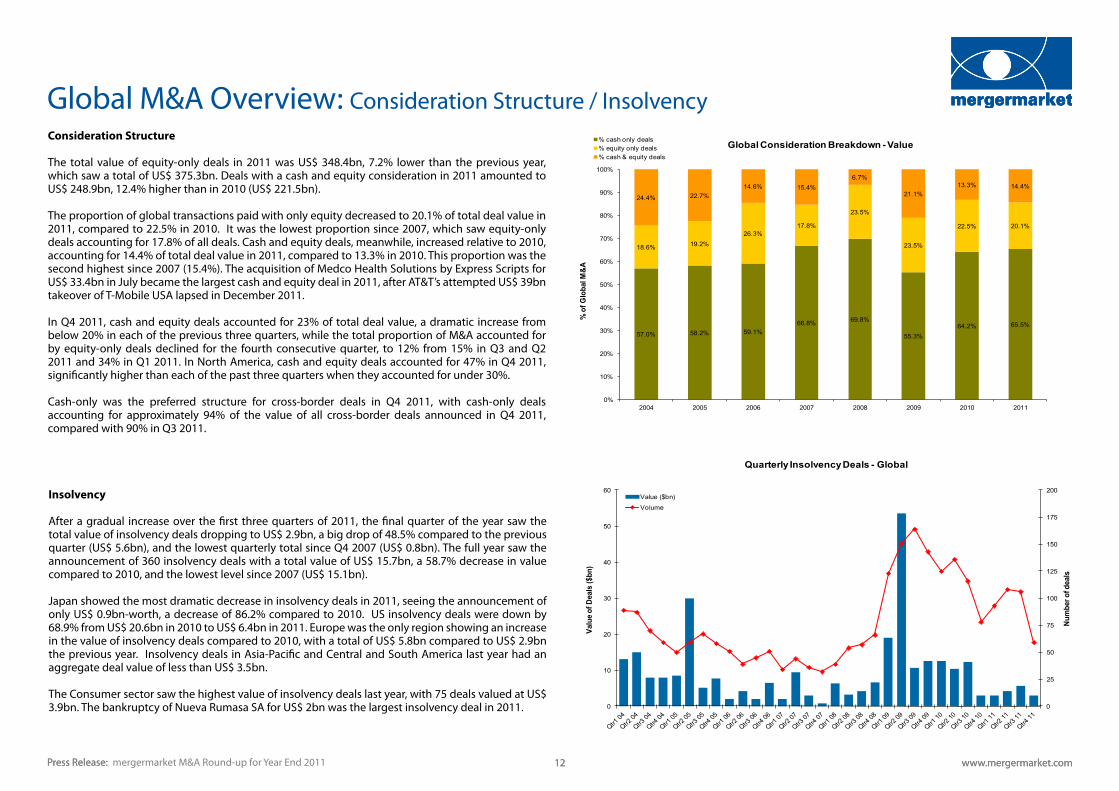
Consideration Structure
The total value of equity-only deals in 2011 was US$ 348.4bn, 7.2% lower than the previous year, which saw a total of US$ 375.3bn. Deals with a cash and equity consideration in 2011 amounted to US$ 248.9bn, 12.4% higher than in 2010 (US$ 221.5bn).
The proportion of global transactions paid with only equity decreased to 20.1% of total deal value in 2011, compared to 22.5% in 2010. It was the lowest proportion since 2007, which saw equity-only deals accounting for 17.8% of all deals. Cash and equity deals, meanwhile, increased relative to 2010, accounting for 14.4% of total deal value in 2011, compared to 13.3% in 2010. This proportion was the second highest since 2007 (15.4%). The acquisition of Medco Health Solutions by Express Scripts for US$ 33.4bn in July became the largest cash and equity deal in 2011, after AT&T’s attempted US$ 39bn takeover of T-Mobile USA lapsed in December 2011.
In Q4 2011, cash and equity deals accounted for 23% of total deal value, a dramatic increase from below 20% in each of the previous three quarters, while the total proportion of M&A accounted for by equity-only deals declined for the fourth consecutive quarter, to 12% from 15% in Q3 and Q2 2011 and 34% in Q1 2011. In North America, cash and equity deals accounted for 47% in Q4 2011, significantly higher than each of the past three quarters when they accounted for under 30%.
Cash-only was the preferred structure for cross-border deals in Q4 2011, with cash-only deals accounting for approximately 94% of the value of all cross-border deals announced in Q4 2011, compared with 90% in Q3 2011.
0
25
50
75
100
125
150
175
200
0
10
20
30
40
50
60
Num
ber o
f dea
ls
Valu
e of D
eals
($bn
)
Quarterly Insolvency Deals - Global
Value($bn)
Volume
Insolvency
After a gradual increase over the first three quarters of 2011, the final quarter of the year saw the total value of insolvency deals dropping to US$ 2.9bn, a big drop of 48.5% compared to the previous quarter (US$ 5.6bn), and the lowest quarterly total since Q4 2007 (US$ 0.8bn). The full year saw the announcement of 360 insolvency deals with a total value of US$ 15.7bn, a 58.7% decrease in value compared to 2010, and the lowest level since 2007 (US$ 15.1bn).
Japan showed the most dramatic decrease in insolvency deals in 2011, seeing the announcement of only US$ 0.9bn-worth, a decrease of 86.2% compared to 2010. US insolvency deals were down by 68.9% from US$ 20.6bn in 2010 to US$ 6.4bn in 2011. Europe was the only region showing an increase in the value of insolvency deals compared to 2010, with a total of US$ 5.8bn compared to US$ 2.9bn the previous year. Insolvency deals in Asia-Pacific and Central and South America last year had an aggregate deal value of less than US$ 3.5bn.
The Consumer sector saw the highest value of insolvency deals last year, with 75 deals valued at US$ 3.9bn. The bankruptcy of Nueva Rumasa SA for US$ 2bn was the largest insolvency deal in 2011.
Press Release: www.mergermarket.com 12Press Release: www.mergermarket.com 12
Global M&A Overview: Consideration Structure / Insolvency
mergermarket M&A Round-up for Year End 2011
0.0%
1.0%
2.0%
3.0%
4.0%
5.0%
6.0%
7.0%
8.0%
9.0%
10.0%
0
50
100
150
200
250
2004 2005 2006 2007 2008 2009 2010 2011
% o
f Glo
bal M
&A
Valu
e of D
eals
(US$
bn)
Global Demerger Activity Trend
RoWValue(US$bn)
Asia-Pacif icValue(US$bn)
EuropeValue(US$bn)
N.AmericaValue(US$bn)
%of GlobalM&Ainvalue
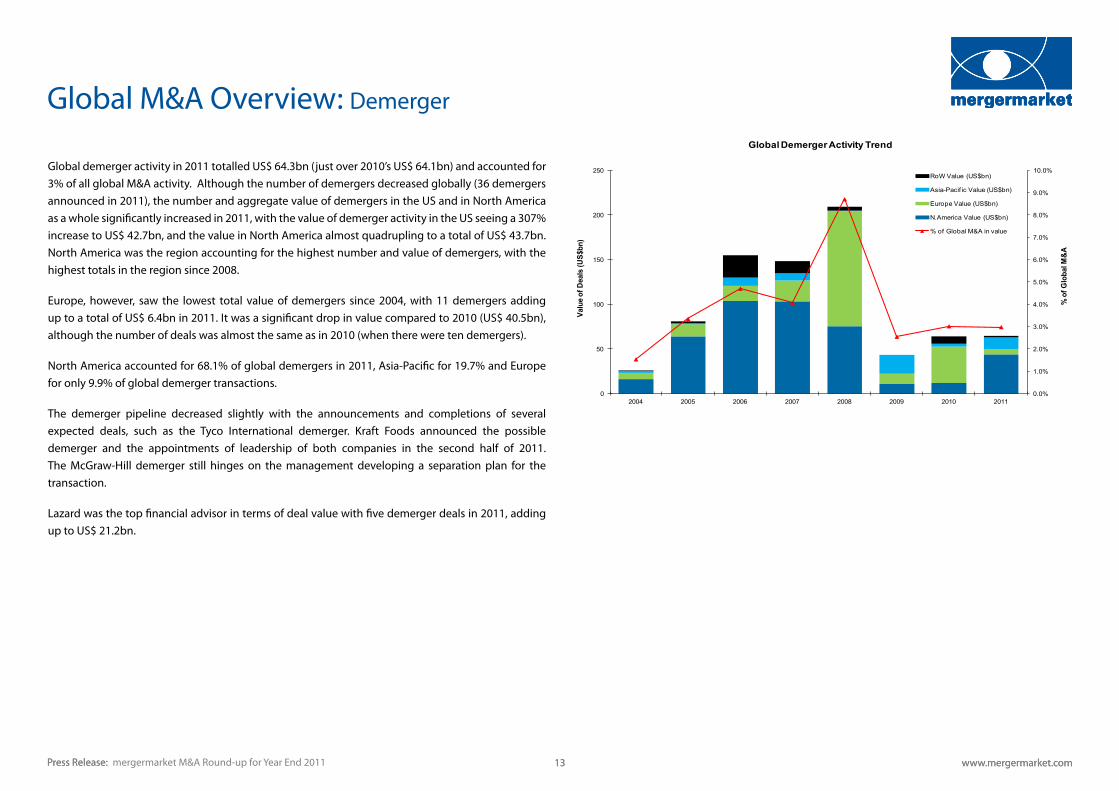
Global demerger activity in 2011 totalled US$ 64.3bn (just over 2010’s US$ 64.1bn) and accounted for 3% of all global M&A activity. Although the number of demergers decreased globally (36 demergers announced in 2011), the number and aggregate value of demergers in the US and in North America as a whole significantly increased in 2011, with the value of demerger activity in the US seeing a 307% increase to US$ 42.7bn, and the value in North America almost quadrupling to a total of US$ 43.7bn. North America was the region accounting for the highest number and value of demergers, with the highest totals in the region since 2008.
Europe, however, saw the lowest total value of demergers since 2004, with 11 demergers adding up to a total of US$ 6.4bn in 2011. It was a significant drop in value compared to 2010 (US$ 40.5bn), although the number of deals was almost the same as in 2010 (when there were ten demergers).
North America accounted for 68.1% of global demergers in 2011, Asia-Pacific for 19.7% and Europe for only 9.9% of global demerger transactions.
The demerger pipeline decreased slightly with the announcements and completions of several expected deals, such as the Tyco International demerger. Kraft Foods announced the possible demerger and the appointments of leadership of both companies in the second half of 2011. The McGraw-Hill demerger still hinges on the management developing a separation plan for the transaction.
Lazard was the top financial advisor in terms of deal value with five demerger deals in 2011, adding up to US$ 21.2bn.
Press Release: www.mergermarket.com 13Press Release: www.mergermarket.com 13
Global M&A Overview: Demerger
mergermarket M&A Round-up for Year End 2011
Press Release: mermergermarket M&A Round-up for Year End 2011www.mergermarket.com 14 www.mergermarket.com 14
Global M&A Overview: League Tables of Financial Advisers
League Table of Financial Advisers to Global M&A: ValueRanking 2011 2010
Y/E 2010 Y/E 2011 HouseValue
(US$m)Deal
CountValue
(US$m)% Value Change
2 1 Goldman Sachs 593,411 309 481,698 23.2%
1 2 Morgan Stanley 451,770 246 492,656 -8.3%
4 3 JPMorgan 441,000 227 363,597 21.3%
3 4 Credit Suisse 356,701 209 435,412 -18.1%
9 5 Barclays Capital 321,417 148 258,482 24.3%
8 6 Bank of America Merrill Lynch 315,788 213 274,311 15.1%
5 7 Citigroup 296,214 170 316,046 -6.3%
6 8 Deutsche Bank 260,684 177 276,497 -5.7%
11 9 Lazard 230,722 180 202,254 14.1%
7 10 UBS Investment Bank 226,506 209 275,583 -17.8%
10 11 Rothschild 139,286 209 215,420 -35.4%
17 12 Evercore Partners 101,939 64 79,211 28.7%
13 13 HSBC 101,595 82 116,520 -12.8%
14 14 SG 84,341 72 111,500 -24.4%
15 15 Nomura Holdings 81,956 119 107,348 -23.7%
12 16 BNP Paribas 80,660 94 135,881 -40.6%
20 17 RBC Capital Markets 70,076 111 58,270 20.3%
52 18 Moelis & Company 56,978 51 17,014 234.9%
26 19 Jefferies & Company 55,297 116 39,389 40.4%
22 20 Perella Weinberg Partners 52,763 20 55,967 -5.7%
League Table of Financial Advisers to Global M&A: VolumeRanking 2011 2010
Y/E 2010 Y/E 2011 Company NameValue
(US$m)Deal
CountDeal
Count Count
Change
2 1 Goldman Sachs 593,411 309 292 17
3 2 KPMG 33,712 254 262 -8
1 3 Morgan Stanley 451,770 246 299 -53
6 4 JPMorgan 441,000 227 219 8
5 5 PwC 16,429 226 242 -16
12 6 Bank of America Merrill Lynch 315,788 213 182 31
4 7 Credit Suisse 356,701 209 249 -40
10 8 UBS Investment Bank 226,506 209 199 10
7 9 Rothschild 139,286 209 219 -10
13 10 Ernst & Young 21,665 186 163 23
9 11 Lazard 230,722 180 206 -26
11 12 Deutsche Bank 260,684 177 188 -11
8 13 Deloitte 17,687 172 218 -46
14 14 Citigroup 296,214 170 153 17
15 15 Barclays Capital 321,417 148 137 11
16 16 Nomura Holdings 81,956 119 111 8
18 17 Jefferies & Company 55,297 116 101 15
17 18 RBC Capital Markets 70,076 111 106 5
23 19 M&A International 2,089 98 81 17
22 20 BNP Paribas 80,660 94 81 13

Press Release: www.mergermarket.com 15Press Release: www.mergermarket.com 15mergermarket M&A Round-up for Year End 2011
Global M&A Overview: League Tables of Financial Advisers
League Table of Financial Advisers to Global Buyouts*: ValueRanking 2011 2010
Y/E 2010 Y/E 2011 HouseValue
(US$m)Deal
CountValue
(US$m)% Value Change
1 1 Barclays Capital 37,164 21 37,572 -1.1%
6 2 Citigroup 33,567 19 19,222 74.6%
3 3 Bank of America Merrill Lynch 29,441 17 29,375 0.2%
7 4 Deutsche Bank 27,736 13 15,569 78.1%
9 5 Goldman Sachs 25,207 27 10,403 142.3%
4 6 Morgan Stanley 24,110 19 23,522 2.5%
14 7 RBC Capital Markets 23,343 23 6,788 243.9%
2 8 Credit Suisse 20,747 20 31,051 -33.2%
73 9 Wells Fargo Securities 18,602 4 410 4,437.1%
8 10 UBS Investment Bank 18,597 14 14,834 25.4%
15 11 Nomura Holdings 16,242 16 6,711 142.0%
17 12 HSBC 11,528 13 5,933 94.3%
187 13 BMO Capital Markets 7,687 5 - -
38 14 Jefferies & Company 7,344 11 1,412 420.1%
19 15 Rothschild 6,926 13 4,593 50.8%
13 16 Lazard 6,341 15 7,384 -14.1%
5 17 JPMorgan 6,203 7 20,967 -70.4%
20 18 Evercore Partners 5,950 3 3,976 49.6%
58 19 Tudor, Pickering, Holt & Co 5,400 1 725 644.8%
37 20 Banca IMI/Intesa Sanpaolo 4,715 7 1,419 232.3%
*Based on the target geography only and the advisor advising the buy-side only.
League Table of Financial Advisers to Global Buyouts*: VolumeRanking 2011 2010
Y/E 2010 Y/E 2011 Company NameValue
(US$m)Deal
CountDeal
Count Count
Change
10 1 Goldman Sachs 25,207 27 17 10
3 2 PwC 1,862 25 31 -6
29 3 RBC Capital Markets 23,343 23 5 18
5 4 Barclays Capital 37,164 21 27 -6
2 5 Credit Suisse 20,747 20 32 -12
4 6 Deloitte 1,572 20 28 -8
9 7 Citigroup 33,567 19 17 2
8 8 Morgan Stanley 24,110 19 23 -4
6 9 Ernst & Young 1,601 19 24 -5
1 10 KPMG 2,073 18 41 -23
7 11 Bank of America Merrill Lynch 29,441 17 23 -6
23 12 Grant Thornton Corporate Finance 224 17 9 8
12 13 Nomura Holdings 16,242 16 15 1
19 14 Lazard 6,341 15 10 5
20 15 UBS Investment Bank 18,597 14 9 5
13 16 Deutsche Bank 27,736 13 14 -1
16 17 HSBC 11,528 13 11 2
11 18 Rothschild 6,926 13 16 -3
17 19 DC Advisory Partners 2,326 12 11 1
35 20 Jefferies & Company 7,344 11 4 7

0
100
200
300
400
500
600
700
800
900
1,000
1,100
1,200
1,300
1,400
1,500
1,600
1,700
1,800
0
50
100
150
200
250
300
350
400
450
500
550
600
Volu
me o
f Dea
ls
Valu
e of D
eals
(US$
bn)
European M&A Activity - Quarterly
Value(US$bn)
Volume
0
25
50
75
100
125
150
175
200
225
250
275
300
0
10
20
30
40
50
60
70
80
90
100
110
120
130
140
150
Volu
me o
f Dea
ls
Valu
e of D
eals
($bn
)
European Inbound/Outbound M&A
InboundValue($bn)OutboundValue($bn)InboundVolumeOutboundVolume
In line with the global trend, European M&A decreased - in terms of both deal value and number of deals - over the second half of 2011, and the decline in Europe was more pronounced than in other major regions. Q4 2011 saw US$ 116.3bn-worth of deals, a 28.7% decrease from the previous quarter (US$ 163.1bn in Q3), and a 52.4% decrease from the same period the previous year (US$ 244.3bn). The second half of 2011 saw US$ 279.4bn-worth of deals, a total M&A value 33.2% lower than the first half (which saw US$ 418.5bn-worth).
The majority of the larger European countries showed a decline of 50% or more in M&A activity by value in Q4 2011 compared to the previous quarter. Whilst this was not unexpected in some of these countries (such as Ireland down 95% to US$ 820m, Spain down 61.6% to US$ 8.6bn and UK down 44.6% to US$ 21.4bn) due to the current market conditions, some other decreases were more surprising with Russia down by 31.3% (to US$ 13.7bn), Germany by 48.5% (to US$ 4.5bn), Turkey by 13.3% (to US$ 2.6bn) and Poland by 26.3% (to US$ 2.9bn).
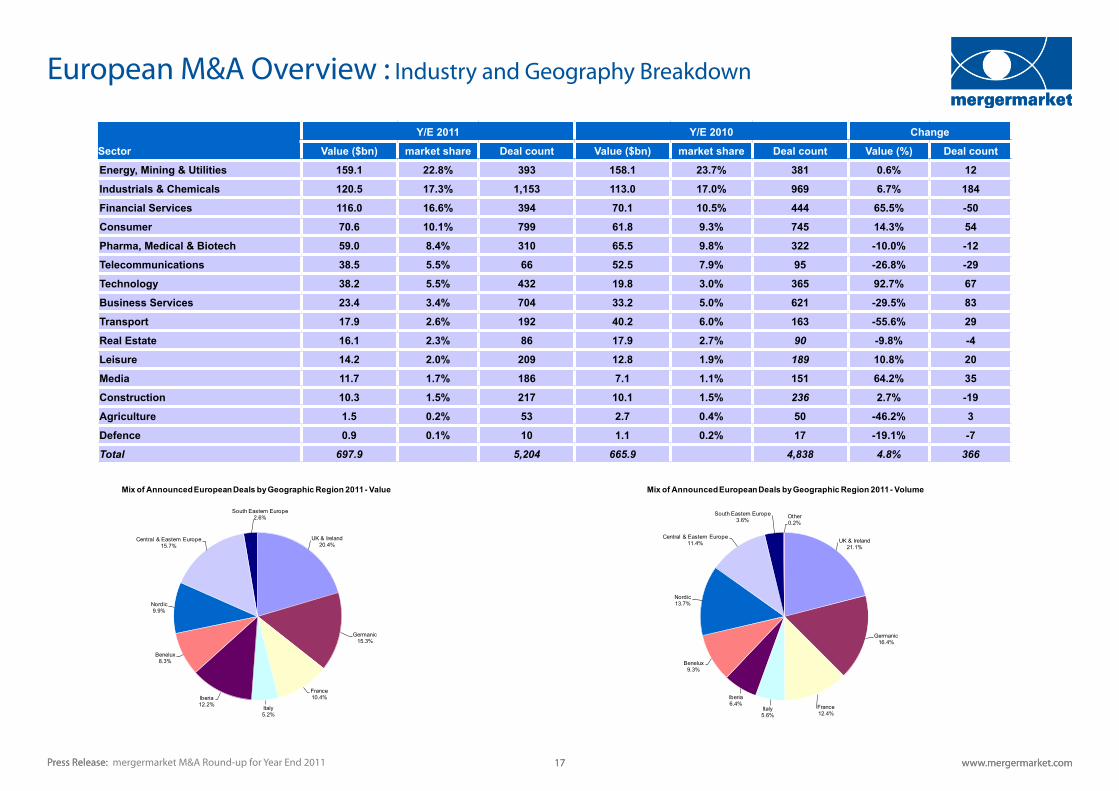
Europe finished the year with a higher total M&A value than 2010, a total of US$ 697.9bn for the year compared to US$ 665.9bn for 2010.
Northern Europe, and a few of the Western European countries, had a better year for M&A in 2011 than in 2010, during which the Nordic countries saw a 70.8% increase to US$ 69bn-worth of deals. France, Ireland, Spain and Poland saw similar jumps of 47.9% (to US$ 71.7bn), 57.4% (to US$ 20.5bn), 169.3% (to US$ 81.2bn) and 88.1% (to US$ 22.7bn) respectively. The poor M&A totals in H2 2011, however, affected many other European countries with Portugal down 16.3% (to US$ 3.8bn), Austria 69.6% (to US$ 3.9bn), Italy 54.3% (to US$ 36bn), Turkey 43.6% (to US$ 12.6bn), the Netherlands and Belgium both down around 40% (to US$ 18.9bn and US$ 19.5bn respectively) and Greece down 30.5% (to US$ 3.4bn).
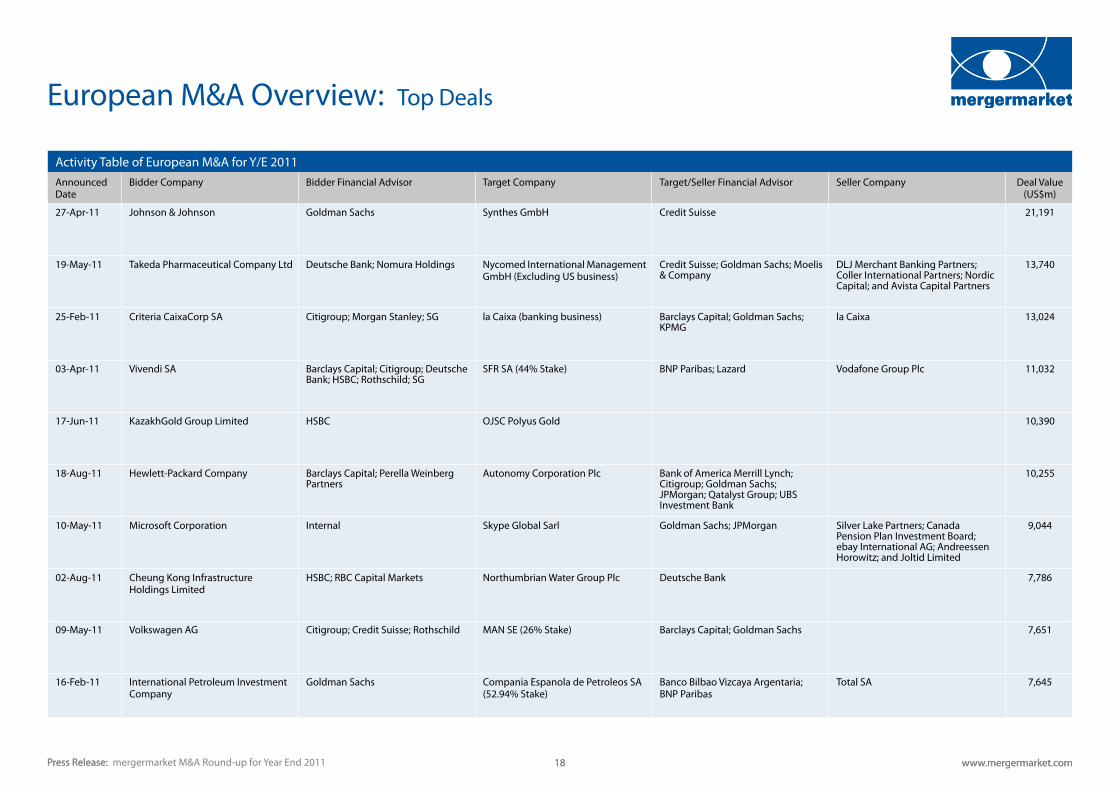
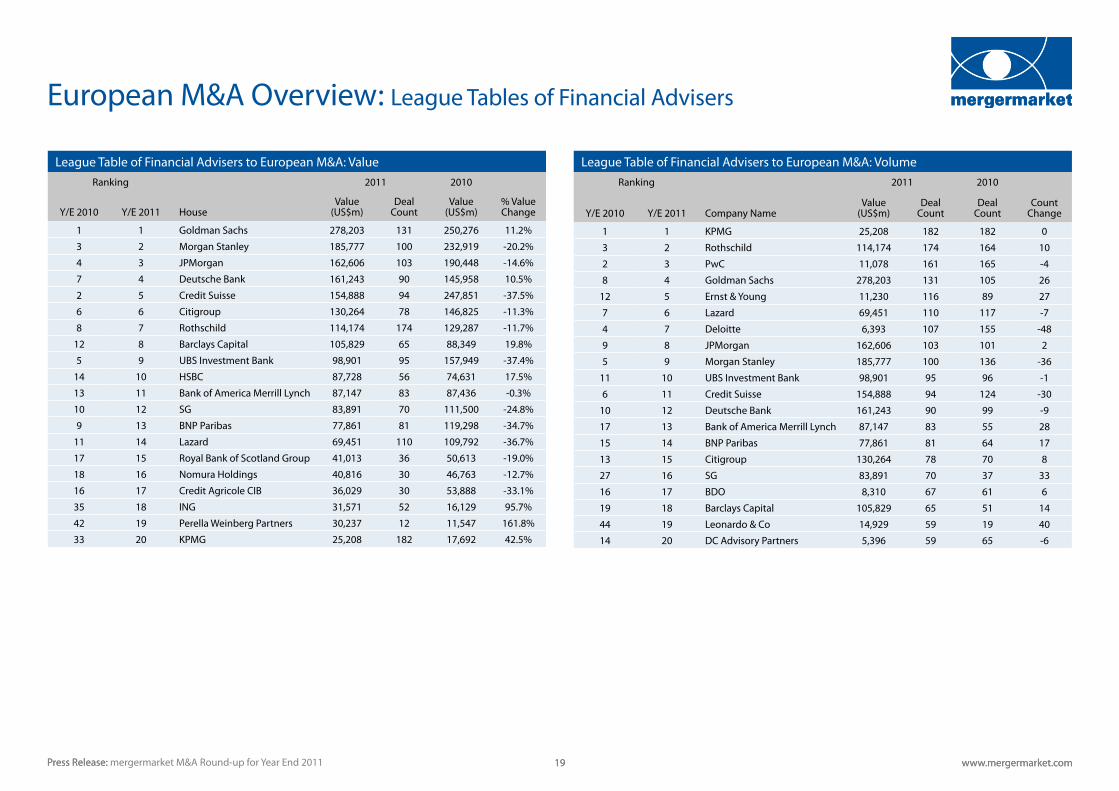
Goldman Sachs and Morgan Stanley held onto their top rankings in the European M&A financial advisory tables by total deal value. Goldman Sachs worked on seven of the ten largest deals in Europe for 2011.
0
25
50
75
100
125
150
175
200
225
250
275
300
325
350
375
400
0
10
20
30
40
50
60
70
80
90
100
110
120
130
Volu
me o
f Dea
ls
Valu
e of D
eals
(US$
bn)
European Private Equity Buyout Activity - Quarterly
Value(US$bn)
Volume
Press Release: www.mergermarket.com 16Press Release: www.mergermarket.com 16
European M&A Overview
mergermarket M&A Round-up for Year End 2011
Press Release: www.mergermarket.com 17Press Release: www.mergermarket.com 17mergermarket M&A Round-up for Year End 2011
European M&A Overview : Industry and Geography Breakdown
UK&Ireland20.4%
Germanic15.3%
France10.4%
Italy5.2%
Iberia12.2%
Benelux8.3%
Nordic9.9%
Central & Eastern Europe15.7%
South Eastern Europe2.6%
Mix of Announced European Deals by Geographic Region 2011 - Value
UK&Ireland21.1%
Germanic16.4%
France12.4%
Italy5.6%
Iberia6.4%
Benelux9.3%
Nordic13.7%
Central & Eastern Europe11.4%
South Eastern Europe3.6%
Other0.2%
Mix of Announced European Deals by Geographic Region 2011 - Volume
Y/E 2011 Y/E 2010 Change
Sector Value ($bn) market share Deal count Value ($bn) market share Deal count Value (%) Deal count
Energy, Mining & Utilities 159.1 22.8% 393 158.1 23.7% 381 0.6% 12
Industrials & Chemicals 120.5 17.3% 1,153 113.0 17.0% 969 6.7% 184
Financial Services 116.0 16.6% 394 70.1 10.5% 444 65.5% -50
Consumer 70.6 10.1% 799 61.8 9.3% 745 14.3% 54
Pharma, Medical & Biotech 59.0 8.4% 310 65.5 9.8% 322 -10.0% -12
Telecommunications 38.5 5.5% 66 52.5 7.9% 95 -26.8% -29
Technology 38.2 5.5% 432 19.8 3.0% 365 92.7% 67
Business Services 23.4 3.4% 704 33.2 5.0% 621 -29.5% 83
Transport 17.9 2.6% 192 40.2 6.0% 163 -55.6% 29
Real Estate 16.1 2.3% 86 17.9 2.7% 90 -9.8% -4
Leisure 14.2 2.0% 209 12.8 1.9% 189 10.8% 20
Media 11.7 1.7% 186 7.1 1.1% 151 64.2% 35
Construction 10.3 1.5% 217 10.1 1.5% 236 2.7% -19
Agriculture 1.5 0.2% 53 2.7 0.4% 50 -46.2% 3
Defence 0.9 0.1% 10 1.1 0.2% 17 -19.1% -7
Total 697.9 5,204 665.9 4,838 4.8% 366
Press Release: www.mergermarket.com 18Press Release: www.mergermarket.com 18mergermarket M&A Round-up for Year End 2011
European M&A Overview: Top Deals
Activity Table of European M&A for Y/E 2011Announced Date
Bidder Company Bidder Financial Advisor Target Company Target/Seller Financial Advisor Seller Company Deal Value (US$m)
27-Apr-11 Johnson & Johnson Goldman Sachs Synthes GmbH Credit Suisse 21,191
19-May-11 Takeda Pharmaceutical Company Ltd Deutsche Bank; Nomura Holdings Nycomed International Management GmbH (Excluding US business)
Credit Suisse; Goldman Sachs; Moelis & Company
DLJ Merchant Banking Partners; Coller International Partners; Nordic Capital; and Avista Capital Partners
13,740
25-Feb-11 Criteria CaixaCorp SA Citigroup; Morgan Stanley; SG la Caixa (banking business) Barclays Capital; Goldman Sachs; KPMG
la Caixa 13,024
03-Apr-11 Vivendi SA Barclays Capital; Citigroup; Deutsche Bank; HSBC; Rothschild; SG
SFR SA (44% Stake) BNP Paribas; Lazard Vodafone Group Plc 11,032
17-Jun-11 KazakhGold Group Limited HSBC OJSC Polyus Gold 10,390
18-Aug-11 Hewlett-Packard Company Barclays Capital; Perella Weinberg Partners
Autonomy Corporation Plc Bank of America Merrill Lynch; Citigroup; Goldman Sachs; JPMorgan; Qatalyst Group; UBS Investment Bank
10,255
10-May-11 Microsoft Corporation Internal Skype Global Sarl Goldman Sachs; JPMorgan Silver Lake Partners; Canada Pension Plan Investment Board; ebay International AG; Andreessen Horowitz; and Joltid Limited
9,044
02-Aug-11 Cheung Kong Infrastructure Holdings Limited
HSBC; RBC Capital Markets Northumbrian Water Group Plc Deutsche Bank 7,786
09-May-11 Volkswagen AG Citigroup; Credit Suisse; Rothschild MAN SE (26% Stake) Barclays Capital; Goldman Sachs 7,651
16-Feb-11 International Petroleum Investment Company
Goldman Sachs Compania Espanola de Petroleos SA (52.94% Stake)
Banco Bilbao Vizcaya Argentaria; BNP Paribas
Total SA 7,645
Press Release: www.mergermarket.com 19Press Release: mergermarket M&A Round-up for Year End 2011 www.mergermarket.com 19
European M&A Overview: League Tables of Financial Advisers
League Table of Financial Advisers to European M&A: ValueRanking 2011 2010
Y/E 2010 Y/E 2011 HouseValue
(US$m)Deal
CountValue
(US$m)% Value Change
1 1 Goldman Sachs 278,203 131 250,276 11.2%
3 2 Morgan Stanley 185,777 100 232,919 -20.2%
4 3 JPMorgan 162,606 103 190,448 -14.6%
7 4 Deutsche Bank 161,243 90 145,958 10.5%
2 5 Credit Suisse 154,888 94 247,851 -37.5%
6 6 Citigroup 130,264 78 146,825 -11.3%
8 7 Rothschild 114,174 174 129,287 -11.7%
12 8 Barclays Capital 105,829 65 88,349 19.8%
5 9 UBS Investment Bank 98,901 95 157,949 -37.4%
14 10 HSBC 87,728 56 74,631 17.5%
13 11 Bank of America Merrill Lynch 87,147 83 87,436 -0.3%
10 12 SG 83,891 70 111,500 -24.8%
9 13 BNP Paribas 77,861 81 119,298 -34.7%
11 14 Lazard 69,451 110 109,792 -36.7%
17 15 Royal Bank of Scotland Group 41,013 36 50,613 -19.0%
18 16 Nomura Holdings 40,816 30 46,763 -12.7%
16 17 Credit Agricole CIB 36,029 30 53,888 -33.1%
35 18 ING 31,571 52 16,129 95.7%
42 19 Perella Weinberg Partners 30,237 12 11,547 161.8%
33 20 KPMG 25,208 182 17,692 42.5%
League Table of Financial Advisers to European M&A: VolumeRanking 2011 2010
Y/E 2010 Y/E 2011 Company NameValue
(US$m)Deal
CountDeal
Count Count
Change
1 1 KPMG 25,208 182 182 0
3 2 Rothschild 114,174 174 164 10
2 3 PwC 11,078 161 165 -4
8 4 Goldman Sachs 278,203 131 105 26
12 5 Ernst & Young 11,230 116 89 27
7 6 Lazard 69,451 110 117 -7
4 7 Deloitte 6,393 107 155 -48
9 8 JPMorgan 162,606 103 101 2
5 9 Morgan Stanley 185,777 100 136 -36
11 10 UBS Investment Bank 98,901 95 96 -1
6 11 Credit Suisse 154,888 94 124 -30
10 12 Deutsche Bank 161,243 90 99 -9
17 13 Bank of America Merrill Lynch 87,147 83 55 28
15 14 BNP Paribas 77,861 81 64 17
13 15 Citigroup 130,264 78 70 8
27 16 SG 83,891 70 37 33
16 17 BDO 8,310 67 61 6
19 18 Barclays Capital 105,829 65 51 14
44 19 Leonardo & Co 14,929 59 19 40
14 20 DC Advisory Partners 5,396 59 65 -6
Press Release: www.mergermarket.com 20Press Release: mergermarket M&A Round-up for Year End 2011 www.mergermarket.com 20
European M&A Overview: League Tables of Financial Advisers
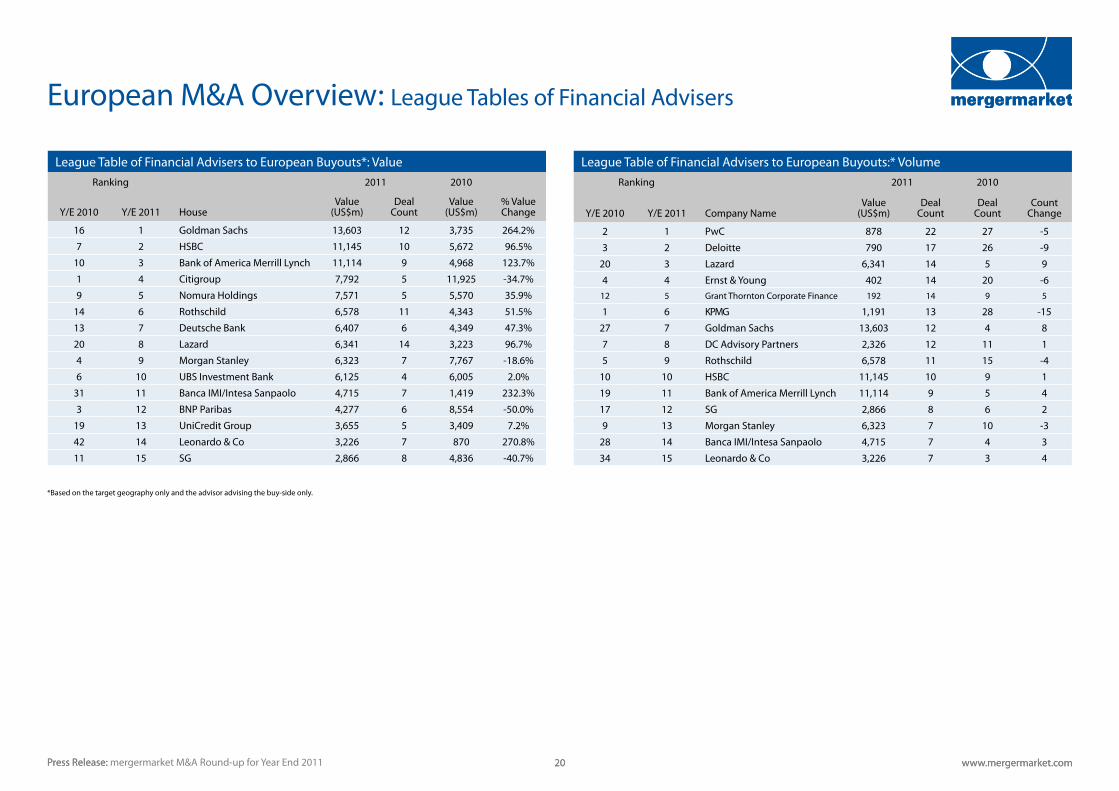
League Table of Financial Advisers to European Buyouts*: ValueRanking 2011 2010
Y/E 2010 Y/E 2011 HouseValue
(US$m)Deal
CountValue
(US$m)% Value Change
16 1 Goldman Sachs 13,603 12 3,735 264.2%
7 2 HSBC 11,145 10 5,672 96.5%
10 3 Bank of America Merrill Lynch 11,114 9 4,968 123.7%
1 4 Citigroup 7,792 5 11,925 -34.7%
9 5 Nomura Holdings 7,571 5 5,570 35.9%
14 6 Rothschild 6,578 11 4,343 51.5%
13 7 Deutsche Bank 6,407 6 4,349 47.3%
20 8 Lazard 6,341 14 3,223 96.7%
4 9 Morgan Stanley 6,323 7 7,767 -18.6%
6 10 UBS Investment Bank 6,125 4 6,005 2.0%
31 11 Banca IMI/Intesa Sanpaolo 4,715 7 1,419 232.3%
3 12 BNP Paribas 4,277 6 8,554 -50.0%
19 13 UniCredit Group 3,655 5 3,409 7.2%
42 14 Leonardo & Co 3,226 7 870 270.8%
11 15 SG 2,866 8 4,836 -40.7%
*Based on the target geography only and the advisor advising the buy-side only.
League Table of Financial Advisers to European Buyouts:* VolumeRanking 2011 2010
Y/E 2010 Y/E 2011 Company NameValue
(US$m)Deal
CountDeal
Count Count
Change
2 1 PwC 878 22 27 -5
3 2 Deloitte 790 17 26 -9
20 3 Lazard 6,341 14 5 9
4 4 Ernst & Young 402 14 20 -612 5 Grant Thornton Corporate Finance 192 14 9 5
1 6 KPMG 1,191 13 28 -15
27 7 Goldman Sachs 13,603 12 4 8
7 8 DC Advisory Partners 2,326 12 11 1
5 9 Rothschild 6,578 11 15 -4
10 10 HSBC 11,145 10 9 1
19 11 Bank of America Merrill Lynch 11,114 9 5 4
17 12 SG 2,866 8 6 2
9 13 Morgan Stanley 6,323 7 10 -3
28 14 Banca IMI/Intesa Sanpaolo 4,715 7 4 3
34 15 Leonardo & Co 3,226 7 3 4

Press Release: www.mergermarket.com 21Press Release: www.mergermarket.com 21mergermarket M&A Round-up for Year End 2011
European M&A Overview: League Tables of Financial AdvisersFinancial Advisers to UK M&A: Value
Ranking 2011 2010
Y/E 2010 Y/E 2011 HouseValue
(US$m)Deal
CountValue
(US$m)% Value Change
4 1 Goldman Sachs 102,904 55 79,268 29.8%
1 2 JPMorgan Cazenove 68,341 43 109,624 -37.7%
3 3 Morgan Stanley 55,268 32 79,275 -30.3%
7 4 Citigroup 53,471 33 52,134 2.6%
6 5 UBS Investment Bank 52,198 36 62,423 -16.4%
8 6 Barclays Capital 49,047 27 51,285 -4.4%
10 7 Deutsche Bank 45,748 24 47,627 -3.9%
2 8 Rothschild 39,987 69 82,187 -51.4%
11 9 Bank of America Merrill Lynch 38,530 31 43,651 -11.7%
5 10 Credit Suisse 32,471 31 63,540 -48.9%
12 11 HSBC 31,529 20 43,051 -26.8%
15 12 Lazard 24,937 34 28,874 -13.6%
21 13 Royal Bank of Scotland Group 20,839 13 16,659 25.1%
14 14 SG 18,438 16 31,491 -41.4%
19 15 RBC Capital Markets 17,618 17 23,022 -23.5%
Financial Advisers to French M&A: ValueRanking 2011 2010
Y/E 2010 Y/E 2011 HouseValue
(US$m)Deal
CountValue
(US$m)% Value Change
3 1 BNP Paribas 46,818 44 64,692 -27.6%
7 2 HSBC 38,172 26 52,054 -26.7%
6 3 Rothschild 36,525 54 52,828 -30.9%
2 4 SG 34,586 43 65,945 -47.6%
14 5 Barclays Capital 29,044 12 23,079 25.8%
1 6 Morgan Stanley 28,975 19 73,806 -60.7%
15 7 Lazard 28,224 35 20,978 34.5%
4 8 Goldman Sachs 27,333 19 56,784 -51.9%
11 9 Deutsche Bank 26,807 15 27,338 -1.9%
8 10 Credit Suisse 26,460 17 48,891 -45.9%
17 11 Credit Agricole CIB 25,753 24 16,874 52.6%
22 12 Citigroup 19,342 10 9,624 101.0%
27 13 Bank of America Merrill Lynch 14,928 13 2,049 628.6%
18 14 UBS Investment Bank 10,204 14 16,771 -39.2%
25 15 Hawkpoint 9,858 11 4,568 115.8%
Financial Advisers to UK M&A: Volume
Ranking 2011 2010
Y/E 2010 Y/E 2011 Company NameValue
(US$m)Deal
CountDeal
Count Count
Change
1 1 Rothschild 39,987 69 81 -12
4 2 KPMG 5,028 66 53 13
9 3 Goldman Sachs 102,904 55 44 11
7 4 PwC 6,055 49 49 0
2 5 JPMorgan Cazenove 68,341 43 55 -12
6 6 Deloitte 1,450 39 51 -12
5 7 UBS Investment Bank 52,198 36 52 -16
12 8 Grant Thornton Corporate Finance 784 36 33 3
8 9 Lazard 24,937 34 47 -13
11 10 Citigroup 53,471 33 37 -4
16 11 Ernst & Young 4,695 33 29 4
10 12 Morgan Stanley 55,268 32 43 -11
18 13 BDO 2,124 32 27 5
13 14 Bank of America Merrill Lynch 38,530 31 32 -1
3 15 Credit Suisse 32,471 31 53 -22
Financial Advisers to French M&A: VolumeRanking 2011 2010
Y/E 2010 Y/E 2011 Company NameValue
(US$m)Deal
CountDeal
Count Count
Change
1 1 Rothschild 36,525 54 54 0
2 2 BNP Paribas 46,818 44 36 8
5 3 SG 34,586 43 25 18
3 4 Lazard 28,224 35 28 7
20 5 Leonardo & Co 7,694 35 9 26
6 6 PwC 2,920 28 23 5
15 7 HSBC 38,172 26 11 15
4 8 Credit Agricole CIB 25,753 24 28 -4
7 9 Morgan Stanley 28,975 19 19 0
17 10 Goldman Sachs 27,333 19 10 9
10 11 Credit Suisse 26,460 17 15 2
9 12 Deutsche Bank 26,807 15 18 -3
33 13 Bryan, Garnier & Co 1,240 15 6 9
8 14 DC Advisory Partners 964 15 19 -4
23 15 UBS Investment Bank 10,204 14 8 6
Press Release: www.mergermarket.com 22Press Release: www.mergermarket.com 22mergermarket M&A Round-up for Year End 2011
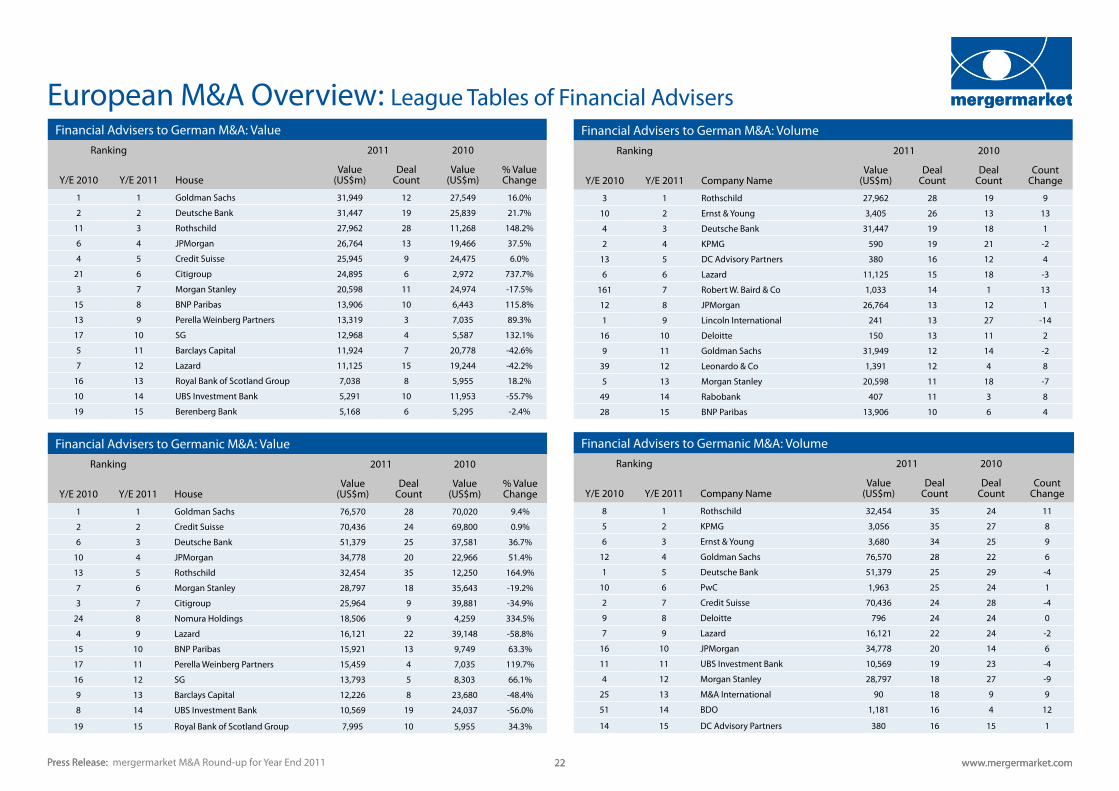
European M&A Overview: League Tables of Financial AdvisersFinancial Advisers to German M&A: Value
Ranking 2011 2010
Y/E 2010 Y/E 2011 HouseValue
(US$m)Deal
CountValue
(US$m)% Value Change
1 1 Goldman Sachs 31,949 12 27,549 16.0%
2 2 Deutsche Bank 31,447 19 25,839 21.7%
11 3 Rothschild 27,962 28 11,268 148.2%
6 4 JPMorgan 26,764 13 19,466 37.5%
4 5 Credit Suisse 25,945 9 24,475 6.0%
21 6 Citigroup 24,895 6 2,972 737.7%
3 7 Morgan Stanley 20,598 11 24,974 -17.5%
15 8 BNP Paribas 13,906 10 6,443 115.8%
13 9 Perella Weinberg Partners 13,319 3 7,035 89.3%
17 10 SG 12,968 4 5,587 132.1%
5 11 Barclays Capital 11,924 7 20,778 -42.6%
7 12 Lazard 11,125 15 19,244 -42.2%
16 13 Royal Bank of Scotland Group 7,038 8 5,955 18.2%
10 14 UBS Investment Bank 5,291 10 11,953 -55.7%
19 15 Berenberg Bank 5,168 6 5,295 -2.4%
Financial Advisers to Germanic M&A: ValueRanking 2011 2010
Y/E 2010 Y/E 2011 HouseValue
(US$m)Deal
CountValue
(US$m)% Value Change
1 1 Goldman Sachs 76,570 28 70,020 9.4%
2 2 Credit Suisse 70,436 24 69,800 0.9%
6 3 Deutsche Bank 51,379 25 37,581 36.7%
10 4 JPMorgan 34,778 20 22,966 51.4%
13 5 Rothschild 32,454 35 12,250 164.9%
7 6 Morgan Stanley 28,797 18 35,643 -19.2%
3 7 Citigroup 25,964 9 39,881 -34.9%
24 8 Nomura Holdings 18,506 9 4,259 334.5%
4 9 Lazard 16,121 22 39,148 -58.8%
15 10 BNP Paribas 15,921 13 9,749 63.3%
17 11 Perella Weinberg Partners 15,459 4 7,035 119.7%
16 12 SG 13,793 5 8,303 66.1%
9 13 Barclays Capital 12,226 8 23,680 -48.4%
8 14 UBS Investment Bank 10,569 19 24,037 -56.0%
19 15 Royal Bank of Scotland Group 7,995 10 5,955 34.3%
Financial Advisers to German M&A: VolumeRanking 2011 2010
Y/E 2010 Y/E 2011 Company NameValue
(US$m)Deal
CountDeal
Count Count
Change
3 1 Rothschild 27,962 28 19 9
10 2 Ernst & Young 3,405 26 13 13
4 3 Deutsche Bank 31,447 19 18 1
2 4 KPMG 590 19 21 -2
13 5 DC Advisory Partners 380 16 12 4
6 6 Lazard 11,125 15 18 -3
161 7 Robert W. Baird & Co 1,033 14 1 13
12 8 JPMorgan 26,764 13 12 1
1 9 Lincoln International 241 13 27 -14
16 10 Deloitte 150 13 11 2
9 11 Goldman Sachs 31,949 12 14 -2
39 12 Leonardo & Co 1,391 12 4 8
5 13 Morgan Stanley 20,598 11 18 -7
49 14 Rabobank 407 11 3 8
28 15 BNP Paribas 13,906 10 6 4
Financial Advisers to Germanic M&A: VolumeRanking 2011 2010
Y/E 2010 Y/E 2011 Company NameValue
(US$m)Deal
CountDeal
Count Count
Change
8 1 Rothschild 32,454 35 24 11
5 2 KPMG 3,056 35 27 8
6 3 Ernst & Young 3,680 34 25 9
12 4 Goldman Sachs 76,570 28 22 6
1 5 Deutsche Bank 51,379 25 29 -4
10 6 PwC 1,963 25 24 1
2 7 Credit Suisse 70,436 24 28 -4
9 8 Deloitte 796 24 24 0
7 9 Lazard 16,121 22 24 -2
16 10 JPMorgan 34,778 20 14 6
11 11 UBS Investment Bank 10,569 19 23 -4
4 12 Morgan Stanley 28,797 18 27 -9
25 13 M&A International 90 18 9 9
51 14 BDO 1,181 16 4 12
14 15 DC Advisory Partners 380 16 15 1

Press Release: www.mergermarket.com 23Press Release: mergermarket M&A Round-up for Year End 2011 www.mergermarket.com 23
European M&A Overview: League Tables of Financial AdvisersFinancial Advisers to Benelux M&A: Value
Ranking 2011 2010
Y/E 2010 Y/E 2011 HouseValue
(US$m)Deal
CountValue
(US$m)% Value Change
3 1 JPMorgan 31,568 18 45,683 -30.9%
1 2 Goldman Sachs 30,533 14 67,101 -54.5%
2 3 Morgan Stanley 25,303 13 59,976 -57.8%
7 4 UBS Investment Bank 25,207 18 31,943 -21.1%
10 5 Deutsche Bank 21,242 14 28,966 -26.7%
18 6 ING 17,486 37 14,329 22.0%
9 7 BNP Paribas 14,588 19 29,069 -49.8%
4 8 Credit Suisse 11,469 12 45,200 -74.6%
21 9 Barclays Capital 11,317 7 7,357 53.8%
20 10 Bank of America Merrill Lynch 10,676 14 8,796 21.4%
- 11 Centerview Partners 9,000 1 - -
13 12 HSBC 6,446 2 27,442 -76.5%
11 13 Lazard 6,409 14 28,624 -77.6%
24 14 Leonardo & Co 6,250 21 4,906 27.4%
8 15 SG 6,206 3 30,671 -79.8%
Financial Advisers to Italian M&A: ValueRanking 2011 2010
Y/E 2010 Y/E 2011 HouseValue
(US$m)Deal
CountValue
(US$m)% Value Change
10 1 Credit Agricole CIB 11,436 4 24,540 -53.4%
5 2 Banca IMI/Intesa Sanpaolo 10,043 24 29,720 -66.2%
12 3 SG 9,736 10 23,539 -58.6%
6 4 UniCredit Group 9,661 19 28,257 -65.8%
27 5 HSBC 8,180 5 592 1,281.8%
17 6 Rothschild 8,108 21 3,558 127.9%
11 7 Lazard 7,560 14 24,306 -68.9%
3 8 Deutsche Bank 7,119 6 39,775 -82.1%
1 9 Credit Suisse 6,897 3 47,968 -85.6%
25 10 Bank of America Merrill Lynch 6,774 9 864 684.0%
4 11 Goldman Sachs 6,424 4 39,559 -83.8%
16 12 Mediobanca 6,324 23 7,652 -17.4%
7 13 Morgan Stanley 5,358 10 26,150 -79.5%
9 14 BNP Paribas 4,765 9 24,606 -80.6%
18 15 Leonardo & Co 4,704 11 2,830 66.2%
Financial Advisers to Benelux M&A: VolumeRanking 2011 2010
Y/E 2010 Y/E 2011 Company NameValue
(US$m)Deal
CountDeal
Count Count
Change
1 1 KPMG 1,747 57 46 11
3 2 ING 17,486 37 31 6
4 3 PwC 4,030 26 23 3
17 4 Leonardo & Co 6,250 21 10 11
2 5 Rabobank 3,397 20 40 -20
19 6 BNP Paribas 14,588 19 9 10
9 7 JPMorgan 31,568 18 15 3
10 8 UBS Investment Bank 25,207 18 15 3
8 9 Deloitte 1,041 18 18 0
14 10 Boer & Croon 17 17 13 4
6 11 Rothschild 3,378 15 19 -4
5 12 Goldman Sachs 30,533 14 19 -5
15 13 Deutsche Bank 21,242 14 11 3
22 14 Bank of America Merrill Lynch 10,676 14 8 6
11 15 Lazard 6,409 14 14 0
Financial Advisers to Italian M&A: VolumeRanking 2011 2010
Y/E 2010 Y/E 2011 Company NameValue
(US$m)Deal
CountDeal
Count Count
Change
2 1 Banca IMI/Intesa Sanpaolo 10,043 24 20 4
1 2 Mediobanca 6,324 23 21 2
5 3 Rothschild 8,108 21 12 9
3 4 UniCredit Group 9,661 19 20 -1
7 5 KPMG 1,256 16 10 6
4 6 Lazard 7,560 14 14 0
22 7 Leonardo & Co 4,704 11 3 8
40 8 SG 9,736 10 1 9
8 9 Morgan Stanley 5,358 10 9 1
45 10 Bank of America Merrill Lynch 6,774 9 1 8
10 11 BNP Paribas 4,765 9 8 1
19 12 Vitale & Associati 800 7 4 3
9 13 Deutsche Bank 7,119 6 8 -2
17 14 Deloitte 347 6 5 1
16 15 Fineurop Soditic 96 6 5 1
Press Release: www.mergermarket.com 24Pre: www.mergermarket.com 24mergermarket M&A Round-up for Year End 2011
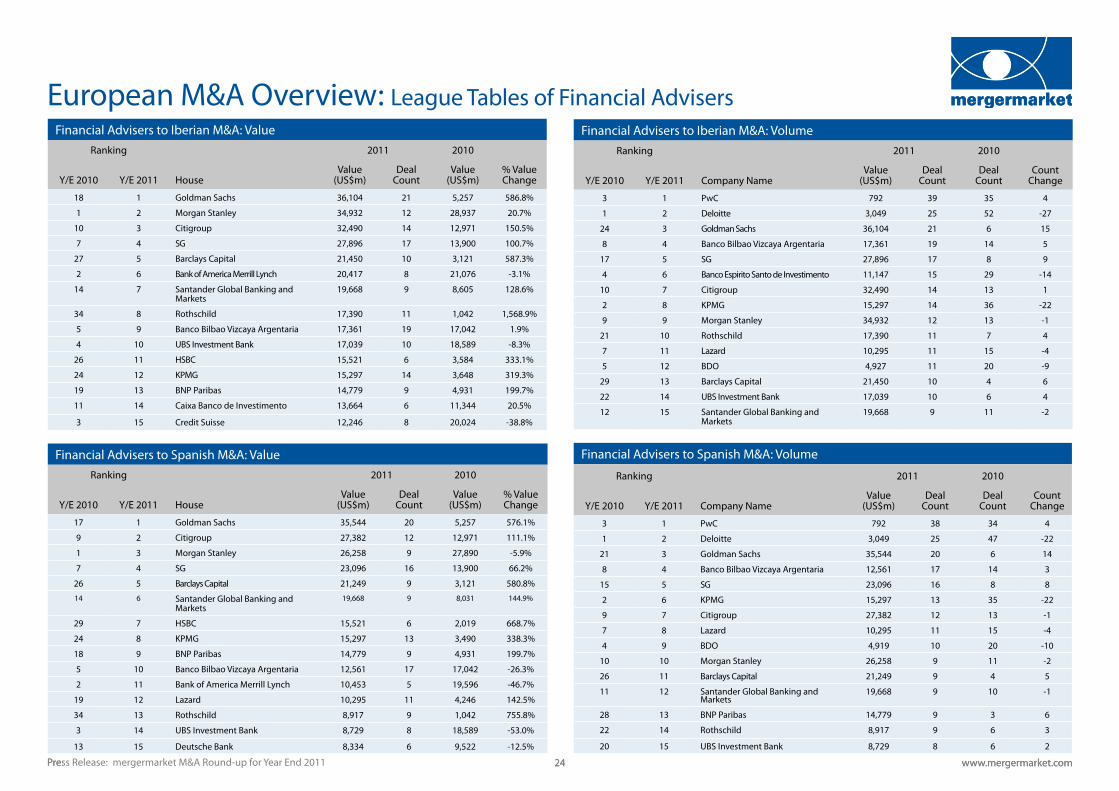
European M&A Overview: League Tables of Financial AdvisersFinancial Advisers to Iberian M&A: Value
Ranking 2011 2010
Y/E 2010 Y/E 2011 HouseValue
(US$m)Deal
CountValue
(US$m)% Value Change
18 1 Goldman Sachs 36,104 21 5,257 586.8%
1 2 Morgan Stanley 34,932 12 28,937 20.7%
10 3 Citigroup 32,490 14 12,971 150.5%
7 4 SG 27,896 17 13,900 100.7%
27 5 Barclays Capital 21,450 10 3,121 587.3%
2 6 Bank of America Merrill Lynch 20,417 8 21,076 -3.1%
14 7 Santander Global Banking and Markets
19,668 9 8,605 128.6%
34 8 Rothschild 17,390 11 1,042 1,568.9%
5 9 Banco Bilbao Vizcaya Argentaria 17,361 19 17,042 1.9%
4 10 UBS Investment Bank 17,039 10 18,589 -8.3%
26 11 HSBC 15,521 6 3,584 333.1%
24 12 KPMG 15,297 14 3,648 319.3%
19 13 BNP Paribas 14,779 9 4,931 199.7%
11 14 Caixa Banco de Investimento 13,664 6 11,344 20.5%
3 15 Credit Suisse 12,246 8 20,024 -38.8%
Financial Advisers to Spanish M&A: ValueRanking 2011 2010
Y/E 2010 Y/E 2011 HouseValue
(US$m)Deal
CountValue
(US$m)% Value Change
17 1 Goldman Sachs 35,544 20 5,257 576.1%
9 2 Citigroup 27,382 12 12,971 111.1%
1 3 Morgan Stanley 26,258 9 27,890 -5.9%
7 4 SG 23,096 16 13,900 66.2%
26 5 Barclays Capital 21,249 9 3,121 580.8%
14 6 Santander Global Banking and Markets
19,668 9 8,031 144.9%
29 7 HSBC 15,521 6 2,019 668.7%
24 8 KPMG 15,297 13 3,490 338.3%
18 9 BNP Paribas 14,779 9 4,931 199.7%
5 10 Banco Bilbao Vizcaya Argentaria 12,561 17 17,042 -26.3%
2 11 Bank of America Merrill Lynch 10,453 5 19,596 -46.7%
19 12 Lazard 10,295 11 4,246 142.5%
34 13 Rothschild 8,917 9 1,042 755.8%
3 14 UBS Investment Bank 8,729 8 18,589 -53.0%
13 15 Deutsche Bank 8,334 6 9,522 -12.5%
Financial Advisers to Iberian M&A: VolumeRanking 2011 2010
Y/E 2010 Y/E 2011 Company NameValue
(US$m)Deal
CountDeal
Count Count
Change
3 1 PwC 792 39 35 4
1 2 Deloitte 3,049 25 52 -27
24 3 Goldman Sachs 36,104 21 6 15
8 4 Banco Bilbao Vizcaya Argentaria 17,361 19 14 5
17 5 SG 27,896 17 8 9
4 6 Banco Espirito Santo de Investimento 11,147 15 29 -14
10 7 Citigroup 32,490 14 13 1
2 8 KPMG 15,297 14 36 -22
9 9 Morgan Stanley 34,932 12 13 -1
21 10 Rothschild 17,390 11 7 4
7 11 Lazard 10,295 11 15 -4
5 12 BDO 4,927 11 20 -9
29 13 Barclays Capital 21,450 10 4 6
22 14 UBS Investment Bank 17,039 10 6 4
12 15 Santander Global Banking and Markets
19,668 9 11 -2
Financial Advisers to Spanish M&A: Volume
Ranking 2011 2010
Y/E 2010 Y/E 2011 Company NameValue
(US$m)Deal
CountDeal
Count Count
Change
3 1 PwC 792 38 34 4
1 2 Deloitte 3,049 25 47 -22
21 3 Goldman Sachs 35,544 20 6 14
8 4 Banco Bilbao Vizcaya Argentaria 12,561 17 14 3
15 5 SG 23,096 16 8 8
2 6 KPMG 15,297 13 35 -22
9 7 Citigroup 27,382 12 13 -1
7 8 Lazard 10,295 11 15 -4
4 9 BDO 4,919 10 20 -10
10 10 Morgan Stanley 26,258 9 11 -2
26 11 Barclays Capital 21,249 9 4 5
11 12 Santander Global Banking and Markets
19,668 9 10 -1
28 13 BNP Paribas 14,779 9 3 6
22 14 Rothschild 8,917 9 6 3
20 15 UBS Investment Bank 8,729 8 6 2
Press Release: www.mergermarket.com 25Press Release: www.mergermarket.com 25mergermarket M&A Round-up for Year End 2011
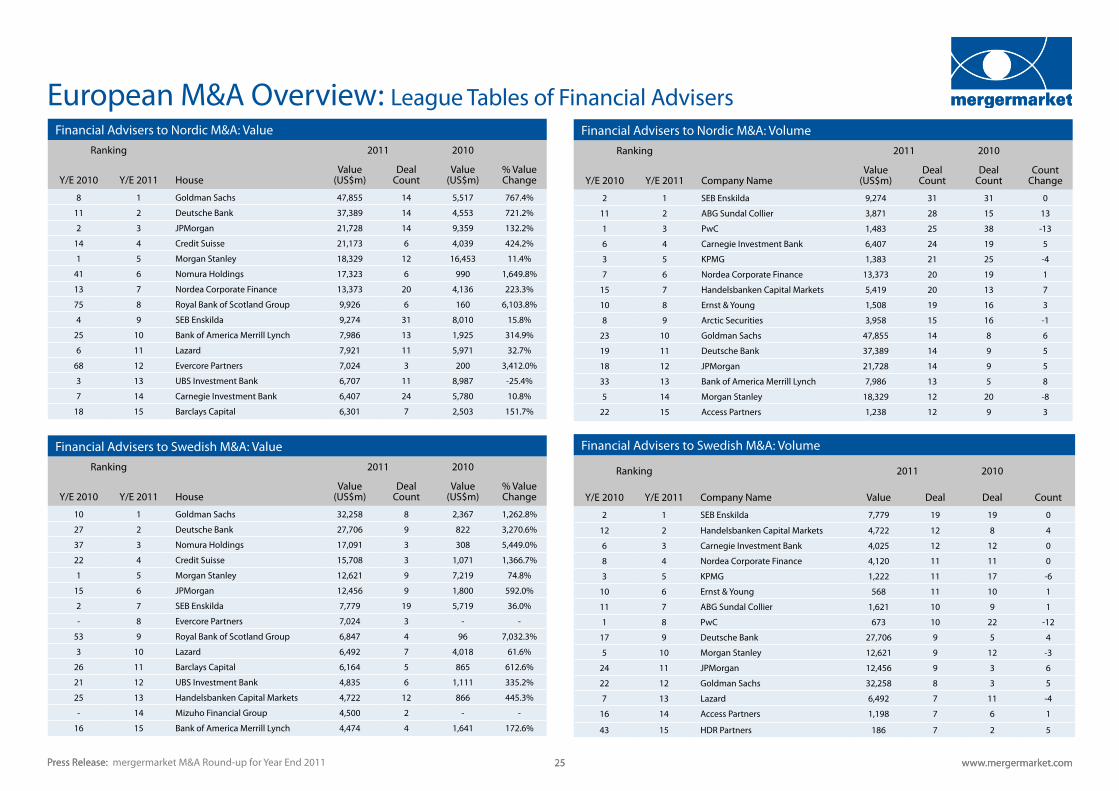
European M&A Overview: League Tables of Financial AdvisersFinancial Advisers to Nordic M&A: Value
Ranking 2011 2010
Y/E 2010 Y/E 2011 HouseValue
(US$m)Deal
CountValue
(US$m)% Value Change
8 1 Goldman Sachs 47,855 14 5,517 767.4%
11 2 Deutsche Bank 37,389 14 4,553 721.2%
2 3 JPMorgan 21,728 14 9,359 132.2%
14 4 Credit Suisse 21,173 6 4,039 424.2%
1 5 Morgan Stanley 18,329 12 16,453 11.4%
41 6 Nomura Holdings 17,323 6 990 1,649.8%
13 7 Nordea Corporate Finance 13,373 20 4,136 223.3%
75 8 Royal Bank of Scotland Group 9,926 6 160 6,103.8%
4 9 SEB Enskilda 9,274 31 8,010 15.8%
25 10 Bank of America Merrill Lynch 7,986 13 1,925 314.9%
6 11 Lazard 7,921 11 5,971 32.7%
68 12 Evercore Partners 7,024 3 200 3,412.0%
3 13 UBS Investment Bank 6,707 11 8,987 -25.4%
7 14 Carnegie Investment Bank 6,407 24 5,780 10.8%
18 15 Barclays Capital 6,301 7 2,503 151.7%
Financial Advisers to Nordic M&A: VolumeRanking 2011 2010
Y/E 2010 Y/E 2011 Company NameValue
(US$m)Deal
CountDeal
Count Count
Change
2 1 SEB Enskilda 9,274 31 31 0
11 2 ABG Sundal Collier 3,871 28 15 13
1 3 PwC 1,483 25 38 -13
6 4 Carnegie Investment Bank 6,407 24 19 5
3 5 KPMG 1,383 21 25 -4
7 6 Nordea Corporate Finance 13,373 20 19 1
15 7 Handelsbanken Capital Markets 5,419 20 13 7
10 8 Ernst & Young 1,508 19 16 3
8 9 Arctic Securities 3,958 15 16 -1
23 10 Goldman Sachs 47,855 14 8 6
19 11 Deutsche Bank 37,389 14 9 5
18 12 JPMorgan 21,728 14 9 5
33 13 Bank of America Merrill Lynch 7,986 13 5 8
5 14 Morgan Stanley 18,329 12 20 -8
22 15 Access Partners 1,238 12 9 3
Financial Advisers to Swedish M&A: Volume
Ranking 2011 2010
Y/E 2010 Y/E 2011 Company Name Value Deal Deal Count
2 1 SEB Enskilda 7,779 19 19 0
12 2 Handelsbanken Capital Markets 4,722 12 8 4
6 3 Carnegie Investment Bank 4,025 12 12 0
8 4 Nordea Corporate Finance 4,120 11 11 0
3 5 KPMG 1,222 11 17 -6
10 6 Ernst & Young 568 11 10 1
11 7 ABG Sundal Collier 1,621 10 9 1
1 8 PwC 673 10 22 -12
17 9 Deutsche Bank 27,706 9 5 4
5 10 Morgan Stanley 12,621 9 12 -3
24 11 JPMorgan 12,456 9 3 6
22 12 Goldman Sachs 32,258 8 3 5
7 13 Lazard 6,492 7 11 -4
16 14 Access Partners 1,198 7 6 1
43 15 HDR Partners 186 7 2 5
Financial Advisers to Swedish M&A: ValueRanking 2011 2010
Y/E 2010 Y/E 2011 HouseValue
(US$m)Deal
CountValue
(US$m)% Value Change
10 1 Goldman Sachs 32,258 8 2,367 1,262.8%
27 2 Deutsche Bank 27,706 9 822 3,270.6%
37 3 Nomura Holdings 17,091 3 308 5,449.0%
22 4 Credit Suisse 15,708 3 1,071 1,366.7%
1 5 Morgan Stanley 12,621 9 7,219 74.8%
15 6 JPMorgan 12,456 9 1,800 592.0%
2 7 SEB Enskilda 7,779 19 5,719 36.0%
- 8 Evercore Partners 7,024 3 - -
53 9 Royal Bank of Scotland Group 6,847 4 96 7,032.3%
3 10 Lazard 6,492 7 4,018 61.6%
26 11 Barclays Capital 6,164 5 865 612.6%
21 12 UBS Investment Bank 4,835 6 1,111 335.2%
25 13 Handelsbanken Capital Markets 4,722 12 866 445.3%
- 14 Mizuho Financial Group 4,500 2 - -
16 15 Bank of America Merrill Lynch 4,474 4 1,641 172.6%
Press Release: mergermarket M&A Round-up for Year End 2011 www.mergermarket.com 26 www.mergermarket.com 26
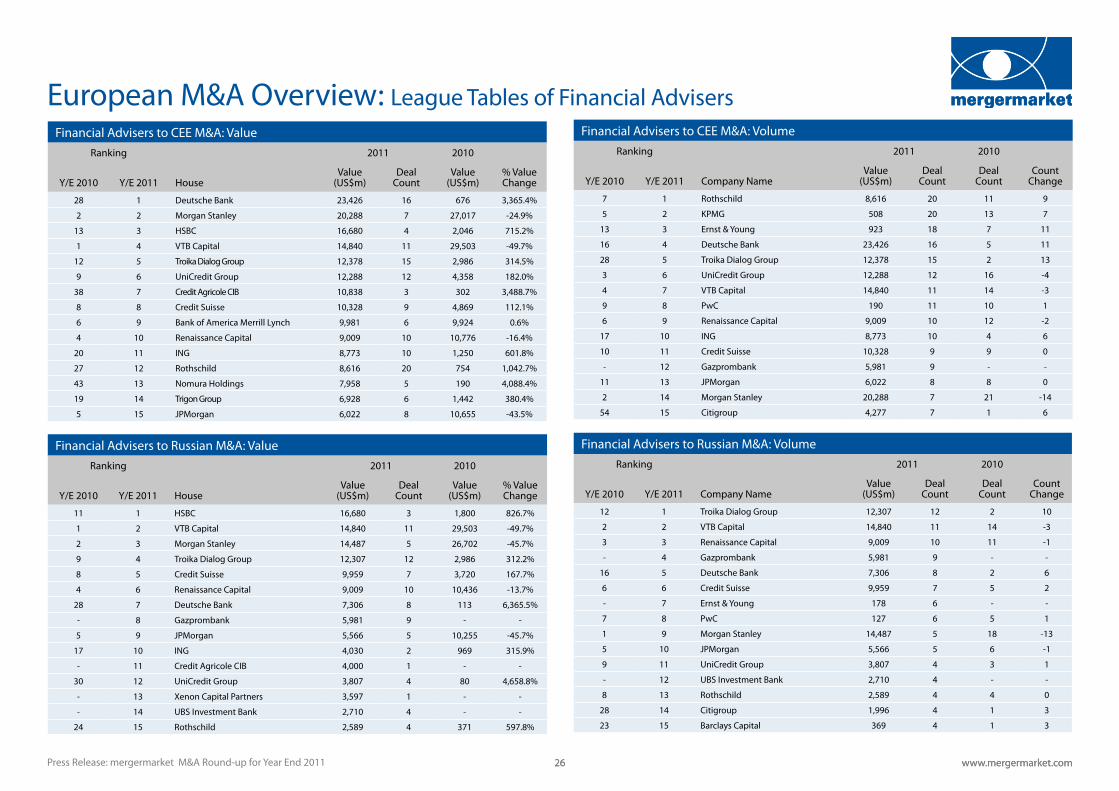
European M&A Overview: League Tables of Financial AdvisersFinancial Advisers to CEE M&A: Volume
Ranking 2011 2010
Y/E 2010 Y/E 2011 Company NameValue
(US$m)Deal
CountDeal
Count Count
Change
7 1 Rothschild 8,616 20 11 9
5 2 KPMG 508 20 13 7
13 3 Ernst & Young 923 18 7 11
16 4 Deutsche Bank 23,426 16 5 11
28 5 Troika Dialog Group 12,378 15 2 13
3 6 UniCredit Group 12,288 12 16 -4
4 7 VTB Capital 14,840 11 14 -3
9 8 PwC 190 11 10 1
6 9 Renaissance Capital 9,009 10 12 -2
17 10 ING 8,773 10 4 6
10 11 Credit Suisse 10,328 9 9 0
- 12 Gazprombank 5,981 9 - -
11 13 JPMorgan 6,022 8 8 0
2 14 Morgan Stanley 20,288 7 21 -14
54 15 Citigroup 4,277 7 1 6
Financial Advisers to Russian M&A: VolumeRanking 2011 2010
Y/E 2010 Y/E 2011 Company NameValue
(US$m)Deal
CountDeal
Count Count
Change
12 1 Troika Dialog Group 12,307 12 2 10
2 2 VTB Capital 14,840 11 14 -3
3 3 Renaissance Capital 9,009 10 11 -1
- 4 Gazprombank 5,981 9 - -
16 5 Deutsche Bank 7,306 8 2 6
6 6 Credit Suisse 9,959 7 5 2
- 7 Ernst & Young 178 6 - -
7 8 PwC 127 6 5 1
1 9 Morgan Stanley 14,487 5 18 -13
5 10 JPMorgan 5,566 5 6 -1
9 11 UniCredit Group 3,807 4 3 1
- 12 UBS Investment Bank 2,710 4 - -
8 13 Rothschild 2,589 4 4 0
28 14 Citigroup 1,996 4 1 3
23 15 Barclays Capital 369 4 1 3
Financial Advisers to CEE M&A: ValueRanking 2011 2010
Y/E 2010 Y/E 2011 HouseValue
(US$m)Deal
CountValue
(US$m)% Value Change
28 1 Deutsche Bank 23,426 16 676 3,365.4%
2 2 Morgan Stanley 20,288 7 27,017 -24.9%
13 3 HSBC 16,680 4 2,046 715.2%
1 4 VTB Capital 14,840 11 29,503 -49.7%
12 5 Troika Dialog Group 12,378 15 2,986 314.5%
9 6 UniCredit Group 12,288 12 4,358 182.0%
38 7 Credit Agricole CIB 10,838 3 302 3,488.7%
8 8 Credit Suisse 10,328 9 4,869 112.1%
6 9 Bank of America Merrill Lynch 9,981 6 9,924 0.6%
4 10 Renaissance Capital 9,009 10 10,776 -16.4%
20 11 ING 8,773 10 1,250 601.8%
27 12 Rothschild 8,616 20 754 1,042.7%
43 13 Nomura Holdings 7,958 5 190 4,088.4%
19 14 Trigon Group 6,928 6 1,442 380.4%
5 15 JPMorgan 6,022 8 10,655 -43.5%
Financial Advisers to Russian M&A: ValueRanking 2011 2010
Y/E 2010 Y/E 2011 HouseValue
(US$m)Deal
CountValue
(US$m)% Value Change
11 1 HSBC 16,680 3 1,800 826.7%
1 2 VTB Capital 14,840 11 29,503 -49.7%
2 3 Morgan Stanley 14,487 5 26,702 -45.7%
9 4 Troika Dialog Group 12,307 12 2,986 312.2%
8 5 Credit Suisse 9,959 7 3,720 167.7%
4 6 Renaissance Capital 9,009 10 10,436 -13.7%
28 7 Deutsche Bank 7,306 8 113 6,365.5%
- 8 Gazprombank 5,981 9 - -
5 9 JPMorgan 5,566 5 10,255 -45.7%
17 10 ING 4,030 2 969 315.9%
- 11 Credit Agricole CIB 4,000 1 - -
30 12 UniCredit Group 3,807 4 80 4,658.8%
- 13 Xenon Capital Partners 3,597 1 - -
- 14 UBS Investment Bank 2,710 4 - -
24 15 Rothschild 2,589 4 371 597.8%
Press Release: www.mergermarket.com 27Press Release: www.mergermarket.com 27mergermarket M&A Round-up for Year End 2011
European M&A Overview: League Tables of Financial Advisers
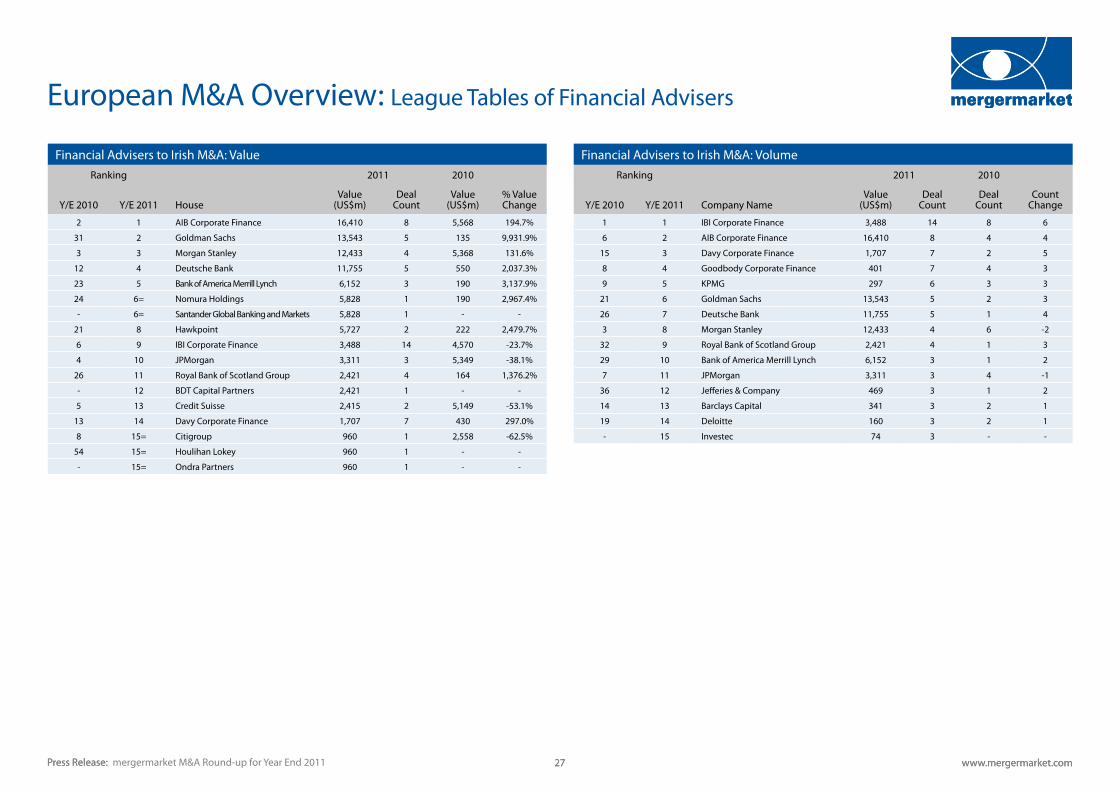
Financial Advisers to Irish M&A: ValueRanking 2011 2010
Y/E 2010 Y/E 2011 HouseValue
(US$m)Deal
CountValue
(US$m)% Value Change
2 1 AIB Corporate Finance 16,410 8 5,568 194.7%
31 2 Goldman Sachs 13,543 5 135 9,931.9%
3 3 Morgan Stanley 12,433 4 5,368 131.6%
12 4 Deutsche Bank 11,755 5 550 2,037.3%
23 5 Bank of America Merrill Lynch 6,152 3 190 3,137.9%
24 6= Nomura Holdings 5,828 1 190 2,967.4%
- 6= Santander Global Banking and Markets 5,828 1 - -
21 8 Hawkpoint 5,727 2 222 2,479.7%
6 9 IBI Corporate Finance 3,488 14 4,570 -23.7%
4 10 JPMorgan 3,311 3 5,349 -38.1%
26 11 Royal Bank of Scotland Group 2,421 4 164 1,376.2%
- 12 BDT Capital Partners 2,421 1 - -
5 13 Credit Suisse 2,415 2 5,149 -53.1%
13 14 Davy Corporate Finance 1,707 7 430 297.0%
8 15= Citigroup 960 1 2,558 -62.5%
54 15= Houlihan Lokey 960 1 - -
- 15= Ondra Partners 960 1 - -
Financial Advisers to Irish M&A: VolumeRanking 2011 2010
Y/E 2010 Y/E 2011 Company NameValue
(US$m)Deal
CountDeal
Count Count
Change
1 1 IBI Corporate Finance 3,488 14 8 6
6 2 AIB Corporate Finance 16,410 8 4 4
15 3 Davy Corporate Finance 1,707 7 2 5
8 4 Goodbody Corporate Finance 401 7 4 3
9 5 KPMG 297 6 3 3
21 6 Goldman Sachs 13,543 5 2 3
26 7 Deutsche Bank 11,755 5 1 4
3 8 Morgan Stanley 12,433 4 6 -2
32 9 Royal Bank of Scotland Group 2,421 4 1 3
29 10 Bank of America Merrill Lynch 6,152 3 1 2
7 11 JPMorgan 3,311 3 4 -1
36 12 Jefferies & Company 469 3 1 2
14 13 Barclays Capital 341 3 2 1
19 14 Deloitte 160 3 2 1
- 15 Investec 74 3 - -
Press Release: www.mergermarket.com 28Press Release: www.mergermarket.com 28mergermarket M&A Round-up for Year End 2011
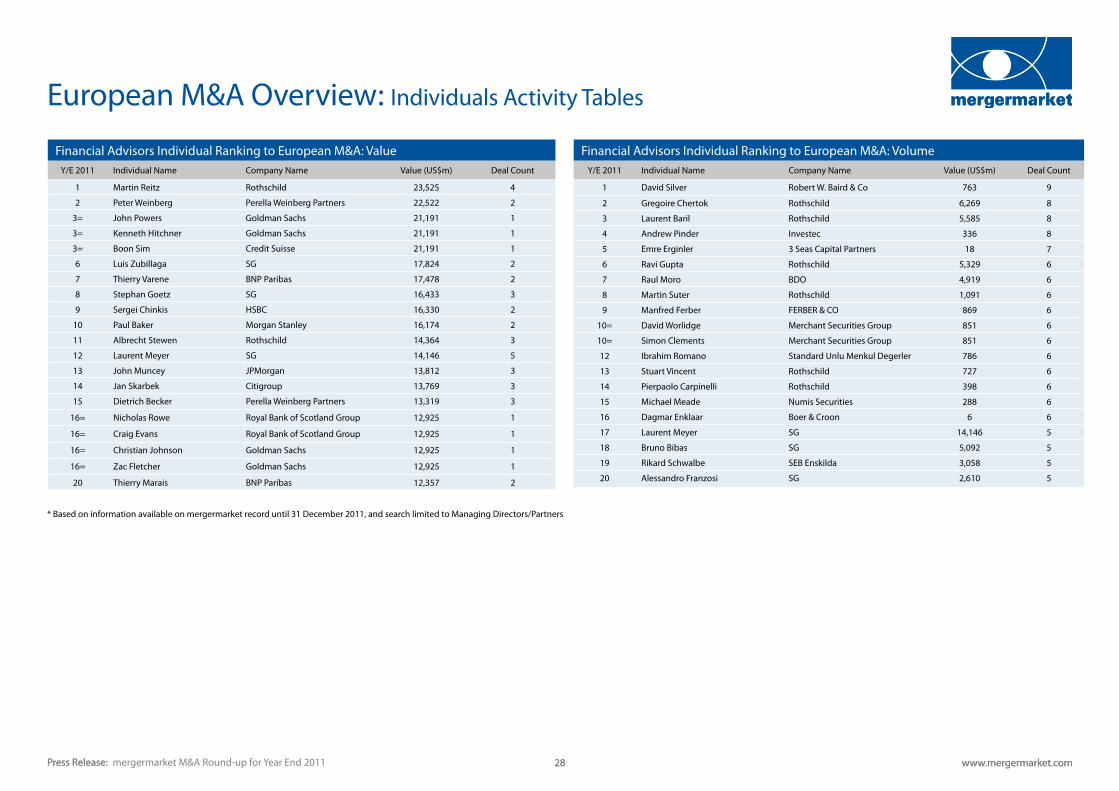
European M&A Overview: Individuals Activity Tables
Financial Advisors Individual Ranking to European M&A: ValueY/E 2011 Individual Name Company Name Value (US$m) Deal Count
1 Martin Reitz Rothschild 23,525 4
2 Peter Weinberg Perella Weinberg Partners 22,522 2
3= John Powers Goldman Sachs 21,191 1
3= Kenneth Hitchner Goldman Sachs 21,191 1
3= Boon Sim Credit Suisse 21,191 1
6 Luis Zubillaga SG 17,824 2
7 Thierry Varene BNP Paribas 17,478 2
8 Stephan Goetz SG 16,433 3
9 Sergei Chinkis HSBC 16,330 2
10 Paul Baker Morgan Stanley 16,174 2
11 Albrecht Stewen Rothschild 14,364 3
12 Laurent Meyer SG 14,146 5
13 John Muncey JPMorgan 13,812 3
14 Jan Skarbek Citigroup 13,769 3
15 Dietrich Becker Perella Weinberg Partners 13,319 3
16= Nicholas Rowe Royal Bank of Scotland Group 12,925 1
16= Craig Evans Royal Bank of Scotland Group 12,925 1
16= Christian Johnson Goldman Sachs 12,925 1
16= Zac Fletcher Goldman Sachs 12,925 1
20 Thierry Marais BNP Paribas 12,357 2
Financial Advisors Individual Ranking to European M&A: VolumeY/E 2011 Individual Name Company Name Value (US$m) Deal Count
1 David Silver Robert W. Baird & Co 763 9
2 Gregoire Chertok Rothschild 6,269 8
3 Laurent Baril Rothschild 5,585 8
4 Andrew Pinder Investec 336 8
5 Emre Erginler 3 Seas Capital Partners 18 7
6 Ravi Gupta Rothschild 5,329 6
7 Raul Moro BDO 4,919 6
8 Martin Suter Rothschild 1,091 6
9 Manfred Ferber FERBER & CO 869 6
10= David Worlidge Merchant Securities Group 851 6
10= Simon Clements Merchant Securities Group 851 6
12 Ibrahim Romano Standard Unlu Menkul Degerler 786 6
13 Stuart Vincent Rothschild 727 6
14 Pierpaolo Carpinelli Rothschild 398 6
15 Michael Meade Numis Securities 288 6
16 Dagmar Enklaar Boer & Croon 6 6
17 Laurent Meyer SG 14,146 5
18 Bruno Bibas SG 5,092 5
19 Rikard Schwalbe SEB Enskilda 3,058 5
20 Alessandro Franzosi SG 2,610 5
* Based on information available on mergermarket record until 31 December 2011, and search limited to Managing Directors/Partners
0
100
200
300
400
500
600
700
800
900
1,000
1,100
1,200
1,300
0
50
100
150
200
250
300
350
400
450
500
Volu
me o
f Dea
ls
Valu
e of D
eals
(US$
bn)
US M&A Activity - Quarterly
Value(US$bn)
Volume
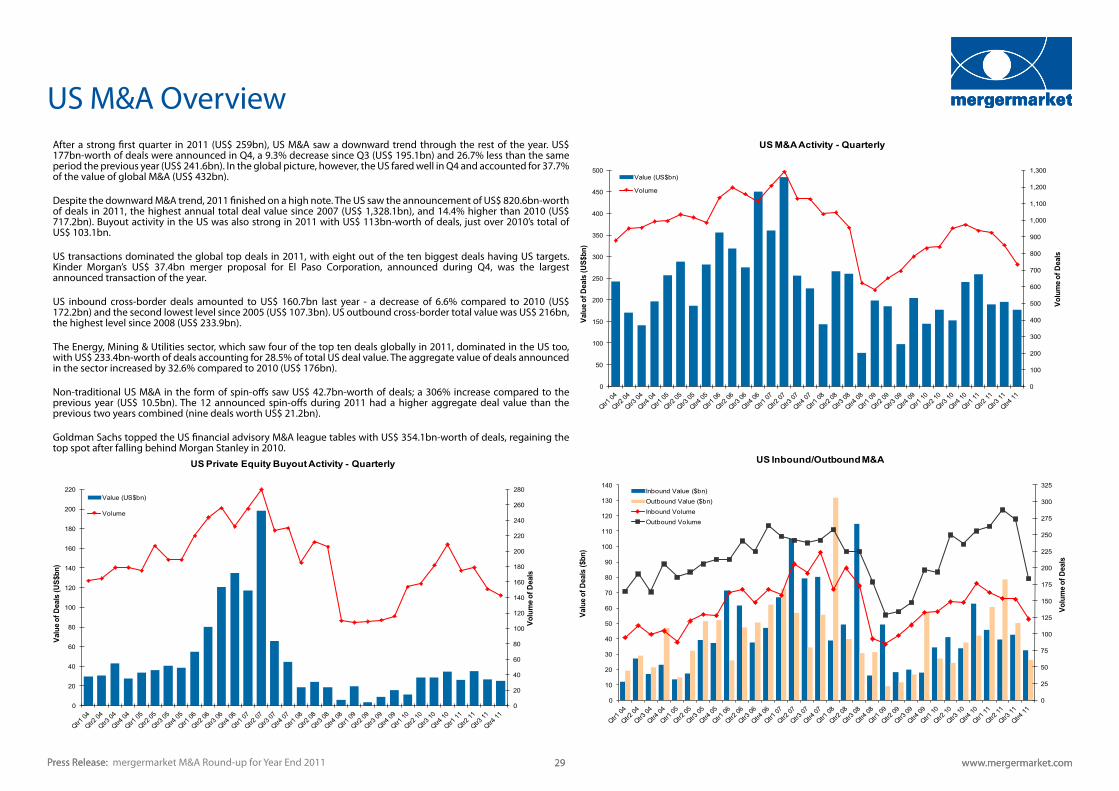
After a strong first quarter in 2011 (US$ 259bn), US M&A saw a downward trend through the rest of the year. US$ 177bn-worth of deals were announced in Q4, a 9.3% decrease since Q3 (US$ 195.1bn) and 26.7% less than the same period the previous year (US$ 241.6bn). In the global picture, however, the US fared well in Q4 and accounted for 37.7% of the value of global M&A (US$ 432bn).
Despite the downward M&A trend, 2011 finished on a high note. The US saw the announcement of US$ 820.6bn-worth of deals in 2011, the highest annual total deal value since 2007 (US$ 1,328.1bn), and 14.4% higher than 2010 (US$ 717.2bn). Buyout activity in the US was also strong in 2011 with US$ 113bn-worth of deals, just over 2010’s total of US$ 103.1bn.
US transactions dominated the global top deals in 2011, with eight out of the ten biggest deals having US targets. Kinder Morgan’s US$ 37.4bn merger proposal for El Paso Corporation, announced during Q4, was the largest announced transaction of the year.
US inbound cross-border deals amounted to US$ 160.7bn last year - a decrease of 6.6% compared to 2010 (US$ 172.2bn) and the second lowest level since 2005 (US$ 107.3bn). US outbound cross-border total value was US$ 216bn, the highest level since 2008 (US$ 233.9bn).
The Energy, Mining & Utilities sector, which saw four of the top ten deals globally in 2011, dominated in the US too, with US$ 233.4bn-worth of deals accounting for 28.5% of total US deal value. The aggregate value of deals announced in the sector increased by 32.6% compared to 2010 (US$ 176bn).
Non-traditional US M&A in the form of spin-offs saw US$ 42.7bn-worth of deals; a 306% increase compared to the previous year (US$ 10.5bn). The 12 announced spin-offs during 2011 had a higher aggregate deal value than the previous two years combined (nine deals worth US$ 21.2bn).
Goldman Sachs topped the US financial advisory M&A league tables with US$ 354.1bn-worth of deals, regaining the top spot after falling behind Morgan Stanley in 2010.
0
20
40
60
80
100
120
140
160
180
200
220
240
260
280
0
20
40
60
80
100
120
140
160
180
200
220
Volu
me o
f Dea
ls
Valu
e of D
eals
(US$
bn)
US Private Equity Buyout Activity - Quarterly
Value(US$bn)
Volume
0
25
50
75
100
125
150
175
200
225
250
275
300
325
0
10
20
30
40
50
60
70
80
90
100
110
120
130
140
Volu
me o
f Dea
ls
Valu
e of D
eals
($bn
)
US Inbound/Outbound M&A
InboundValue($bn)OutboundValue($bn)InboundVolumeOutboundVolume
Press Release: www.mergermarket.com 29Press Release: www.mergermarket.com 29
US M&A Overview
mergermarket M&A Round-up for Year End 2011

Press Release: www.mergermarket.com 30Press Release: www.mergermarket.com 30mergermarket M&A Round-up for Year End 2011
US M&A Overview: Industry and Geography Breakdown
US(NorthEast)18.0%
US(MidWest)14.7%
US(South)33.3%
US(West)13.6%
Canada7.4%
Central&SouthAmerica12.9%
Mix of Announced Americas Deals by Geographic Region 2011 - Value
US(NorthEast)16.5%
US(MidWest)14.0%
US(South)25.0%
US(West)21.1%
Canada9.9%
Central&SouthAmerica13.5%
Mix of Announced Americas Deals by Geographic Region 2011 - Volume
Y/E 2011 Y/E 2010 change
Sector Value ($bn) Market share Deal count Value ($bn) Market share Deal count Value (%) Deal count
Energy, Mining & Utilities 233.5 28.5% 260 177.7 24.8% 348 31.4% -88
Industrials & Chemicals 142.3 17.3% 620 70.8 9.9% 552 101.0% 68
Pharma, Medical & Biotech 121.0 14.7% 415 91.1 12.7% 387 32.8% 28
Technology 78.0 9.5% 542 60.5 8.4% 566 29.0% -24
Financial Services 67.0 8.2% 360 110.8 15.4% 418 -39.5% -58
Business Services 46.4 5.7% 468 60.8 8.5% 522 -23.7% -54
Real Estate 36.7 4.47% 25 11.2 1.56% 37 228.3% -12
Consumer 32.1 3.9% 331 59.9 8.3% 300 -46.4% 31
Telecommunications 17.8 2.2% 31 33.3 4.6% 38 -46.5% -7Media 15.7 1.9% 109 4.2 0.6% 109 270.2% 0
Leisure 15.4 1.9% 107 15.6 2.2% 118 -1.7% -11
Defence 6.1 0.7% 23 5.3 0.7% 30 16.4% -7
Transport 4.4 0.54% 58 10.1 1.41% 47 -55.9% 11
Construction 3.8 0.5% 85 5.8 0.8% 108 -34.7% -23
Agriculture 0.4 0.1% 15 0.3 0.04% 18 53.1% -3
Total 820.6 3,449 717.3 3,598 14.4% -149
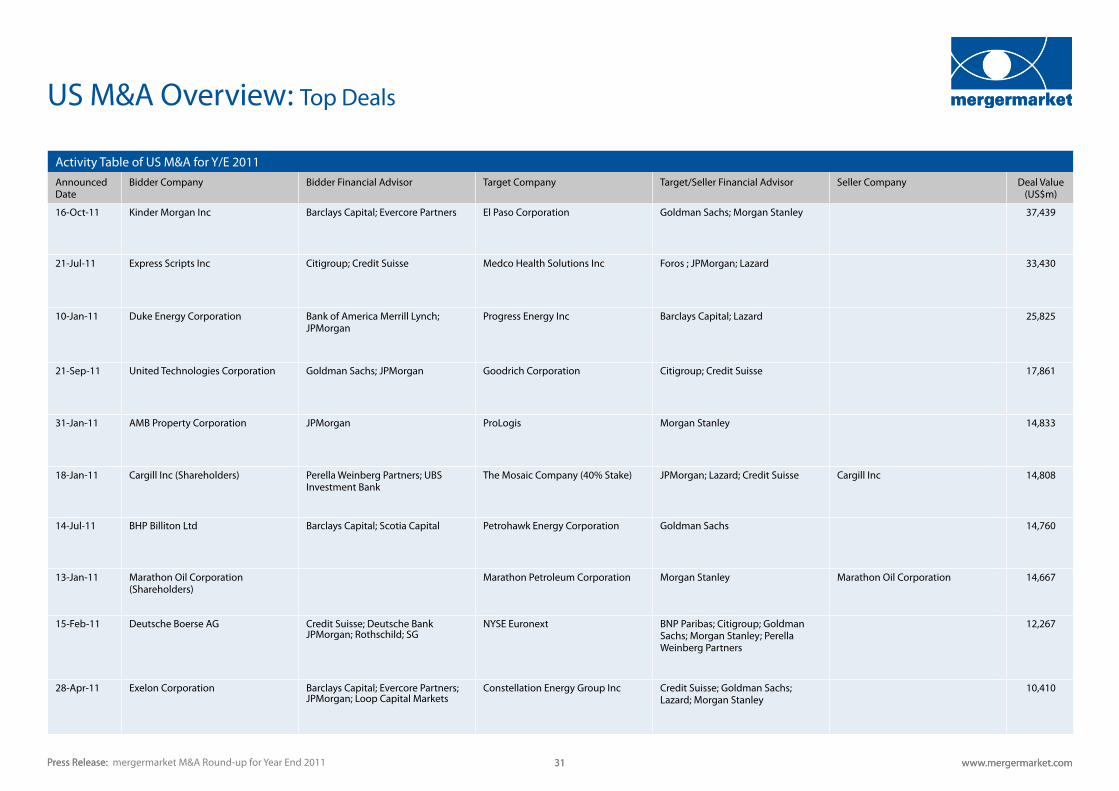
Press Release: www.mergermarket.com 31Press Release: www.mergermarket.com 31mergermarket M&A Round-up for Year End 2011
US M&A Overview: Top Deals
Activity Table of US M&A for Y/E 2011Announced Date
Bidder Company Bidder Financial Advisor Target Company Target/Seller Financial Advisor Seller Company Deal Value (US$m)
16-Oct-11 Kinder Morgan Inc Barclays Capital; Evercore Partners El Paso Corporation Goldman Sachs; Morgan Stanley 37,439
21-Jul-11 Express Scripts Inc Citigroup; Credit Suisse Medco Health Solutions Inc Foros ; JPMorgan; Lazard 33,430
10-Jan-11 Duke Energy Corporation Bank of America Merrill Lynch; JPMorgan
Progress Energy Inc Barclays Capital; Lazard 25,825
21-Sep-11 United Technologies Corporation Goldman Sachs; JPMorgan Goodrich Corporation Citigroup; Credit Suisse 17,861
31-Jan-11 AMB Property Corporation JPMorgan ProLogis Morgan Stanley 14,833
18-Jan-11 Cargill Inc (Shareholders) Perella Weinberg Partners; UBS Investment Bank
The Mosaic Company (40% Stake) JPMorgan; Lazard; Credit Suisse Cargill Inc 14,808
14-Jul-11 BHP Billiton Ltd Barclays Capital; Scotia Capital Petrohawk Energy Corporation Goldman Sachs 14,760
13-Jan-11 Marathon Oil Corporation (Shareholders)
Marathon Petroleum Corporation Morgan Stanley Marathon Oil Corporation 14,667
15-Feb-11 Deutsche Boerse AG Credit Suisse; Deutsche Bank JPMorgan; Rothschild; SG
NYSE Euronext BNP Paribas; Citigroup; Goldman Sachs; Morgan Stanley; Perella Weinberg Partners
12,267
28-Apr-11 Exelon Corporation Barclays Capital; Evercore Partners; JPMorgan; Loop Capital Markets
Constellation Energy Group Inc Credit Suisse; Goldman Sachs; Lazard; Morgan Stanley
10,410
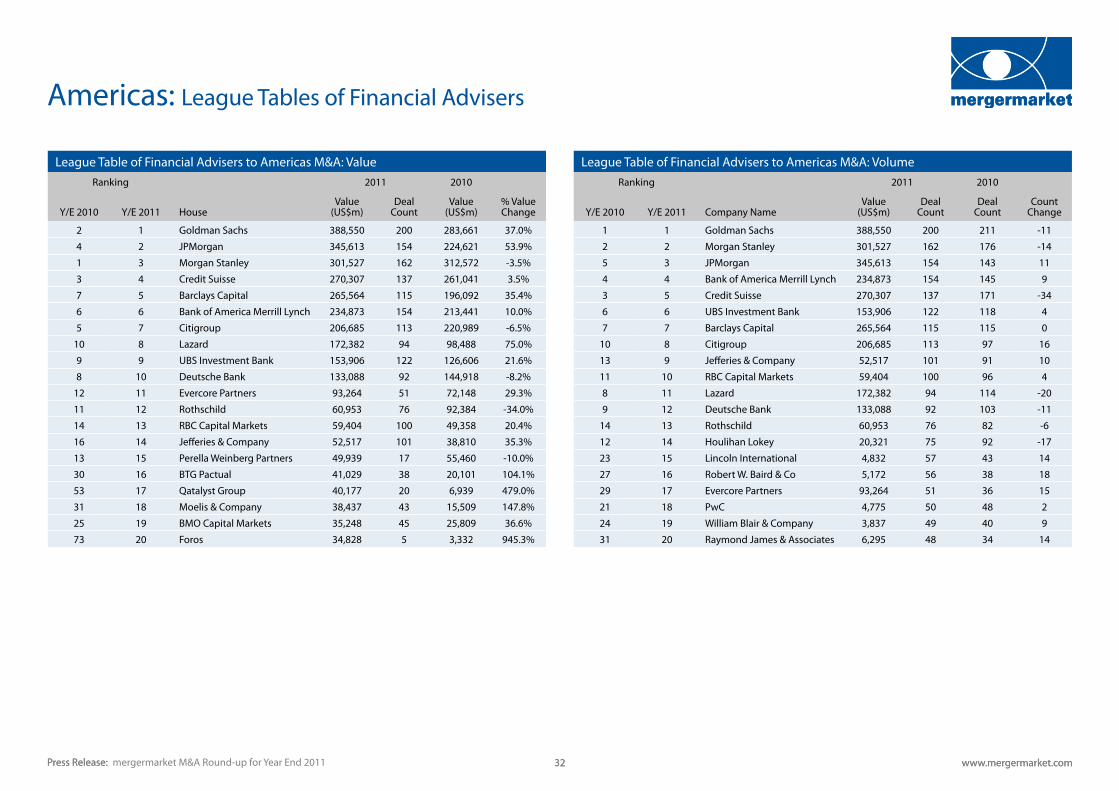
Press Release: www.mergermarket.com 32Press Release: www.mergermarket.com 32mergermarket M&A Round-up for Year End 2011
Americas: League Tables of Financial Advisers
League Table of Financial Advisers to Americas M&A: ValueRanking 2011 2010
Y/E 2010 Y/E 2011 HouseValue
(US$m)Deal
CountValue
(US$m)% Value Change
2 1 Goldman Sachs 388,550 200 283,661 37.0%
4 2 JPMorgan 345,613 154 224,621 53.9%
1 3 Morgan Stanley 301,527 162 312,572 -3.5%
3 4 Credit Suisse 270,307 137 261,041 3.5%
7 5 Barclays Capital 265,564 115 196,092 35.4%
6 6 Bank of America Merrill Lynch 234,873 154 213,441 10.0%
5 7 Citigroup 206,685 113 220,989 -6.5%
10 8 Lazard 172,382 94 98,488 75.0%
9 9 UBS Investment Bank 153,906 122 126,606 21.6%
8 10 Deutsche Bank 133,088 92 144,918 -8.2%
12 11 Evercore Partners 93,264 51 72,148 29.3%
11 12 Rothschild 60,953 76 92,384 -34.0%
14 13 RBC Capital Markets 59,404 100 49,358 20.4%
16 14 Jefferies & Company 52,517 101 38,810 35.3%
13 15 Perella Weinberg Partners 49,939 17 55,460 -10.0%
30 16 BTG Pactual 41,029 38 20,101 104.1%
53 17 Qatalyst Group 40,177 20 6,939 479.0%
31 18 Moelis & Company 38,437 43 15,509 147.8%
25 19 BMO Capital Markets 35,248 45 25,809 36.6%
73 20 Foros 34,828 5 3,332 945.3%
League Table of Financial Advisers to Americas M&A: VolumeRanking 2011 2010
Y/E 2010 Y/E 2011 Company NameValue
(US$m)Deal
CountDeal
Count Count
Change
1 1 Goldman Sachs 388,550 200 211 -11
2 2 Morgan Stanley 301,527 162 176 -14
5 3 JPMorgan 345,613 154 143 11
4 4 Bank of America Merrill Lynch 234,873 154 145 9
3 5 Credit Suisse 270,307 137 171 -34
6 6 UBS Investment Bank 153,906 122 118 4
7 7 Barclays Capital 265,564 115 115 0
10 8 Citigroup 206,685 113 97 16
13 9 Jefferies & Company 52,517 101 91 10
11 10 RBC Capital Markets 59,404 100 96 4
8 11 Lazard 172,382 94 114 -20
9 12 Deutsche Bank 133,088 92 103 -11
14 13 Rothschild 60,953 76 82 -6
12 14 Houlihan Lokey 20,321 75 92 -17
23 15 Lincoln International 4,832 57 43 14
27 16 Robert W. Baird & Co 5,172 56 38 18
29 17 Evercore Partners 93,264 51 36 15
21 18 PwC 4,775 50 48 2
24 19 William Blair & Company 3,837 49 40 9
31 20 Raymond James & Associates 6,295 48 34 14
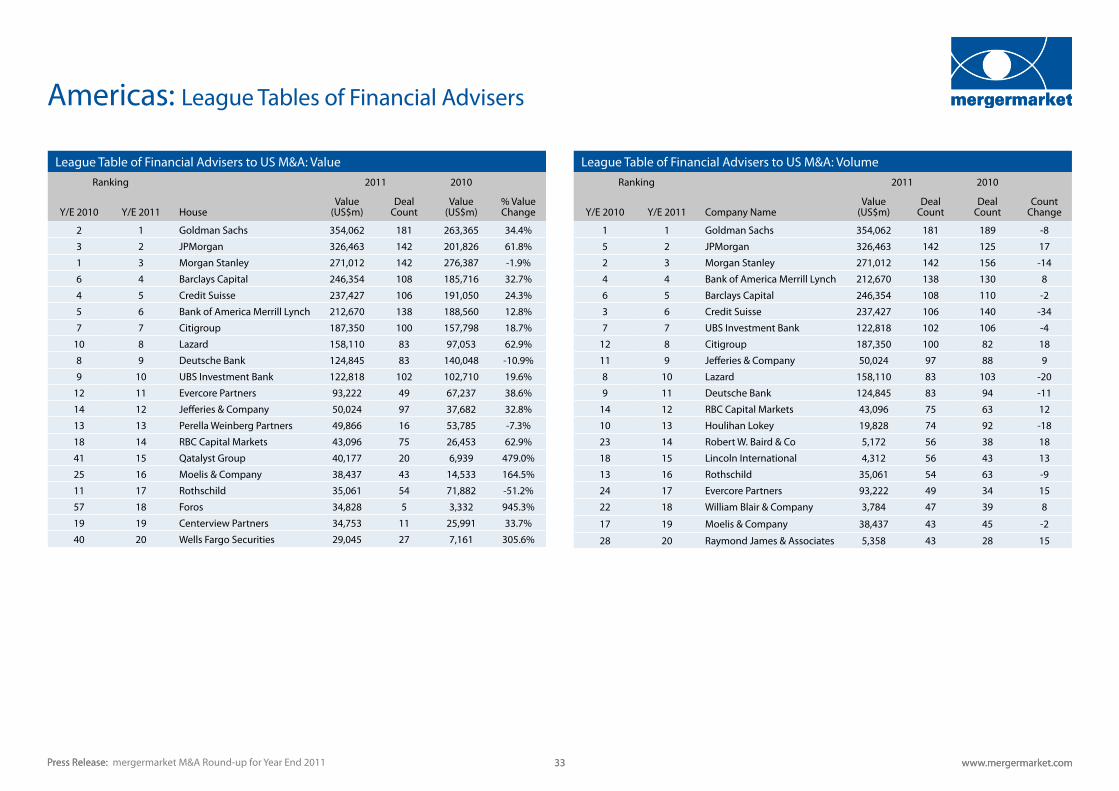
Press Release: www.mergermarket.com 33Press Release: www.mergermarket.com 33mergermarket M&A Round-up for Year End 2011
Americas: League Tables of Financial Advisers
League Table of Financial Advisers to US M&A: ValueRanking 2011 2010
Y/E 2010 Y/E 2011 HouseValue
(US$m)Deal
CountValue
(US$m)% Value Change
2 1 Goldman Sachs 354,062 181 263,365 34.4%
3 2 JPMorgan 326,463 142 201,826 61.8%
1 3 Morgan Stanley 271,012 142 276,387 -1.9%
6 4 Barclays Capital 246,354 108 185,716 32.7%
4 5 Credit Suisse 237,427 106 191,050 24.3%
5 6 Bank of America Merrill Lynch 212,670 138 188,560 12.8%
7 7 Citigroup 187,350 100 157,798 18.7%
10 8 Lazard 158,110 83 97,053 62.9%
8 9 Deutsche Bank 124,845 83 140,048 -10.9%
9 10 UBS Investment Bank 122,818 102 102,710 19.6%
12 11 Evercore Partners 93,222 49 67,237 38.6%
14 12 Jefferies & Company 50,024 97 37,682 32.8%
13 13 Perella Weinberg Partners 49,866 16 53,785 -7.3%
18 14 RBC Capital Markets 43,096 75 26,453 62.9%
41 15 Qatalyst Group 40,177 20 6,939 479.0%
25 16 Moelis & Company 38,437 43 14,533 164.5%
11 17 Rothschild 35,061 54 71,882 -51.2%
57 18 Foros 34,828 5 3,332 945.3%
19 19 Centerview Partners 34,753 11 25,991 33.7%
40 20 Wells Fargo Securities 29,045 27 7,161 305.6%
League Table of Financial Advisers to US M&A: VolumeRanking 2011 2010
Y/E 2010 Y/E 2011 Company NameValue
(US$m)Deal
CountDeal
Count Count
Change
1 1 Goldman Sachs 354,062 181 189 -8
5 2 JPMorgan 326,463 142 125 17
2 3 Morgan Stanley 271,012 142 156 -14
4 4 Bank of America Merrill Lynch 212,670 138 130 8
6 5 Barclays Capital 246,354 108 110 -2
3 6 Credit Suisse 237,427 106 140 -34
7 7 UBS Investment Bank 122,818 102 106 -4
12 8 Citigroup 187,350 100 82 18
11 9 Jefferies & Company 50,024 97 88 9
8 10 Lazard 158,110 83 103 -20
9 11 Deutsche Bank 124,845 83 94 -11
14 12 RBC Capital Markets 43,096 75 63 12
10 13 Houlihan Lokey 19,828 74 92 -18
23 14 Robert W. Baird & Co 5,172 56 38 18
18 15 Lincoln International 4,312 56 43 13
13 16 Rothschild 35,061 54 63 -9
24 17 Evercore Partners 93,222 49 34 15
22 18 William Blair & Company 3,784 47 39 8
17 19 Moelis & Company 38,437 43 45 -2
28 20 Raymond James & Associates 5,358 43 28 15

Press Release: www.mergermarket.com 34Press Release: www.mergermarket.com 34mergermarket M&A Round-up for Year End 2011
Americas: League Tables of Financial Advisers
League Table of Financial Advisers to US Buyouts*: ValueRanking 2011 2010
Y/E 2010 Y/E 2011 HouseValue
(US$m)Deal
CountValue
(US$m)% Value Change
1 1 Barclays Capital 34,669 15 27,548 25.8%
10 2 Citigroup 22,320 10 4,769 368.0%
6 3 Deutsche Bank 21,329 7 8,391 154.2%
3 4 Credit Suisse 19,742 13 20,970 -5.9%
13 5 RBC Capital Markets 19,028 17 2,016 843.8%
2 6 Bank of America Merrill Lynch 18,113 7 21,016 -13.8%
5 7 Morgan Stanley 16,144 10 14,431 11.9%
22 8 Wells Fargo Securities 15,102 3 410 3,583%
7 9 UBS Investment Bank 11,714 7 6,479 80.8%
9 10 Goldman Sachs 7,856 8 5,064 55.1%
39 11 BMO Capital Markets 7,301 3 - -
20 12 Jefferies & Company 7,145 10 598 1,095%
12 13 Evercore Partners 5,950 3 3,940 51.0%
19 14 Tudor, Pickering, Holt & Co 5,400 1 725 644.8%
4 15 JPMorgan 3,403 2 19,544 -82.6%
*Based on the target geography only and the advisor advising the buy-side only.
League Table of Financial Advisers to US Buyouts*: VolumeRanking 2011 2010
Y/E 2010 Y/E 2011 Company NameValue
(US$m)Deal
CountDeal
Count Count
Change
11 1 RBC Capital Markets 19,028 17 3 14
1 2 Barclays Capital 34,669 15 21 -6
3 3 Credit Suisse 19,742 13 14 -1
8 4 Citigroup 22,320 10 7 3
6 5 Morgan Stanley 16,144 10 8 2
17 6 Jefferies & Company 7,145 10 2 8
4 7 Goldman Sachs 7,856 8 9 -1
7 8 Deutsche Bank 21,329 7 8 -1
2 9 Bank of America Merrill Lynch 18,113 7 14 -7
9 10 UBS Investment Bank 11,714 7 4 3
12 11 Moelis & Company 2,399 7 3 4
14 12 Macquarie Group 2,456 5 3 2
51 13 Lincoln International 180 5 1 4
13 14 Houlihan Lokey 1,507 4 3 1
- 15 Ernst & Young 305 4 - -
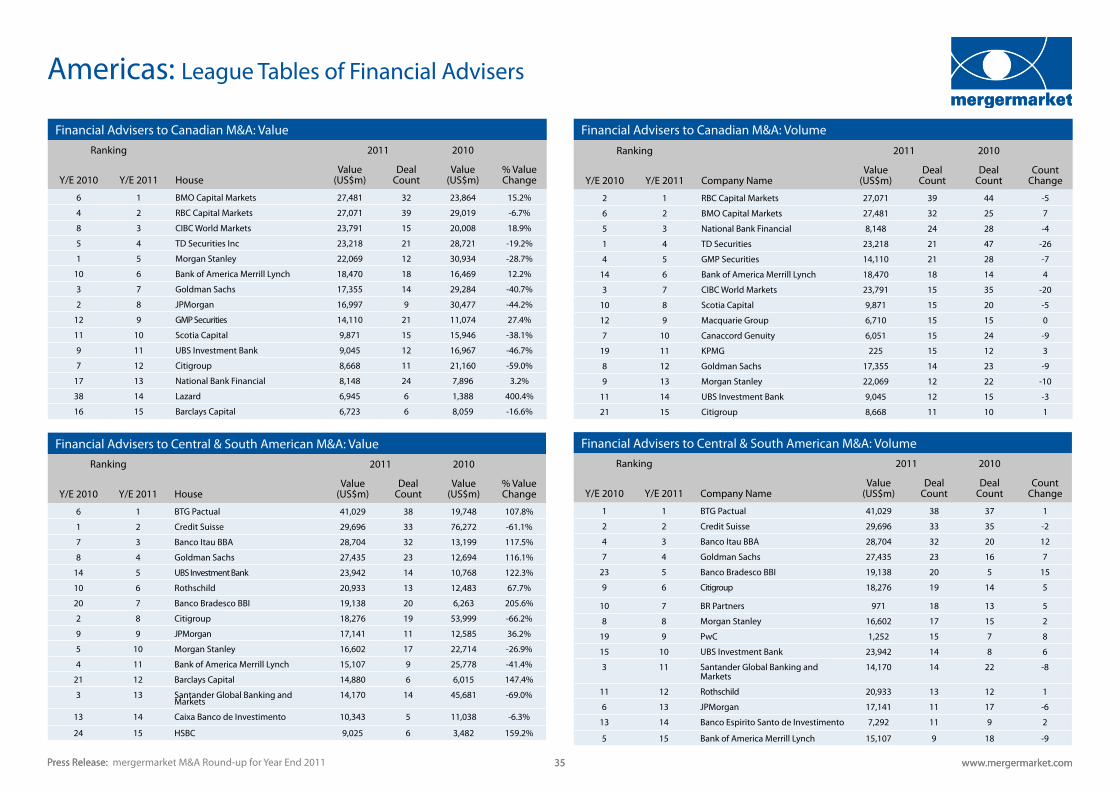
Press Release: www.mergermarket.com 35Press Release: www.mergermarket.com 35mergermarket M&A Round-up for Year End 2011
Americas: League Tables of Financial Advisers
Financial Advisers to Canadian M&A: ValueRanking 2011 2010
Y/E 2010 Y/E 2011 HouseValue
(US$m)Deal
CountValue
(US$m)% Value Change
6 1 BMO Capital Markets 27,481 32 23,864 15.2%
4 2 RBC Capital Markets 27,071 39 29,019 -6.7%
8 3 CIBC World Markets 23,791 15 20,008 18.9%
5 4 TD Securities Inc 23,218 21 28,721 -19.2%
1 5 Morgan Stanley 22,069 12 30,934 -28.7%
10 6 Bank of America Merrill Lynch 18,470 18 16,469 12.2%
3 7 Goldman Sachs 17,355 14 29,284 -40.7%
2 8 JPMorgan 16,997 9 30,477 -44.2%
12 9 GMP Securities 14,110 21 11,074 27.4%
11 10 Scotia Capital 9,871 15 15,946 -38.1%
9 11 UBS Investment Bank 9,045 12 16,967 -46.7%
7 12 Citigroup 8,668 11 21,160 -59.0%
17 13 National Bank Financial 8,148 24 7,896 3.2%
38 14 Lazard 6,945 6 1,388 400.4%
16 15 Barclays Capital 6,723 6 8,059 -16.6%
Financial Advisers to Central & South American M&A: ValueRanking 2011 2010
Y/E 2010 Y/E 2011 HouseValue
(US$m)Deal
CountValue
(US$m)% Value Change
6 1 BTG Pactual 41,029 38 19,748 107.8%
1 2 Credit Suisse 29,696 33 76,272 -61.1%
7 3 Banco Itau BBA 28,704 32 13,199 117.5%
8 4 Goldman Sachs 27,435 23 12,694 116.1%
14 5 UBS Investment Bank 23,942 14 10,768 122.3%
10 6 Rothschild 20,933 13 12,483 67.7%
20 7 Banco Bradesco BBI 19,138 20 6,263 205.6%
2 8 Citigroup 18,276 19 53,999 -66.2%
9 9 JPMorgan 17,141 11 12,585 36.2%
5 10 Morgan Stanley 16,602 17 22,714 -26.9%
4 11 Bank of America Merrill Lynch 15,107 9 25,778 -41.4%
21 12 Barclays Capital 14,880 6 6,015 147.4%
3 13 Santander Global Banking and Markets
14,170 14 45,681 -69.0%
13 14 Caixa Banco de Investimento 10,343 5 11,038 -6.3%
24 15 HSBC 9,025 6 3,482 159.2%
Financial Advisers to Canadian M&A: VolumeRanking 2011 2010
Y/E 2010 Y/E 2011 Company NameValue
(US$m)Deal
CountDeal
Count Count
Change
2 1 RBC Capital Markets 27,071 39 44 -5
6 2 BMO Capital Markets 27,481 32 25 7
5 3 National Bank Financial 8,148 24 28 -4
1 4 TD Securities 23,218 21 47 -26
4 5 GMP Securities 14,110 21 28 -7
14 6 Bank of America Merrill Lynch 18,470 18 14 4
3 7 CIBC World Markets 23,791 15 35 -20
10 8 Scotia Capital 9,871 15 20 -5
12 9 Macquarie Group 6,710 15 15 0
7 10 Canaccord Genuity 6,051 15 24 -9
19 11 KPMG 225 15 12 3
8 12 Goldman Sachs 17,355 14 23 -9
9 13 Morgan Stanley 22,069 12 22 -10
11 14 UBS Investment Bank 9,045 12 15 -3
21 15 Citigroup 8,668 11 10 1
Financial Advisers to Central & South American M&A: VolumeRanking 2011 2010
Y/E 2010 Y/E 2011 Company NameValue
(US$m)Deal
CountDeal
Count Count
Change
1 1 BTG Pactual 41,029 38 37 1
2 2 Credit Suisse 29,696 33 35 -2
4 3 Banco Itau BBA 28,704 32 20 12
7 4 Goldman Sachs 27,435 23 16 7
23 5 Banco Bradesco BBI 19,138 20 5 15
9 6 Citigroup 18,276 19 14 5
10 7 BR Partners 971 18 13 5
8 8 Morgan Stanley 16,602 17 15 2
19 9 PwC 1,252 15 7 8
15 10 UBS Investment Bank 23,942 14 8 6
3 11 Santander Global Banking and Markets
14,170 14 22 -8
11 12 Rothschild 20,933 13 12 1
6 13 JPMorgan 17,141 11 17 -6
13 14 Banco Espirito Santo de Investimento 7,292 11 9 2
5 15 Bank of America Merrill Lynch 15,107 9 18 -9
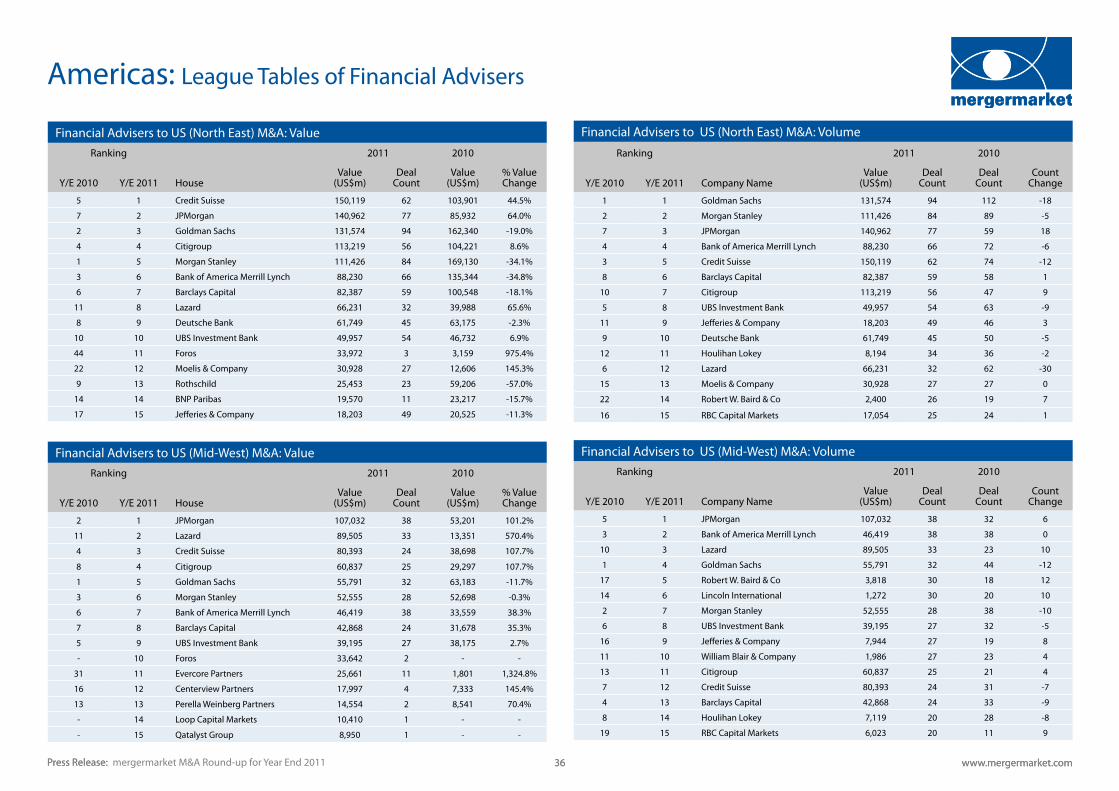
Press Release: www.mergermarket.com 36Press Release: www.mergermarket.com 36mergermarket M&A Round-up for Year End 2011
Americas: League Tables of Financial Advisers
Financial Advisers to US (North East) M&A: ValueRanking 2011 2010
Y/E 2010 Y/E 2011 HouseValue
(US$m)Deal
CountValue
(US$m)% Value Change
5 1 Credit Suisse 150,119 62 103,901 44.5%
7 2 JPMorgan 140,962 77 85,932 64.0%
2 3 Goldman Sachs 131,574 94 162,340 -19.0%
4 4 Citigroup 113,219 56 104,221 8.6%
1 5 Morgan Stanley 111,426 84 169,130 -34.1%
3 6 Bank of America Merrill Lynch 88,230 66 135,344 -34.8%
6 7 Barclays Capital 82,387 59 100,548 -18.1%
11 8 Lazard 66,231 32 39,988 65.6%
8 9 Deutsche Bank 61,749 45 63,175 -2.3%
10 10 UBS Investment Bank 49,957 54 46,732 6.9%
44 11 Foros 33,972 3 3,159 975.4%
22 12 Moelis & Company 30,928 27 12,606 145.3%
9 13 Rothschild 25,453 23 59,206 -57.0%
14 14 BNP Paribas 19,570 11 23,217 -15.7%
17 15 Jefferies & Company 18,203 49 20,525 -11.3%
Financial Advisers to US (North East) M&A: Volume
Ranking 2011 2010
Y/E 2010 Y/E 2011 Company NameValue
(US$m)Deal
CountDeal
Count Count
Change
1 1 Goldman Sachs 131,574 94 112 -18
2 2 Morgan Stanley 111,426 84 89 -5
7 3 JPMorgan 140,962 77 59 18
4 4 Bank of America Merrill Lynch 88,230 66 72 -6
3 5 Credit Suisse 150,119 62 74 -12
8 6 Barclays Capital 82,387 59 58 1
10 7 Citigroup 113,219 56 47 9
5 8 UBS Investment Bank 49,957 54 63 -9
11 9 Jefferies & Company 18,203 49 46 3
9 10 Deutsche Bank 61,749 45 50 -5
12 11 Houlihan Lokey 8,194 34 36 -2
6 12 Lazard 66,231 32 62 -30
15 13 Moelis & Company 30,928 27 27 0
22 14 Robert W. Baird & Co 2,400 26 19 7
16 15 RBC Capital Markets 17,054 25 24 1
Financial Advisers to US (Mid-West) M&A: VolumeRanking 2011 2010
Y/E 2010 Y/E 2011 Company NameValue
(US$m)Deal
CountDeal
Count Count
Change
5 1 JPMorgan 107,032 38 32 6
3 2 Bank of America Merrill Lynch 46,419 38 38 0
10 3 Lazard 89,505 33 23 10
1 4 Goldman Sachs 55,791 32 44 -12
17 5 Robert W. Baird & Co 3,818 30 18 12
14 6 Lincoln International 1,272 30 20 10
2 7 Morgan Stanley 52,555 28 38 -10
6 8 UBS Investment Bank 39,195 27 32 -5
16 9 Jefferies & Company 7,944 27 19 8
11 10 William Blair & Company 1,986 27 23 4
13 11 Citigroup 60,837 25 21 4
7 12 Credit Suisse 80,393 24 31 -7
4 13 Barclays Capital 42,868 24 33 -9
8 14 Houlihan Lokey 7,119 20 28 -8
19 15 RBC Capital Markets 6,023 20 11 9
Financial Advisers to US (Mid-West) M&A: ValueRanking 2011 2010
Y/E 2010 Y/E 2011 HouseValue
(US$m)Deal
CountValue
(US$m)% Value Change
2 1 JPMorgan 107,032 38 53,201 101.2%
11 2 Lazard 89,505 33 13,351 570.4%
4 3 Credit Suisse 80,393 24 38,698 107.7%
8 4 Citigroup 60,837 25 29,297 107.7%
1 5 Goldman Sachs 55,791 32 63,183 -11.7%
3 6 Morgan Stanley 52,555 28 52,698 -0.3%
6 7 Bank of America Merrill Lynch 46,419 38 33,559 38.3%
7 8 Barclays Capital 42,868 24 31,678 35.3%
5 9 UBS Investment Bank 39,195 27 38,175 2.7%
- 10 Foros 33,642 2 - -
31 11 Evercore Partners 25,661 11 1,801 1,324.8%
16 12 Centerview Partners 17,997 4 7,333 145.4%
13 13 Perella Weinberg Partners 14,554 2 8,541 70.4%
- 14 Loop Capital Markets 10,410 1 - -
- 15 Qatalyst Group 8,950 1 - -
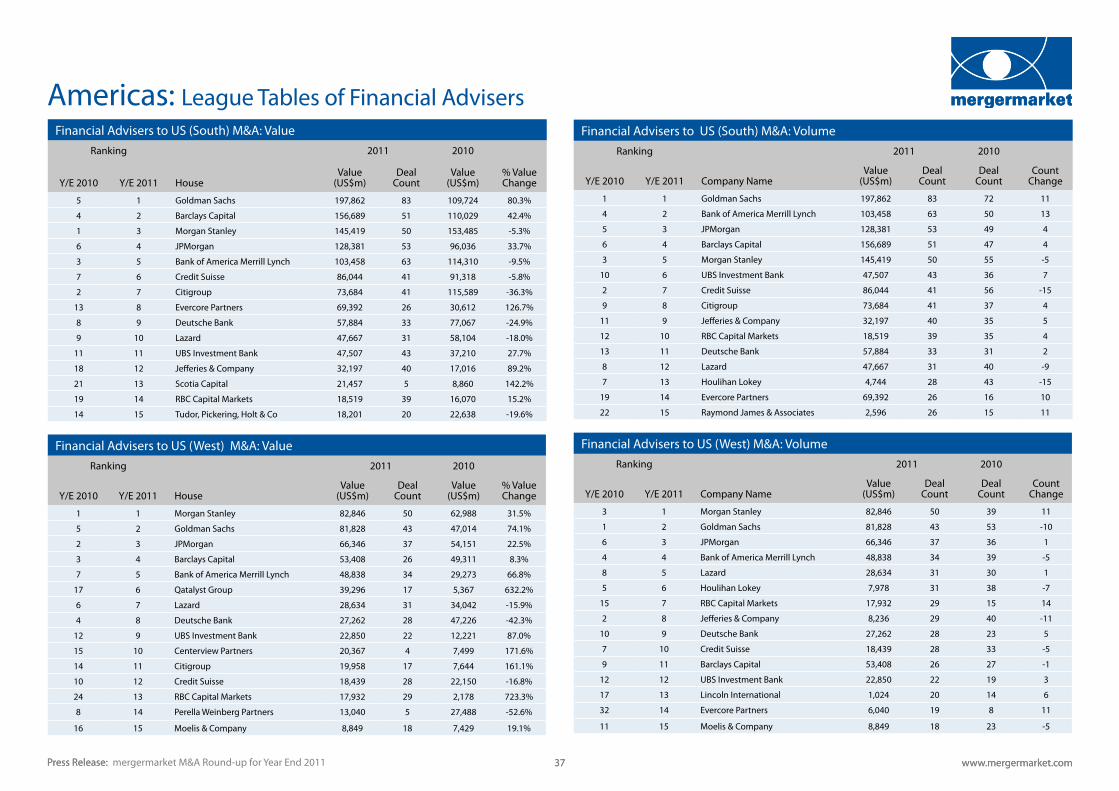
Press Release: www.mergermarket.com 37Press Release: www.mergermarket.com 37mergermarket M&A Round-up for Year End 2011
Americas: League Tables of Financial AdvisersFinancial Advisers to US (South) M&A: Value
Ranking 2011 2010
Y/E 2010 Y/E 2011 HouseValue
(US$m)Deal
CountValue
(US$m)% Value Change
5 1 Goldman Sachs 197,862 83 109,724 80.3%
4 2 Barclays Capital 156,689 51 110,029 42.4%
1 3 Morgan Stanley 145,419 50 153,485 -5.3%
6 4 JPMorgan 128,381 53 96,036 33.7%
3 5 Bank of America Merrill Lynch 103,458 63 114,310 -9.5%
7 6 Credit Suisse 86,044 41 91,318 -5.8%
2 7 Citigroup 73,684 41 115,589 -36.3%
13 8 Evercore Partners 69,392 26 30,612 126.7%
8 9 Deutsche Bank 57,884 33 77,067 -24.9%
9 10 Lazard 47,667 31 58,104 -18.0%
11 11 UBS Investment Bank 47,507 43 37,210 27.7%
18 12 Jefferies & Company 32,197 40 17,016 89.2%
21 13 Scotia Capital 21,457 5 8,860 142.2%
19 14 RBC Capital Markets 18,519 39 16,070 15.2%
14 15 Tudor, Pickering, Holt & Co 18,201 20 22,638 -19.6%
Financial Advisers to US (West) M&A: ValueRanking 2011 2010
Y/E 2010 Y/E 2011 HouseValue
(US$m)Deal
CountValue
(US$m)% Value Change
1 1 Morgan Stanley 82,846 50 62,988 31.5%
5 2 Goldman Sachs 81,828 43 47,014 74.1%
2 3 JPMorgan 66,346 37 54,151 22.5%
3 4 Barclays Capital 53,408 26 49,311 8.3%
7 5 Bank of America Merrill Lynch 48,838 34 29,273 66.8%
17 6 Qatalyst Group 39,296 17 5,367 632.2%
6 7 Lazard 28,634 31 34,042 -15.9%
4 8 Deutsche Bank 27,262 28 47,226 -42.3%
12 9 UBS Investment Bank 22,850 22 12,221 87.0%
15 10 Centerview Partners 20,367 4 7,499 171.6%
14 11 Citigroup 19,958 17 7,644 161.1%
10 12 Credit Suisse 18,439 28 22,150 -16.8%
24 13 RBC Capital Markets 17,932 29 2,178 723.3%
8 14 Perella Weinberg Partners 13,040 5 27,488 -52.6%
16 15 Moelis & Company 8,849 18 7,429 19.1%
Financial Advisers to US (South) M&A: VolumeRanking 2011 2010
Y/E 2010 Y/E 2011 Company NameValue
(US$m)Deal
CountDeal
Count Count
Change
1 1 Goldman Sachs 197,862 83 72 11
4 2 Bank of America Merrill Lynch 103,458 63 50 13
5 3 JPMorgan 128,381 53 49 4
6 4 Barclays Capital 156,689 51 47 4
3 5 Morgan Stanley 145,419 50 55 -5
10 6 UBS Investment Bank 47,507 43 36 7
2 7 Credit Suisse 86,044 41 56 -15
9 8 Citigroup 73,684 41 37 4
11 9 Jefferies & Company 32,197 40 35 5
12 10 RBC Capital Markets 18,519 39 35 4
13 11 Deutsche Bank 57,884 33 31 2
8 12 Lazard 47,667 31 40 -9
7 13 Houlihan Lokey 4,744 28 43 -15
19 14 Evercore Partners 69,392 26 16 10
22 15 Raymond James & Associates 2,596 26 15 11
Financial Advisers to US (West) M&A: VolumeRanking 2011 2010
Y/E 2010 Y/E 2011 Company NameValue
(US$m)Deal
CountDeal
Count Count
Change
3 1 Morgan Stanley 82,846 50 39 11
1 2 Goldman Sachs 81,828 43 53 -10
6 3 JPMorgan 66,346 37 36 1
4 4 Bank of America Merrill Lynch 48,838 34 39 -5
8 5 Lazard 28,634 31 30 1
5 6 Houlihan Lokey 7,978 31 38 -7
15 7 RBC Capital Markets 17,932 29 15 14
2 8 Jefferies & Company 8,236 29 40 -11
10 9 Deutsche Bank 27,262 28 23 5
7 10 Credit Suisse 18,439 28 33 -5
9 11 Barclays Capital 53,408 26 27 -1
12 12 UBS Investment Bank 22,850 22 19 3
17 13 Lincoln International 1,024 20 14 6
32 14 Evercore Partners 6,040 19 8 11
11 15 Moelis & Company 8,849 18 23 -5
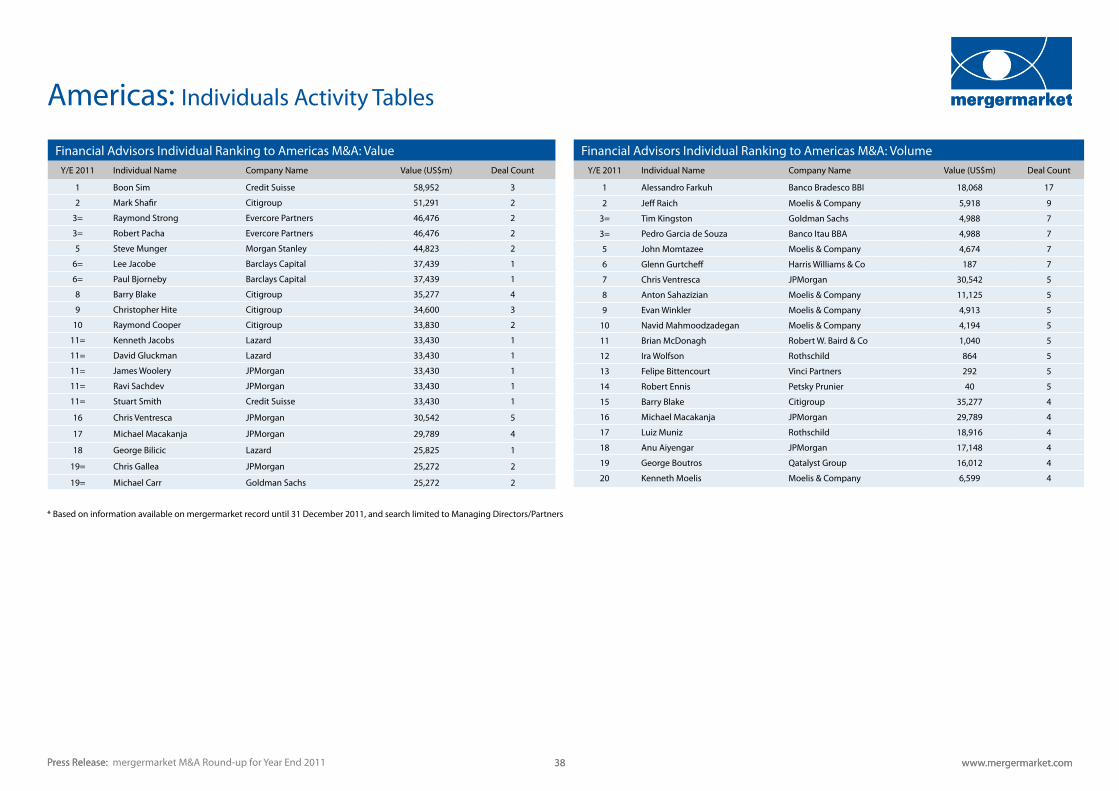
Press Release: www.mergermarket.com 38Press Release: www.mergermarket.com 38mergermarket M&A Round-up for Year End 2011
Americas: Individuals Activity Tables
Financial Advisors Individual Ranking to Americas M&A: ValueY/E 2011 Individual Name Company Name Value (US$m) Deal Count
1 Boon Sim Credit Suisse 58,952 3
2 Mark Shafir Citigroup 51,291 2
3= Raymond Strong Evercore Partners 46,476 2
3= Robert Pacha Evercore Partners 46,476 2
5 Steve Munger Morgan Stanley 44,823 2
6= Lee Jacobe Barclays Capital 37,439 1
6= Paul Bjorneby Barclays Capital 37,439 1
8 Barry Blake Citigroup 35,277 4
9 Christopher Hite Citigroup 34,600 3
10 Raymond Cooper Citigroup 33,830 2
11= Kenneth Jacobs Lazard 33,430 1
11= David Gluckman Lazard 33,430 1
11= James Woolery JPMorgan 33,430 1
11= Ravi Sachdev JPMorgan 33,430 1
11= Stuart Smith Credit Suisse 33,430 1
16 Chris Ventresca JPMorgan 30,542 5
17 Michael Macakanja JPMorgan 29,789 4
18 George Bilicic Lazard 25,825 1
19= Chris Gallea JPMorgan 25,272 2
19= Michael Carr Goldman Sachs 25,272 2
Financial Advisors Individual Ranking to Americas M&A: VolumeY/E 2011 Individual Name Company Name Value (US$m) Deal Count
1 Alessandro Farkuh Banco Bradesco BBI 18,068 17
2 Jeff Raich Moelis & Company 5,918 9
3= Tim Kingston Goldman Sachs 4,988 7
3= Pedro Garcia de Souza Banco Itau BBA 4,988 7
5 John Momtazee Moelis & Company 4,674 7
6 Glenn Gurtcheff Harris Williams & Co 187 7
7 Chris Ventresca JPMorgan 30,542 5
8 Anton Sahazizian Moelis & Company 11,125 5
9 Evan Winkler Moelis & Company 4,913 5
10 Navid Mahmoodzadegan Moelis & Company 4,194 5
11 Brian McDonagh Robert W. Baird & Co 1,040 5
12 Ira Wolfson Rothschild 864 5
13 Felipe Bittencourt Vinci Partners 292 5
14 Robert Ennis Petsky Prunier 40 5
15 Barry Blake Citigroup 35,277 4
16 Michael Macakanja JPMorgan 29,789 4
17 Luiz Muniz Rothschild 18,916 4
18 Anu Aiyengar JPMorgan 17,148 4
19 George Boutros Qatalyst Group 16,012 4
20 Kenneth Moelis Moelis & Company 6,599 4
* Based on information available on mergermarket record until 31 December 2011, and search limited to Managing Directors/Partners
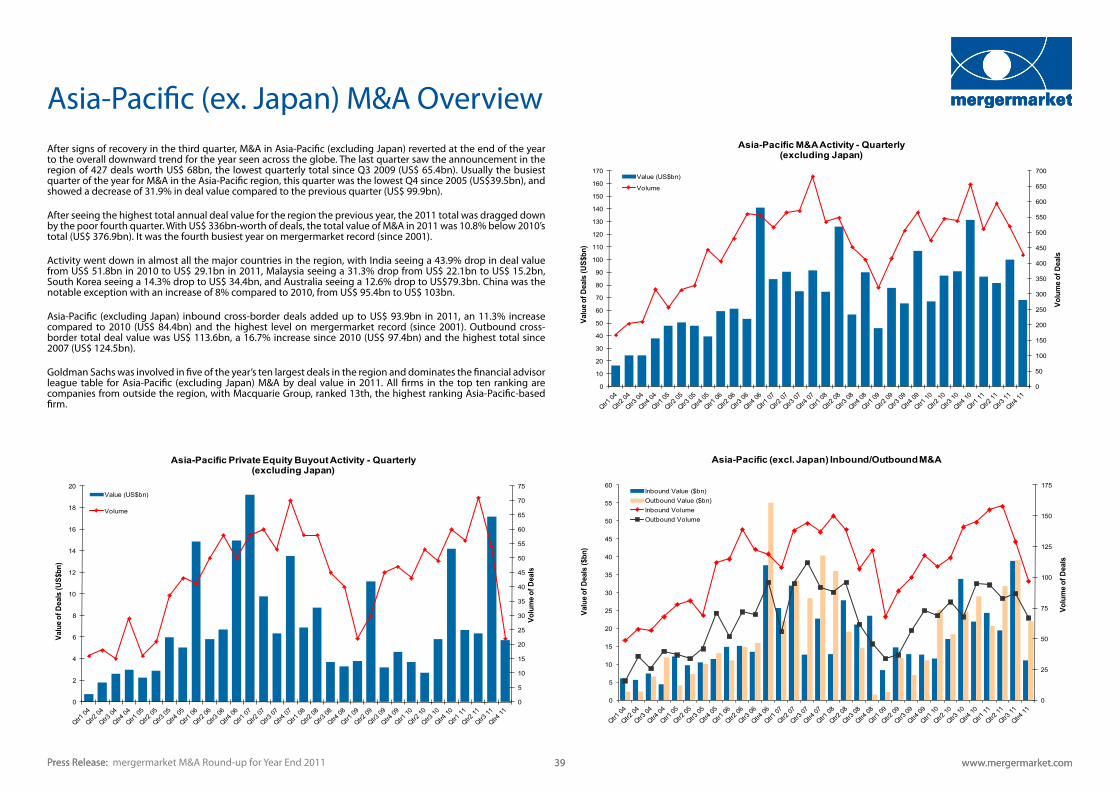
0
50
100
150
200
250
300
350
400
450
500
550
600
650
700
0
10
20
30
40
50
60
70
80
90
100
110
120
130
140
150
160
170
Volu
me o
f Dea
ls
Valu
e of D
eals
(US$
bn)
Asia-Pacific M&A Activity - Quarterly(excluding Japan)
Value(US$bn)
Volume
After signs of recovery in the third quarter, M&A in Asia-Pacific (excluding Japan) reverted at the end of the year to the overall downward trend for the year seen across the globe. The last quarter saw the announcement in the region of 427 deals worth US$ 68bn, the lowest quarterly total since Q3 2009 (US$ 65.4bn). Usually the busiest quarter of the year for M&A in the Asia-Pacific region, this quarter was the lowest Q4 since 2005 (US$39.5bn), and showed a decrease of 31.9% in deal value compared to the previous quarter (US$ 99.9bn).
After seeing the highest total annual deal value for the region the previous year, the 2011 total was dragged down by the poor fourth quarter. With US$ 336bn-worth of deals, the total value of M&A in 2011 was 10.8% below 2010’s total (US$ 376.9bn). It was the fourth busiest year on mergermarket record (since 2001).
Activity went down in almost all the major countries in the region, with India seeing a 43.9% drop in deal value from US$ 51.8bn in 2010 to US$ 29.1bn in 2011, Malaysia seeing a 31.3% drop from US$ 22.1bn to US$ 15.2bn, South Korea seeing a 14.3% drop to US$ 34.4bn, and Australia seeing a 12.6% drop to US$79.3bn. China was the notable exception with an increase of 8% compared to 2010, from US$ 95.4bn to US$ 103bn.
Asia-Pacific (excluding Japan) inbound cross-border deals added up to US$ 93.9bn in 2011, an 11.3% increase compared to 2010 (US$ 84.4bn) and the highest level on mergermarket record (since 2001). Outbound cross-border total deal value was US$ 113.6bn, a 16.7% increase since 2010 (US$ 97.4bn) and the highest total since 2007 (US$ 124.5bn).
Goldman Sachs was involved in five of the year’s ten largest deals in the region and dominates the financial advisor league table for Asia-Pacific (excluding Japan) M&A by deal value in 2011. All firms in the top ten ranking are companies from outside the region, with Macquarie Group, ranked 13th, the highest ranking Asia-Pacific-based firm.
0
5
10
15
20
25
30
35
40
45
50
55
60
65
70
75
0
2
4
6
8
10
12
14
16
18
20
Volu
me o
f Dea
ls
Valu
e of D
eals
(US$
bn)
Asia-Pacific Private Equity Buyout Activity - Quarterly(excluding Japan)
Value(US$bn)
Volume
0
25
50
75
100
125
150
175
0
5
10
15
20
25
30
35
40
45
50
55
60
Volu
me o
f Dea
ls
Valu
e of D
eals
($bn
)
Asia-Pacific (excl. Japan) Inbound/Outbound M&A
InboundValue($bn)OutboundValue($bn)InboundVolumeOutboundVolume
Press Release: www.mergermarket.com 39Press Release: www.mergermarket.com 39
Asia-Pacific (ex. Japan) M&A Overview
mergermarket M&A Round-up for Year End 2011
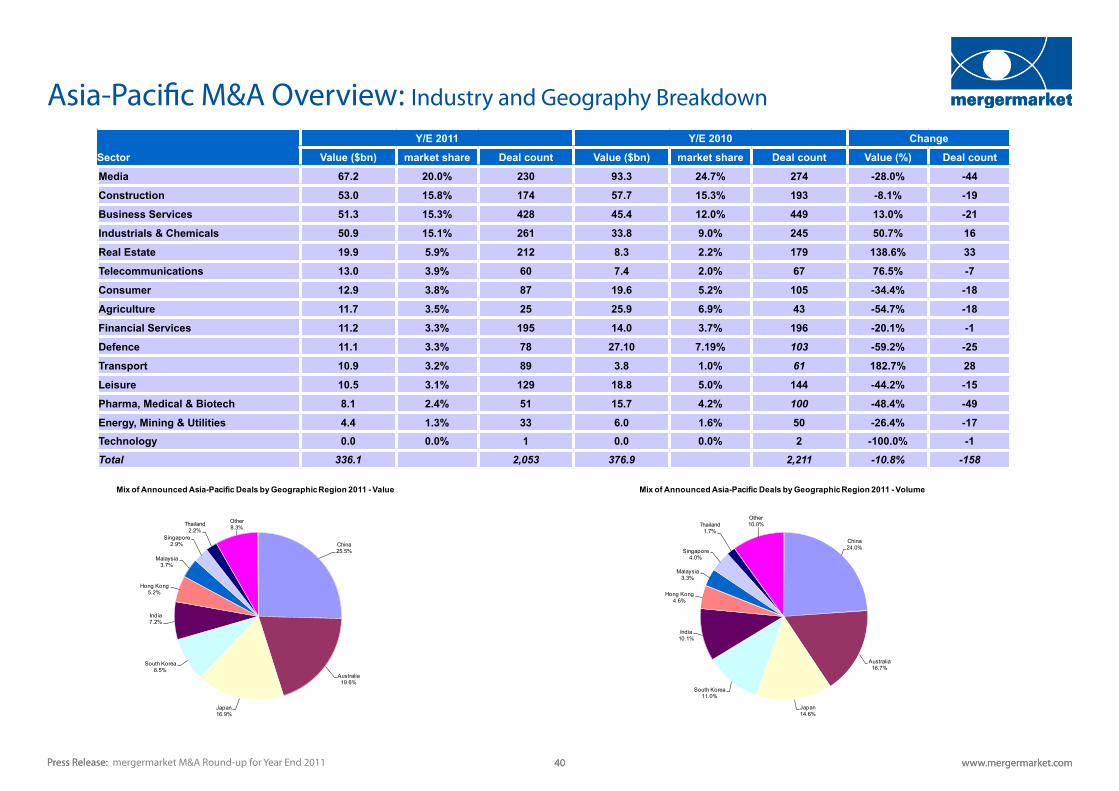
Press Release: www.mergermarket.com 40Press Release: www.mergermarket.com 40mergermarket M&A Round-up for Year End 2011
Asia-Pacific M&A Overview: Industry and Geography Breakdown
China25.5%
Australia19.6%
Japan16.9%
South Korea8.5%
India7.2%
HongKong5.2%
Malaysia3.7%
Singapore2.9%
Thailand2.2%
Other8.3%
Mix of Announced Asia-Pacific Deals by Geographic Region 2011 - Value
China24.0%
Australia16.7%
Japan14.6%
South Korea11.0%
India10.1%
HongKong4.6%
Malaysia3.3%
Singapore4.0%
Thailand1.7%
Other10.0%
Mix of Announced Asia-Pacific Deals by Geographic Region 2011 - Volume
Y/E 2011 Y/E 2010 Change
Sector Value ($bn) market share Deal count Value ($bn) market share Deal count Value (%) Deal count
Media 67.2 20.0% 230 93.3 24.7% 274 -28.0% -44
Construction 53.0 15.8% 174 57.7 15.3% 193 -8.1% -19
Business Services 51.3 15.3% 428 45.4 12.0% 449 13.0% -21
Industrials & Chemicals 50.9 15.1% 261 33.8 9.0% 245 50.7% 16
Real Estate 19.9 5.9% 212 8.3 2.2% 179 138.6% 33
Telecommunications 13.0 3.9% 60 7.4 2.0% 67 76.5% -7
Consumer 12.9 3.8% 87 19.6 5.2% 105 -34.4% -18
Agriculture 11.7 3.5% 25 25.9 6.9% 43 -54.7% -18
Financial Services 11.2 3.3% 195 14.0 3.7% 196 -20.1% -1
Defence 11.1 3.3% 78 27.10 7.19% 103 -59.2% -25
Transport 10.9 3.2% 89 3.8 1.0% 61 182.7% 28
Leisure 10.5 3.1% 129 18.8 5.0% 144 -44.2% -15
Pharma, Medical & Biotech 8.1 2.4% 51 15.7 4.2% 100 -48.4% -49
Energy, Mining & Utilities 4.4 1.3% 33 6.0 1.6% 50 -26.4% -17Technology 0.0 0.0% 1 0.0 0.0% 2 -100.0% -1
Total 336.1 2,053 376.9 2,211 -10.8% -158
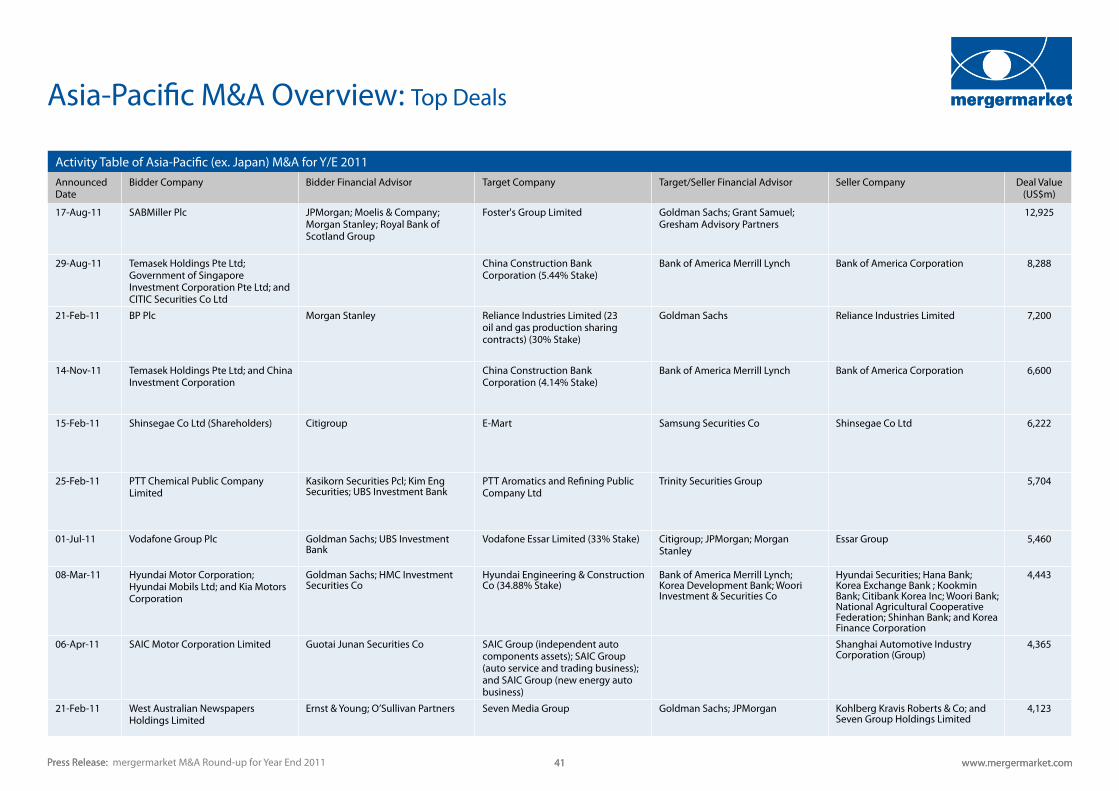
Press Release: www.mergermarket.com 41Press Release: www.mergermarket.com 41mergermarket M&A Round-up for Year End 2011
Asia-Pacific M&A Overview: Top Deals
Activity Table of Asia-Pacific (ex. Japan) M&A for Y/E 2011 Announced Date
Bidder Company Bidder Financial Advisor Target Company Target/Seller Financial Advisor Seller Company Deal Value (US$m)
17-Aug-11 SABMiller Plc JPMorgan; Moelis & Company; Morgan Stanley; Royal Bank of Scotland Group
Foster's Group Limited Goldman Sachs; Grant Samuel; Gresham Advisory Partners
12,925
29-Aug-11 Temasek Holdings Pte Ltd; Government of Singapore Investment Corporation Pte Ltd; and CITIC Securities Co Ltd
China Construction Bank Corporation (5.44% Stake)
Bank of America Merrill Lynch Bank of America Corporation 8,288
21-Feb-11 BP Plc Morgan Stanley Reliance Industries Limited (23 oil and gas production sharing contracts) (30% Stake)
Goldman Sachs Reliance Industries Limited 7,200
14-Nov-11 Temasek Holdings Pte Ltd; and China Investment Corporation
China Construction Bank Corporation (4.14% Stake)
Bank of America Merrill Lynch Bank of America Corporation 6,600
15-Feb-11 Shinsegae Co Ltd (Shareholders) Citigroup E-Mart Samsung Securities Co Shinsegae Co Ltd 6,222
25-Feb-11 PTT Chemical Public Company Limited
Kasikorn Securities Pcl; Kim Eng Securities; UBS Investment Bank
PTT Aromatics and Refining Public Company Ltd
Trinity Securities Group 5,704
01-Jul-11 Vodafone Group Plc Goldman Sachs; UBS Investment Bank
Vodafone Essar Limited (33% Stake) Citigroup; JPMorgan; Morgan Stanley
Essar Group 5,460
08-Mar-11 Hyundai Motor Corporation; Hyundai Mobils Ltd; and Kia Motors Corporation
Goldman Sachs; HMC Investment Securities Co
Hyundai Engineering & Construction Co (34.88% Stake)
Bank of America Merrill Lynch; Korea Development Bank; Woori Investment & Securities Co
Hyundai Securities; Hana Bank; Korea Exchange Bank ; Kookmin Bank; Citibank Korea Inc; Woori Bank; National Agricultural Cooperative Federation; Shinhan Bank; and Korea Finance Corporation
4,443
06-Apr-11 SAIC Motor Corporation Limited Guotai Junan Securities Co SAIC Group (independent auto components assets); SAIC Group (auto service and trading business); and SAIC Group (new energy auto business)
Shanghai Automotive Industry Corporation (Group)
4,365
21-Feb-11 West Australian Newspapers Holdings Limited
Ernst & Young; O’Sullivan Partners Seven Media Group Goldman Sachs; JPMorgan Kohlberg Kravis Roberts & Co; and Seven Group Holdings Limited
4,123
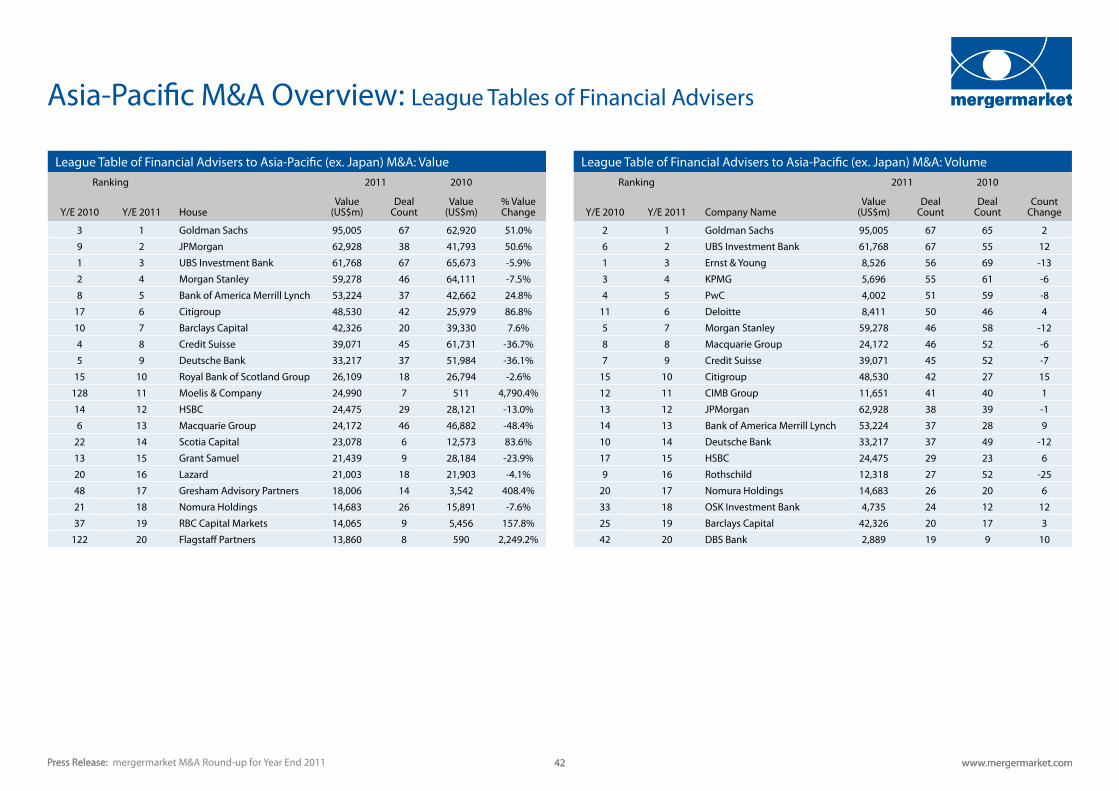
Press Release: www.mergermarket.com 42Press Release: www.mergermarket.com 42mergermarket M&A Round-up for Year End 2011
Asia-Pacific M&A Overview: League Tables of Financial Advisers
League Table of Financial Advisers to Asia-Pacific (ex. Japan) M&A: ValueRanking 2011 2010
Y/E 2010 Y/E 2011 HouseValue
(US$m)Deal
CountValue
(US$m)% Value Change
3 1 Goldman Sachs 95,005 67 62,920 51.0%
9 2 JPMorgan 62,928 38 41,793 50.6%
1 3 UBS Investment Bank 61,768 67 65,673 -5.9%
2 4 Morgan Stanley 59,278 46 64,111 -7.5%
8 5 Bank of America Merrill Lynch 53,224 37 42,662 24.8%
17 6 Citigroup 48,530 42 25,979 86.8%
10 7 Barclays Capital 42,326 20 39,330 7.6%
4 8 Credit Suisse 39,071 45 61,731 -36.7%
5 9 Deutsche Bank 33,217 37 51,984 -36.1%
15 10 Royal Bank of Scotland Group 26,109 18 26,794 -2.6%
128 11 Moelis & Company 24,990 7 511 4,790.4%
14 12 HSBC 24,475 29 28,121 -13.0%
6 13 Macquarie Group 24,172 46 46,882 -48.4%
22 14 Scotia Capital 23,078 6 12,573 83.6%
13 15 Grant Samuel 21,439 9 28,184 -23.9%
20 16 Lazard 21,003 18 21,903 -4.1%
48 17 Gresham Advisory Partners 18,006 14 3,542 408.4%
21 18 Nomura Holdings 14,683 26 15,891 -7.6%
37 19 RBC Capital Markets 14,065 9 5,456 157.8%
122 20 Flagstaff Partners 13,860 8 590 2,249.2%
League Table of Financial Advisers to Asia-Pacific (ex. Japan) M&A: VolumeRanking 2011 2010
Y/E 2010 Y/E 2011 Company NameValue
(US$m)Deal
CountDeal
Count Count
Change
2 1 Goldman Sachs 95,005 67 65 2
6 2 UBS Investment Bank 61,768 67 55 12
1 3 Ernst & Young 8,526 56 69 -13
3 4 KPMG 5,696 55 61 -6
4 5 PwC 4,002 51 59 -8
11 6 Deloitte 8,411 50 46 4
5 7 Morgan Stanley 59,278 46 58 -12
8 8 Macquarie Group 24,172 46 52 -6
7 9 Credit Suisse 39,071 45 52 -7
15 10 Citigroup 48,530 42 27 15
12 11 CIMB Group 11,651 41 40 1
13 12 JPMorgan 62,928 38 39 -1
14 13 Bank of America Merrill Lynch 53,224 37 28 9
10 14 Deutsche Bank 33,217 37 49 -12
17 15 HSBC 24,475 29 23 6
9 16 Rothschild 12,318 27 52 -25
20 17 Nomura Holdings 14,683 26 20 6
33 18 OSK Investment Bank 4,735 24 12 12
25 19 Barclays Capital 42,326 20 17 3
42 20 DBS Bank 2,889 19 9 10
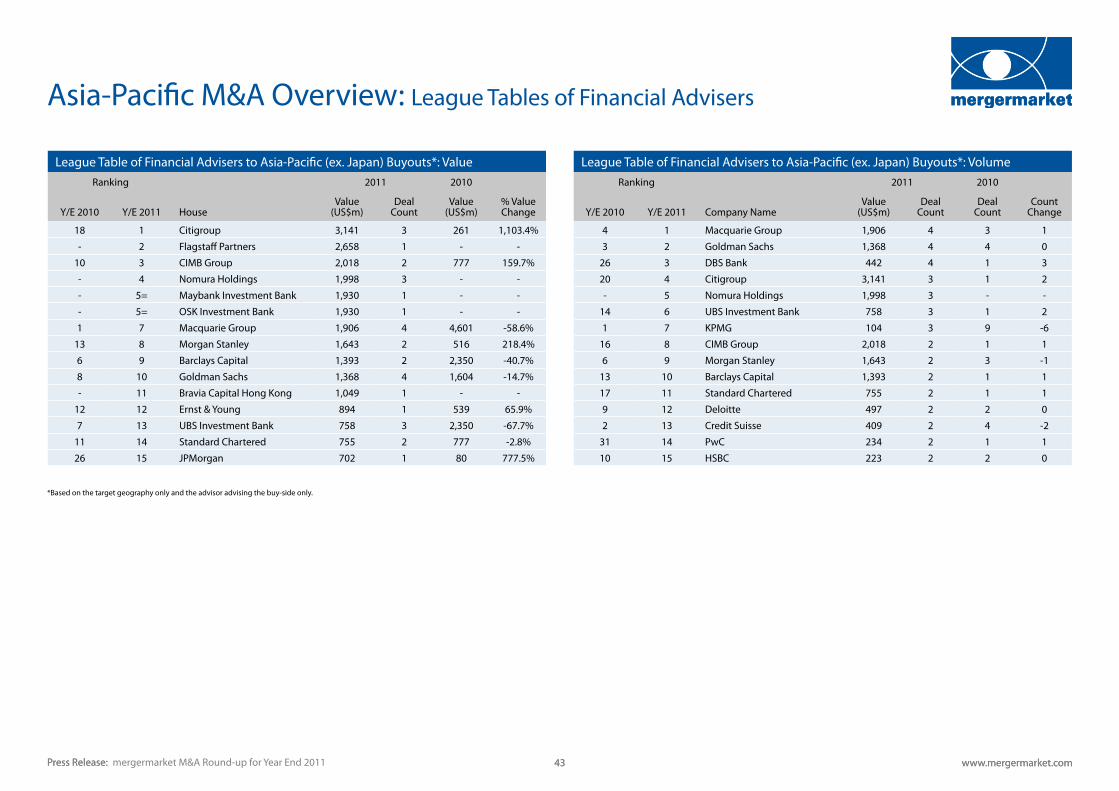
Press Release: www.mergermarket.com 43Press Release: www.mergermarket.com 43mergermarket M&A Round-up for Year End 2011
Asia-Pacific M&A Overview: League Tables of Financial Advisers
League Table of Financial Advisers to Asia-Pacific (ex. Japan) Buyouts*: ValueRanking 2011 2010
Y/E 2010 Y/E 2011 HouseValue
(US$m)Deal
CountValue
(US$m)% Value Change
18 1 Citigroup 3,141 3 261 1,103.4%
- 2 Flagstaff Partners 2,658 1 - -
10 3 CIMB Group 2,018 2 777 159.7%
- 4 Nomura Holdings 1,998 3 - -
- 5= Maybank Investment Bank 1,930 1 - -
- 5= OSK Investment Bank 1,930 1 - -
1 7 Macquarie Group 1,906 4 4,601 -58.6%
13 8 Morgan Stanley 1,643 2 516 218.4%
6 9 Barclays Capital 1,393 2 2,350 -40.7%
8 10 Goldman Sachs 1,368 4 1,604 -14.7%
- 11 Bravia Capital Hong Kong 1,049 1 - -
12 12 Ernst & Young 894 1 539 65.9%
7 13 UBS Investment Bank 758 3 2,350 -67.7%
11 14 Standard Chartered 755 2 777 -2.8%
26 15 JPMorgan 702 1 80 777.5%
*Based on the target geography only and the advisor advising the buy-side only.
League Table of Financial Advisers to Asia-Pacific (ex. Japan) Buyouts*: VolumeRanking 2011 2010
Y/E 2010 Y/E 2011 Company NameValue
(US$m)Deal
CountDeal
Count Count
Change
4 1 Macquarie Group 1,906 4 3 1
3 2 Goldman Sachs 1,368 4 4 0
26 3 DBS Bank 442 4 1 3
20 4 Citigroup 3,141 3 1 2
- 5 Nomura Holdings 1,998 3 - -
14 6 UBS Investment Bank 758 3 1 2
1 7 KPMG 104 3 9 -6
16 8 CIMB Group 2,018 2 1 1
6 9 Morgan Stanley 1,643 2 3 -1
13 10 Barclays Capital 1,393 2 1 1
17 11 Standard Chartered 755 2 1 1
9 12 Deloitte 497 2 2 0
2 13 Credit Suisse 409 2 4 -2
31 14 PwC 234 2 1 1
10 15 HSBC 223 2 2 0

Press Release: www.mergermarket.com 44Press Release: www.mergermarket.com 44mergermarket M&A Round-up for Year End 2011
Asia-Pacific M&A Overview: League Tables of Financial AdvisersFinancial Advisers to Asia (ex. Japan) M&A: Value
Ranking 2011 2010
Y/E 2010 Y/E 2011 HouseValue
(US$m)Deal
CountValue
(US$m)% Value Change
2 1 Goldman Sachs 46,858 34 44,244 5.9%
11 2 Bank of America Merrill Lynch 46,376 26 26,437 75.4%
16 3 Citigroup 42,736 36 20,468 108.8%
1 4 Morgan Stanley 41,192 37 54,726 -24.7%
5 5 UBS Investment Bank 37,069 43 36,136 2.6%
3 6 Credit Suisse 27,526 34 42,963 -35.9%
4 7 JPMorgan 27,238 25 36,417 -25.2%
15 8 HSBC 24,029 26 20,987 14.5%
10 9 Deutsche Bank 22,550 28 30,044 -24.9%
7 10 China International Capital Corporation 12,686 12 35,560 -64.3%
8 11 Barclays Capital 12,643 15 34,609 -63.5%
14 12 Royal Bank of Scotland Group 12,265 13 22,757 -46.1%
43 13 RBC Capital Markets 12,054 5 3,116 286.8%
13 14 CIMB Group 11,661 41 23,166 -49.7%
61 15 Korea Development Bank 11,145 10 1,874 494.7%
Financial Advisers to Asia (ex. Japan) M&A: VolumeRanking 2011 2010
Y/E 2010 Y/E 2011 Company NameValue
(US$m)Deal
CountDeal
Count Count
Change
9 1 UBS Investment Bank 37,069 43 35 8
4 2 CIMB Group 11,661 41 40 1
2 3 Morgan Stanley 41,192 37 48 -11
15 4 Citigroup 42,736 36 22 14
1 5 Ernst & Young 2,380 36 52 -16
8 6 Goldman Sachs 46,858 34 37 -3
5 7 Credit Suisse 27,526 34 39 -5
7 8 KPMG 4,226 34 39 -5
3 9 PwC 2,357 31 47 -16
10 10 Deutsche Bank 22,550 28 35 -7
11 11 Deloitte 4,445 28 31 -3
19 12 Bank of America Merrill Lynch 46,376 26 18 8
16 13 HSBC 24,029 26 21 5
12 14 JPMorgan 27,238 25 28 -3
30 15 OSK Investment Bank 4,714 24 12 12
Financial Advisers to Greater China M&A: ValueRanking 2011 2010
Y/E 2010 Y/E 2011 HouseValue
(US$m)Deal
CountValue
(US$m)% Value Change
15 1 Bank of America Merrill Lynch 25,554 12 5,783 341.9%
13 2 UBS Investment Bank 22,194 29 6,635 234.5%
3 3 Goldman Sachs 18,659 20 15,829 17.9%
16 4 Citigroup 18,165 19 5,348 239.7%
2 5 Deutsche Bank 17,411 17 19,656 -11.4%
5 6 Morgan Stanley 16,526 16 13,920 18.7%
8 7 JPMorgan 16,444 17 10,975 49.8%
4 8 Credit Suisse 12,918 17 14,097 -8.4%
1 9 China International Capital Corporation 12,686 12 35,560 -64.3%
99 10 RBC Capital Markets 10,841 4 211 5,037.9%
24 11 HSBC 9,153 10 2,906 215.0%
7 12 CITIC Securities Co 8,327 15 12,555 -33.7%
10 13 Barclays Capital 8,050 8 9,323 -13.7%
14 14 Rothschild 6,775 9 5,952 13.8%
6 15 BNP Paribas 6,607 8 13,586 -51.4%
Financial Advisers to Greater China M&A: VolumeRanking 2011 2010
Y/E 2010 Y/E 2011 Company NameValue
(US$m)Deal
CountDeal
Count Count
Change
9 1 UBS Investment Bank 22,194 29 13 16
5 2 Goldman Sachs 18,659 20 16 4
14 3 Citigroup 18,165 19 9 10
2 4 Deutsche Bank 17,411 17 20 -3
12 5 JPMorgan 16,444 17 10 7
6 6 Credit Suisse 12,918 17 15 2
4 7 Morgan Stanley 16,526 16 18 -2
8 8 CITIC Securities Co 8,327 15 13 2
11 9 CIMB Group 1,970 14 11 3
13 10 Somerley Limited 1,497 14 10 4
23 11 Bank of America Merrill Lynch 25,554 12 6 6
1 12 China International Capital Corporation 12,686 12 22 -10
7 13 PwC 1,515 11 15 -4
28 14 HSBC 9,153 10 5 5
18 15 Nomura Holdings 5,030 10 8 2
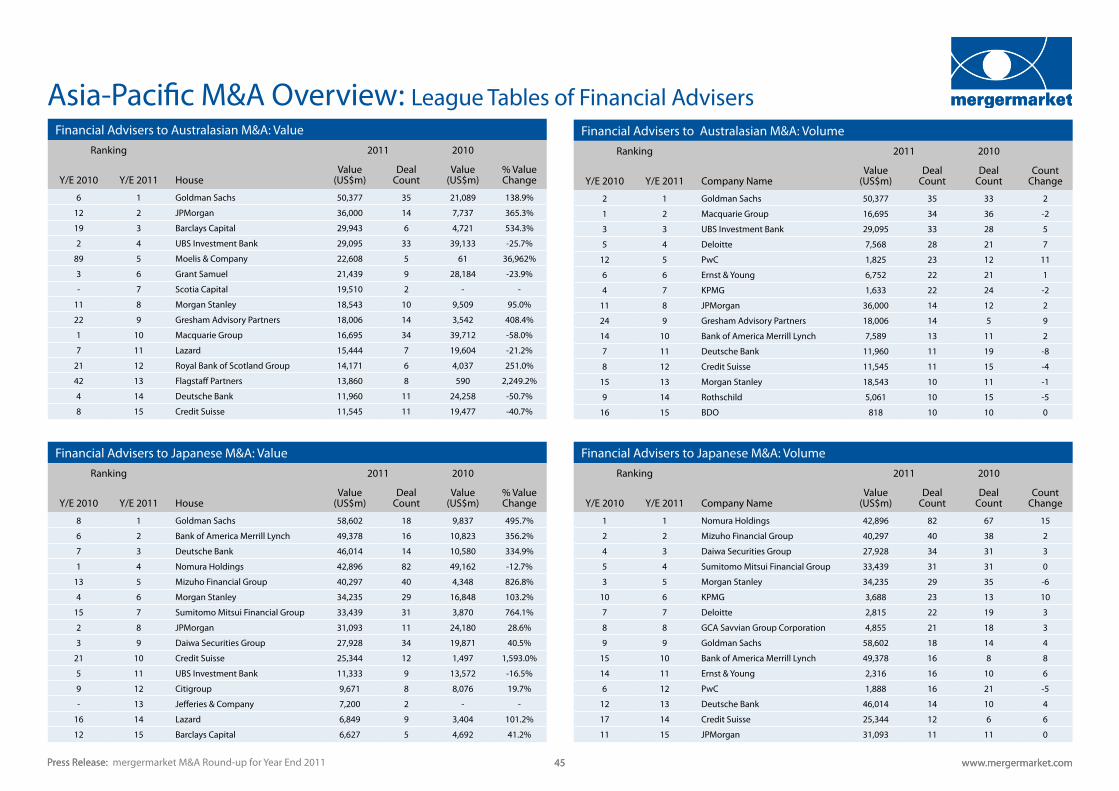
Press Release: www.mergermarket.com 45Press Release: www.mergermarket.com 45mergermarket M&A Round-up for Year End 2011
Asia-Pacific M&A Overview: League Tables of Financial AdvisersFinancial Advisers to Australasian M&A: Volume
Ranking 2011 2010
Y/E 2010 Y/E 2011 Company NameValue
(US$m)Deal
CountDeal
Count Count
Change
2 1 Goldman Sachs 50,377 35 33 2
1 2 Macquarie Group 16,695 34 36 -2
3 3 UBS Investment Bank 29,095 33 28 5
5 4 Deloitte 7,568 28 21 7
12 5 PwC 1,825 23 12 11
6 6 Ernst & Young 6,752 22 21 1
4 7 KPMG 1,633 22 24 -2
11 8 JPMorgan 36,000 14 12 2
24 9 Gresham Advisory Partners 18,006 14 5 9
14 10 Bank of America Merrill Lynch 7,589 13 11 2
7 11 Deutsche Bank 11,960 11 19 -8
8 12 Credit Suisse 11,545 11 15 -4
15 13 Morgan Stanley 18,543 10 11 -1
9 14 Rothschild 5,061 10 15 -5
16 15 BDO 818 10 10 0
Financial Advisers to Australasian M&A: ValueRanking 2011 2010
Y/E 2010 Y/E 2011 HouseValue
(US$m)Deal
CountValue
(US$m)% Value Change
6 1 Goldman Sachs 50,377 35 21,089 138.9%
12 2 JPMorgan 36,000 14 7,737 365.3%
19 3 Barclays Capital 29,943 6 4,721 534.3%
2 4 UBS Investment Bank 29,095 33 39,133 -25.7%
89 5 Moelis & Company 22,608 5 61 36,962%
3 6 Grant Samuel 21,439 9 28,184 -23.9%
- 7 Scotia Capital 19,510 2 - -
11 8 Morgan Stanley 18,543 10 9,509 95.0%
22 9 Gresham Advisory Partners 18,006 14 3,542 408.4%
1 10 Macquarie Group 16,695 34 39,712 -58.0%
7 11 Lazard 15,444 7 19,604 -21.2%
21 12 Royal Bank of Scotland Group 14,171 6 4,037 251.0%
42 13 Flagstaff Partners 13,860 8 590 2,249.2%
4 14 Deutsche Bank 11,960 11 24,258 -50.7%
8 15 Credit Suisse 11,545 11 19,477 -40.7%
Financial Advisers to Japanese M&A: ValueRanking 2011 2010
Y/E 2010 Y/E 2011 HouseValue
(US$m)Deal
CountValue
(US$m)% Value Change
8 1 Goldman Sachs 58,602 18 9,837 495.7%
6 2 Bank of America Merrill Lynch 49,378 16 10,823 356.2%
7 3 Deutsche Bank 46,014 14 10,580 334.9%
1 4 Nomura Holdings 42,896 82 49,162 -12.7%
13 5 Mizuho Financial Group 40,297 40 4,348 826.8%
4 6 Morgan Stanley 34,235 29 16,848 103.2%
15 7 Sumitomo Mitsui Financial Group 33,439 31 3,870 764.1%
2 8 JPMorgan 31,093 11 24,180 28.6%
3 9 Daiwa Securities Group 27,928 34 19,871 40.5%
21 10 Credit Suisse 25,344 12 1,497 1,593.0%
5 11 UBS Investment Bank 11,333 9 13,572 -16.5%
9 12 Citigroup 9,671 8 8,076 19.7%
- 13 Jefferies & Company 7,200 2 - -
16 14 Lazard 6,849 9 3,404 101.2%
12 15 Barclays Capital 6,627 5 4,692 41.2%
Financial Advisers to Japanese M&A: VolumeRanking 2011 2010
Y/E 2010 Y/E 2011 Company NameValue
(US$m)Deal
CountDeal
Count Count
Change
1 1 Nomura Holdings 42,896 82 67 15
2 2 Mizuho Financial Group 40,297 40 38 2
4 3 Daiwa Securities Group 27,928 34 31 3
5 4 Sumitomo Mitsui Financial Group 33,439 31 31 0
3 5 Morgan Stanley 34,235 29 35 -6
10 6 KPMG 3,688 23 13 10
7 7 Deloitte 2,815 22 19 3
8 8 GCA Savvian Group Corporation 4,855 21 18 3
9 9 Goldman Sachs 58,602 18 14 4
15 10 Bank of America Merrill Lynch 49,378 16 8 8
14 11 Ernst & Young 2,316 16 10 6
6 12 PwC 1,888 16 21 -5
12 13 Deutsche Bank 46,014 14 10 4
17 14 Credit Suisse 25,344 12 6 6
11 15 JPMorgan 31,093 11 11 0
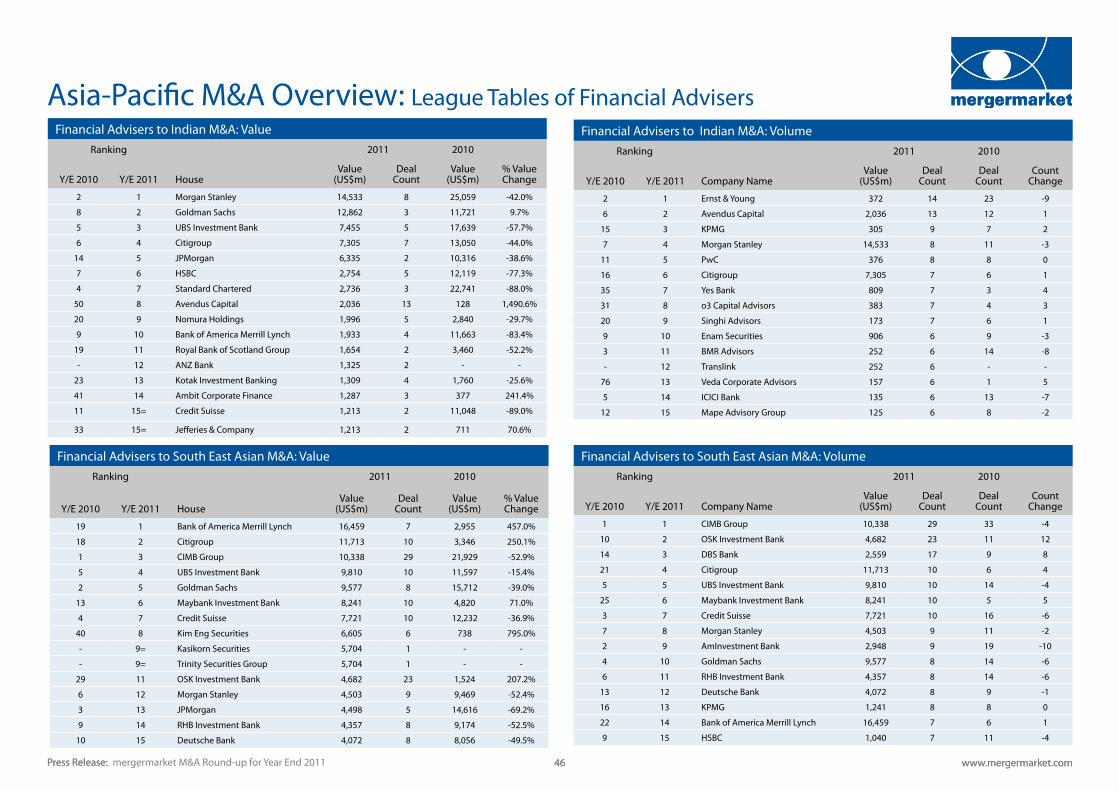
Press Release: www.mergermarket.com 46Press Release: www.mergermarket.com 46mergermarket M&A Round-up for Year End 2011
Asia-Pacific M&A Overview: League Tables of Financial AdvisersFinancial Advisers to Indian M&A: Value
Ranking 2011 2010
Y/E 2010 Y/E 2011 HouseValue
(US$m)Deal
CountValue
(US$m)% Value Change
2 1 Morgan Stanley 14,533 8 25,059 -42.0%
8 2 Goldman Sachs 12,862 3 11,721 9.7%
5 3 UBS Investment Bank 7,455 5 17,639 -57.7%
6 4 Citigroup 7,305 7 13,050 -44.0%
14 5 JPMorgan 6,335 2 10,316 -38.6%
7 6 HSBC 2,754 5 12,119 -77.3%
4 7 Standard Chartered 2,736 3 22,741 -88.0%
50 8 Avendus Capital 2,036 13 128 1,490.6%
20 9 Nomura Holdings 1,996 5 2,840 -29.7%
9 10 Bank of America Merrill Lynch 1,933 4 11,663 -83.4%
19 11 Royal Bank of Scotland Group 1,654 2 3,460 -52.2%
- 12 ANZ Bank 1,325 2 - -
23 13 Kotak Investment Banking 1,309 4 1,760 -25.6%
41 14 Ambit Corporate Finance 1,287 3 377 241.4%
11 15= Credit Suisse 1,213 2 11,048 -89.0%
33 15= Jefferies & Company 1,213 2 711 70.6%
Financial Advisers to Indian M&A: VolumeRanking 2011 2010
Y/E 2010 Y/E 2011 Company NameValue
(US$m)Deal
CountDeal
Count Count
Change
2 1 Ernst & Young 372 14 23 -9
6 2 Avendus Capital 2,036 13 12 1
15 3 KPMG 305 9 7 2
7 4 Morgan Stanley 14,533 8 11 -3
11 5 PwC 376 8 8 0
16 6 Citigroup 7,305 7 6 1
35 7 Yes Bank 809 7 3 4
31 8 o3 Capital Advisors 383 7 4 3
20 9 Singhi Advisors 173 7 6 1
9 10 Enam Securities 906 6 9 -3
3 11 BMR Advisors 252 6 14 -8
- 12 Translink 252 6 - -
76 13 Veda Corporate Advisors 157 6 1 5
5 14 ICICI Bank 135 6 13 -7
12 15 Mape Advisory Group 125 6 8 -2
Financial Advisers to South East Asian M&A: ValueRanking 2011 2010
Y/E 2010 Y/E 2011 HouseValue
(US$m)Deal
CountValue
(US$m)% Value Change
19 1 Bank of America Merrill Lynch 16,459 7 2,955 457.0%
18 2 Citigroup 11,713 10 3,346 250.1%
1 3 CIMB Group 10,338 29 21,929 -52.9%
5 4 UBS Investment Bank 9,810 10 11,597 -15.4%
2 5 Goldman Sachs 9,577 8 15,712 -39.0%
13 6 Maybank Investment Bank 8,241 10 4,820 71.0%
4 7 Credit Suisse 7,721 10 12,232 -36.9%
40 8 Kim Eng Securities 6,605 6 738 795.0%
- 9= Kasikorn Securities 5,704 1 - -
- 9= Trinity Securities Group 5,704 1 - -
29 11 OSK Investment Bank 4,682 23 1,524 207.2%
6 12 Morgan Stanley 4,503 9 9,469 -52.4%
3 13 JPMorgan 4,498 5 14,616 -69.2%
9 14 RHB Investment Bank 4,357 8 9,174 -52.5%
10 15 Deutsche Bank 4,072 8 8,056 -49.5%
Financial Advisers to South East Asian M&A: VolumeRanking 2011 2010
Y/E 2010 Y/E 2011 Company NameValue
(US$m)Deal
CountDeal
Count Count
Change
1 1 CIMB Group 10,338 29 33 -4
10 2 OSK Investment Bank 4,682 23 11 12
14 3 DBS Bank 2,559 17 9 8
21 4 Citigroup 11,713 10 6 4
5 5 UBS Investment Bank 9,810 10 14 -4
25 6 Maybank Investment Bank 8,241 10 5 5
3 7 Credit Suisse 7,721 10 16 -6
7 8 Morgan Stanley 4,503 9 11 -2
2 9 AmInvestment Bank 2,948 9 19 -10
4 10 Goldman Sachs 9,577 8 14 -6
6 11 RHB Investment Bank 4,357 8 14 -6
13 12 Deutsche Bank 4,072 8 9 -1
16 13 KPMG 1,241 8 8 0
22 14 Bank of America Merrill Lynch 16,459 7 6 1
9 15 HSBC 1,040 7 11 -4
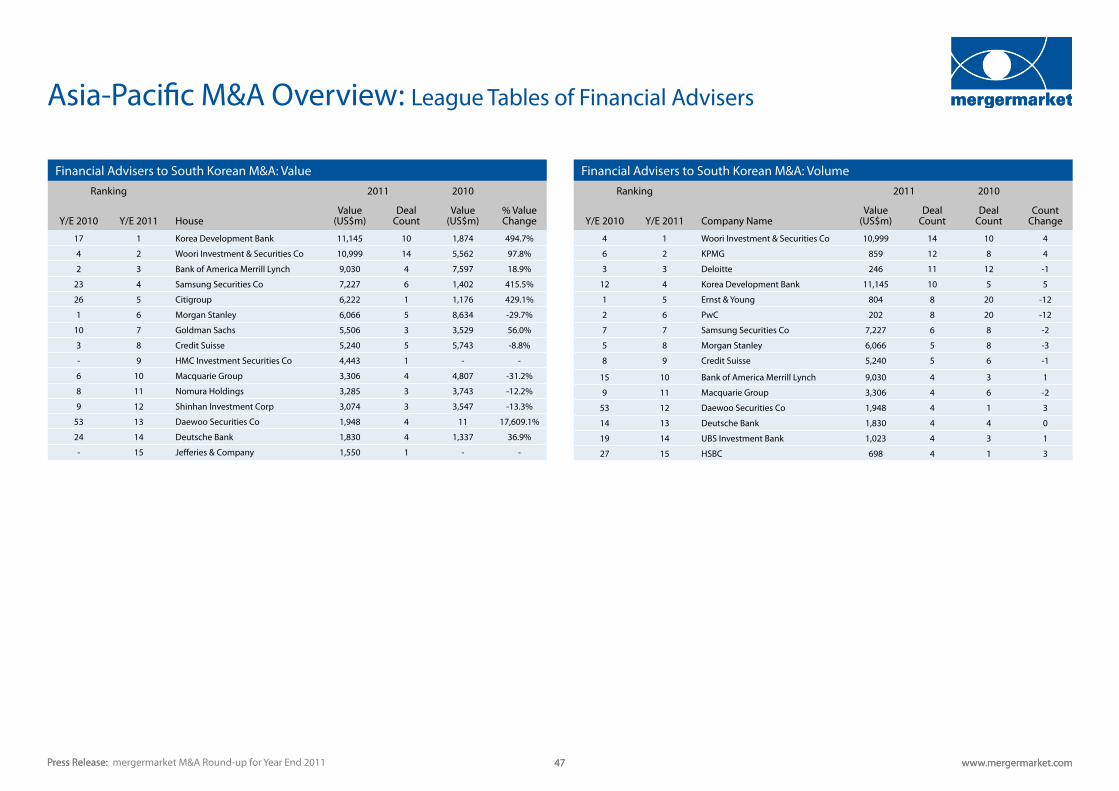
Press Release: www.mergermarket.com 47Press Release: www.mergermarket.com 47mergermarket M&A Round-up for Year End 2011
Asia-Pacific M&A Overview: League Tables of Financial Advisers
Financial Advisers to South Korean M&A: ValueRanking 2011 2010
Y/E 2010 Y/E 2011 HouseValue
(US$m)Deal
CountValue
(US$m)% Value Change
17 1 Korea Development Bank 11,145 10 1,874 494.7%
4 2 Woori Investment & Securities Co 10,999 14 5,562 97.8%
2 3 Bank of America Merrill Lynch 9,030 4 7,597 18.9%
23 4 Samsung Securities Co 7,227 6 1,402 415.5%
26 5 Citigroup 6,222 1 1,176 429.1%
1 6 Morgan Stanley 6,066 5 8,634 -29.7%
10 7 Goldman Sachs 5,506 3 3,529 56.0%
3 8 Credit Suisse 5,240 5 5,743 -8.8%
- 9 HMC Investment Securities Co 4,443 1 - -
6 10 Macquarie Group 3,306 4 4,807 -31.2%
8 11 Nomura Holdings 3,285 3 3,743 -12.2%
9 12 Shinhan Investment Corp 3,074 3 3,547 -13.3%
53 13 Daewoo Securities Co 1,948 4 11 17,609.1%
24 14 Deutsche Bank 1,830 4 1,337 36.9%
- 15 Jefferies & Company 1,550 1 - -
Financial Advisers to South Korean M&A: VolumeRanking 2011 2010
Y/E 2010 Y/E 2011 Company NameValue
(US$m)Deal
CountDeal
Count Count
Change
4 1 Woori Investment & Securities Co 10,999 14 10 4
6 2 KPMG 859 12 8 4
3 3 Deloitte 246 11 12 -1
12 4 Korea Development Bank 11,145 10 5 5
1 5 Ernst & Young 804 8 20 -12
2 6 PwC 202 8 20 -12
7 7 Samsung Securities Co 7,227 6 8 -2
5 8 Morgan Stanley 6,066 5 8 -3
8 9 Credit Suisse 5,240 5 6 -1
15 10 Bank of America Merrill Lynch 9,030 4 3 1
9 11 Macquarie Group 3,306 4 6 -2
53 12 Daewoo Securities Co 1,948 4 1 3
14 13 Deutsche Bank 1,830 4 4 0
19 14 UBS Investment Bank 1,023 4 3 1
27 15 HSBC 698 4 1 3
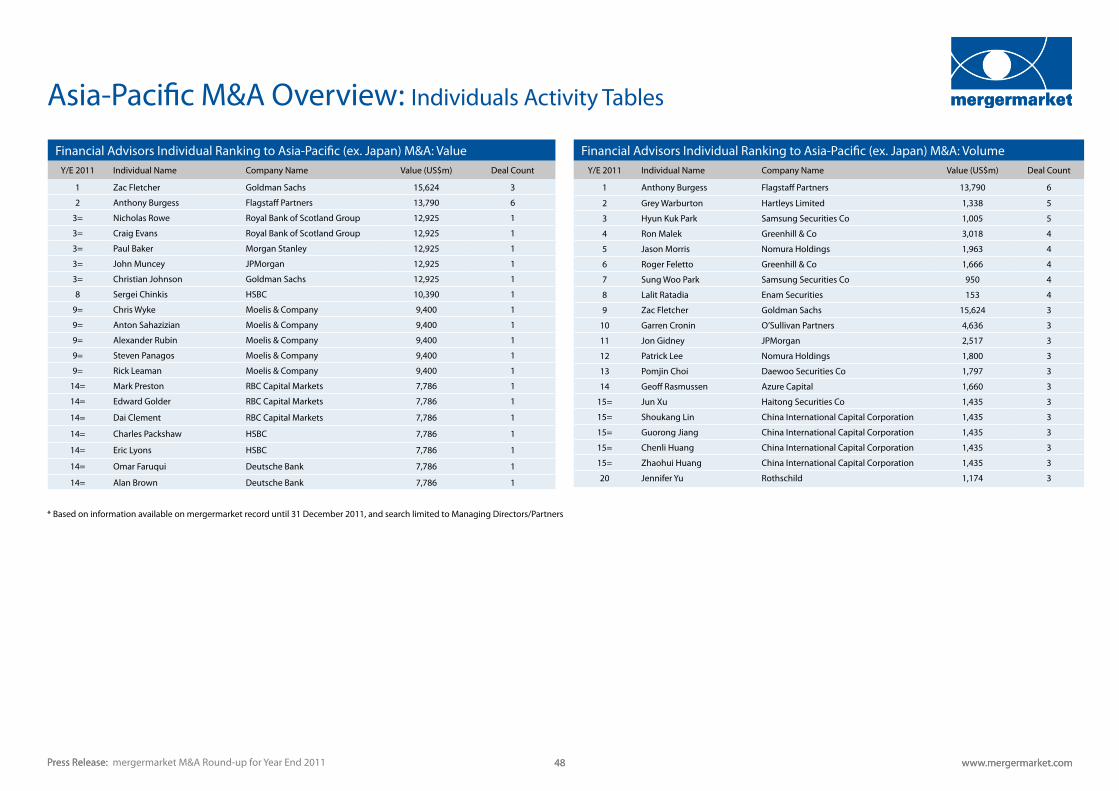
Press Release: www.mergermarket.com 48Press Release: www.mergermarket.com 48mergermarket M&A Round-up for Year End 2011
Asia-Pacific M&A Overview: Individuals Activity Tables
Financial Advisors Individual Ranking to Asia-Pacific (ex. Japan) M&A: ValueY/E 2011 Individual Name Company Name Value (US$m) Deal Count
1 Zac Fletcher Goldman Sachs 15,624 3
2 Anthony Burgess Flagstaff Partners 13,790 6
3= Nicholas Rowe Royal Bank of Scotland Group 12,925 1
3= Craig Evans Royal Bank of Scotland Group 12,925 1
3= Paul Baker Morgan Stanley 12,925 1
3= John Muncey JPMorgan 12,925 1
3= Christian Johnson Goldman Sachs 12,925 1
8 Sergei Chinkis HSBC 10,390 1
9= Chris Wyke Moelis & Company 9,400 1
9= Anton Sahazizian Moelis & Company 9,400 1
9= Alexander Rubin Moelis & Company 9,400 1
9= Steven Panagos Moelis & Company 9,400 1
9= Rick Leaman Moelis & Company 9,400 1
14= Mark Preston RBC Capital Markets 7,786 1
14= Edward Golder RBC Capital Markets 7,786 1
14= Dai Clement RBC Capital Markets 7,786 1
14= Charles Packshaw HSBC 7,786 1
14= Eric Lyons HSBC 7,786 1
14= Omar Faruqui Deutsche Bank 7,786 1
14= Alan Brown Deutsche Bank 7,786 1
Financial Advisors Individual Ranking to Asia-Pacific (ex. Japan) M&A: VolumeY/E 2011 Individual Name Company Name Value (US$m) Deal Count
1 Anthony Burgess Flagstaff Partners 13,790 6
2 Grey Warburton Hartleys Limited 1,338 5
3 Hyun Kuk Park Samsung Securities Co 1,005 5
4 Ron Malek Greenhill & Co 3,018 4
5 Jason Morris Nomura Holdings 1,963 4
6 Roger Feletto Greenhill & Co 1,666 4
7 Sung Woo Park Samsung Securities Co 950 4
8 Lalit Ratadia Enam Securities 153 4
9 Zac Fletcher Goldman Sachs 15,624 3
10 Garren Cronin O’Sullivan Partners 4,636 3
11 Jon Gidney JPMorgan 2,517 3
12 Patrick Lee Nomura Holdings 1,800 3
13 Pomjin Choi Daewoo Securities Co 1,797 3
14 Geoff Rasmussen Azure Capital 1,660 3
15= Jun Xu Haitong Securities Co 1,435 3
15= Shoukang Lin China International Capital Corporation 1,435 3
15= Guorong Jiang China International Capital Corporation 1,435 3
15= Chenli Huang China International Capital Corporation 1,435 3
15= Zhaohui Huang China International Capital Corporation 1,435 3
20 Jennifer Yu Rothschild 1,174 3
* Based on information available on mergermarket record until 31 December 2011, and search limited to Managing Directors/Partners
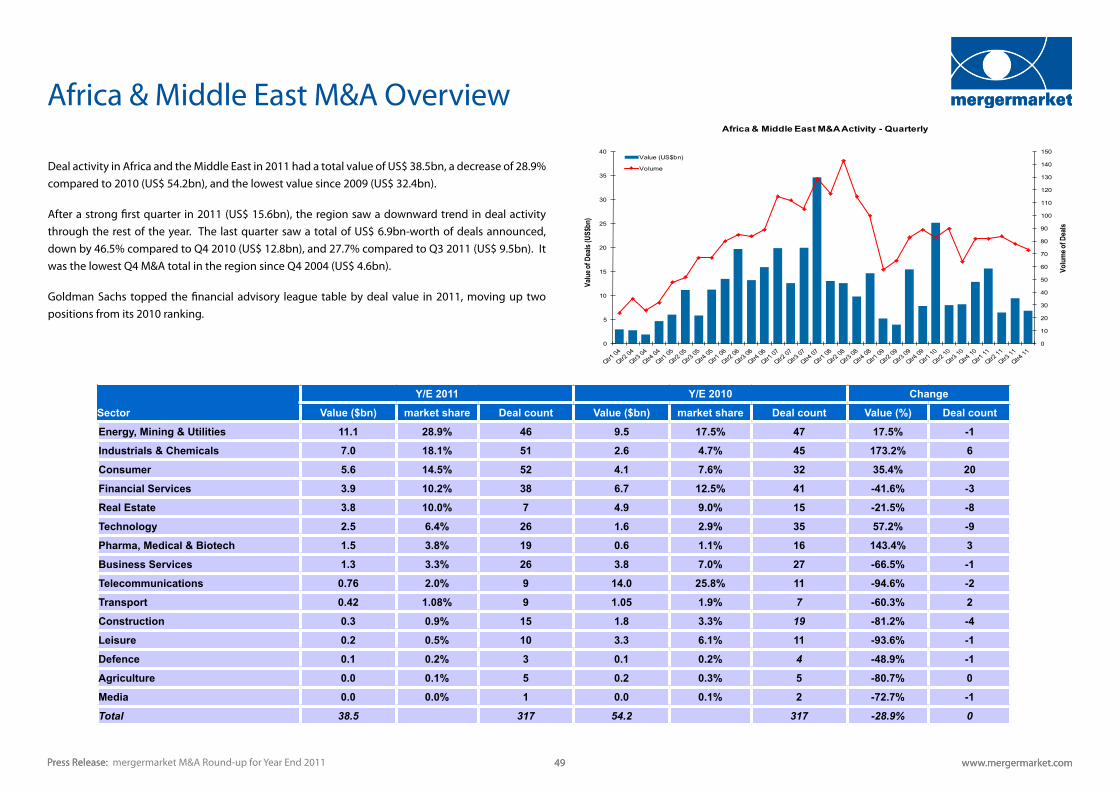
Deal activity in Africa and the Middle East in 2011 had a total value of US$ 38.5bn, a decrease of 28.9% compared to 2010 (US$ 54.2bn), and the lowest value since 2009 (US$ 32.4bn).
After a strong first quarter in 2011 (US$ 15.6bn), the region saw a downward trend in deal activity through the rest of the year. The last quarter saw a total of US$ 6.9bn-worth of deals announced, down by 46.5% compared to Q4 2010 (US$ 12.8bn), and 27.7% compared to Q3 2011 (US$ 9.5bn). It was the lowest Q4 M&A total in the region since Q4 2004 (US$ 4.6bn).
Goldman Sachs topped the financial advisory league table by deal value in 2011, moving up two positions from its 2010 ranking.
Press Release: www.mergermarket.com 49Press Release: www.mergermarket.com 49mergermarket M&A Round-up for Year End 2011
Africa & Middle East M&A Overview
0
10
20
30
40
50
60
70
80
90
100
110
120
130
140
150
0
5
10
15
20
25
30
35
40
Volu
me o
f Dea
ls
Valu
e of D
eals
(US$
bn)
Africa & Middle East M&A Activity - Quarterly
Value(US$bn)
Volume
Y/E 2011 Y/E 2010 Change
Sector Value ($bn) market share Deal count Value ($bn) market share Deal count Value (%) Deal count
Energy, Mining & Utilities 11.1 28.9% 46 9.5 17.5% 47 17.5% -1
Industrials & Chemicals 7.0 18.1% 51 2.6 4.7% 45 173.2% 6
Consumer 5.6 14.5% 52 4.1 7.6% 32 35.4% 20
Financial Services 3.9 10.2% 38 6.7 12.5% 41 -41.6% -3
Real Estate 3.8 10.0% 7 4.9 9.0% 15 -21.5% -8
Technology 2.5 6.4% 26 1.6 2.9% 35 57.2% -9
Pharma, Medical & Biotech 1.5 3.8% 19 0.6 1.1% 16 143.4% 3
Business Services 1.3 3.3% 26 3.8 7.0% 27 -66.5% -1
Telecommunications 0.76 2.0% 9 14.0 25.8% 11 -94.6% -2
Transport 0.42 1.08% 9 1.05 1.9% 7 -60.3% 2
Construction 0.3 0.9% 15 1.8 3.3% 19 -81.2% -4
Leisure 0.2 0.5% 10 3.3 6.1% 11 -93.6% -1
Defence 0.1 0.2% 3 0.1 0.2% 4 -48.9% -1
Agriculture 0.0 0.1% 5 0.2 0.3% 5 -80.7% 0
Media 0.0 0.0% 1 0.0 0.1% 2 -72.7% -1
Total 38.5 317 54.2 317 -28.9% 0
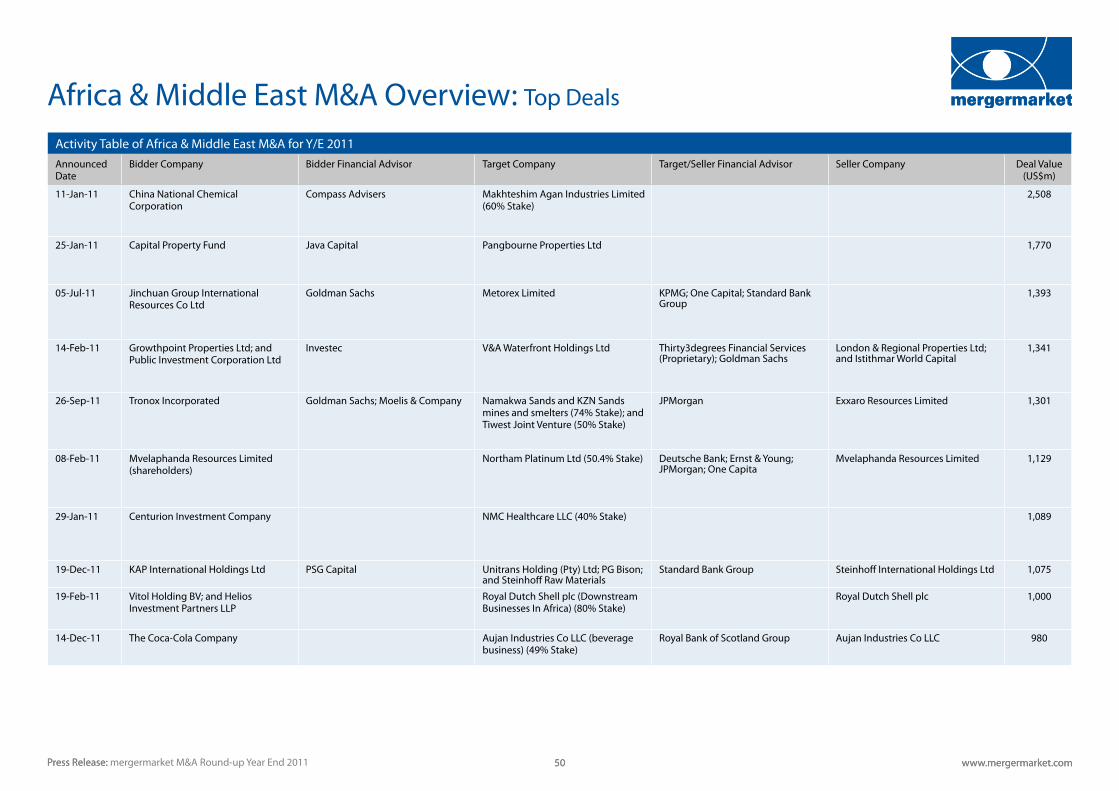
Press Release: www.mergermarket.com 50Press Release: mergermarket M&A Round-up Year End 2011 www.mergermarket.com 50
Africa & Middle East M&A Overview: Top Deals
Activity Table of Africa & Middle East M&A for Y/E 2011Announced Date
Bidder Company Bidder Financial Advisor Target Company Target/Seller Financial Advisor Seller Company Deal Value (US$m)
11-Jan-11 China National Chemical Corporation
Compass Advisers Makhteshim Agan Industries Limited (60% Stake)
2,508
25-Jan-11 Capital Property Fund Java Capital Pangbourne Properties Ltd 1,770
05-Jul-11 Jinchuan Group International Resources Co Ltd
Goldman Sachs Metorex Limited KPMG; One Capital; Standard Bank Group
1,393
14-Feb-11 Growthpoint Properties Ltd; and Public Investment Corporation Ltd
Investec V&A Waterfront Holdings Ltd Thirty3degrees Financial Services (Proprietary); Goldman Sachs
London & Regional Properties Ltd; and Istithmar World Capital
1,341
26-Sep-11 Tronox Incorporated Goldman Sachs; Moelis & Company Namakwa Sands and KZN Sands mines and smelters (74% Stake); and Tiwest Joint Venture (50% Stake)
JPMorgan Exxaro Resources Limited 1,301
08-Feb-11 Mvelaphanda Resources Limited (shareholders)
Northam Platinum Ltd (50.4% Stake) Deutsche Bank; Ernst & Young; JPMorgan; One Capita
Mvelaphanda Resources Limited 1,129
29-Jan-11 Centurion Investment Company NMC Healthcare LLC (40% Stake) 1,089
19-Dec-11 KAP International Holdings Ltd PSG Capital Unitrans Holding (Pty) Ltd; PG Bison; and Steinhoff Raw Materials
Standard Bank Group Steinhoff International Holdings Ltd 1,075
19-Feb-11 Vitol Holding BV; and Helios Investment Partners LLP
Royal Dutch Shell plc (Downstream Businesses In Africa) (80% Stake)
Royal Dutch Shell plc 1,000
14-Dec-11 The Coca-Cola Company Aujan Industries Co LLC (beverage business) (49% Stake)
Royal Bank of Scotland Group Aujan Industries Co LLC 980
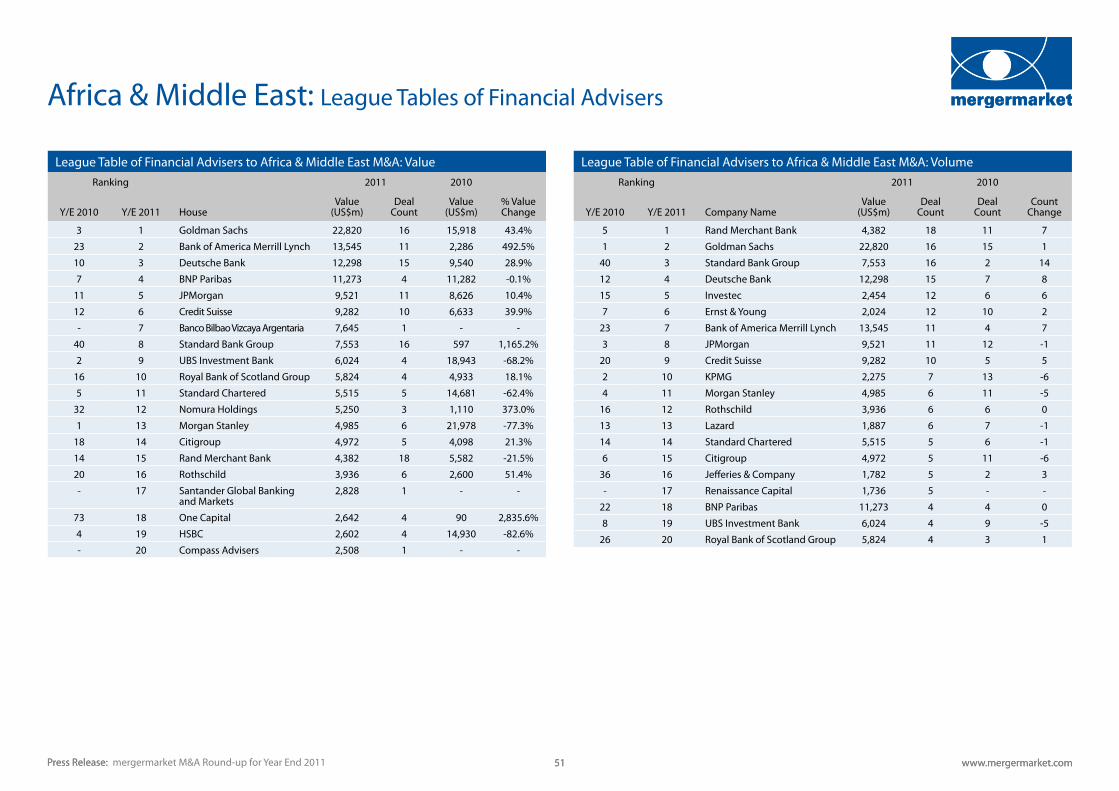
Press Release: www.mergermarket.com 51Press Release: www.mergermarket.com 51mergermarket M&A Round-up for Year End 2011
Africa & Middle East: League Tables of Financial Advisers
League Table of Financial Advisers to Africa & Middle East M&A: ValueRanking 2011 2010
Y/E 2010 Y/E 2011 HouseValue
(US$m)Deal
CountValue
(US$m)% Value Change
3 1 Goldman Sachs 22,820 16 15,918 43.4%
23 2 Bank of America Merrill Lynch 13,545 11 2,286 492.5%
10 3 Deutsche Bank 12,298 15 9,540 28.9%
7 4 BNP Paribas 11,273 4 11,282 -0.1%
11 5 JPMorgan 9,521 11 8,626 10.4%
12 6 Credit Suisse 9,282 10 6,633 39.9%
- 7 Banco Bilbao Vizcaya Argentaria 7,645 1 - -
40 8 Standard Bank Group 7,553 16 597 1,165.2%
2 9 UBS Investment Bank 6,024 4 18,943 -68.2%
16 10 Royal Bank of Scotland Group 5,824 4 4,933 18.1%
5 11 Standard Chartered 5,515 5 14,681 -62.4%
32 12 Nomura Holdings 5,250 3 1,110 373.0%
1 13 Morgan Stanley 4,985 6 21,978 -77.3%
18 14 Citigroup 4,972 5 4,098 21.3%
14 15 Rand Merchant Bank 4,382 18 5,582 -21.5%
20 16 Rothschild 3,936 6 2,600 51.4%
- 17 Santander Global Banking and Markets
2,828 1 - -
73 18 One Capital 2,642 4 90 2,835.6%
4 19 HSBC 2,602 4 14,930 -82.6%
- 20 Compass Advisers 2,508 1 - -
League Table of Financial Advisers to Africa & Middle East M&A: VolumeRanking 2011 2010
Y/E 2010 Y/E 2011 Company NameValue
(US$m)Deal
CountDeal
Count Count
Change
5 1 Rand Merchant Bank 4,382 18 11 7
1 2 Goldman Sachs 22,820 16 15 1
40 3 Standard Bank Group 7,553 16 2 14
12 4 Deutsche Bank 12,298 15 7 8
15 5 Investec 2,454 12 6 6
7 6 Ernst & Young 2,024 12 10 2
23 7 Bank of America Merrill Lynch 13,545 11 4 7
3 8 JPMorgan 9,521 11 12 -1
20 9 Credit Suisse 9,282 10 5 5
2 10 KPMG 2,275 7 13 -6
4 11 Morgan Stanley 4,985 6 11 -5
16 12 Rothschild 3,936 6 6 0
13 13 Lazard 1,887 6 7 -1
14 14 Standard Chartered 5,515 5 6 -1
6 15 Citigroup 4,972 5 11 -6
36 16 Jefferies & Company 1,782 5 2 3
- 17 Renaissance Capital 1,736 5 - -
22 18 BNP Paribas 11,273 4 4 0
8 19 UBS Investment Bank 6,024 4 9 -5
26 20 Royal Bank of Scotland Group 5,824 4 3 1

Press Release: www.mergermarket.com 52Press Release: www.mergermarket.com 52mergermarket M&A Round-up for Year End 2011
The global Year End 2011 house league tables are based on announced transactions over US$5m in the period from 1 January 2011 to 31 December 2011. Deals with undisclosed deal values are included where the target’s turnover exceeds US$ 10m. Deals where the stake acquired is less than 30% will only be included if their value is greater than US$ 100m. Activities excluded from the league tables include property transactions and restructurings where the ultimate shareholders’ interests are not changed. League tables are based on the dominant geography of the target, bidder or seller.
The trend graphs and pie charts are based on the dominant industry and/or dominant geography of the target and include announced transactions over US$ 5m in the given time period. Deals with undis-closed deal values are included where the target’s turnover exceeds US$ 10m. Deals where the stake acquired is less than 30% will only be included if their value is greater than US$ 100m. Activities excluded from the graphs and charts include property transactions and restructurings where the ultimate shareholders’ interests are not changed.
The top deals tables are based on announced transactions between 1 January 2011 and 31 December 2011 and are based on dominant geography of the target only.
All data excludes minority stake deals (10% - 30%) where dominant target geography is Asia-Pacific and the deal value is less than US$ 100m.
Unless stated otherwise, all data excludes lapsed and withdrawn bids.
All data correct as of 3 January 2012.
Germanic: Germany, Austria and SwitzerlandNordic: Denmark, Sweden, Finland, Norway, Faroe Islands, Greenland and IcelandBenelux: Belgium, the Netherlands and LuxembourgIberia: Portugal and SpainCEE: Armenia, Azerbaijan, Belarus, Bosnia-Herzegovina, Bulgaria, Croatia, Czech Republic, Estonia, Georgia, Hungary, Latvia, Lithuania, Macedonia, Moldova, Poland, Romania, Russia, Serbia, Slovakia, Slovenia, Ukraine
US (Mid-West): llinois, Indiana, Iowa, Kansas, Michigan, Minnesota, Missouri, Nebraska, North Dakota, Ohio, South Dakota, Wisconsin US (North East): Connecticut, Maine, Massachusetts, New Hampshire, New Jersey, New York, Pennsylvania, Rhode Island, Vermont US (South): Alabama, Arkansas, Delaware, District of Columbia, Florida, Georgia, Kentucky, Louisiana, Maryland, Mississippi, North Carolina, Oklahoma, South Carolina, Tennessee, Texas, Virginia, West VirginiaUS (West): Alaska, Arizona, California, Colorado, Hawaii, Idaho, Montana, Nevada, New Mexico, Oregon, Utah, Washington, Wyoming
Greater China: China, Hong Kong, Macau, TaiwanSouth East Asia: Brunei, Cambodia, Indonesia, Laos, Malaysia, Myanmar, Philippines, Singapore, Thailand, Timor-Leste, Vietnam
Criteria: http://www.mergermarket.com/pdf/deal_criteria.pdf
Criteria
Press Release: www.mergermarket.com 53Press Release: www.mergermarket.com 53mergermarket M&A Round-up for Year End 2011
About mergermarket
mergermarket is a mergers & acquisitions (M&A) intelligence service.
mergermarket is part of The Mergermarket Group which has over 450 employees worldwide and regional head offices in New York, London and Hong Kong.
In any market, the life blood of advisers is deal flow. mergermarket is unique in the provision of origination intelligence to the investment banking, legal, private equity, acquisition finance, public relations (PR) and corporate markets.
With an unrivalled network of analysts covering M&A in the Americas, Europe, Middle-East, Africa and Asia-Pacific, mergermarket generates proprietary intelligence and delivers it together with daily aggregated content, on its mergermarket.com platform and by real-time email alerts to subscribers.
This wealth of intelligence, together with a series of deal databases, individual and house league tables, profiles and editorial have proven time and time again that this product can and does generate real revenues for clients. This is apparent when you see that mergermarket is used by over 1500 of the world’s foremost advisory firms to assist in their origination process.
Contact:
Europe:Flora [email protected]: +44 207 059 6348
Americas:Dara Silverstein [email protected]: +1 646 378 3118
Asia-Pacific:Michel [email protected]: +852 2158 9706
80 Strand London, WC2R 0RL United Kingdom
t:+44(0)20 7059 6100 f:+44(0)20 7059 6101 [email protected]
11 West 19th Street 2nd Floor New York, NY 10011, USA
t: +1 212-686-5606 f: +1 212-686-2664 [email protected]
Suite 2401-3 Grand Millennium Plaza 181 Queen’s Road, Central Hong Kong
t: +852 2158 9700 f: +852 2158 9701 [email protected]