Embed Size (px)
Citation preview
1
3Q18 and 9M18
2
Earnings Release 3Q18 and 9M18
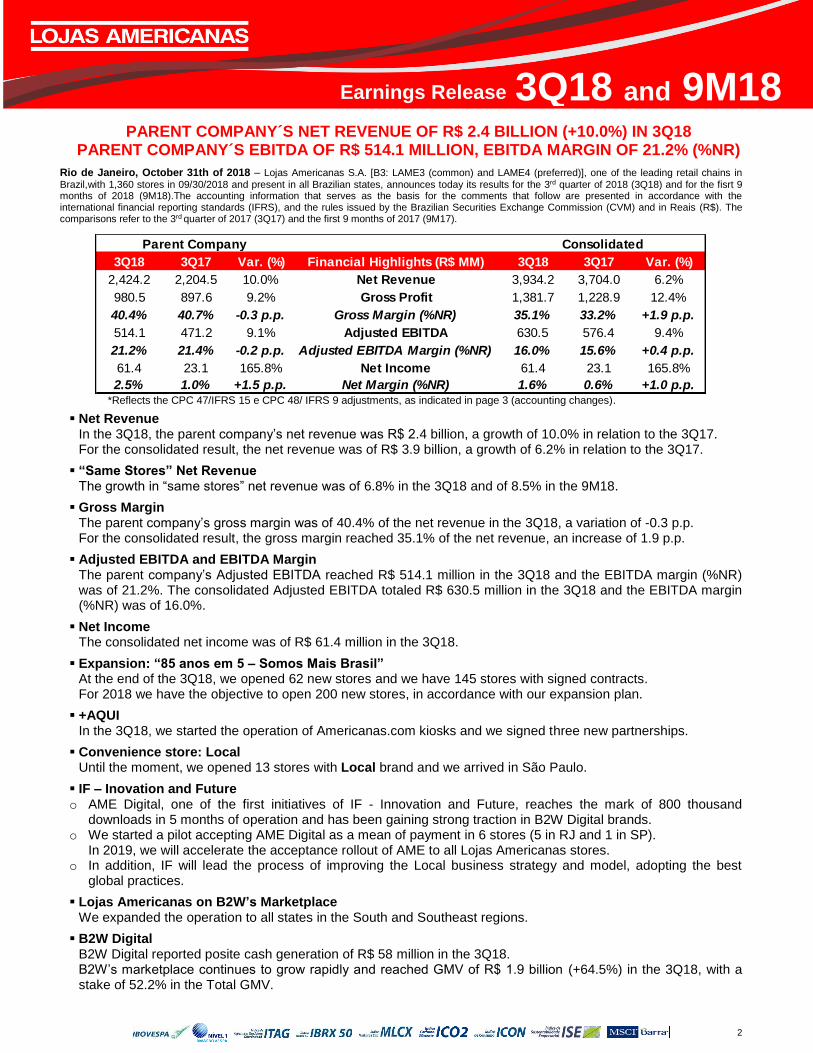
PARENT COMPANY´S NET REVENUE OF R$ 2.4 BILLION (+10.0%) IN 3Q18 PARENT COMPANY´S EBITDA OF R$ 514.1 MILLION, EBITDA MARGIN OF 21.2% (%NR)
Rio de Janeiro, October 31th of 2018 – Lojas Americanas S.A. [B3: LAME3 (common) and LAME4 (preferred)], one of the leading retail chains in
Brazil,with 1,360 stores in 09/30/2018 and present in all Brazilian states, announces today its results for the 3rd quarter of 2018 (3Q18) and for the fisrt 9 months of 2018 (9M18).The accounting information that serves as the basis for the comments that follow are presented in accordance with the international financial reporting standards (IFRS), and the rules issued by the Brazilian Securities Exchange Commission (CVM) and in Reais (R$). The comparisons refer to the 3rd quarter of 2017 (3Q17) and the first 9 months of 2017 (9M17).
*Reflects the CPC 47/IFRS 15 e CPC 48/ IFRS 9 adjustments, as indicated in page 3 (accounting changes).
Net Revenue In the 3Q18, the parent company’s net revenue was R$ 2.4 billion, a growth of 10.0% in relation to the 3Q17. For the consolidated result, the net revenue was of R$ 3.9 billion, a growth of 6.2% in relation to the 3Q17.
“Same Stores” Net Revenue The growth in “same stores” net revenue was of 6.8% in the 3Q18 and of 8.5% in the 9M18.
Gross Margin The parent company’s gross margin was of 40.4% of the net revenue in the 3Q18, a variation of -0.3 p.p. For the consolidated result, the gross margin reached 35.1% of the net revenue, an increase of 1.9 p.p.
Adjusted EBITDA and EBITDA Margin The parent company’s Adjusted EBITDA reached R$ 514.1 million in the 3Q18 and the EBITDA margin (%NR) was of 21.2%. The consolidated Adjusted EBITDA totaled R$ 630.5 million in the 3Q18 and the EBITDA margin (%NR) was of 16.0%.
Net Income The consolidated net income was of R$ 61.4 million in the 3Q18.
Expansion: “85 anos em 5 – Somos Mais Brasil” At the end of the 3Q18, we opened 62 new stores and we have 145 stores with signed contracts. For 2018 we have the objective to open 200 new stores, in accordance with our expansion plan.
+AQUI In the 3Q18, we started the operation of Americanas.com kiosks and we signed three new partnerships.
Convenience store: Local Until the moment, we opened 13 stores with Local brand and we arrived in São Paulo.
IF – Inovation and Future o AME Digital, one of the first initiatives of IF - Innovation and Future, reaches the mark of 800 thousand
downloads in 5 months of operation and has been gaining strong traction in B2W Digital brands. o We started a pilot accepting AME Digital as a mean of payment in 6 stores (5 in RJ and 1 in SP).
In 2019, we will accelerate the acceptance rollout of AME to all Lojas Americanas stores. o In addition, IF will lead the process of improving the Local business strategy and model, adopting the best
global practices.
Lojas Americanas on B2W’s Marketplace We expanded the operation to all states in the South and Southeast regions.
B2W Digital B2W Digital reported posite cash generation of R$ 58 million in the 3Q18. B2W’s marketplace continues to grow rapidly and reached GMV of R$ 1.9 billion (+64.5%) in the 3Q18, with a stake of 52.2% in the Total GMV.
3Q18 3Q17 Var. (%) Financial Highlights (R$ MM) 3Q18 3Q17 Var. (%)
2,424.2 2,204.5 10.0% Net Revenue 3,934.2 3,704.0 6.2%
980.5 897.6 9.2% Gross Profit 1,381.7 1,228.9 12.4%
40.4% 40.7% -0.3 p.p. Gross Margin (%NR) 35.1% 33.2% +1.9 p.p.
514.1 471.2 9.1% Adjusted EBITDA 630.5 576.4 9.4%
21.2% 21.4% -0.2 p.p. Adjusted EBITDA Margin (%NR) 16.0% 15.6% +0.4 p.p.
61.4 23.1 165.8% Net Income 61.4 23.1 165.8%
2.5% 1.0% +1.5 p.p. Net Margin (%NR) 1.6% 0.6% +1.0 p.p.
Parent Company Consolidated
3
Earnings Release 3Q18 and 9M18
ACCOUNTING CHANGES
From 2018 onwards, the CPC 47/IFRS 15 – Revenues from Customer Contracts – and CPC 48/IFRS 9 – Financial Instruments – came into effect. In order to facilitate the analysis of the results presented in this report, as well as to guarantee transparency, the Company opted to restate the results for the same period of 2017 (Annex III - 3Q17 new criteria vs. 3Q17 old criteria), following the CPCs/IFRS orientations. The main impacts in the 3Q18 results are described below:
Services: Previously, sales revenue, taxes and cost of sales were registered, currently, only commission on sales and taxes are recorded.
Intercompany operations: Previously, sales revenue, taxes and cost of sales were recorded and currently only the comission on sales and taxes are registered.
Commercial Agreements with Suppliers (related parties): Previously were recorded as a deduction from selling expenses and currently recorded as a deduction from cost of sales.
Conditional Discounts: Previously registered as financial expenses and, currently, registered as a deduction from gross revenue.
The 3Q18, 3Q17, 9M18 and 9M17 data are presented over the press release in accordance with the new accounting standards. COMMENTS ON OPERATIONAL PERFORMANCE GROSS MERCHANDISE VOLUME (GMV) The Gross Merchandise Volume (GMV) presents consolidated gross sales and service revenue plus sales made on B2W Digital’s Marketplace platforms. In the 3Q18, the consolidated GMV reached R$ 6.4 billion, a growth of 17.5% compared to the 3Q17. In the 9M18, the consolidated GMV reached R$ 18.3 billion, a growth of 18.5% compared to the 9M17. GROSS REVENUE
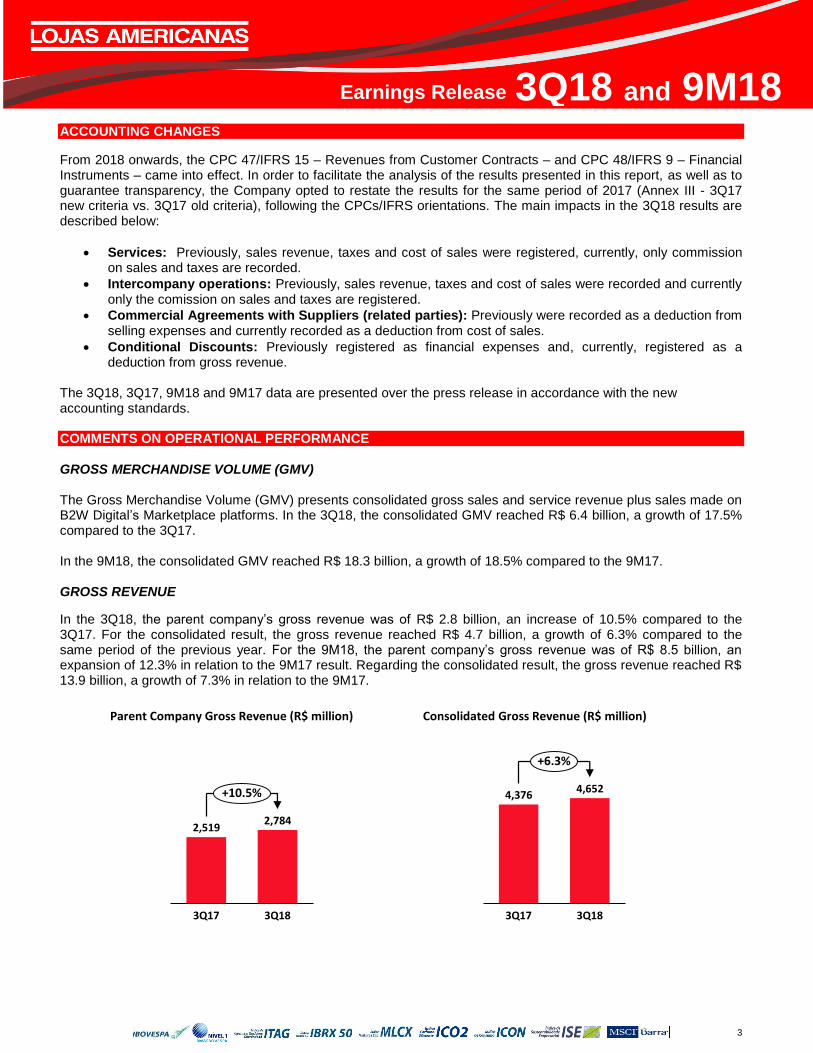
In the 3Q18, the parent company’s gross revenue was of R$ 2.8 billion, an increase of 10.5% compared to the 3Q17. For the consolidated result, the gross revenue reached R$ 4.7 billion, a growth of 6.3% compared to the same period of the previous year. For the 9M18, the parent company’s gross revenue was of R$ 8.5 billion, an expansion of 12.3% in relation to the 9M17 result. Regarding the consolidated result, the gross revenue reached R$ 13.9 billion, a growth of 7.3% in relation to the 9M17.
2,519
3Q17 3Q18
2,784
+10.5%
Parent Company Gross Revenue (R$ million)
3Q183Q17
4,3764,652
+6.3%
Consolidated Gross Revenue (R$ million)
4
Earnings Release 3Q18 and 9M18 NET REVENUE
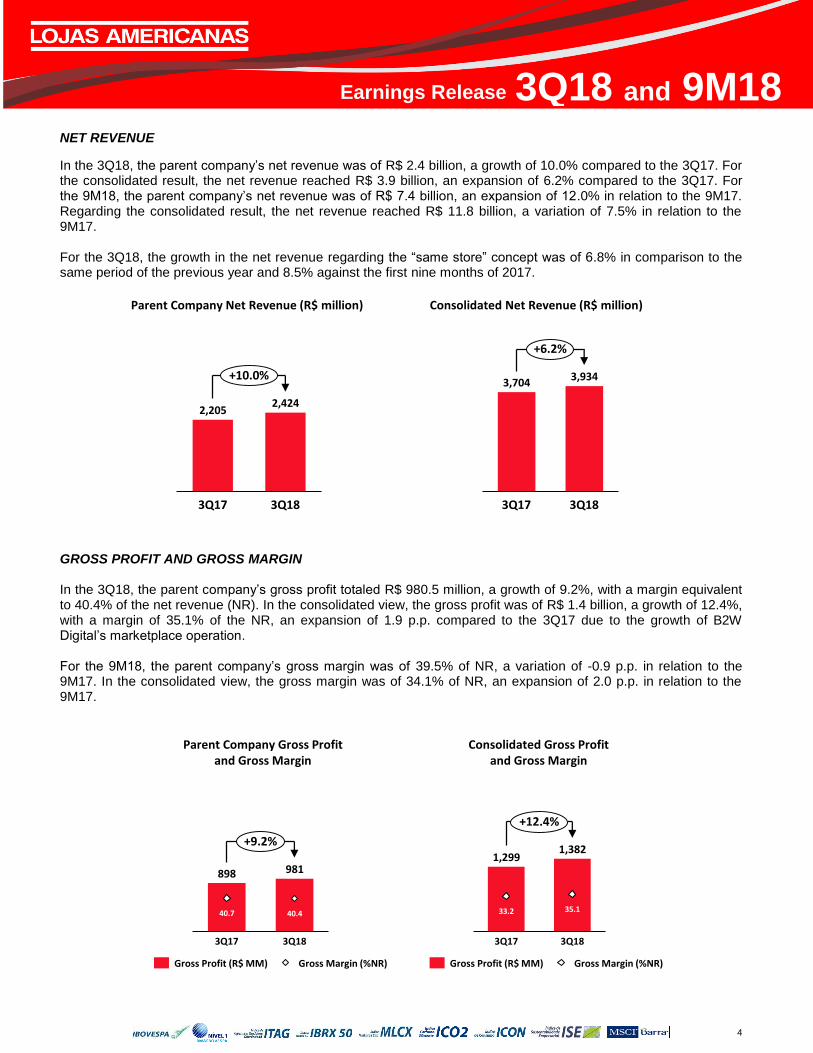
In the 3Q18, the parent company’s net revenue was of R$ 2.4 billion, a growth of 10.0% compared to the 3Q17. For the consolidated result, the net revenue reached R$ 3.9 billion, an expansion of 6.2% compared to the 3Q17. For the 9M18, the parent company’s net revenue was of R$ 7.4 billion, an expansion of 12.0% in relation to the 9M17. Regarding the consolidated result, the net revenue reached R$ 11.8 billion, a variation of 7.5% in relation to the 9M17. For the 3Q18, the growth in the net revenue regarding the “same store” concept was of 6.8% in comparison to the same period of the previous year and 8.5% against the first nine months of 2017.
GROSS PROFIT AND GROSS MARGIN In the 3Q18, the parent company’s gross profit totaled R$ 980.5 million, a growth of 9.2%, with a margin equivalent to 40.4% of the net revenue (NR). In the consolidated view, the gross profit was of R$ 1.4 billion, a growth of 12.4%, with a margin of 35.1% of the NR, an expansion of 1.9 p.p. compared to the 3Q17 due to the growth of B2W Digital’s marketplace operation. For the 9M18, the parent company’s gross margin was of 39.5% of NR, a variation of -0.9 p.p. in relation to the 9M17. In the consolidated view, the gross margin was of 34.1% of NR, an expansion of 2.0 p.p. in relation to the 9M17.
2,424
3Q17 3Q18
2,205
+10.0%
Parent Company Net Revenue (R$ million)
3Q17 3Q18
3,7043,934
+6.2%
Consolidated Net Revenue (R$ million)
898 981
40.7 40.4
3Q17 3Q18
+9.2%
Parent Company Gross Profit and Gross Margin
Gross Profit (R$ MM) Gross Margin (%NR)
3Q17
33.2 35.1
3Q18
1,2991,382
+12.4%
Consolidated Gross Profit and Gross Margin
Gross Profit (R$ MM) Gross Margin (%NR)
5
Earnings Release 3Q18 and 9M18 SALES, GENERAL AND ADMINISTRATIVE EXPENSES
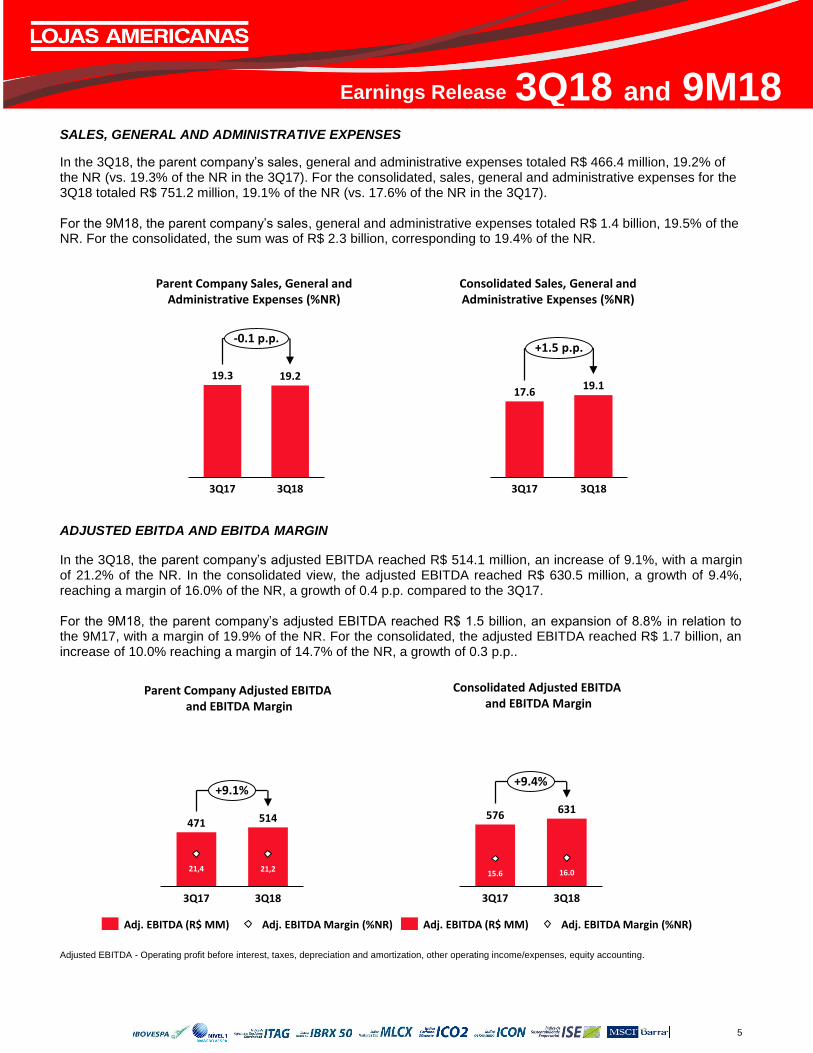
In the 3Q18, the parent company’s sales, general and administrative expenses totaled R$ 466.4 million, 19.2% of the NR (vs. 19.3% of the NR in the 3Q17). For the consolidated, sales, general and administrative expenses for the 3Q18 totaled R$ 751.2 million, 19.1% of the NR (vs. 17.6% of the NR in the 3Q17). For the 9M18, the parent company’s sales, general and administrative expenses totaled R$ 1.4 billion, 19.5% of the NR. For the consolidated, the sum was of R$ 2.3 billion, corresponding to 19.4% of the NR.
ADJUSTED EBITDA AND EBITDA MARGIN
In the 3Q18, the parent company’s adjusted EBITDA reached R$ 514.1 million, an increase of 9.1%, with a margin of 21.2% of the NR. In the consolidated view, the adjusted EBITDA reached R$ 630.5 million, a growth of 9.4%, reaching a margin of 16.0% of the NR, a growth of 0.4 p.p. compared to the 3Q17. For the 9M18, the parent company’s adjusted EBITDA reached R$ 1.5 billion, an expansion of 8.8% in relation to the 9M17, with a margin of 19.9% of the NR. For the consolidated, the adjusted EBITDA reached R$ 1.7 billion, an increase of 10.0% reaching a margin of 14.7% of the NR, a growth of 0.3 p.p..
Adjusted EBITDA - Operating profit before interest, taxes, depreciation and amortization, other operating income/expenses, equity accounting.
3Q17
19.219.3
3Q18
-0.1 p.p.
Parent Company Sales, General andAdministrative Expenses (%NR)
19.1
3Q183Q17
17.6
+1.5 p.p.
Consolidated Sales, General andAdministrative Expenses (%NR)
471 514
21,4 21,2
3Q17 3Q18
+9.1%
Parent Company Adjusted EBITDAand EBITDA Margin
Adj. EBITDA (R$ MM) Adj. EBITDA Margin (%NR)
576 631
3Q183Q17
15.6 16.0
+9.4%
Consolidated Adjusted EBITDAand EBITDA Margin
Adj. EBITDA Margin (%NR)Adj. EBITDA (R$ MM)
6
Earnings Release 3Q18 and 9M18 EBITDA (CVM 527/12)
In the 3Q18, the parent company’s Adjusted EBITDA reached R$ 514.1 million, representing 21.2% of the NR. According to CVM’s 527/12 Instruction, if we exclude other revenues and operational expenses and equity accounting, the EBITDA would be equal to R$ 441.2 million in the 3Q18, representing 18.2% of the NR.
In the consolidated view, the Adjusted EBITDA totaled R$ 630.5 billion in the 3Q18, representing 16.0% of the NR. According to CVM’s 527/12 Instruction, if we exclude other revenues, operational expenses, the EBITDA would be equal to R$ 604.3 million in the 3Q18, representing 15.4% of the NR.
VARIATION IN THE WORKING CAPITAL
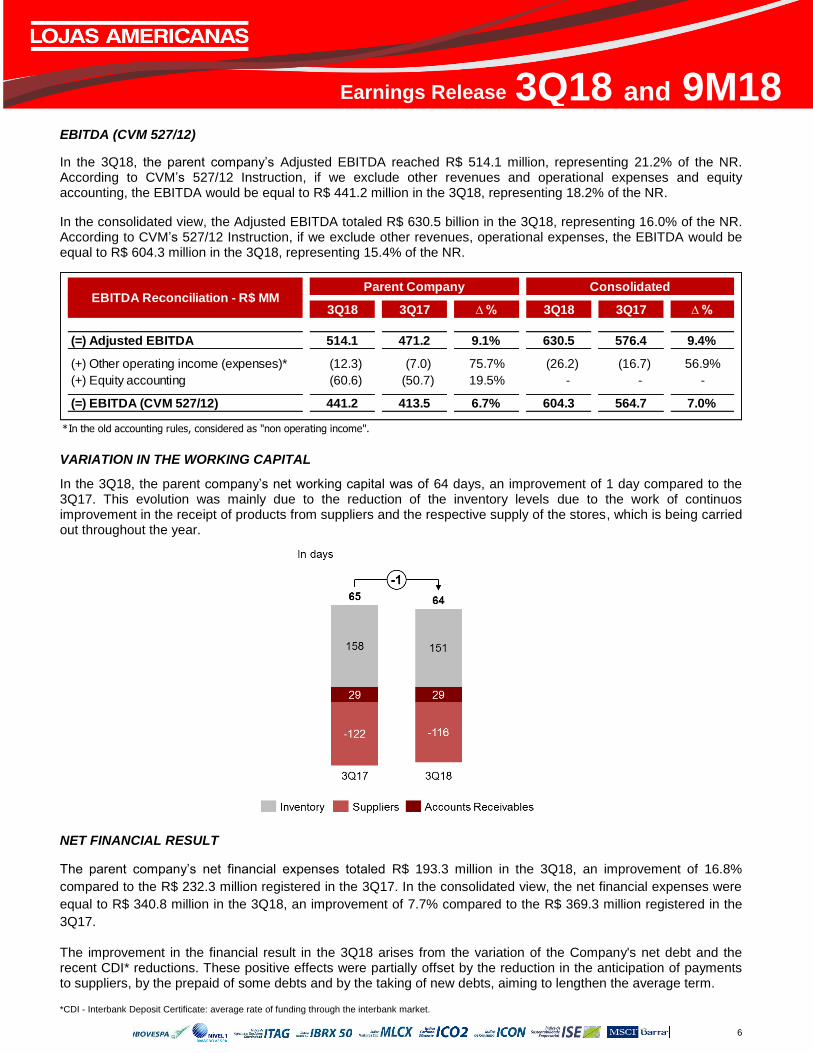
In the 3Q18, the parent company’s net working capital was of 64 days, an improvement of 1 day compared to the 3Q17. This evolution was mainly due to the reduction of the inventory levels due to the work of continuos improvement in the receipt of products from suppliers and the respective supply of the stores, which is being carried out throughout the year.
NET FINANCIAL RESULT
The parent company’s net financial expenses totaled R$ 193.3 million in the 3Q18, an improvement of 16.8%
compared to the R$ 232.3 million registered in the 3Q17. In the consolidated view, the net financial expenses were
equal to R$ 340.8 million in the 3Q18, an improvement of 7.7% compared to the R$ 369.3 million registered in the
3Q17.
The improvement in the financial result in the 3Q18 arises from the variation of the Company's net debt and the recent CDI* reductions. These positive effects were partially offset by the reduction in the anticipation of payments to suppliers, by the prepaid of some debts and by the taking of new debts, aiming to lengthen the average term.
*CDI - Interbank Deposit Certificate: average rate of funding through the interbank market.
3Q18 3Q17 ∆ % 3Q18 3Q17 ∆ %3Q1
(=) Adjusted EBITDA 514.1 471.2 9.1% 630.5 576.4 9.4%
(+) Other operating income (expenses)* (12.3) (7.0) 75.7% (26.2) (16.7) 56.9%
(+) Equity accounting (60.6) (50.7) 19.5% - - -
(=) EBITDA (CVM 527/12) 441.2 413.5 6.7% 604.3 564.7 7.0%
*In the old accounting rules, considered as "non operating income".
Parent Company ConsolidatedEBITDA Reconciliation - R$ MM
7
Earnings Release 3Q18 and 9M18 NO EXPOSURE TO FOREIGN EXCHANGE VARIATIONS
The Company continues to reaffirm its commitment to a conservative cash investment policy, demonstrated by the use of hedge instruments in foreign currencies, and derivatives (swaps). The financial liability and the total cash position of the Company are fully protected against any foreign exchange fluctuations through these financial instruments, which offset the foreign exchange risk transforming the cost of debt to local currency and interest rate (as a percentage of the CDI). In the same direction, it is worth remembering that the Company's cash is invested in the largest financial institutions in Brazil. NET INCOME
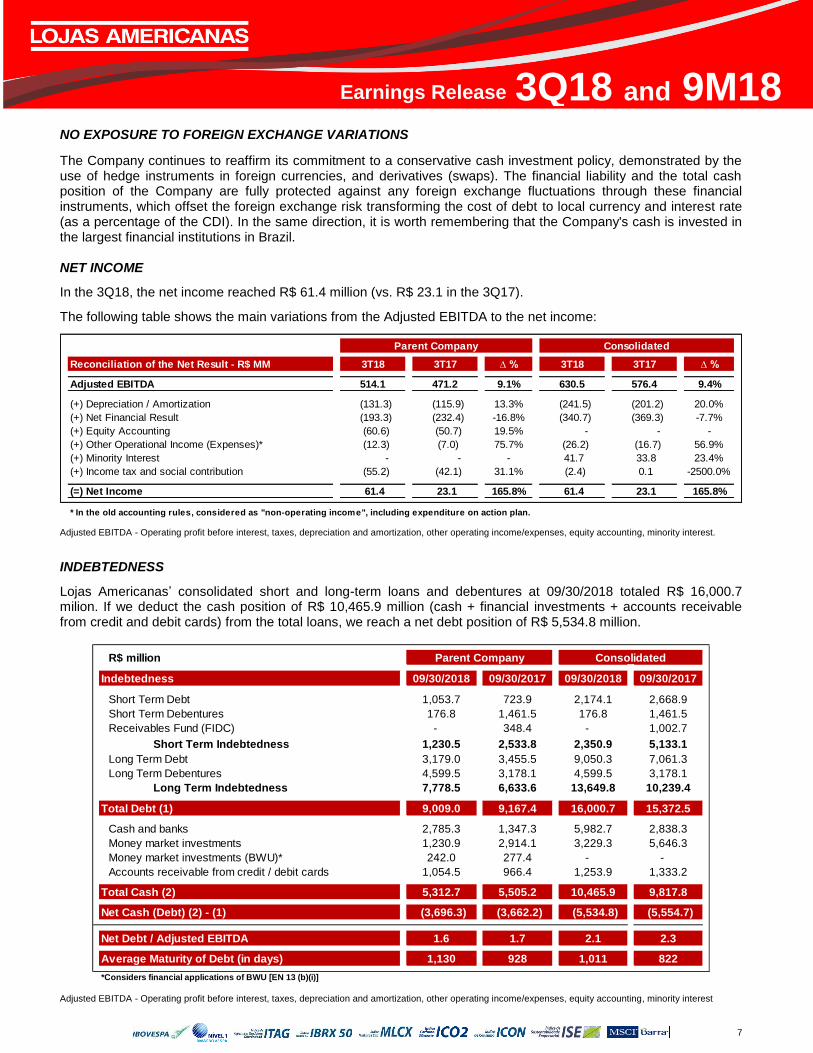
In the 3Q18, the net income reached R$ 61.4 million (vs. R$ 23.1 in the 3Q17).
The following table shows the main variations from the Adjusted EBITDA to the net income:
Adjusted EBITDA - Operating profit before interest, taxes, depreciation and amortization, other operating income/expenses, equity accounting, minority interest.
INDEBTEDNESS
Lojas Americanas’ consolidated short and long-term loans and debentures at 09/30/2018 totaled R$ 16,000.7 milion. If we deduct the cash position of R$ 10,465.9 million (cash + financial investments + accounts receivable from credit and debit cards) from the total loans, we reach a net debt position of R$ 5,534.8 million.
Adjusted EBITDA - Operating profit before interest, taxes, depreciation and amortization, other operating income/expenses, equity accounting, minority interest
Reconciliation of the Net Result - R$ MM 3T18 3T17 ∆ % 3T18 3T17 ∆ %
Adjusted EBITDA 514.1 471.2 9.1% 630.5 576.4 9.4%
(+) Depreciation / Amortization (131.3) (115.9) 13.3% (241.5) (201.2) 20.0%
(+) Net Financial Result (193.3) (232.4) -16.8% (340.7) (369.3) -7.7%
(+) Equity Accounting (60.6) (50.7) 19.5% - - -
(+) Other Operational Income (Expenses)* (12.3) (7.0) 75.7% (26.2) (16.7) 56.9%
(+) Minority Interest - - - 41.7 33.8 23.4%
(+) Income tax and social contribution (55.2) (42.1) 31.1% (2.4) 0.1 -2500.0%
(=) Net Income 61.4 23.1 165.8% 61.4 23.1 165.8%
* In the old accounting rules, considered as "non-operating income", including expenditure on action plan.
ConsolidatedParent Company
R$ million
Indebtedness 09/30/2018 09/30/2017 09/30/2018 09/30/2017
Short Term Debt 1,053.7 723.9 2,174.1 2,668.9
Short Term Debentures 176.8 1,461.5 176.8 1,461.5
Receivables Fund (FIDC) - 348.4 - 1,002.7
Short Term Indebtedness 1,230.5 2,533.8 2,350.9 5,133.1
Long Term Debt 3,179.0 3,455.5 9,050.3 7,061.3
Long Term Debentures 4,599.5 3,178.1 4,599.5 3,178.1
Long Term Indebtedness 7,778.5 6,633.6 13,649.8 10,239.4
Total Debt (1) 9,009.0 9,167.4 16,000.7 15,372.5
Cash and banks 2,785.3 1,347.3 5,982.7 2,838.3
Money market investments 1,230.9 2,914.1 3,229.3 5,646.3
Money market investments (BWU)* 242.0 277.4 - -
1,054.5 966.4 1,253.9 1,333.2
Total Cash (2) 5,312.7 5,505.2 10,465.9 9,817.8
Net Cash (Debt) (2) - (1) (3,696.3) (3,662.2) (5,534.8) (5,554.7)
Net Debt / Adjusted EBITDA 1.6 1.7 2.1 2.3
Average Maturity of Debt (in days) 1,130 928 1,011 822
*Considers financial applications of BWU [EN 13 (b)(i)]
Consolidated
Accounts receivable from credit / debit cards
Parent Company
8
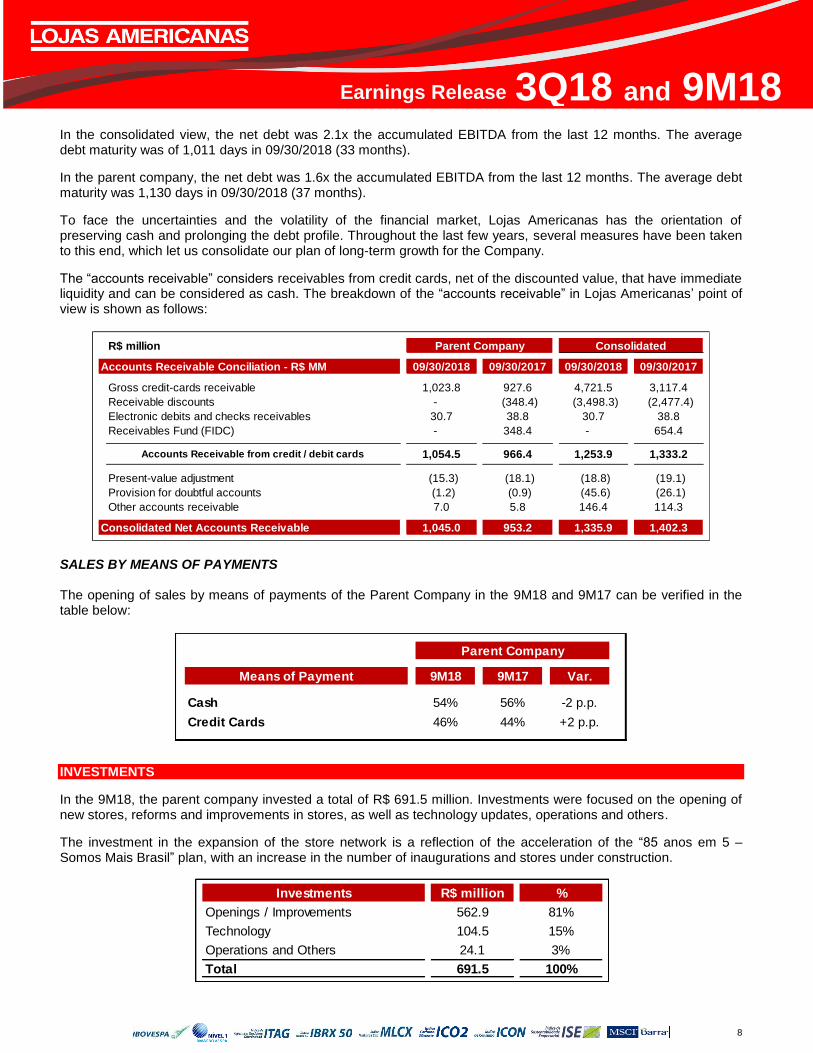
Earnings Release 3Q18 and 9M18 In the consolidated view, the net debt was 2.1x the accumulated EBITDA from the last 12 months. The average debt maturity was of 1,011 days in 09/30/2018 (33 months).
In the parent company, the net debt was 1.6x the accumulated EBITDA from the last 12 months. The average debt maturity was 1,130 days in 09/30/2018 (37 months).
To face the uncertainties and the volatility of the financial market, Lojas Americanas has the orientation of preserving cash and prolonging the debt profile. Throughout the last few years, several measures have been taken to this end, which let us consolidate our plan of long-term growth for the Company.
The “accounts receivable” considers receivables from credit cards, net of the discounted value, that have immediate liquidity and can be considered as cash. The breakdown of the “accounts receivable” in Lojas Americanas’ point of view is shown as follows:
SALES BY MEANS OF PAYMENTS The opening of sales by means of payments of the Parent Company in the 9M18 and 9M17 can be verified in the table below:
INVESTMENTS
In the 9M18, the parent company invested a total of R$ 691.5 million. Investments were focused on the opening of new stores, reforms and improvements in stores, as well as technology updates, operations and others.
The investment in the expansion of the store network is a reflection of the acceleration of the “85 anos em 5 – Somos Mais Brasil” plan, with an increase in the number of inaugurations and stores under construction.
R$ million
Accounts Receivable Conciliation - R$ MM 09/30/2018 09/30/2017 09/30/2018 09/30/2017
Gross credit-cards receivable 1,023.8 927.6 4,721.5 3,117.4
Receivable discounts - (348.4) (3,498.3) (2,477.4)
Electronic debits and checks receivables 30.7 38.8 30.7 38.8
Receivables Fund (FIDC) - 348.4 - 654.4
1,054.5 966.4 1,253.9 1,333.2
Present-value adjustment (15.3) (18.1) (18.8) (19.1)
Provision for doubtful accounts (1.2) (0.9) (45.6) (26.1)
Other accounts receivable 7.0 5.8 146.4 114.3
Consolidated Net Accounts Receivable 1,045.0 953.2 1,335.9 1,402.3
Accounts Receivable from credit / debit cards
Parent Company Consolidated
Means of Payment 9M18 9M17 Var.
Cash 54% 56% -2 p.p.
Credit Cards 46% 44% +2 p.p.
Parent Company
Investments R$ million %
Openings / Improvements 562.9 81%
Technology 104.5 15%
Operations and Others 24.1 3%
Total 691.5 100%
9
Earnings Release 3Q18 and 9M18
EXPANSION
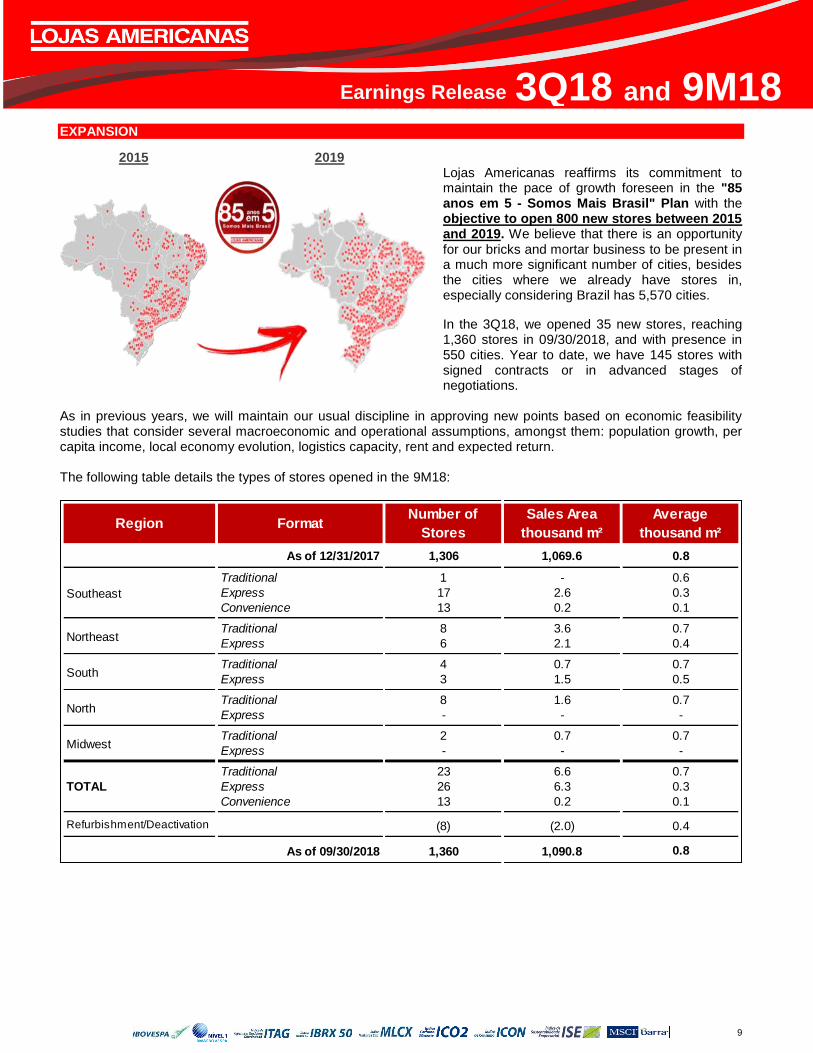
2015 2019 Lojas Americanas reaffirms its commitment to maintain the pace of growth foreseen in the "85 anos em 5 - Somos Mais Brasil" Plan with the objective to open 800 new stores between 2015 and 2019. We believe that there is an opportunity for our bricks and mortar business to be present in a much more significant number of cities, besides the cities where we already have stores in, especially considering Brazil has 5,570 cities.
In the 3Q18, we opened 35 new stores, reaching 1,360 stores in 09/30/2018, and with presence in 550 cities. Year to date, we have 145 stores with signed contracts or in advanced stages of negotiations.
As in previous years, we will maintain our usual discipline in approving new points based on economic feasibility studies that consider several macroeconomic and operational assumptions, amongst them: population growth, per capita income, local economy evolution, logistics capacity, rent and expected return. The following table details the types of stores opened in the 9M18:
Region FormatNumber of
Stores
Sales Area
thousand m²
Average
thousand m²
1,306 1,069.6 0.8,
Traditional 1 - 0.6
Express 17 2.6 0.3
Convenience 13 0.2 0.1
Traditional 8 3.6 0.7
Express 6 2.1 0.4
Traditional 4 0.7 0.7
Express 3 1.5 0.5
Traditional 8 1.6 0.7
Express - - -
Traditional 2 0.7 0.7
Express - - -
Traditional 23 6.6 0.7
Express 26 6.3 0.3
Convenience 13 0.2 0.1
Refurbishment/Deactivation (8) (2.0) 0.4
1,360 1,090.8 0.8
Northeast
South
North
Midwest
TOTAL
As of 09/30/2018
As of 12/31/2017
Southeast
10
Earnings Release 3Q18 and 9M18
IF – INOVATION AND FUTURE IF - Innovation and Future, was initiated with the mission of creating disruptive businesses for Lojas Americanas and B2W, being responsible for the design, incubation and acceleration of these new businesses, which upon maturation, could be integrated into the structures of the company. IF is also responsible for the synergies between the companies' businesses, digital laboratories, and leading digital transformation.
AME Digital is one of the IF's first initiatives. The digital payment account, which will revolutionize the way people relate to money, continues to accelerate and present impressive indicators.
The app already has more than 800 thousand downloads in just 5 months of operation.
The official launch was on Americanas.com (Jun/18) and then expanded to Shoptime (Jun/18) and Submarino (Sep/18). AME has been gaining strong traction in B2W's brands, optimizing the offer of discounts for customers (cashback), generating a greater purchase recurrence and increasing the spending.
In Aug/18, AME has been integrated with the B2W Marketplace promotional tool (Promo Seller), allowing sellers to invest in additional cashback offerings for customers who pay with Ame.
In Oct/18, AME Digital started an acceptance pilot at Lojas Americanas. Customers can already pay with Ame in 6 stores (5 in RJ and 1 in SP). By the end of 2018, many more news will be announced.
In 2019, we will accelerate the acceptance rollout of AME for all Lojas Americanas and also for other retailers in the physical world.
In addition, IF will lead the process of improving the Local business strategy and model, adopting the best global practices.
CONVENIENCE STORES - LOCAL
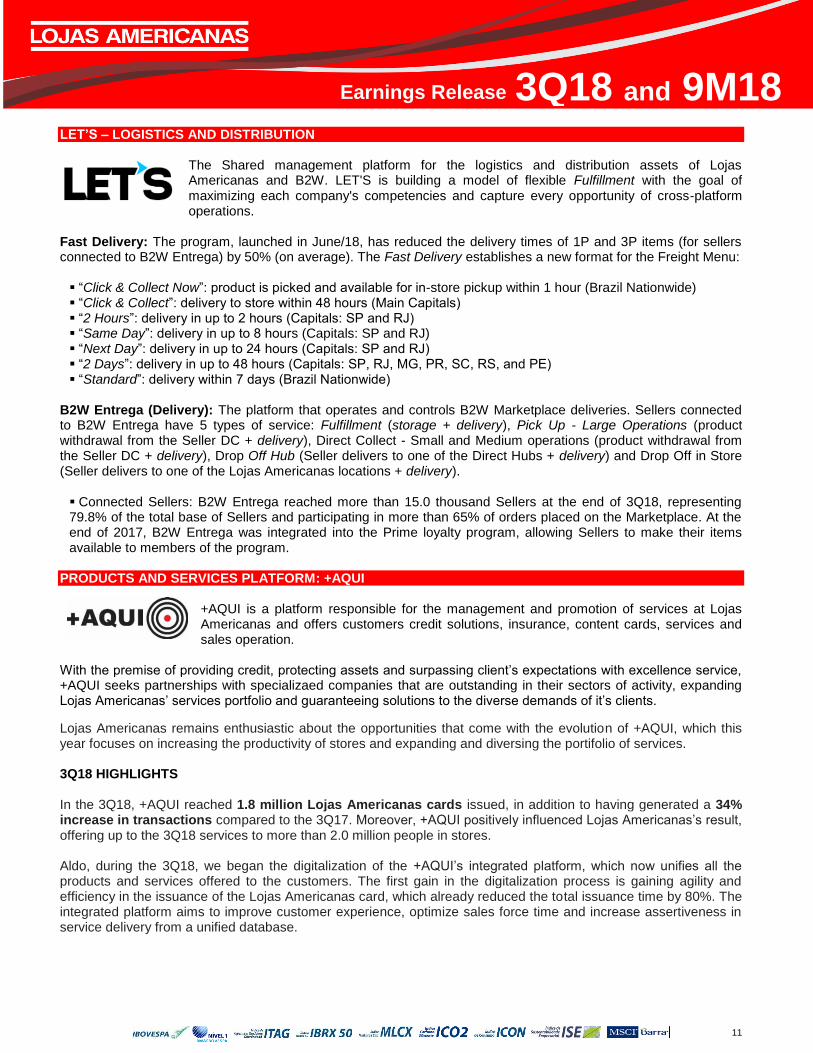
In 3Q18, we inaugurated 11 stores with Local brand and arrived in one more city: São Paulo. Of the 11 inaugurations, 5 were in Rio de Janeiro and 6 in São Paulo, totaling 20 stores in operation at the end of the third quarter. The stores are located on high flow streets and aim to be the best option for customers who want to find everything they need in one place, in a quickly and pleasantly way.
The official launch of the Local brand and the slogan "Bem pertinho de você” (“Very close to you”) is accompanied by the beginning of the change of the visual identity of the existing stores and an advertising campaign, highlighting the convenience of these stores. In this quarter, we accelerated the process of registering products and customer knowledge through daily searches in stores on the assortment available, satisfaction with the service, etc. Using the design thinking methodology, we are running experiments to understand the demand for certain items. In the front of services, we observed interesting results in the delivery pilot, with average ticket and frequency above the average of the store. In addition, we evolved with local pricing experiments, and through elasticity studies and local market price analyzes, we identified opportunities to leverage margin and profit without impacting the sale.
11
Earnings Release 3Q18 and 9M18 LET’S – LOGISTICS AND DISTRIBUTION
The Shared management platform for the logistics and distribution assets of Lojas Americanas and B2W. LET'S is building a model of flexible Fulfillment with the goal of maximizing each company's competencies and capture every opportunity of cross-platform operations.
Fast Delivery: The program, launched in June/18, has reduced the delivery times of 1P and 3P items (for sellers connected to B2W Entrega) by 50% (on average). The Fast Delivery establishes a new format for the Freight Menu:
“Click & Collect Now”: product is picked and available for in-store pickup within 1 hour (Brazil Nationwide) “Click & Collect”: delivery to store within 48 hours (Main Capitals) “2 Hours”: delivery in up to 2 hours (Capitals: SP and RJ) “Same Day”: delivery in up to 8 hours (Capitals: SP and RJ) “Next Day”: delivery in up to 24 hours (Capitals: SP and RJ) “2 Days”: delivery in up to 48 hours (Capitals: SP, RJ, MG, PR, SC, RS, and PE) “Standard”: delivery within 7 days (Brazil Nationwide)
B2W Entrega (Delivery): The platform that operates and controls B2W Marketplace deliveries. Sellers connected to B2W Entrega have 5 types of service: Fulfillment (storage + delivery), Pick Up - Large Operations (product withdrawal from the Seller DC + delivery), Direct Collect - Small and Medium operations (product withdrawal from the Seller DC + delivery), Drop Off Hub (Seller delivers to one of the Direct Hubs + delivery) and Drop Off in Store (Seller delivers to one of the Lojas Americanas locations + delivery). Connected Sellers: B2W Entrega reached more than 15.0 thousand Sellers at the end of 3Q18, representing 79.8% of the total base of Sellers and participating in more than 65% of orders placed on the Marketplace. At the end of 2017, B2W Entrega was integrated into the Prime loyalty program, allowing Sellers to make their items available to members of the program.
PRODUCTS AND SERVICES PLATFORM: +AQUI
+AQUI is a platform responsible for the management and promotion of services at Lojas Americanas and offers customers credit solutions, insurance, content cards, services and sales operation.
With the premise of providing credit, protecting assets and surpassing client’s expectations with excellence service, +AQUI seeks partnerships with specializaed companies that are outstanding in their sectors of activity, expanding Lojas Americanas’ services portfolio and guaranteeing solutions to the diverse demands of it’s clients.
Lojas Americanas remains enthusiastic about the opportunities that come with the evolution of +AQUI, which this year focuses on increasing the productivity of stores and expanding and diversing the portifolio of services. 3Q18 HIGHLIGHTS In the 3Q18, +AQUI reached 1.8 million Lojas Americanas cards issued, in addition to having generated a 34% increase in transactions compared to the 3Q17. Moreover, +AQUI positively influenced Lojas Americanas’s result, offering up to the 3Q18 services to more than 2.0 million people in stores. Aldo, during the 3Q18, we began the digitalization of the +AQUI’s integrated platform, which now unifies all the products and services offered to the customers. The first gain in the digitalization process is gaining agility and efficiency in the issuance of the Lojas Americanas card, which already reduced the total issuance time by 80%. The integrated platform aims to improve customer experience, optimize sales force time and increase assertiveness in service delivery from a unified database.
12
Earnings Release 3Q18 and 9M18 NEW SERVICES
i. Nintendo Switch games: Lojas Americanas exclusively launched in Brazil the sale of prepaid games card to the Nintendo Switch console during the Brasil Game Show (BGS), the largest gaming fair in Latin America. After 4 years away from the country, Nintendo returns to Brazil with the sale of the games The Legend of Zelda: Breath of the Wild, Super Mario Odyssey, Mario Kart 8 Deluxe, Splatoon and Arms;
ii. New partner of Theft and Robbery Insurance: starting in November, Generalli will offer theft and robbery insurance at all Lojas Americanas and the novelty is the inclusion of the cover
against accidental breakage;
iii. Plano Controle: +AQUI starts to offer the TIM Control Plan, which aims to meet needs of those who do not want surprises in their mobile account;
iv. Americanas.com kiosks: +AQUI started to operate the kiosks of Americanas.com with the objective of unifying the offer of services inside the stores. The assisted sale in this important instrument allows to leverage the offer of services and the result. The growth of the stores operated by +AQUI in the recent months is 40 p.p. higher than the others, which shows a significant capture of synergies and leverage in sales.
PRIVATE LABEL
Lojas Americanas has 15 private labels, offering quality products at fair prices in various categories such as food, sweets and candies, household goods, clothing, stationery, toys, among others. In the third quarter of 2018, we continued with the strategy of expanding our private labels and increasing product portfolio and branding iniciatives. In order to make our private labels increasingly known by the public, in September we launched Brink + TV channel on Youtube, the Brink Mais TV. The novelty has the proposal to engage the public in the playful universe of games, with a language that is fun and appropriate for children. Children will be able to watch short stories in which toys will be characters of great adventures and discoveries, stimulating imagination and creativity.
At Leven's private label, we launched chips in small packages with three flavors, seeking to serve customers better. Another great launch was the first licensed product of Leven brand in partnership with Disney, three mini cookies in the flavors: chocolate drops, vanilla and sprinkles. These cookies are free of trans fat and have low levels of saturated fats, sugar and sodium. Altogether, this year, more than 6,000 different items were sold in the 15 private labels and for the last quarter we have many new features to take advantage of the main events of the period.
13
Earnings Release 3Q18 and 9M18
DIGITAL PLATFORM – B2W DIGITAL B2W DIGITAL ANNOUNCES POSITIVE CASH GENERATION OF R$ 58 MILLION
B2W Digital is the leader in Latin America and its purpose is to CONNECT PEOPLE, BUSINESS, PRODUCTS AND SERVICES IN A DIGITAL PLATFORM.
Lojas Americanas is the controlling shareholder of B2W DIGITAL with a participation of 61.51%. The shares of the Company are negotiated through the ticker BTOW3 on B3, in the Novo Mercado segment, which has the highest Corporate Governance index in Brazil. B2W Digital had cash generation of R$ 57.7 MM in 3Q18, an evolution of 31% or R$ 14 MM in relation to R$
44 MM registered in 3Q17. In 9M18, cash consumption totaled R$ 454 MM, down 69% or R $ 1,011 MM compared to R $ 1,465 MM recorded in 9M17. In the last 12 months, cash generation was positive R$ 56 MM.
B2W Marketplace connected more than 3.4 thousand new Sellers in 3Q18, expanding from a base of 15.4 thousand Sellers in June/18 to more than 18.8 thousand Sellers in September/18. The Sellers base increased by 2.4x from 3Q17 to 3Q18 (from 7.8 thousand to 18.8 thousand Sellers).
B2W Entrega connected more than 3.7 thousand Sellers in 3Q18, totaling a base of 15.0 thousand Sellers and representing 79.8% of Sellers connected to the B2W Marketplace.
B2W Marketplace launched Credit Seller, a new financial product for Sellers on the B2W Marketplace. B2W initiates the offer of credit (loans) quickly, safely and simply, and 100% online. The offering allows for Sellers to contract products and invest more in inventory and competitiveness, as well as in their operations to accelerate their sales within the platform.
Ame Digital reached 800 thousand downloads in 5 months of operation. The digital payment account is now also accepted on Submarino (in addition to Americanas.com and Shoptime). Ame Digital has been gaining strong traction across B2W's brands, optimizing offers to customers with discounts (cashback), generating greater repeat purchases, and increased spending.
B2W Marketplace announces the integration of Promo Seller with Ame Digital. The program enables Sellers to use the B2W Marketplace promotional tool (Promo Seller) to invest in an additional cashback offer for customers who pay with Ame.
For more information about B2W Digital, click here.
14
Earnings Release 3Q18 and 9M18 O2O (Online to Offline) B2W and Lojas Americanas continue accelerating the importante initiatives O2O - Online to Offline:
Lojas Americanas in B2W Digital’s Marketplace: In 3Q18, Lojas Americanas expanded its operations as a seller in the B2W marketplace to all states in the South and Southeast regions, in addition to having expanded the assortment available with exclusive items for the channel. This initiative allows to further increase the capillarity of the operation, diversify the assortment and offer more convenience options for customers. By the end of the year, the operation will serve 100% of the national territory.
Click and Collect: Currently available in more than 1,000 stores (vs. 580 stores in the 2Q18), surpassing the goal of 800 stores by the end of the year and becoming the only click and collect model with presence in all Brazilian states. Click and Collect Now: The initiative enables online purchase with product withdrawal (store inventory) within 1 hour at a chosen physical store. Each physical store functions as a seller in the B2W Marketplace, making the products available (store inventory) without freight charges. So far we are operating in more than 1,000 stores and by the end of 2018, will be available and all Lojas Americanas will be connected.
PRICING
In order to intermediate the cooperation program between PUC-RJ and the Lojas Americanas’ commercial department, the Company has created a new business department, with the objective of transforming theoretical solutions into practices that bring measurable results. Following the format of constant revisions of the models and seeking the continuous improvement
of the processes, we improved the model of the sweets and candies department. Thus, with the updated model, new prices were tested in order to improve profitability and sales volume and the results were positive. The study of the coloring lines within the department of hygiene and beauty evolved significantly in the quarter. The model is based on the sales history and includes the parameterization of the positioning of the lines and other commercial variables. The results obtained are satisfactory, forming the basis for the practice of regionalized prices and understanding of the demands of each region. The study on price regionalization has been a front of specific tests aimed at ensuring a better corporate decision-making by the company's commercial departments. In addition, for the planning of the Red Friday event, we have established a specific modeling to balance the
commercial variables in function of the bets of the departments. This project is part of a continuous improvement process being used as a support to the company's commercial decisions.
APP AMERICANAS.COM GET THE APP GET A DISCOUNT The Lojas Americanas discount area on the Americanas.com app showed a strong expansion of use by customers in more than 1,350 stores. After 1 year of operation, more than 15 million accesses to the offered discounts have been achieved, attending purchase wishes for various products ranging from chocolates to smartphones. In addition, we accelerated custom actions for customers through the use of big data and analytics to optimize special deals with our suppliers.
15
Earnings Release 3Q18 and 9M18 SOCIAL MEDIA Lojas Americanas continues to grow its presence in the digital world by increasing its presence in social networks. We recently reached 3 million followers on Instagram, always bringing promotions, news and launches to the customers. On Facebook, we continue among the 50 biggest pages of Brazil, being the best placed retailer and, moreover, we are among the top 10 physical retailers in the world. The social networks are an excellent alternative for the dissemination of products to customers. Through them we have a return on the promotions, listen to the suggestions and all the feedback given by the clients, providing our sales team with relevant and strategic information. We also use these tools to promote new lines of our private labels, products, financial services, giving visibility to the innovations available in our stores. AWARDS AND RECOGNITIONS Lojas Americanas invests in actions that improve its management processes such as improvements in customer service, quality control of products and services, supplier audits, operation of distribution centers and optimization of internal processes. As a consequence of this effort, the Company has received several awards and recognitions that reinforce the brand's value, its reputation and its commitment to customers. Among the awards and recognitions received in the 3Q18, the highlights were:
Reputation Pulse - Reputation Institute Lojas Americanas reached the 1st place in the Retail category. In Brazil, more than 300 companies were surveyed between January and February 2018, with results that reinforce the importance of good reputation management to influence the perception of different stakeholders about the organizations.
Empresas Mais – Estadão Lojas Americanas was featured in Corporate Governance and Innovation.Created in 2015, the business ranking developed by Estadão in partnership with FIA - Fundação Instituto de Administração - shows the largest and most efficient companies in Brazil.
As Melhores da Dinheiro - IstoÉ Dinheiro Lojas Americanas was featured in the category "Social Responsibility". The survey involved more than 1,000 of the country's largest companies in a qualitative way. It is the only list of its kind that analyzes companies not only for their financial performance but also taking into account management indicators in the areas of innovation and quality, social responsibility, human resources and corporate governance.
Os Mais Amados do Rio - Veja Rio Lojas Americanas reached the 1st place in the Electronics Store category. The first award in 2018, by Veja Rio in partnership with MindMiners, consulted more than 1,000 residents of Rio de Janeiro, Baixada Fluminense and Niterói, with the objective of knowing, among the 40 categories, the brands, institutions, places and restaurants that are in the head and heart of the cariocas.
Prêmio Socioambiental Chico Mendes - Chico Mendes Institute Lojas Americanas won the Green Seal Certification granted by the Chico Mendes Institute with the Galpão Aplauso case, which shows the work developed by the NGO with young people in social vulnerability, through its own methodology and the Professional Training Course in Logistics, generating employability. The objective of the award is to enhance and stimulate good socio-environmental practices through the dissemination of examples based on sustainability, social justice and respect for life.
Reclame Aqui – Época Lojas Americanas won, for the sixth consecutive time, in the category "Retail Chains". The award recognizes the best companies for costumers based on a popular vote.
120 Maiores Empresas do Varejo Brasileiro - IBEVAR Lojas Americanas reached the 1st place in the Department Stores category. The purpose of the ranking is to present the list of 120 prominent companies by billing in the Brazilian consumer goods retail and Lojas Americanas.
16
Earnings Release 3Q18 and 9M18 SUSTAINABILITY Lojas Americanas's sustainability strategy is defined by the UN Agenda 2030, in which society and companies commit to developing the ODS (Sustainable Development Objectives) by the year 2030. Of the 17 ODS, the Company develops 11 through their actions and projects. In the 3Q18, the company signed the corporate pact for integrity and against corruption, committed to disseminate Brazilian anticorruption legislation to its employees and stakeholders, so that it can be fully complied with. In addition, the Company undertakes to prohibit any form of bribery, work for legality and transparency in contributions to political campaigns, and prioritize for transparency of information and collaboration in investigations when necessary. In the environmental field, Lojas Americanas won for the second time the Gold Seal of the Brazilian GHG Protocol Program. The company once again had its inventories of greenhouse gas emissions verified by an external audit, thus reaffirming its commitment to transparency and quality of information. As a result of the work carried out last year, Lojas Americanas was featured in social responsibility of the "As melhores da Dinheiro" ranking of IstoÉ Dinheiro 2018. The survey analyzed more than 1,000 of the largest companies in the country in a qualitative way, including important dimensions such as social responsibility. This is the recognition of a joint work for the construction of an increasingly sustainable company.
17
Earnings Release 3Q18 and 9M18
GENERAL CONSIDERATIONS
ABOUT LOJAS AMERICANAS S.A.
Lojas Americanas, one of the main retail chains in Brazil, is present all over the national territory through its multichannel chain, which comprises bricks-and-mortar stores, e-commerce, kiosks, telesales, TV channel and catalogues operations. The Company operates with two store formats: Traditional and Express. The first one has an average sales area of 1,000 square meters, an automated replenishment model and an assortment of 60,000 items while the second format has an average sales area of 400 square meters, just-in-time logistics and an assortment of 15,000 items, selected according to each location’s needs. Additionally, the Company is developing the new convenience store model with a mix of products directed to food convenience. Lojas Americanas’ assortment is in continuous evolution, always aiming to exceed clients’ expectations when meeting their needs.
In 09/30/2018, the 1,360 stores – 837 in the Traditional format, 503 in the Express format and 20 Convenience stores – have a sales area equivalent to 1,090.8 thousand square meter. In addition, they are present in 550 cities on all Brazilian states and are served by four distribution centers, located in Minas Gerais, Pernambuco, São Paulo and Rio de Janeiro. Our stores aredistributed as follows: 53.2% in Southeast region, 27.6% in the North/Northeast and 19.2% in the South/Midwest and
Lojas Americanas’ shares are listed on the B3 through ticker symbols LAME3 (common) and LAME4 (preferred).
For more information of the multiple and complementary platform of the Company, click here.
CORPORATE GOVERNANCE
Lojas Americanas S.A. has been listed on the Brazilian Stock Exchange (B3) since 1940. The Company has a shareholder base composed of common shares (LAME3) and preferred shares (LAME4). In addition, the Company approved in an Extraordinary General Meeting held on August 17th, 2017 the proposal to migrate to the special listing segment of the Level 1 of Corporate Governance. The Company has a Board of Directors composed by eight members – five appointed by the controllers and three appointed by the Board of Directors. Lojas Americanas also has a Fiscal Council formed by three members, one indicated by the controllers and two indicated by the minority shareholders.
“We Always Want More”
18
Earnings Release 3Q18 and 9M18
APPENDIX I – INCOME STATEMENT - CONSOLIDATED
Adjusted EBITDA - Operating profit before interest, taxes, depreciation and amortization, other operating income/expenses and minority Interest.
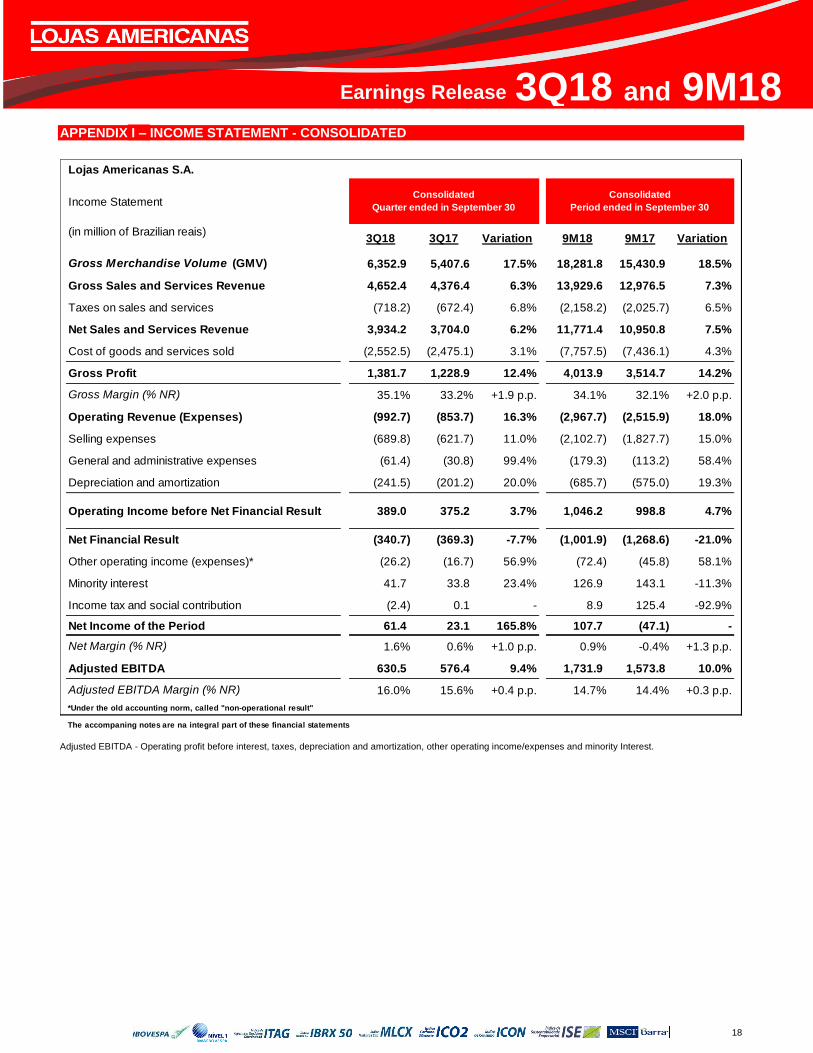
Lojas Americanas S.A.
Income Statement
(in million of Brazilian reais)3Q18 3Q17 Variation 9M18 9M17 Variation
Gross Merchandise Volume (GMV) 6,352.9 5,407.6 17.5% 18,281.8 15,430.9 18.5%
Gross Sales and Services Revenue 4,652.4 4,376.4 6.3% 13,929.6 12,976.5 7.3%
Taxes on sales and services (718.2) (672.4) 6.8% (2,158.2) (2,025.7) 6.5%
Net Sales and Services Revenue 3,934.2 3,704.0 6.2% 11,771.4 10,950.8 7.5%
Cost of goods and services sold (2,552.5) (2,475.1) 3.1% (7,757.5) (7,436.1) 4.3%
Gross Profit 1,381.7 1,228.9 12.4% 4,013.9 3,514.7 14.2%
Gross Margin (% NR) 35.1% 33.2% +1.9 p.p. 34.1% 32.1% +2.0 p.p.
Operating Revenue (Expenses) (992.7) (853.7) 16.3% (2,967.7) (2,515.9) 18.0%
Selling expenses (689.8) (621.7) 11.0% (2,102.7) (1,827.7) 15.0%
General and administrative expenses (61.4) (30.8) 99.4% (179.3) (113.2) 58.4%
Depreciation and amortization (241.5) (201.2) 20.0% (685.7) (575.0) 19.3%
Operating Income before Net Financial Result 389.0 375.2 3.7% 1,046.2 998.8 4.7%
Net Financial Result (340.7) (369.3) -7.7% (1,001.9) (1,268.6) -21.0%
Other operating income (expenses)* (26.2) (16.7) 56.9% (72.4) (45.8) 58.1%
Minority interest 41.7 33.8 23.4% 126.9 143.1 -11.3%
Income tax and social contribution (2.4) 0.1 - 8.9 125.4 -92.9%
Net Income of the Period 61.4 23.1 165.8% 107.7 (47.1) -
Net Margin (% NR) 1.6% 0.6% +1.0 p.p. 0.9% -0.4% +1.3 p.p.
Adjusted EBITDA 630.5 576.4 9.4% 1,731.9 1,573.8 10.0%
Adjusted EBITDA Margin (% NR) 16.0% 15.6% +0.4 p.p. 14.7% 14.4% +0.3 p.p.
*Under the old accounting norm, called "non-operational result"
The accompaning notes are na integral part of these financial statements
Consolidated
Quarter ended in September 30
Consolidated
Period ended in September 30
19
Earnings Release 3Q18 and 9M18
APPENDIX II – INCOME STATEMENT – PARENT COMPANY
Adjusted EBITDA - Operating profit before interest, taxes, depreciation and amortization, other operating income/expenses and equity accounting.
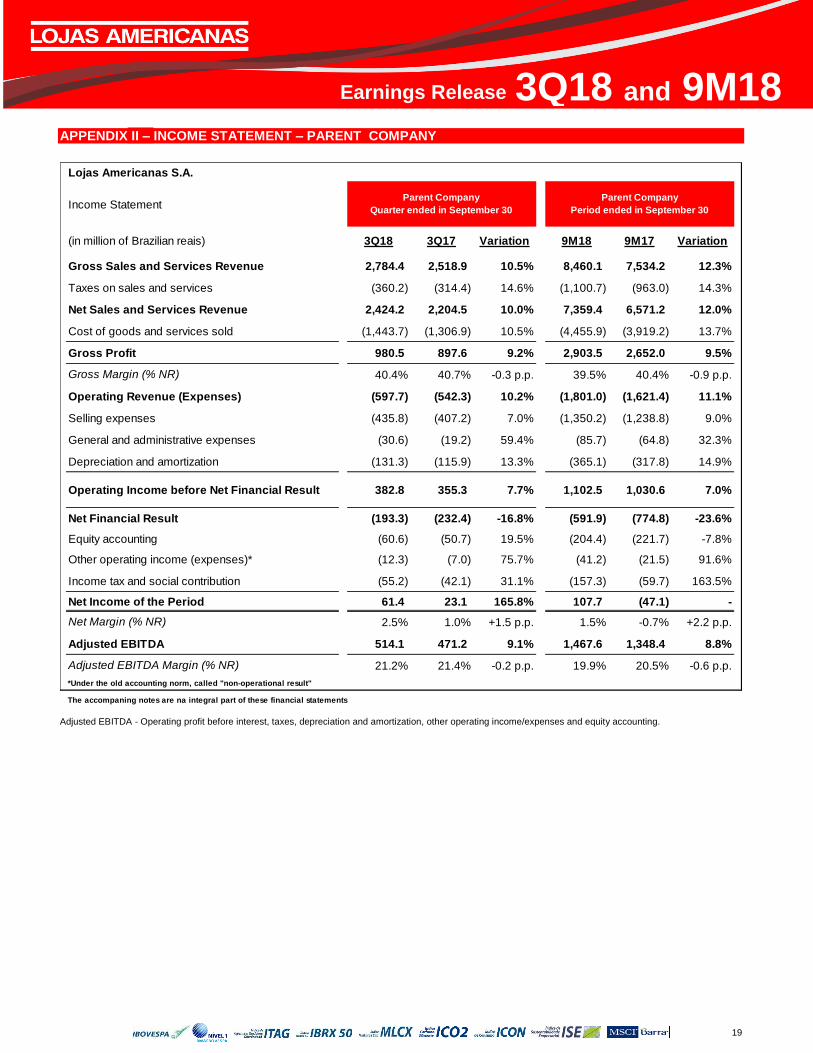
Lojas Americanas S.A.
Income Statement
(in million of Brazilian reais) 3Q18 3Q17 Variation 9M18 9M17 Variation
Gross Sales and Services Revenue 2,784.4 2,518.9 10.5% 8,460.1 7,534.2 12.3%
Taxes on sales and services (360.2) (314.4) 14.6% (1,100.7) (963.0) 14.3%
Net Sales and Services Revenue 2,424.2 2,204.5 10.0% 7,359.4 6,571.2 12.0%
Cost of goods and services sold (1,443.7) (1,306.9) 10.5% (4,455.9) (3,919.2) 13.7%
Gross Profit 980.5 897.6 9.2% 2,903.5 2,652.0 9.5%
Gross Margin (% NR) 40.4% 40.7% -0.3 p.p. 39.5% 40.4% -0.9 p.p.
Operating Revenue (Expenses) (597.7) (542.3) 10.2% (1,801.0) (1,621.4) 11.1%
Selling expenses (435.8) (407.2) 7.0% (1,350.2) (1,238.8) 9.0%
General and administrative expenses (30.6) (19.2) 59.4% (85.7) (64.8) 32.3%
Depreciation and amortization (131.3) (115.9) 13.3% (365.1) (317.8) 14.9%
Operating Income before Net Financial Result 382.8 355.3 7.7% 1,102.5 1,030.6 7.0%
Net Financial Result (193.3) (232.4) -16.8% (591.9) (774.8) -23.6%
Equity accounting (60.6) (50.7) 19.5% (204.4) (221.7) -7.8%
Other operating income (expenses)* (12.3) (7.0) 75.7% (41.2) (21.5) 91.6%
Income tax and social contribution (55.2) (42.1) 31.1% (157.3) (59.7) 163.5%
Net Income of the Period 61.4 23.1 165.8% 107.7 (47.1) -
Net Margin (% NR) 2.5% 1.0% +1.5 p.p. 1.5% -0.7% +2.2 p.p.
Adjusted EBITDA 514.1 471.2 9.1% 1,467.6 1,348.4 8.8%
Adjusted EBITDA Margin (% NR) 21.2% 21.4% -0.2 p.p. 19.9% 20.5% -0.6 p.p.
*Under the old accounting norm, called "non-operational result"
The accompaning notes are na integral part of these financial statements
Parent Company
Quarter ended in September 30
Parent Company
Period ended in September 30
20
Earnings Release 3Q18 and 9M18
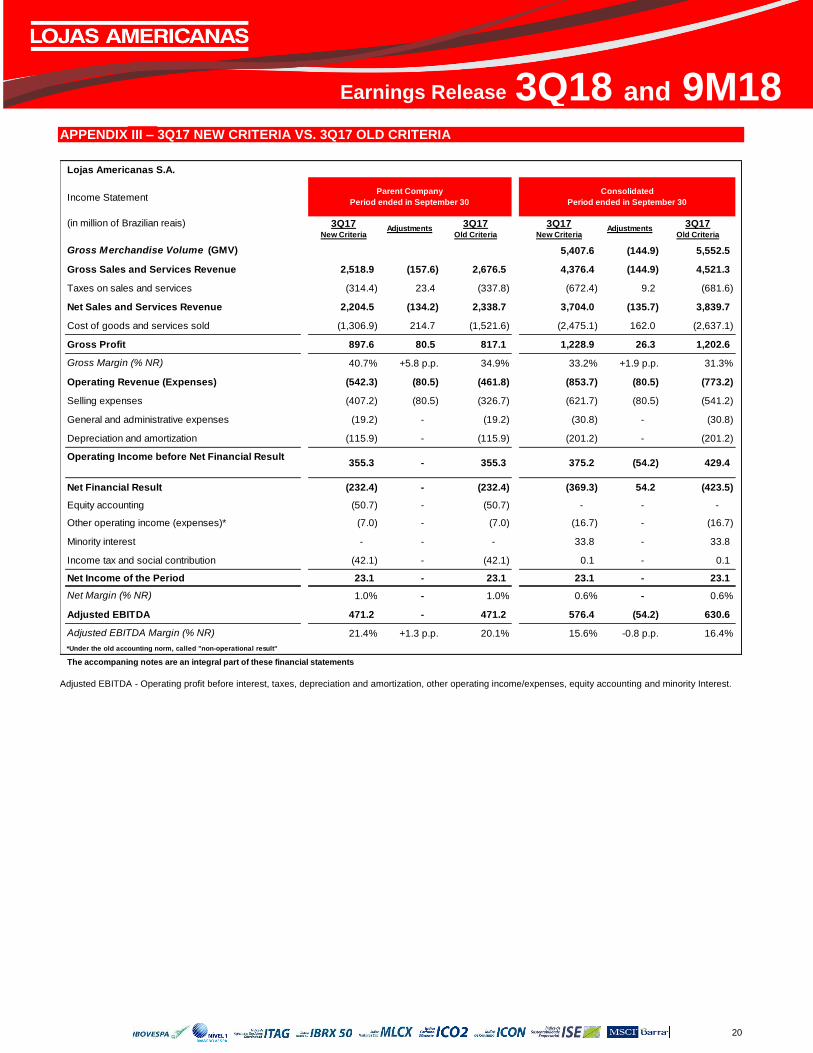
APPENDIX III – 3Q17 NEW CRITERIA VS. 3Q17 OLD CRITERIA
Adjusted EBITDA - Operating profit before interest, taxes, depreciation and amortization, other operating income/expenses, equity accounting and minority Interest.
Lojas Americanas S.A.
Income Statement
(in million of Brazilian reais) 3Q17New Criteria
Adjustments3Q17
Old Criteria
3Q17New Criteria
Adjustments3Q17
Old Criteria
Gross Merchandise Volume (GMV) 5,407.6 (144.9) 5,552.5
Gross Sales and Services Revenue 2,518.9 (157.6) 2,676.5 4,376.4 (144.9) 4,521.3
Taxes on sales and services (314.4) 23.4 (337.8) (672.4) 9.2 (681.6)
Net Sales and Services Revenue 2,204.5 (134.2) 2,338.7 3,704.0 (135.7) 3,839.7
Cost of goods and services sold (1,306.9) 214.7 (1,521.6) (2,475.1) 162.0 (2,637.1)
Gross Profit 897.6 80.5 817.1 1,228.9 26.3 1,202.6
Gross Margin (% NR) 40.7% +5.8 p.p. 34.9% 33.2% +1.9 p.p. 31.3%
Operating Revenue (Expenses) (542.3) (80.5) (461.8) (853.7) (80.5) (773.2)
Selling expenses (407.2) (80.5) (326.7) (621.7) (80.5) (541.2)
General and administrative expenses (19.2) - (19.2) (30.8) - (30.8)
Depreciation and amortization (115.9) - (115.9) (201.2) - (201.2)
Operating Income before Net Financial Result355.3 - 355.3 375.2 (54.2) 429.4
Net Financial Result (232.4) - (232.4) (369.3) 54.2 (423.5)
Equity accounting (50.7) - (50.7) - - -
Other operating income (expenses)* (7.0) - (7.0) (16.7) - (16.7)
Minority interest - - - 33.8 - 33.8
Income tax and social contribution (42.1) - (42.1) 0.1 - 0.1
Net Income of the Period 23.1 - 23.1 23.1 - 23.1
Net Margin (% NR) 1.0% - 1.0% 0.6% - 0.6%
Adjusted EBITDA 471.2 - 471.2 576.4 (54.2) 630.6
Adjusted EBITDA Margin (% NR) 21.4% +1.3 p.p. 20.1% 15.6% -0.8 p.p. 16.4%
*Under the old accounting norm, called "non-operational result"
The accompaning notes are an integral part of these financial statements
Parent Company
Period ended in September 30
Consolidated
Period ended in September 30
21
Earnings Release 3Q18 and 9M18
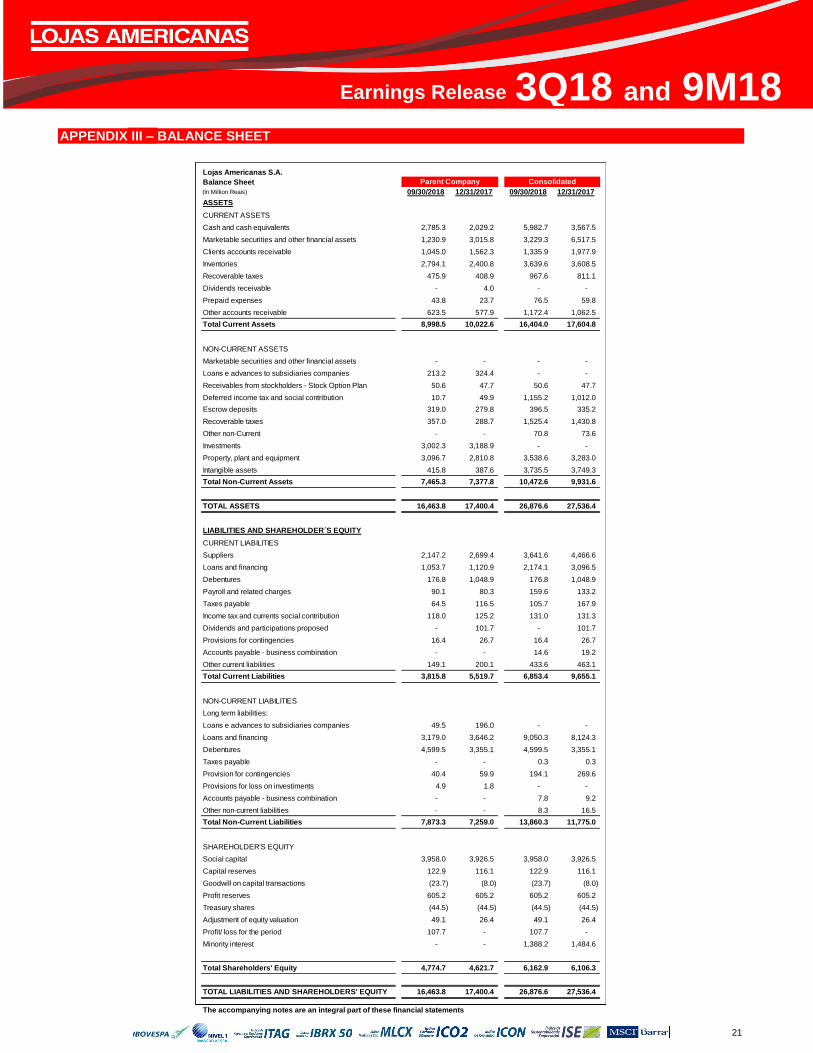
APPENDIX III – BALANCE SHEET
Lojas Americanas S.A.
Balance Sheet
(In Million Reais) 09/30/2018 12/31/2017 09/30/2018 12/31/2017
ASSETS
CURRENT ASSETS
Cash and cash equivalents 2,785.3 2,029.2 5,982.7 3,567.5
Marketable securities and other financial assets 1,230.9 3,015.8 3,229.3 6,517.5
Clients accounts receivable 1,045.0 1,562.3 1,335.9 1,977.9
Inventories 2,794.1 2,400.8 3,639.6 3,608.5
Recoverable taxes 475.9 408.9 967.6 811.1
Dividends receivable - 4.0 - -
Prepaid expenses 43.8 23.7 76.5 59.8
Other accounts receivable 623.5 577.9 1,172.4 1,062.5
Total Current Assets 8,998.5 10,022.6 16,404.0 17,604.8
NON-CURRENT ASSETS
Marketable securities and other financial assets - - - -
Loans e advances to subsidiaries companies 213.2 324.4 - -
Receivables from stockholders - Stock Option Plan 50.6 47.7 50.6 47.7
Deferred income tax and social contribution 10.7 49.9 1,155.2 1,012.0
Escrow deposits 319.0 279.8 396.5 335.2
Recoverable taxes 357.0 288.7 1,525.4 1,430.8
Other non-Current - - 70.8 73.6
Investments 3,002.3 3,188.9 - -
Property, plant and equipment 3,096.7 2,810.8 3,538.6 3,283.0
Intangible assets 415.8 387.6 3,735.5 3,749.3
Total Non-Current Assets 7,465.3 7,377.8 10,472.6 9,931.6
TOTAL ASSETS 16,463.8 17,400.4 26,876.6 27,536.4
LIABILITIES AND SHAREHOLDER´S EQUITY
CURRENT LIABILITIES
Suppliers 2,147.2 2,699.4 3,641.6 4,466.6
Loans and financing 1,053.7 1,120.9 2,174.1 3,096.5
Debentures 176.8 1,048.9 176.8 1,048.9
Payroll and related charges 90.1 80.3 159.6 133.2
Taxes payable 64.5 116.5 105.7 167.9
Income tax and currents social contribution 118.0 125.2 131.0 131.3
Dividends and participations proposed - 101.7 - 101.7
Provisions for contingencies 16.4 26.7 16.4 26.7
Accounts payable - business combination - - 14.6 19.2
Other current liabilities 149.1 200.1 433.6 463.1
Total Current Liabilities 3,815.8 5,519.7 6,853.4 9,655.1
NON-CURRENT LIABILITIES
Long term liabilities:
Loans e advances to subsidiaries companies 49.5 196.0 - -
Loans and financing 3,179.0 3,646.2 9,050.3 8,124.3
Debentures 4,599.5 3,355.1 4,599.5 3,355.1
Taxes payable - - 0.3 0.3
Provision for contingencies 40.4 59.9 194.1 269.6
Provisions for loss on investiments 4.9 1.8 - -
Accounts payable - business combination - - 7.8 9.2
Other non-current liabilities - - 8.3 16.5
Total Non-Current Liabilities 7,873.3 7,259.0 13,860.3 11,775.0
SHAREHOLDER'S EQUITY
Social capital 3,958.0 3,926.5 3,958.0 3,926.5
Capital reserves 122.9 116.1 122.9 116.1
Goodwill on capital transactions (23.7) (8.0) (23.7) (8.0)
Profit reserves 605.2 605.2 605.2 605.2
Treasury shares (44.5) (44.5) (44.5) (44.5)
Adjustment of equity valuation 49.1 26.4 49.1 26.4
Profit/ loss for the period 107.7 - 107.7 -
Minority interest - - 1,388.2 1,484.6
Total Shareholders' Equity 4,774.7 4,621.7 6,162.9 6,106.3
TOTAL LIABILITIES AND SHAREHOLDERS' EQUITY 16,463.8 17,400.4 26,876.6 27,536.4
The accompanying notes are an integral part of these financial statements
Parent Company Consolidated
22
Earnings Release 3Q18 and 9M18
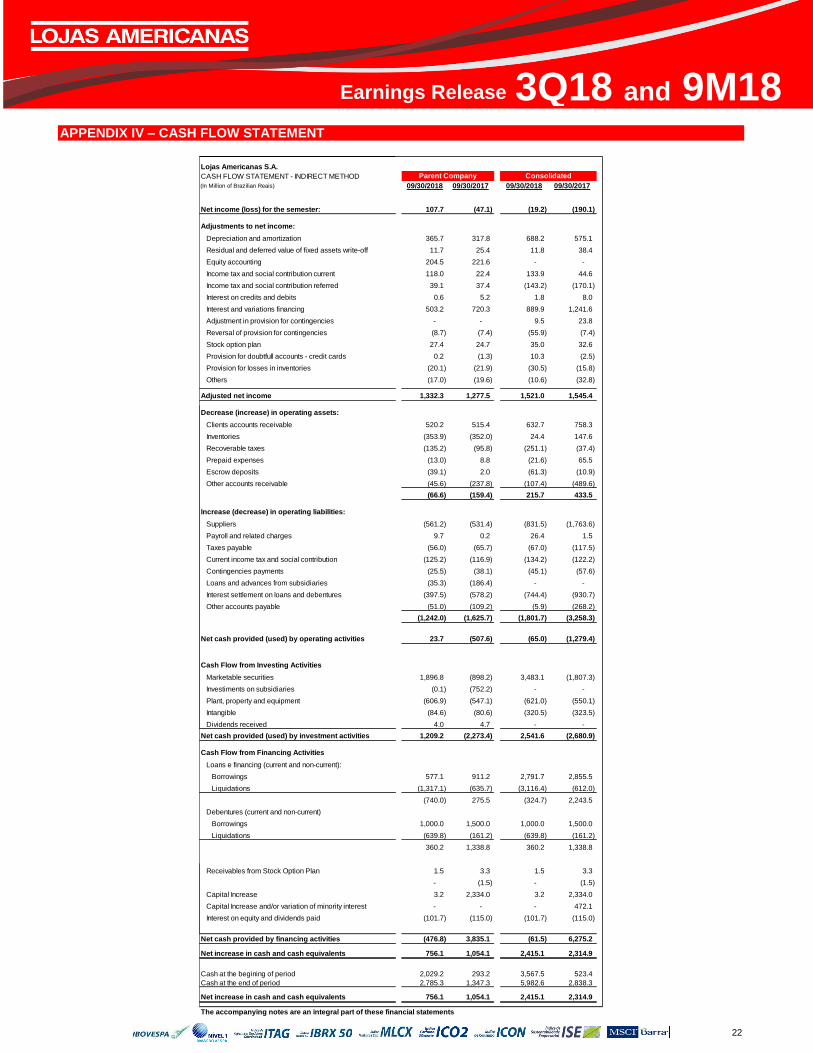
APPENDIX IV – CASH FLOW STATEMENT
Lojas Americanas S.A.
CASH FLOW STATEMENT - INDIRECT METHOD
(In Million of Brazilian Reais) 09/30/2018 09/30/2017 09/30/2018 09/30/2017Cash Flow from Operating Activities
Net income (loss) for the semester: 107.7 (47.1) (19.2) (190.1)
Adjustments to net income:
Depreciation and amortization 365.7 317.8 688.2 575.1
Residual and deferred value of fixed assets write-off 11.7 25.4 11.8 38.4
Equity accounting 204.5 221.6 - -
Income tax and social contribution current 118.0 22.4 133.9 44.6
Income tax and social contribution referred 39.1 37.4 (143.2) (170.1)
Interest on credits and debits 0.6 5.2 1.8 8.0
Interest and variations financing 503.2 720.3 889.9 1,241.6
Adjustment in provision for contingencies - - 9.5 23.8
Reversal of provision for contingencies (8.7) (7.4) (55.9) (7.4)
Stock option plan 27.4 24.7 35.0 32.6
Provision for doubtfull accounts - credit cards 0.2 (1.3) 10.3 (2.5)
Provision for losses in inventories (20.1) (21.9) (30.5) (15.8)
Others (17.0) (19.6) (10.6) (32.8)
Adjusted net income 1,332.3 1,277.5 1,521.0 1,545.4
Decrease (increase) in operating assets:
Clients accounts receivable 520.2 515.4 632.7 758.3
Inventories (353.9) (352.0) 24.4 147.6
Recoverable taxes (135.2) (95.8) (251.1) (37.4)
Prepaid expenses (13.0) 8.8 (21.6) 65.5
Escrow deposits (39.1) 2.0 (61.3) (10.9)
Other accounts receivable (45.6) (237.8) (107.4) (489.6)
(66.6) (159.4) 215.7 433.5
Increase (decrease) in operating liabilities:
Suppliers (561.2) (531.4) (831.5) (1,763.6)
Payroll and related charges 9.7 0.2 26.4 1.5
Taxes payable (56.0) (65.7) (67.0) (117.5)
Current income tax and social contribution (125.2) (116.9) (134.2) (122.2)
Contingencies payments (25.5) (38.1) (45.1) (57.6)
Loans and advances from subsidiaries (35.3) (186.4) - -
Interest settlement on loans and debentures (397.5) (578.2) (744.4) (930.7)
Other accounts payable (51.0) (109.2) (5.9) (268.2)
(1,242.0) (1,625.7) (1,801.7) (3,258.3)
Net cash provided (used) by operating activities 23.7 (507.6) (65.0) (1,279.4)
Cash Flow from Investing Activities
Marketable securities 1,896.8 (898.2) 3,483.1 (1,807.3)
Investiments on subsidiaries (0.1) (752.2) - -
Plant, property and equipment (606.9) (547.1) (621.0) (550.1)
Intangible (84.6) (80.6) (320.5) (323.5)
Dividends received 4.0 4.7 - -
Net cash provided (used) by investment activities 1,209.2 (2,273.4) 2,541.6 (2,680.9)
Cash Flow from Financing Activities
Loans e financing (current and non-current):
Borrowings 577.1 911.2 2,791.7 2,855.5
Liquidations (1,317.1) (635.7) (3,116.4) (612.0)
(740.0) 275.5 (324.7) 2,243.5
Debentures (current and non-current)
Borrowings 1,000.0 1,500.0 1,000.0 1,500.0
Liquidations (639.8) (161.2) (639.8) (161.2)
360.2 1,338.8 360.2 1,338.8
Receivables from Stock Option Plan 1.5 3.3 1.5 3.3
- (1.5) - (1.5)
Capital Increase 3.2 2,334.0 3.2 2,334.0
Capital Increase and/or variation of minority interest - - - 472.1
Interest on equity and dividends paid (101.7) (115.0) (101.7) (115.0)
Net cash provided by financing activities (476.8) 3,835.1 (61.5) 6,275.2
Net increase in cash and cash equivalents 756.1 1,054.1 2,415.1 2,314.9
Cash at the begining of period 2,029.2 293.2 3,567.5 523.4
Cash at the end of period 2,785.3 1,347.3 5,982.6 2,838.3
Net increase in cash and cash equivalents 756.1 1,054.1 2,415.1 2,314.9
The accompanying notes are an integral part of these financial statements
Parent Company Consolidated
23
Earnings Release 3Q18 and 9M18
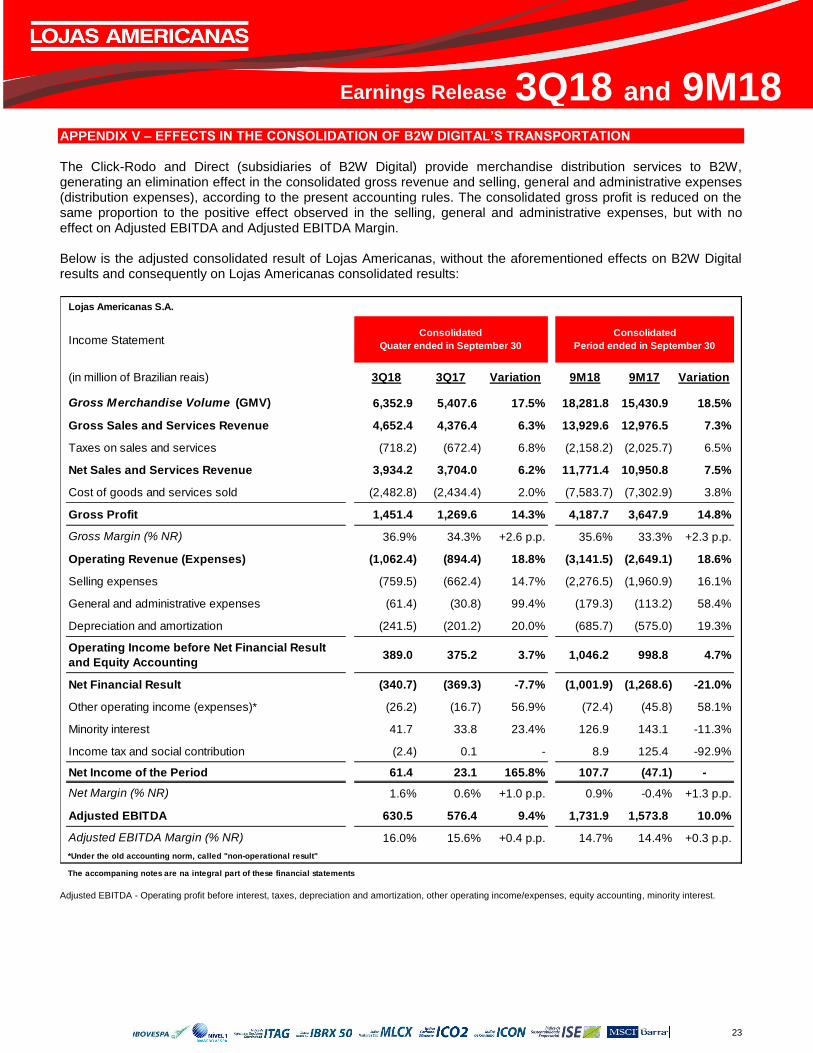
APPENDIX V – EFFECTS IN THE CONSOLIDATION OF B2W DIGITAL’S TRANSPORTATION The Click-Rodo and Direct (subsidiaries of B2W Digital) provide merchandise distribution services to B2W, generating an elimination effect in the consolidated gross revenue and selling, general and administrative expenses (distribution expenses), according to the present accounting rules. The consolidated gross profit is reduced on the same proportion to the positive effect observed in the selling, general and administrative expenses, but with no effect on Adjusted EBITDA and Adjusted EBITDA Margin. Below is the adjusted consolidated result of Lojas Americanas, without the aforementioned effects on B2W Digital results and consequently on Lojas Americanas consolidated results:
Adjusted EBITDA - Operating profit before interest, taxes, depreciation and amortization, other operating income/expenses, equity accounting, minority interest.
Lojas Americanas S.A.
Income Statement
(in million of Brazilian reais) 3Q18 3Q17 Variation 9M18 9M17 Variation
Gross Merchandise Volume (GMV) 6,352.9 5,407.6 17.5% 18,281.8 15,430.9 18.5%
Gross Sales and Services Revenue 4,652.4 4,376.4 6.3% 13,929.6 12,976.5 7.3%
Taxes on sales and services (718.2) (672.4) 6.8% (2,158.2) (2,025.7) 6.5%
Net Sales and Services Revenue 3,934.2 3,704.0 6.2% 11,771.4 10,950.8 7.5%
Cost of goods and services sold (2,482.8) (2,434.4) 2.0% (7,583.7) (7,302.9) 3.8%
Gross Profit 1,451.4 1,269.6 14.3% 4,187.7 3,647.9 14.8%
Gross Margin (% NR) 36.9% 34.3% +2.6 p.p. 35.6% 33.3% +2.3 p.p.
Operating Revenue (Expenses) (1,062.4) (894.4) 18.8% (3,141.5) (2,649.1) 18.6%
Selling expenses (759.5) (662.4) 14.7% (2,276.5) (1,960.9) 16.1%
General and administrative expenses (61.4) (30.8) 99.4% (179.3) (113.2) 58.4%
Depreciation and amortization (241.5) (201.2) 20.0% (685.7) (575.0) 19.3%
Operating Income before Net Financial Result
and Equity Accounting389.0 375.2 3.7% 1,046.2 998.8 4.7%
Net Financial Result (340.7) (369.3) -7.7% (1,001.9) (1,268.6) -21.0%
Other operating income (expenses)* (26.2) (16.7) 56.9% (72.4) (45.8) 58.1%
Minority interest 41.7 33.8 23.4% 126.9 143.1 -11.3%
Income tax and social contribution (2.4) 0.1 - 8.9 125.4 -92.9%
Net Income of the Period 61.4 23.1 165.8% 107.7 (47.1) -
Net Margin (% NR) 1.6% 0.6% +1.0 p.p. 0.9% -0.4% +1.3 p.p.
Adjusted EBITDA 630.5 576.4 9.4% 1,731.9 1,573.8 10.0%
Adjusted EBITDA Margin (% NR) 16.0% 15.6% +0.4 p.p. 14.7% 14.4% +0.3 p.p.
*Under the old accounting norm, called "non-operational result"
The accompaning notes are na integral part of these financial statements
Consolidated
Quater ended in September 30
Consolidated
Period ended in September 30
24
Earnings Release 3Q18 and 9M18
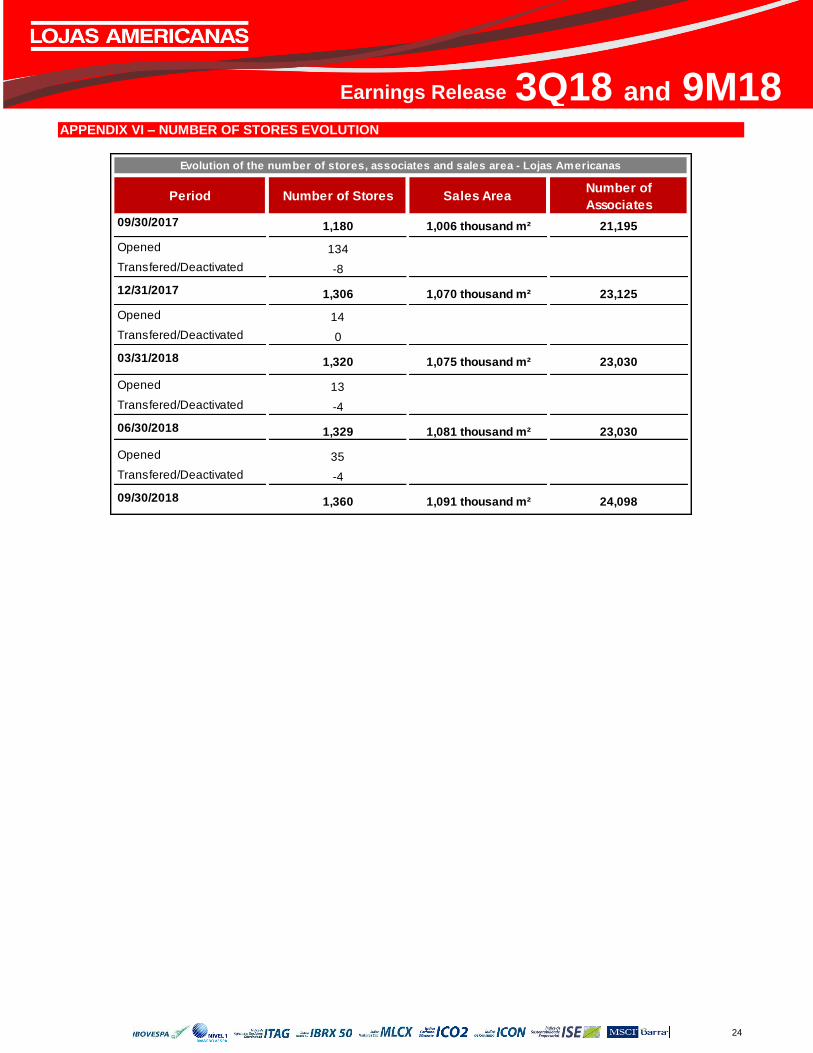
APPENDIX VI – NUMBER OF STORES EVOLUTION
Period Number of Stores Sales AreaNumber of
Associates
09/30/2017 1,180 1,006 thousand m² 21,195
Opened 134
Transfered/Deactivated -8
12/31/2017 1,306 1,070 thousand m² 23,125
Opened 14
Transfered/Deactivated 0
03/31/2018 1,320 1,075 thousand m² 23,030
Opened 13
Transfered/Deactivated -4
06/30/2018 1,329 1,081 thousand m² 23,030
Opened 35
Transfered/Deactivated -4
09/30/2018 1,360 1,091 thousand m² 24,098
Evolution of the number of stores, associates and sales area - Lojas Americanas
25
Earnings Release 3Q18 and 9M18
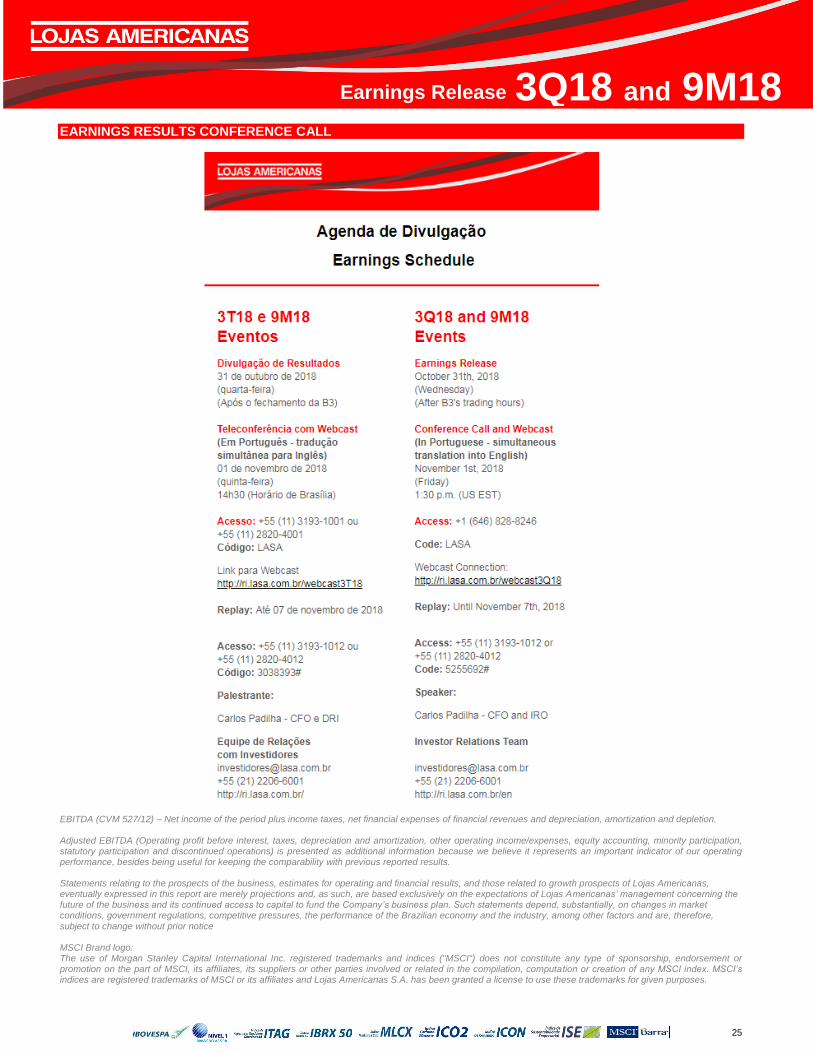
EARNINGS RESULTS CONFERENCE CALL
EBITDA (CVM 527/12) – Net income of the period plus income taxes, net financial expenses of financial revenues and depreciation, amortization and depletion. Adjusted EBITDA (Operating profit before interest, taxes, depreciation and amortization, other operating income/expenses, equity accounting, minority participation, statutory participation and discontinued operations) is presented as additional information because we believe it represents an important indicator of our operating performance, besides being useful for keeping the comparability with previous reported results. Statements relating to the prospects of the business, estimates for operating and financial results, and those related to growth prospects of Lojas Americanas, eventually expressed in this report are merely projections and, as such, are based exclusively on the expectations of Lojas Americanas’ management concerning the future of the business and its continued access to capital to fund the Company’s business plan. Such statements depend, substantially, on changes in market conditions, government regulations, competitive pressures, the performance of the Brazilian economy and the industry, among other factors and are, therefore,
subject to change without prior notice MSCI Brand logo: The use of Morgan Stanley Capital International Inc. registered trademarks and indices ("MSCI") does not constitute any type of sponsorship, endorsement or promotion on the part of MSCI, its affiliates, its suppliers or other parties involved or related in the compilation, computation or creation of any MSCI index. MSCI’s indices are registered trademarks of MSCI or its affiliates and Lojas Americanas S.A. has been granted a license to use these trademarks for given purposes.