Embed Size (px)
Citation preview

Press Release
www.pason.com 1 Press release - August 9, 2017
Pason Reports Second Quarter 2017 Results
FOR IMMEDIATE RELEASE
CALGARY, Alberta (August 9, 2017) – Pason Systems Inc. (TSX:PSI) announced today its 2017 second
quarter results.
Performance Data
Three Months Ended June 30, Six Months Ended June 30,
2017 2016 Change 2017 2016 Change
(CDN 000s, except per share data) ($) ($) (%) ($) ($) (%)
Revenue 55,792 27,173 105 114,841 72,986 57
Income (loss) 6,895 (11,319 ) — 14,048 (22,179 ) —
Per share – basic 0.08 (0.13 ) — 0.17 (0.26 ) —
Per share – diluted 0.08 (0.13 ) — 0.17 (0.26 ) —
EBITDA (1) 21,050 (2,231 ) — 44,519 (2,584 ) —
As a % of revenue 37.7 (8.2 ) — 38.8 (3.5 ) —
Adjusted EBITDA (1) 19,361 (1,470 ) — 44,269 7,293 507
As a % of revenue 34.7 (5.4 ) — 38.5 10.0 29
Funds flow from operations 18,795 (974 ) — 39,869 2,361 1,589
Per share – basic 0.22 (0.01 ) — 0.47 0.03 1,467
Per share – diluted 0.22 (0.01 ) — 0.47 0.03 1,467
Cash from operating activities 24,201 2,993 709 54,032 14,324 277
Free cash flow (1) 19,628 (2,461 ) — 48,139 1,680 2,765
Capital expenditures 5,099 4,929 3 6,233 11,509 (46 )
Working capital 197,191 197,843 — 197,191 197,843 —
Total assets 412,991 456,894 (10 ) 412,991 456,894 (10 )
Total long-term debt — — — — — —
Cash dividends declared 0.17 0.17 — 0.34 0.34 —
Shares outstanding end of period (#000's) 84,814
84,280
1
84,814
84,280
1
(1) Non-IFRS financial measures are defined in the Management's Discussion and Analysis section.
Q2 2017 vs Q2 2016
The Company generated consolidated revenue of $55.8 million in the second quarter of 2017, an increase
of 105% from the same period in 2016. Stable commodity prices and continued optimism has led to
increased drilling activity in Canada and the US market. Revenue in the second quarter of 2017, when
compared to 2016, also benefited by a lower Canadian dollar relative to the US dollar. Revenue from the
International business unit increased modestly compared to the second quarter of 2016.

Press Release
www.pason.com 2 Press release - August 9, 2017
Consolidated adjusted EBITDA increased to $19.4 million in the second quarter, up from a negative $1.5
million in the second quarter of 2016. Strong operational performance in North America gross profit
performance led to the rebound in these key measures.
The Company recorded net income of $6.9 million ($0.08 per share) in the second quarter of 2017,
compared to a net loss of $11.3 million ($0.13 per share) recorded in the same period in 2016. The increase
in Canadian and US revenue combined with cost reduction programs previously implemented and a
significant decline in depreciation expense from prior year levels led to the increase in income from 2016
levels. In addition, the strengthening Canadian dollar toward the end of the second quarter of 2017 led to a
lower effective tax rate for the second quarter of 2017.

www.pason.com 3 Press release - August 9, 2017
President’s Message
The second quarter of each year generally has the lowest drilling activity due to spring break-up in Canada,
when many areas are not accessible because of ground conditions. As a result, financial performance in
the second quarter is usually weaker than in the first. This was again the case this year. However, due to
higher drilling activity in the United States, in Canada, and in certain International markets, as well as lower
operating costs, Pason’s financial performance improved significantly from the second quarter of 2016.
Revenue for the quarter was up 105% to $55.8 million from the previous year period. Income for the second
quarter of 2017 was $6.9 million, or $0.08 per share, compared to a loss of $11.3 million in the previous
year. Adjusted EBITDA was $19.4 million, resulting in an adjusted EBITDA margin of 35%. Free Cash Flow
for the quarter was $19.6 million. At June 30, 2017, our working capital position stood at $197 million,
including cash at $167 million. There is no debt on our balance sheet. We are maintaining our quarterly
dividend at $0.17 per share.
The key drivers of improved financial performance were: 1) higher drilling activity in the United States -
especially in the Permian region - as well as in Canada; 2) increased US market share; and 3) a significant
reduction in operating costs and depreciation.
The impact of previously implemented cost reduction programs is highlighted by comparing this quarter’s
results with the second quarter of 2015. While revenue was essentially at the same level, EBITDA increased
from $7.5 million the second quarter of 2015 to $21.1 million in the second quarter of 2017. Our recorded
net income was also much improved. We expect to continue to reap the benefits of our lower fixed cost
structure into the foreseeable future.
Since the beginning of this year, growth in land-based drilling activity in North America has exceeded our
expectations. The US land rig count now stands at 930 and the average for Canada year-to-date is at 180.
While we don’t expect to see immediate reductions in operator capital budgets - and thus drilling activity -
we believe growth will be muted going forward. Operator capital budgets are likely to be significantly
impacted by future commodity prices, and the potential to return to lower commodity prices, as well as
continued pipeline and LNG uncertainty in Canada, may create headwinds to continued growth in industry
activity.
Pason’s two main objectives for 2017 remain unchanged: 1) to fully participate in the industry’s upturn while
containing growth of the cost base; and 2) to become a key enabler of drilling automation and big data
strategies.
We continue to invest approximately $30 million annually in R&D and IT. In addition to continuously
enhancing the functionality and performance of existing products, our development efforts are focused on
products that directly improve the efficiency, effectiveness and safety of drilling operations and wellbore
quality.

www.pason.com 4 Press release - August 9, 2017
Examples of this include our ePVT Adaptive Alarms and Digital Trip Sheets, AC AutoDriller, abbl Directional
Advisor and the deployment of the advanced Exxon Drilling Advisory System. We are building on our
acquisition of Verdazo Analytics to provide customers with a holistic platform to analyze drilling, production,
and operational data. The deployment of an enhanced Live Rig View (LRV) web service to our cloud-based
offering benefits office-based users of Pason data.
Our capital expenditures will be relatively modest going forward with a larger portion of our current
development efforts focused on software and analytics. Our very capable and flexible rigsite IT and
communications platform can host new Pason and third party software. For 2017, we intend to spend up to
$25 million in capital expenditures.
Pason’s market position remains very strong and the outlook for our new products and services looks
promising. We are the service provider of choice for many leading operators and drilling contractors with
Pason equipment installed on over 65% of all active land drilling rigs in the Western Hemisphere and a
growing presence in the Middle East.
Marcel Kessler
President and Chief Executive Officer
August 9, 2017
www.pason.com 5 Press release - August 9, 2017
Management’s Discussion and Analysis
The following discussion and analysis has been prepared by management as of August 9, 2017, and is a
review of the financial condition and results of operations of Pason Systems Inc. (Pason or the Company)
based on International Financial Reporting Standards (IFRS) and should be read in conjunction with the
consolidated financial statements and accompanying notes.
Certain information regarding the Company contained herein may constitute forward-looking statements
under applicable securities laws. Such statements are subject to known or unknown risks and uncertainties
that may cause actual results to differ materially from those anticipated or implied in the forward-looking
statements.
All financial measures presented in this report are expressed in Canadian dollars unless otherwise
indicated.
Additional IFRS Measures
In its interim condensed consolidated financial statements, the Corporation uses certain additional IFRS
measures. Management believes these measures provide useful supplemental information to readers.
Funds flow from operations
Management believes that funds flow from operations, as reported in the Consolidated Statements of Cash
Flows, is a useful additional measure as it represents the cash generated during the period, regardless of
the timing of collection of receivables and payment of payables. Funds flow from operations represents the
cash flow from continuing operations, excluding non-cash items. Funds flow from operations is defined as
net income adjusted for depreciation and amortization expense, non-cash stock-based compensation
expense, deferred taxes, and other non-cash items impacting operations.
Cash from operating activities
Cash from operating activities is defined as funds flow from operations adjusted for changes in working
capital items.
Non-IFRS Financial Measures
These definitions are not recognized measures under IFRS, and accordingly, may not be comparable to
measures used by other companies. These Non-IFRS measures provide readers with additional information
regarding the Company's ability to generate funds to finance its operations, fund its research and
development and capital expenditure program, and pay dividends.
Revenue per EDR Day

www.pason.com 6 Press release - August 9, 2017
Revenue per EDR day is defined as the daily revenue generated from all products that the Company has
on rent on a drilling rig that has the Company’s base EDR installed. This metric provides a key measure on
the Company’s ability to increase production adoption and evaluate product pricing.
EBITDA
EBITDA is defined as net income before interest expense, income taxes, stock-based compensation
expense, depreciation and amortization expense, and gains on disposal of investments.
Adjusted EBITDA
Adjusted EBITDA is defined as EBITDA, adjusted for foreign exchange, impairment of property, plant, and
equipment, restructuring costs, and other items which the Company does not consider to be in the normal
course of continuing operations.
Free cash flow
Free cash flow is defined as cash from operating activities plus proceeds on disposal of property, plant, and
equipment, less capital expenditures, and deferred development costs.

www.pason.com 7 Press release - August 9, 2017
Overall Performance
Three Months Ended June 30, Six Months Ended June 30,
2017 2016 Change 2017 2016 Change
(000s) ($) ($) (%) ($) ($) (%)
Revenue Electronic Drilling Recorder 27,147 11,462 137 52,803 30,617 72
Pit Volume Totalizer/ePVT 7,723 3,465 123 16,299 9,821 66
Communications 4,926 2,258 118 11,849 6,589 80
Software 4,887 1,791 173 9,903 4,922 101
AutoDriller 3,021 1,517 99 6,850 4,283 60
Gas Analyzer 3,679 1,853 99 8,291 5,477 51
Other 4,409 4,827 (9 ) 8,846 11,277 (22 )
Total revenue 55,792 27,173 105 114,841 72,986 57
Electronic Drilling Recorder (EDR) and Pit Volume Totalizer (PVT) rental day performance for Canada and
the United States is reported below:
Canada
Three Months Ended June 30, Six Months Ended June 30,
2017 2016 Change 2017 2016 Change
# # (%) # # (%)
EDR rental days 9,200 4,400 109 33,000 19,400 70
PVT rental days 8,800 4,000 120 30,600 18,000 70
United States
Three Months Ended June 30, Six Months Ended June 30,
2017 2016 Change 2017 2016 Change
# # (%) # # (%)
EDR rental days 43,700 18,400 138 79,000 43,600 81
PVT rental days 34,900 14,400 142 62,600 33,400 87

www.pason.com 8 Press release - August 9, 2017
The Pason EDR remains the Company's primary product. The EDR provides a complete system of drilling
data acquisition, data networking, and drilling management tools and reports at both the wellsite and
customer offices. The EDR is the base product from which all other wellsite instrumentation products are
linked. By linking these products, a number of otherwise redundant elements such as data processing,
display, storage, and networking are eliminated. This ensures greater reliability and a more robust system
of instrumentation for the customer.
Total revenue increased 105% and 57% for the three and six months ending June 2017, over the same
period in 2016. This increase is attributable to an increase in drilling activity in the Company's North
American markets. The second quarter 2017 results benefited from a weaker Canadian dollar relative to
the US dollar.
Industry activity in the US market increased 118% in the second quarter of 2017 compared to the
corresponding period in 2016 (68% on a year-to-date basis), while second quarter Canadian rig activity
increased 141% (93% on a year-to-date basis). Canadian EDR days, which includes some non-oil and gas-
related activity, increased 109% in the second quarter of 2017 from 2016 levels (70% on a year-to-date
basis), while US EDR days increased by 138% from the second quarter of 2016 (81% on a year-to-date
basis).
For the first half of 2017, the Pason EDR was installed on 55% of the land rigs in the US compared to 51%
during the same time period in 2016.
The Canadian business unit continued to see increased competition from a number of competitors. For the
first half of 2017, the Pason EDR was installed on 89% of the land rigs in the Canadian market; for the
same period in 2016 the number of EDR days exceeded the number of reported industry days.
For the purposes of market share, the Company uses the number of EDR days billed and oil and gas drilling
days as reported by accepted industry sources.
The Canadian market saw continued pricing pressure during the second quarter of 2017 relative to the
same period in 2016.
The revenue generated from the Company's other wellsite instrumentation products tracked the percentage
increase in drilling activity. The notable exceptions were:
• increased product adoption of EDR peripherals, including workstations and Pason Rig Display
• continued increase in customer adoption of the communication solutions previously rolled out in
the Canadian and US markets
• increased ePVT adoption rates in the US
• increased AutoDriller rentals in both Canada and the US due to the significant increase in drilling
activity which led to more mechanical rigs being deployed in 2017 compared to 2016
• decreased revenue of service rig recorders in Latin America due to the drop in drilling activity which
impacted other revenue

www.pason.com 9 Press release - August 9, 2017
Included in the software category is revenue from the Company's data analytics subsidiary, Verdazo.
Other revenue is down due to the sale of the net operating assets of 3PS, Inc. (3PS) effective January 1,
2017.
For the second quarter of 2017, the Company saw an increase in rig count in its Australian and Andean
operating areas, compared to the corresponding period in 2016. Rig count continues to be depressed in
Argentina and Mexico. In the Middle East, the Company is realizing an increase in its share of net income
from its Saudi Arabia joint venture as a result of a continuing increases in rig count and market penetration.
Discussion of Operations
United States Operations
Three Months Ended June 30, Six Months Ended June 30,
2017 2016 Change 2017 2016 Change
(000s) ($) ($) (%) ($) ($) (%)
Revenue
Electronic Drilling Recorder 20,400 7,383 176 35,524 18,070 97
Pit Volume Totalizer/ePVT 5,594 2,174 157 10,197 5,350 91
Communications 3,389 1,172 189 5,972 2,717 120
Software 3,331 1,338 149 5,799 3,095 87
AutoDriller 1,816 617 194 3,224 1,582 104
Gas Analyzer 2,278 1,077 112 4,043 2,675 51
Other 2,387 2,630 (9 ) 4,402 6,528 (33 )
Total revenue 39,195 16,391 139 69,161 40,017 73
Operating costs 16,302 10,749 52 30,512 25,994 17
Depreciation and amortization 4,170 5,463 (24 ) 9,171 12,236 (25 )
Segment operating profit 18,723 179 10,360 29,478 1,787 1,550
Three Months Ended June 30, Six Months Ended June 30,
2017 2016 2017 2016
$ $ $ $
Revenue per EDR day - USD 661 624 649 621
Revenue per EDR day - CAD 889 804 866 827

www.pason.com 10 Press release - August 9, 2017
Momentum in the US land-based drilling count continued in the second quarter of 2017. Although the
majority of the absolute rig count gains were seen in the Permian and certain plays in Oklahoma, the Eagle
Ford and Bakken participated in the increase.
US segment revenue increased by 139% in the second quarter of 2017 over the 2016 comparable period.
For the first six months, revenue increased 73% compared to the prior year. Included in the prior year
results was revenue (included in other revenue) from 3PS, the net operating assets of which were sold
effective January 1, 2017. Removing 3PS revenue from the comparative figures, revenue increased by
165% in the second quarter of 2017 compared to 2016 (151% increase when measured in USD). The value
of the Canadian dollar relative to the US dollar had a positive impact on revenue when measured in
Canadian dollars in the second quarter of 2017. For the first half of 2017, revenue increased by 90% (89%
when measured in USD) when removing 3PS revenue.
Industry activity in the US market during the second quarter of 2017 increased 118% from the prior year,
and 68% for the first six months. US market share was 55% for the second quarter of 2017 compared to
51% during the same period of 2016, primarily driven by market share growth in key US regions combined
with changes in the mix of active customers.
EDR rental days increased by 138% for the quarter ended June 30, 2017, over the same time period in
2016, while revenue per EDR day in the second quarter of 2017 increased to US$661, an increase of
US$37 over the same period in 2016. This increase is due to an uptick on adoption of certain key products,
combined with continued customer acceptance of enhanced communication solutions. Pricing discounts
were similar to 2016 levels.
Revenue per EDR day for the first half of 2017 was US$649, up US$28 from the same period in 2016.
Operating costs increased by 52% in the second quarter relative to the same period in the prior year. When
measured in USD, and removing 3PS costs, operating costs increased by 68%, which is a direct result of
the business unit investing in field costs to meet the significant increase in drilling activity with the largest
increases in labour costs and repairs.
Depreciation expense for the second quarter of 2017 decreased 24% over 2016 amounts due to the
reduction in the capital program.
Segment profit increased by $18.5 million in the second quarter of 2017 compared to the corresponding
period in 2016.

www.pason.com 11 Press release - August 9, 2017
Canadian Operations
Three Months Ended June 30, Six Months Ended June 30,
2017 2016 Change 2017 2016 Change
(000s) ($) ($) (%) ($) ($) (%)
Revenue
Electronic Drilling Recorder 3,769 1,853 103 12,205 7,687 59
Pit Volume Totalizer/ePVT 1,502 827 82 4,979 3,359 48
Communications 1,489 759 96 5,341 3,188 68
Software 1,458 401 264 3,934 1,696 132
AutoDriller 709 301 136 2,658 1,405 89
Gas Analyzer 1,079 502 115 3,661 2,150 70
Other 473 357 32 1,688 1,340 26
Total revenue 10,479 5,000 110 34,466 20,825 66
Operating costs 5,559 3,995 39 11,353 9,319 22
Depreciation and amortization 5,645 6,331 (11 ) 11,579 13,913 (17 )
Segment operating (loss) profit (725 ) (5,326 ) 86 11,534 (2,407 ) —
Three Months Ended June 30, Six Months Ended June 30,
2017 2016 2017 2016
$ $ $ $
Revenue per EDR day- CAD 1,044 1,103 994 1,053
The second quarter showed significant improvement in WCSB rig count, with virtually all operators
increasing their activity.
Canadian segment revenue increased by 110% for the quarter ended June 30, 2017 compared to the same
period in 2016. This increase is the result of a 141% increase in the number of drilling industry days in the
second quarter compared to 2016 levels. Included in the software category is revenue earned by Verdazo.
EDR rental days increased 109% in the second quarter of 2017 compared to 2016 (70% for the first six
months of 2017).
Revenue per EDR day decreased by $59 to $1,044 during the second quarter of 2017 compared to 2016,
resulting from selective price discounts on certain products. Revenue per EDR day for the first half of 2017
was $994, down $59 from the same period in 2017. The Canadian business unit continues to see
competitive pricing pressure relative to prior periods.
Operating costs increased by 39% in the second quarter of 2017 relative to the same period in 2016 (22%
on a year-to-date basis), due to increased repair costs combined with the inclusion of Verdazo operating
costs.

www.pason.com 12 Press release - August 9, 2017
Depreciation and amortization expense decreased by approximately 11% for the three months ended
June 30, 2017. The 2017 amounts include the amortization of investment tax credits received in the second
quarter of 2017, offset by the amortization of intangibles that were recognized on the acquisition of Verdazo.
The second quarter 2017 operating loss of $0.7 million is an improvement of $6.1 million from the prior
year. Segment operating profit for the first six months of 2017 is $11.5 million compared to a loss of $2.4
million in the prior year.
International Operations
Three Months Ended June 30, Six Months Ended June 30,
2017 2016 Change 2017 2016 Change
(000s) ($) ($) (%) ($) ($) (%)
Revenue
Electronic Drilling Recorder 2,703 2,226 21 5,074 4,860 4
Pit Volume Totalizer/ePVT 627 464 35 1,123 1,112 1
Communications 323 327 (1 ) 536 684 (22 )
Software 98 52 88 170 131 30
AutoDriller 496 599 (17 ) 968 1,296 (25 )
Gas Analyzer 322 274 18 587 652 (10 )
Other 1,549 1,840 (16 ) 2,756 3,409 (19 )
Total revenue 6,118 5,782 6 11,214 12,144 (8 )
Operating costs 4,773 4,188 14 8,965 9,719 (8 )
Depreciation and amortization 1,008 1,784 (43 ) 2,046 3,791 (46 )
Segment operating profit (loss) 337 (190 ) — 203 (1,366 ) —
The international rig count was up in several of the Company's international markets, most notably Australia
and portions of the Andean region in South America. As a result, revenue in the International operations
segment increased 6% in the second quarter of 2017 compared to the same period in 2016. For the first
half of 2017 revenue decreased by 8% from prior years levels as a result of lower activity in the Company's
Argentina and Mexico markets.
Operating costs increased by 14% in the second quarter relative to the same period in the prior year as
result of increased operating costs in certain key markets. The Company anticipates that future pricing
arrangements will reflect these price increases.
Depreciation expense decreased by approximately 43% for the three months ended June 30, 2017.
The segment operating profit was $0.3 million for the second quarter of 2017, an improvement from the
$0.1 million loss recorded in the corresponding period in 2016. The year-to-date profit was $0.2 million
compared to a loss of $1.4 million in the prior year.

Pason Systems Inc. 2017 Second Quarter Financials 13
Corporate Expenses
Three Months Ended June 30, Six Months Ended June 30,
2017 2016 Change 2017 2016 Change
(000s) ($) ($) (%) ($) ($) (%)
Other expenses
Research and development 6,261 5,629 11 12,138 12,257 (1 )
Corporate services 3,536 4,082 (13 ) 7,604 8,404 (10 )
Stock-based compensation 3,177 2,238 42 5,724 3,200 79
Other
Restructuring costs — — — — 10,861 —
Foreign exchange (gain) loss (689 ) 396 — (466 ) (2,323 ) 80
Other (1,000 ) 365 — 216 1,339 (84 )
Total corporate expenses 11,285 12,710 (11 ) 25,216 33,738 (25 )
In the first quarter of 2016, the Company initiated additional cost reduction initiatives to address the
prolonged downturn in oil and gas drilling activity. As a result, the Company recorded a restructuring charge
of $10.9 million in the first quarter of 2016.
Q2 2017 vs Q1 2017
Consolidated revenue was $55.8 million in the second quarter of 2017 compared to $59.0 million in the first
quarter of 2017, a decrease of $3.2 million, or 5%. The second quarter is usually the Company's weakest
due to the spring break-up in Canada. US activity levels continued to increase from first quarter 2017
levels. The Canadian segment earned revenue of $10.5 million in the second quarter of 2017 compared to
$24.0 million in the first quarter of 2017, a decrease of $13.5 million. Revenue in the US market increased
by $9.2 million, from $30.0 million in the first quarter of 2017 to $39.2 million in the second quarter of 2017.
The International segment experienced a revenue increase of $1.0 million.
The Company recorded a net profit in the second quarter of 2017 of $6.9 million ($0.08 per share) compared
to a profit of $7.2 million ($0.08 per share) in the first quarter of 2017.
Sequentially, EBITDA decreased from $23.5 million in the first quarter of 2017 to $21.1 million in the second
quarter of 2017. Adjusted EBITDA, which adjusts for foreign exchange and certain non-recurring charges,
decreased from $24.9 million in the first quarter of 2017 to $19.4 million in the second quarter of 2017.
Funds flow from operations decreased from $21.1 million in the first quarter of 2017 to $18.8 million in the
second quarter of 2017.

www.pason.com 14 Press release - August 9, 2017
Second Quarter Conference Call
Pason will be conducting a conference call for interested analysts, brokers, investors and media
representatives to review its second quarter 2017 results at 9:00 am (Calgary time) on Thursday, August
10, 2017. The conference call dial-in number is 1-888-231-8191 or 1-647-427-7450. You can access the
seven-day replay by dialing 1-855-859-2056 or 1-416-849-0833, using password 35710957.
Pason Systems Inc. is a leading global provider of specialized data management systems for drilling rigs.
Our solutions, which include data acquisition, wellsite reporting, remote communications, web-based
information management, and analytics, enable collaboration between the rig and the office. Pason’s
common shares trade on the Toronto Stock Exchange under the symbol PSI.
Additional information, including the Company’s Annual Report and Annual Information Form for the year
ended December 31, 2016, is available on SEDAR at www.sedar.com or on the Company’s website at
www.pason.com.
www.pason.com 15 Press release - August 9, 2017
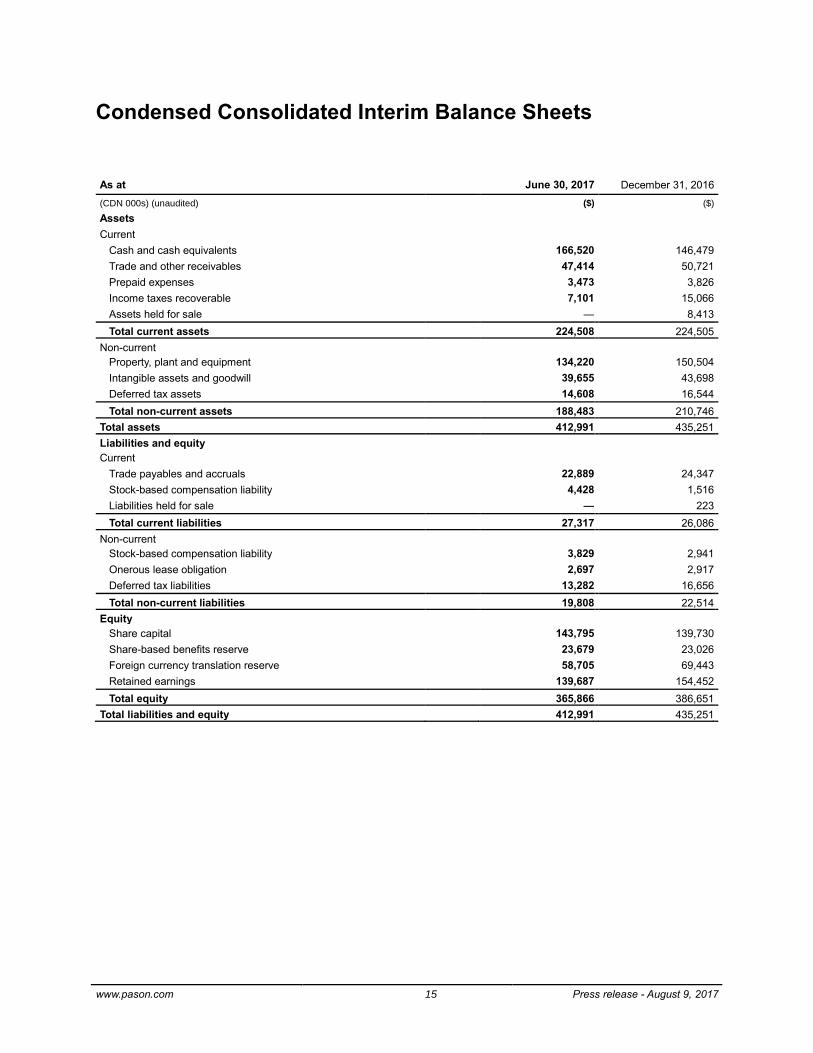
Condensed Consolidated Interim Balance Sheets
As at June 30, 2017 December 31, 2016
(CDN 000s) (unaudited) ($) ($)
Assets Current
Cash and cash equivalents 166,520 146,479
Trade and other receivables 47,414 50,721
Prepaid expenses 3,473 3,826
Income taxes recoverable 7,101 15,066
Assets held for sale — 8,413
Total current assets 224,508 224,505
Non-current Property, plant and equipment 134,220 150,504
Intangible assets and goodwill 39,655 43,698
Deferred tax assets 14,608 16,544
Total non-current assets 188,483 210,746
Total assets 412,991 435,251
Liabilities and equity Current
Trade payables and accruals 22,889 24,347
Stock-based compensation liability 4,428 1,516
Liabilities held for sale — 223
Total current liabilities 27,317 26,086
Non-current Stock-based compensation liability 3,829 2,941
Onerous lease obligation 2,697 2,917
Deferred tax liabilities 13,282 16,656
Total non-current liabilities 19,808 22,514
Equity Share capital 143,795 139,730
Share-based benefits reserve 23,679 23,026
Foreign currency translation reserve 58,705 69,443
Retained earnings 139,687 154,452
Total equity 365,866 386,651
Total liabilities and equity 412,991 435,251

www.pason.com 16 Press release - August 9, 2017
Condensed Consolidated Interim Statements of Operations
Three Months Ended June 30, Six Months Ended June 30,
2017 2016 2017 2016
(CDN 000s, except per share data) (unaudited) ($) ($) ($) ($)
Revenue 55,792 27,173 114,841 72,986
Operating expenses Rental services 24,099 16,986 45,582 40,757
Local administration 2,535 1,946 5,248 4,275
Depreciation and amortization 10,823 13,578 22,796 29,940
37,457 32,510 73,626 74,972
Operating profit (loss) 18,335 (5,337 ) 41,215 (1,986 )
Other expenses Research and development 6,261 5,629 12,138 12,257
Corporate services 3,536 4,082 7,604 8,404
Stock-based compensation expense 3,177 2,238 5,724 3,200 Other (income) expense (1,689 ) 761 (250 ) 9,877
11,285 12,710 25,216 33,738
Income (loss) before income taxes 7,050 (18,047 ) 15,999 (35,724 )
Income tax provision (recovery) 155 (6,728 ) 1,951 (13,545 )
Net income (loss) 6,895 (11,319 ) 14,048 (22,179 )
Income (loss) per share Basic 0.08 (0.13 ) 0.17 (0.26 )
Diluted 0.08 (0.13 ) 0.17 (0.26 )
Condensed Consolidated Interim Statements of Other
Comprehensive Income
Three Months Ended June 30, Six Months Ended June 30,
2017 2016 2017 2016
(CDN 000s) (unaudited) ($) ($) ($) ($)
Net income (loss) 6,895 (11,319 ) 14,048 (22,179 )
Items that may be reclassified subsequently to net income:
Foreign currency translation adjustment (9,733 ) 262 (11,328 ) (24,865 )
Reclassification of foreign currency translation gain on disposition of 3PS assets
—
—
590
—
Other comprehensive (loss) gain (9,733 ) 262 (10,738 ) (24,865 )
Total comprehensive (loss) income (2,838 ) (11,057 ) 3,310 (47,044 )

www.pason.com 17 Press release - August 9, 2017
Condensed Consolidated Interim Statements of Changes in
Equity
Share Capital
Share-Based Benefits Reserve
Foreign Currency
Translation Reserve
Retained Earnings Total Equity
(CDN 000s) (unaudited) ($) ($) ($) ($) ($)
Balance at January 1, 2016 128,067 23,367 85,603 252,411 489,448 Net loss — — — (22,179 ) (22,179 )
Dividends — — — (28,621 ) (28,621 )
Other comprehensive loss — — (24,865 ) — (24,865 )
Exercise of stock options 4,546 (1,424 ) — — 3,122
Expense related to vesting of options — 1,417 — — 1,417
Balance at June 30, 2016 132,613 23,360 60,738 201,611 418,322
Net loss — — — (18,442 ) (18,442 )
Dividends — — — (28,717 ) (28,717 )
Other comprehensive income — — 8,705 — 8,705
Exercise of stock options 5,867 (1,913 ) — — 3,954 Expense related to vesting of options — 1,579 — — 1,579 Shares issued pursuant to business acquisition 1,250
—
—
—
1,250
Balance at December 31, 2016 139,730 23,026 69,443 154,452 386,651 Net income — — — 14,048 14,048 Dividends — — — (28,813 ) (28,813 )
Other comprehensive loss — — (10,738 ) — (10,738 )
Exercise of stock options 4,065 (985 ) — — 3,080
Expense related to vesting of options — 1,638 — — 1,638
Balance at June 30, 2017 143,795 23,679 58,705 139,687 365,866

www.pason.com 18 Press release - August 9, 2017
Condensed Consolidated Interim Statements of Cash Flows
Three Months Ended June 30, Six Months Ended June 30,
2017 2016 2017 2016
(CDN 000s) (unaudited) ($) ($) ($) ($)
Cash from (used in) operating activities Net income (loss) 6,895 (11,319 ) 14,048 (22,179 )
Adjustment for non-cash items: Depreciation and amortization 10,823 13,578 22,796 29,940
Stock-based compensation 3,177 2,238 5,724 3,200
Non-cash restructuring costs — — — 4,833
Deferred income taxes (1,052 ) (5,688 ) (1,941 ) (10,976 )
Unrealized foreign exchange (gain) loss and other (1,048 ) 217 (758 ) (2,457 )
Funds flow from (used in) operations 18,795 (974 ) 39,869 2,361
Movements in non-cash working capital items: Decrease in trade and other receivables 3,659
6,826
1,816
18,090
Decrease in prepaid expenses 700 868 258 1,004
Decrease (increase) in income taxes recoverable 2,774
(840 ) 9,566
(3,583 )
(Decrease) increase in trade payables, accruals and stock-based compensation liability (780 ) (5,641 ) 3,134
461
Effects of exchange rate changes (522 ) 3,212 985 2,306
Cash generated from operating activities 24,626 3,451 55,628 20,639
Income tax paid (425 ) (458 ) (1,596 ) (6,315 )
Net cash from operating activities 24,201 2,993 54,032 14,324
Cash flows from (used in) financing activities
Proceeds from issuance of common shares 2,374 2,512 3,080 3,122
Payment of dividends (14,419 ) (14,327 ) (28,813 ) (28,621 )
Net cash used in financing activities (12,045 ) (11,815 ) (25,733 ) (25,499 )
Cash flows (used in) from investing activities
Additions to property, plant and equipment (4,439 ) (3,912 ) (5,280 ) (8,795 )
Development costs (660 ) (1,017 ) (953 ) (2,714 )
Proceeds on disposal of investment and property, plant and equipment
11 447 14 556
Acquisition — — (4,750 ) —
Proceeds on sale of net operating assets — — 7,123 —
Changes in non-cash working capital 515 (972 ) 326 (1,691 )
Net cash from (used in) investing activities (4,573 ) (5,454 ) (3,520 ) (12,644 )
Effect of exchange rate on cash and cash equivalents (4,409 ) 165
(4,738 ) (10,045 )
Net increase (decrease) in cash and cash equivalents
3,174
(14,111 ) 20,041
(33,864 )
Cash and cash equivalents, beginning of period 163,346
176,093
146,479
195,846
Cash and cash equivalents, end of period 166,520 161,982 166,520 161,982

www.pason.com 19 Press release - August 9, 2017
Operating Segments
The Company operates in three geographic segments: Canada, the United States, and International (Latin
America, Offshore, the Eastern Hemisphere, and the Middle East). The amounts related to each segment
are as follows:
Three Months Ended June 30, 2017 Canada United States International Total
($) ($) ($) ($)
Revenue 10,479 39,195 6,118 55,792
Rental services and local administration 5,559 16,302 4,773 26,634
Depreciation and amortization 5,645 4,170 1,008 10,823
Segment operating (loss) profit (725 ) 18,723 337 18,335
Research and development 6,261 Corporate services 3,536
Stock-based compensation 3,177
Other income (1,689 )
Income taxes 155
Net Income 6,895
Capital expenditures 171 4,929 (1 ) 5,099
Goodwill 1,259 6,995 2,600 10,854
Intangible assets 28,146 655 — 28,801
Segment assets 119,681 240,334 52,976 412,991
Segment liabilities 22,209 10,182 14,734 47,125
Three Months Ended June 30, 2016
Revenue 5,000 16,391 5,782 27,173
Rental services and local administration 3,995 10,749 4,188 18,932
Depreciation and amortization 6,331 5,463 1,784 13,578
Segment operating (loss) profit (5,326 ) 179 (190 ) (5,337 )
Research and development 5,629 Corporate services 4,082
Stock-based compensation 2,238
Other expense 761
Income taxes (6,728 )
Net loss (11,319 )
Capital expenditures 966 3,884 79 4,929
Goodwill — 24,218 2,600 26,818
Intangible assets 26,666 171 414 27,251
Segment assets 130,076 271,808 55,010 456,894
Segment liabilities 24,800 8,363 5,409 38,572

www.pason.com 20 Press release - August 9, 2017
Six Months Ended June 30, 2017 Canada United States International Total
($) ($) ($) ($)
Revenue 34,466 69,161 11,214 114,841
Rental services and local administration 11,353 30,512 8,965 50,830
Depreciation and amortization 11,579 9,171 2,046 22,796
Segment operating profit 11,534 29,478 203 41,215
Research and development 12,138 Corporate services 7,604
Stock-based compensation 5,724
Other expenses (250 )
Income tax expense 1,951
Net income 14,048
Capital expenditures 118 6,215 (100 ) 6,233
Goodwill 1,259 6,995 2,600 10,854
Intangible assets 28,146 655 — 28,801
Segment assets 119,681 240,334 52,976 412,991
Segment liabilities 22,209 10,182 14,734 47,125
Six Months Ended June 30, 2016
Revenue 20,825 40,017 12,144 72,986
Rental services and local administration 9,319 25,994 9,719 45,032
Depreciation and amortization 13,913 12,236 3,791 29,940
Segment operating (loss) profit (2,407 ) 1,787 (1,366 ) (1,986 )
Research and development 12,257 Corporate services 8,404
Stock-based compensation 3,200
Other expense 9,877
Income tax recovery (13,545 )
Net loss (22,179 )
Capital expenditures 2,683 8,658 168 11,509
Goodwill — 24,218 2,600 26,818
Intangible assets 26,666 171 414 27,251
Segment assets 130,076 271,808 55,010 456,894
Segment liabilities 24,800 8,363 5,409 38,572

www.pason.com 21 Press release - August 9, 2017
Other (Income) Expenses
Three Months Ended June 30, Six Months Ended June 30,
2017 2016 2017 2016
($) ($) ($) ($)
Foreign exchange loss (gain) (689 ) 396 (466 ) (2,323 )
Restructuring costs — — — 10,861
Other (1,000 ) 365 216 1,339
Other (income) expenses (1,689 ) 761 (250 ) 9,877
In the first quarter of 2016, the Company initiated additional cost reduction initiatives to address the
prolonged downturn in oil and gas drilling activity. As a result, the Company recorded a restructuring charge
of $10.9 million in the first quarter of 2016.

www.pason.com 22 Press release - August 9, 2017
Pason Systems Inc.
Pason Systems Inc. is a leading global provider of specialized data management systems for drilling rigs.
Our solutions, which include data acquisition, wellsite reporting, remote communications, web-based
information management, and analytics, enable collaboration between the rig and the office. Pason's
common shares trade on the Toronto Stock Exchange under the symbol PSI.TO.
For more information about Pason Systems Inc., visit the company's website at www.pason.com or
contact:
Marcel Kessler Jon Faber
President and CEO Chief Financial Officer
403-301-3400 403-301-3400

www.pason.com 23 Press release - August 9, 2017
Certain information regarding the Company contained herein may constitute forward-looking information
under applicable securities law. The words “anticipate”, “expect”, “believe”, “may”, “should”, “will”,
“estimate”, “project”, “outlook”, “forecast” or other similar words are used to identify such forward-looking
information and statements. Forward-looking statements in this document may include statements,
express or implied regarding the anticipated business prospects and financial performance of Pason;
expectations or projections about future strategies and goals for growth and expansion; expected and
future cash flows and revenues; and expected impact of future commitments. These forward-looking
statements are based upon various underlying factors and assumptions, including the state of the
economy and the oil and gas exploration and production business, in particular; the Company's business
prospects and opportunities; and estimates of the financial and operational performance of Pason.
Forward-looking information and statements are subject to known or unknown risks and uncertainties that
may cause actual results to differ materially from those anticipated or implied in the forward-looking
information and statements. Risk factors that could cause actual results or events to differ materially from
current expectations include, among others, the ability of Pason to successfully implement its strategic
initiatives and whether such strategic initiatives will yield the expected benefits, the operating
performance of Pason's assets and businesses, the price of energy commodities, competitive factors in
the energy industry, changes in laws and regulations affecting Pason's businesses, technological
developments, and general economic conditions.
Readers are cautioned not to place undue reliance on forward-looking statements as there can be no
assurance that the plans, intentions or expectations upon which they are placed will occur. Such forward
looking statements, although considered reasonable by management as of the date hereof, may prove to
be incorrect and actual results may differ materially from those anticipated. Forward-looking statements
contained in this press release are expressly qualified by this cautionary statement.
Additional information on risks and uncertainties and other factors that could affect Pason's operations or
financial results are included in Pason's reports on file with the Canadian securities regulatory authorities
and may be accessed through the SEDAR website (www.sedar.com) or through Pason's website
(www.pason.com). Furthermore, any forward looking statements contained in this news release are made
as of the date of this news release, and Pason does not undertake any obligation to update publicly or to
revise any of the included forward-looking statements, whether as a result of new information, future
events or otherwise, except as expressly required by securities law.