Embed Size (px)
Citation preview
Pressure and temperature dependence of
recombination reactions of benzyl-type
radicals
Dissertation
zur Erlangung des Doktorgrades
der Mathematisch-Naturwissenschaftlichen Fakultäten
der Georg-August-Universität zu Göttingen
vorgelegt von
Changyoul Lee
aus Cheonan, Südkorea
Göttingen 2008

ii
D7
Referent : Prof. Dr. J. Troe
Korreferent : PD Dr. T. Lenzer
Tag der mündlichen Prüfung : 27. Oktober 2008
iii
Table of contents Summary .............................................................................................................................. iv
Acknowledgement ................................................................................................................ vi
Introduction ........................................................................................................................... 1
1.1 Energy-Transfer (ET) mechanism ........................................................................... 5
1.2 Radical-Complex (RC) mechanism ......................................................................... 7
1.3 Combination of ET and RC mechanisms............................................................... 12
1.4 Diffusion-controlled kinetics ................................................................................ 14
1.5 Reaction systems studied in this thesis .................................................................. 14
Experimental set-up ............................................................................................................. 18
2.1. Laser system ......................................................................................................... 18
2.2. The optical flow cells ........................................................................................... 19
2.3. Flow system ......................................................................................................... 24
2.4. The optical detection system ................................................................................. 26
2.5. Gas mixing and gas flow systems ......................................................................... 32
2.6. Evaluation and data processing ............................................................................. 35
Results ................................................................................................................................. 37
3.1 Recombination reaction of p-fluorobenzyl radicals ............................................... 37
3.2 Recombination reaction of p-methylbenzyl radicals ............................................... 51
3.3 Recombination reaction of benzyl radicals ............................................................ 71
Discussion and outlook ........................................................................................................ 84
4.1 Transient absorption spectra of benzyl-type radicals ............................................. 84
4.2 Limiting high-pressure rate constants of the ET mechanism .................................. 86
4.3 RC mechanism ..................................................................................................... 88
4.4 Effect of steric hindrance on the recombination rates ............................................ 88
4.5 Common features of the role of the RC mechanism in combination reactions of
“small” polyatomic and “large” organic radicals ............................................................... 90
4.6 The nature of the radical-solvent molecule interaction .......................................... 90
References ........................................................................................................................... 92
Curriculum Vitae .................................................................................................................. 95
iv
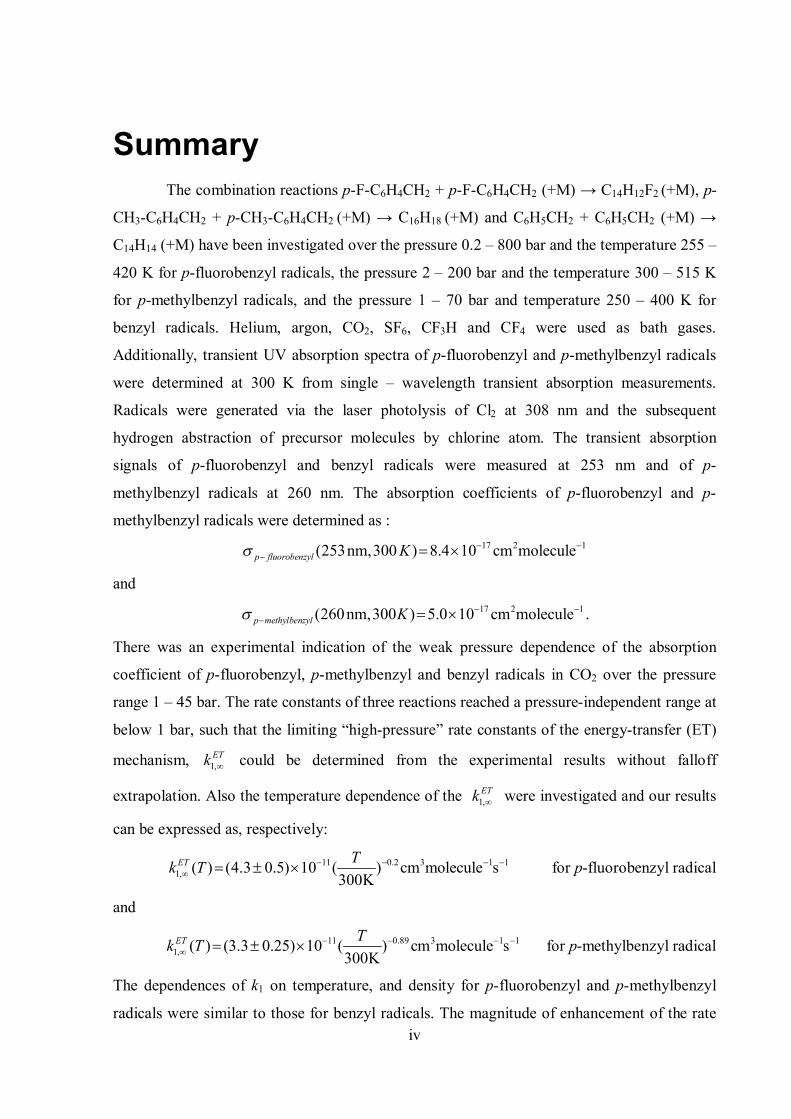
Summary The combination reactions p-F-C6H4CH2 + p-F-C6H4CH2 (+M) → C14H12F2 (+M), p-
CH3-C6H4CH2 + p-CH3-C6H4CH2 (+M) → C16H18 (+M) and C6H5CH2 + C6H5CH2 (+M) →
C14H14 (+M) have been investigated over the pressure 0.2 – 800 bar and the temperature 255 –
420 K for p-fluorobenzyl radicals, the pressure 2 – 200 bar and the temperature 300 – 515 K
for p-methylbenzyl radicals, and the pressure 1 – 70 bar and temperature 250 – 400 K for
benzyl radicals. Helium, argon, CO2, SF6, CF3H and CF4 were used as bath gases.
Additionally, transient UV absorption spectra of p-fluorobenzyl and p-methylbenzyl radicals
were determined at 300 K from single – wavelength transient absorption measurements.
Radicals were generated via the laser photolysis of Cl2 at 308 nm and the subsequent
hydrogen abstraction of precursor molecules by chlorine atom. The transient absorption
signals of p-fluorobenzyl and benzyl radicals were measured at 253 nm and of p-
methylbenzyl radicals at 260 nm. The absorption coefficients of p-fluorobenzyl and p-
methylbenzyl radicals were determined as : 17 2 1(253nm,300 ) 8.4 10 cm moleculep fluorobenzyl K
and 17 2 1(260nm,300 ) 5.0 10 cm moleculep methylbenzyl K
.
There was an experimental indication of the weak pressure dependence of the absorption
coefficient of p-fluorobenzyl, p-methylbenzyl and benzyl radicals in CO2 over the pressure
range 1 – 45 bar. The rate constants of three reactions reached a pressure-independent range at
below 1 bar, such that the limiting “high-pressure” rate constants of the energy-transfer (ET)
mechanism, 1,ETk could be determined from the experimental results without falloff
extrapolation. Also the temperature dependence of the 1,ETk were investigated and our results
can be expressed as, respectively:
11 0.2 3 1 11, ( ) (4.3 0.5) 10 ( ) cm molecule s
300KET Tk T for p-fluorobenzyl radical
and
11 0.89 3 1 11, ( ) (3.3 0.25) 10 ( ) cm molecule s
300KET Tk T for p-methylbenzyl radical
The dependences of k1 on temperature, and density for p-fluorobenzyl and p-methylbenzyl
radicals were similar to those for benzyl radicals. The magnitude of enhancement of the rate

v
constants increased in the order He < Ar < CO2 in all three radicals. The decrease of the rate
constant after passing over the maximum were observed in all three radical recombination
reactions studied in this work, which can be attributed to a transition to diffusion-controlled
kinetics.
vi
Acknowledgement The present thesis has profited from the assistance of many colleagues and friends,
who contributed to the success of my scientific journey. It gives me great pleasure to
acknowledge the help and cooperation that I received from all of them during my Ph.D work.
Firstly, for this dissertation I would like to deeply thank Prof. Dr. J. Troe for giving me an
opportunity to start a research career in this group..
I acknowledge my sincere thanks to PD. Dr. Kawon Oum for wise supervision of my research,
encouraging as well as inviting me to Göttingen. Without her support and encouragement
during the whole period of the research, this dissertation would not have been possible. Also I
really thank to PD. Dr. T. Lenzer for thoughtful consideration and scientific aid.
I extend my warm thanks to Prof. Dr. K. Luther, Prof. Dr. J. Schroeder, Prof. Dr. D. Schwarzer,
and Prof. V. G. Ushakov for their continued interest in my work and for the fruitful
discussions and innumerable valuable suggestions.
My hearty thanks to Mr. R. Bürsing for the speedy assistance in technical problems. I also
want to thank to all the co-workers of the technical workshop under the management of Mr.
Meyer, of the electronic workshop under the direction of Mr. Knorr and of the glass workshop
under the management of Mr. H. J. Schlette.
I also want to thank my colleagues from the research group of Dr. Kawon Oum and Dr. T.
Lenzer.: Heiko Frerichs, Sebastian Starlke, Jane Seehusen, Matthäus Kopczynski, Florian
Ehlers, Christine Hahn, Dr. D. A. Wild and Dr. Jörg Hahn. I particularly would like to thank to
Dr. K. Sekiguchi and Dr. R. X. Fernandes whom I constantly exchanged with ideas, opinions
and questions.
I am grateful to Prof. Joong-Gill Choi in Yonsei university in Korea with whom I started my
first scientific research as a Master student of Yonsei University and who continued to
encourage me to do my best.

vii
I also take this opportunity to thank the people of the Korean Church in Göttingen who made
my stay here very pleasant and fruitful.
My little son, Minjae!! Your smile is the best recreation for Daddy!
Finally my biggest thanks go to Hanna, my dear wife and steady companion. Her warm love,
confidence and prayer made me feel at home anywhere. Thanks for exploring the highs and
lows of life with me.
1
Chapter 1
Introduction
The pressure- and temperature-dependence of the radical recombination and the
corresponding unimolecular dissociation rate constants have been one of the interesting
subjects in experimental and theoretical kinetic aspects, because they reflect the important
influence of the surrounding medium on the dynamics of these processes. Especially, addition
and recombination processes involving organic free radicals play an important role in
fundamental kinetic studies as well as in the applied sciences such as combustion or
atmospheric chemistry as key intermediates.
In radical combination kinetics, collisional energy transfer in low-pressure gases and
molecular diffusion at the high densities of liquid solutions are the well understood extremes
of the rate-limiting intermolecular interactions. However, in the intermediate regime between
high-density gases and liquids, the superposition of various reactant-solvent interactions is not
yet well understood. As the rates of the combination reactions depend on several factors, such
as the concentration of the reactants, temperature and also the concentration of the bath gases
and their chemical nature, it is difficult to understand fully the radical combination kinetics in
the gas-to-liquid transition range. In this range, interactions between solutes and bath gases,
forming van der Waals complexes, may influence chemical reaction dynamics.
For formation of stable products combination reactions always require some energy
removal process in addition to the actual reactant encounter dynamics. The well-established
"Energy Transfer" (ET) mechanism includes association, dissociation, and collisional energy
transfer steps. These mechanisms characterize the pressure dependence of the rate coefficient
2
k between the low-pressure and high-pressure limiting ranges. Linear pressure dependence of
the rate constant at low pressures is followed by a transition regime leading into the “high
pressure” range with a constant, limiting value, k∞, independent of the density and nature of
the bath gas. In general, this leads to the typical ("fall-off") pressure dependence of such
reactions.
In the gas-to-liquid range, ordinary van der Waals reactant-bath gas complexes may play
important roles in combination reaction dynamics much more often than commonly believed
The alternative “Radical-Complex (RC)” mechanism (also “chaperon” mechanism) involves
van der Waals reactant-bath gas complexes and has early been proposed to explain
peculiarities in atom recombinations. But since then it has generally been assumed to be of
marginal importance apart from atom recombination or possibly some cases of triatomic
products. The RC mechanism is still a hypothesis. However, recently, there have been several
experimental results which can be consistently interpreted within the radical-complex
mechanism. These can be found in extensive experimental studies on pressure- and
temperature-dependent rate constants of atom and radical recombination reactions from the
Troe group: For example, indications of the involvement of the radical complex mechanism
can be found in atoms or small radicals in refs. 1-6. More recently, an unexpected
enhancement of combination rates of intermediate sized-polyatomic radicals, such as CCl37 or
CH3,8 was observed. The most prominent indication for the RC mechanism has been found in
density-dependent recombination rate constants of benzyl-type radicals.9-11 A clear
enhancement of recombination rate constants was observed at higher pressures, larger than
those where the "high-pressure limit" of the ET mechanism was already established. New
evidence for a more general importance of the RC mechanism may also provide a
considerable challenge for theoretical analysis, which has so far been focused
overwhelmingly only on the ET mechanism.
3
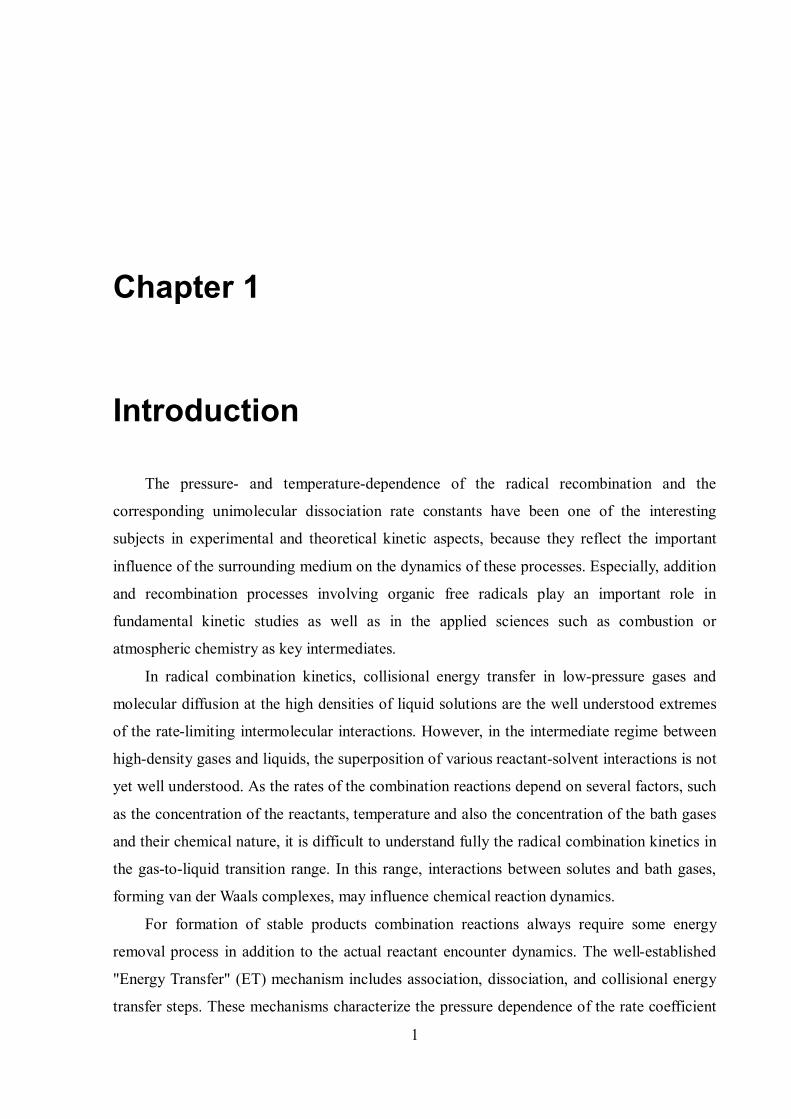
Figure 1.1 Combination rate constants krec in the bath gas Ar at 300 K showing the transition to the onset of diffusion control. Dashed line: limiting diffusion-controlled rate constants. Dotted line: kET from the energy transfer mechanism. Solid line: rate constants without contribution from the radical-complex mechanism, error estimation of the calculation illustrated by the shaded area. The figure was taken from ref. 12.
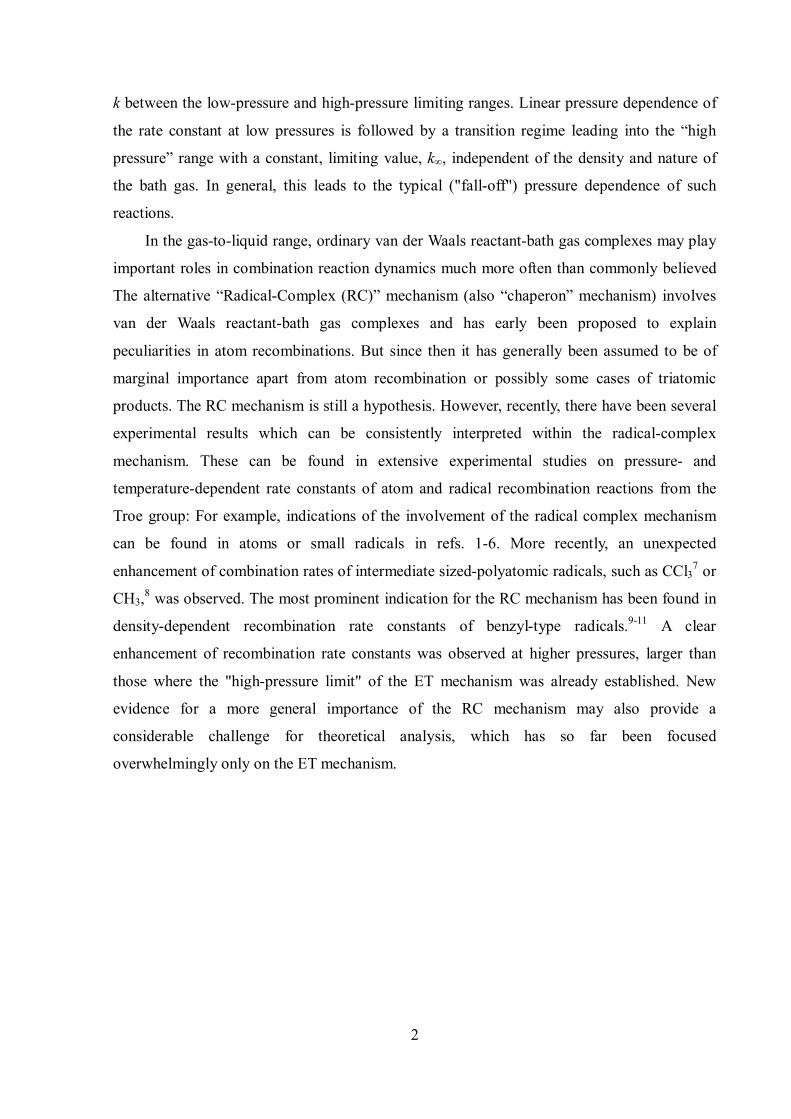
Figure 1.2 Combination rate constants of CCl3 + Br (+ M) CCl3Br (+ M) at 300 K: measurements in the bath gases He and N2. The figure was taken from ref. 12.
4
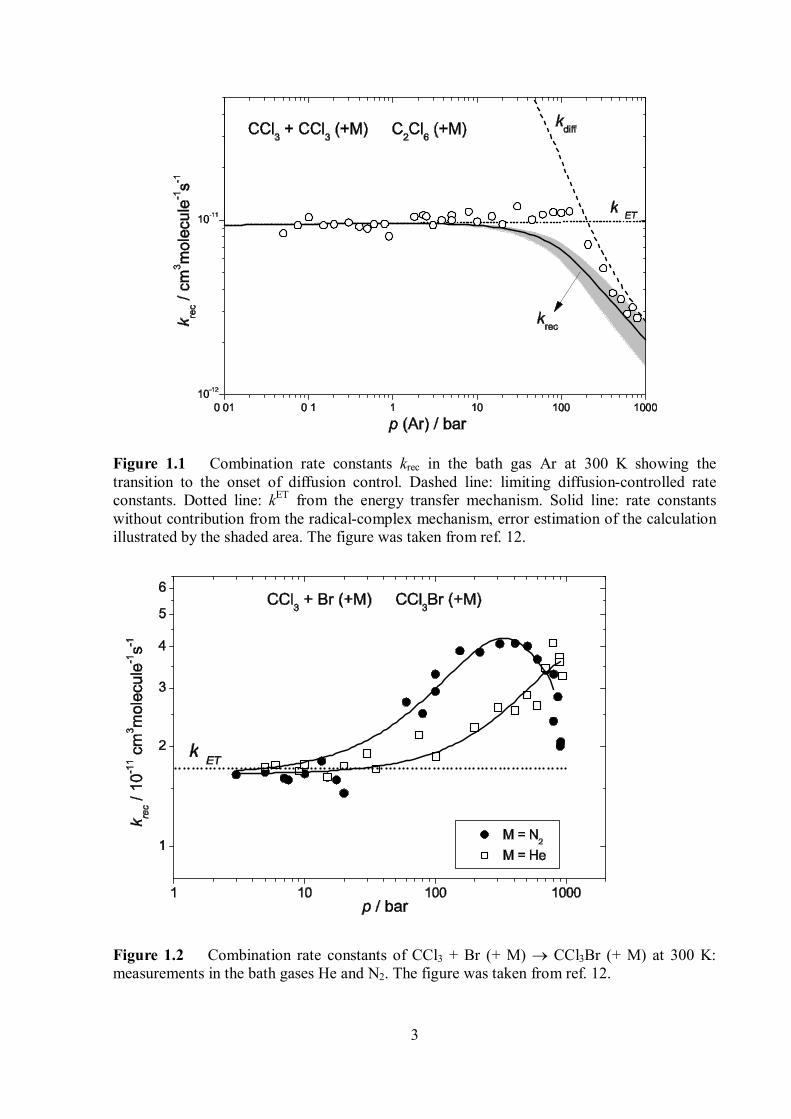
Figure 1.3 Combination rate constants of CH3 + O2 (+ M) CH3O2 (+ M) at various temperatures.8 The deviation of krec values at 300 K in the high density region from the expected values based on the energy transfer mechanism (lines) was observed. Note that this deviation is disappearing at higher temperatures.
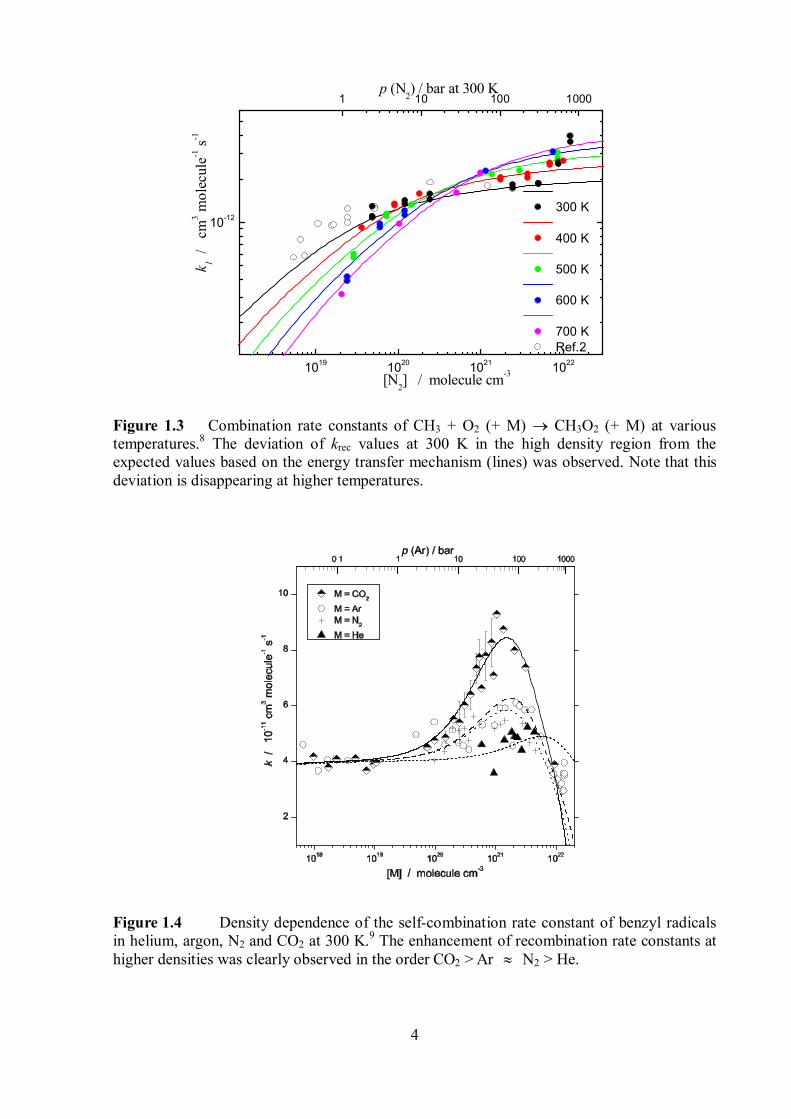
Figure 1.4 Density dependence of the self-combination rate constant of benzyl radicals in helium, argon, N2 and CO2 at 300 K.9 The enhancement of recombination rate constants at higher densities was clearly observed in the order CO2 > Ar N2 > He.
1019 1020 1021 1022
10-12 300 K
400 K
500 K
600 K
700 K Ref.2
k 1 /
cm3 m
olec
ule-1
s-1
[N2] / molecule cm-3
1 10 100 1000p (N2) / bar at 300 K
5
1.1 Energy-Transfer (ET) mechanism
The theoretical analysis of bimolecular reactions is often difficult because several
reactions, such as complex formation, complex dissociation and rearrangement, compete. In
general, bimolecular recombination reactions can be written as:
A + B AB* AB (R.1)
The reactant can be activated due to collisions to form AB* which then might be deactivated
due to collisions or form products. The difference between Energy-Transfer (ET) and Radical-
Complex (RC) mechanisms is how the activated adduct AB* can be stabilized to produce AB.
In the energy-transfer mechanism, stabilization of activated complex takes place by
intermolecular energy transfer via collisions with the bath gas molecules. On the other hand,
in the Radical-Complex mechanism, the product AB is formed via intramolecular energy
transfer of the radical-bath gas molecule complexes.
Falloff curves of unimolecular dissociation and the reverse radical recombination
reactions characterize the pressure dependence of the rate coefficients k between the low–
pressure and high–pressure limiting ranges. Theories of unimolecular reactions are commonly
discussed on the basis of mechanism involving collisional energy transfer, which was
originally proposed by Lindemann and Christiansen.13,14
The energy-transfer mechanism can be formulated symbolically in terms of the steps
A + B 1k AB* (R 2)
AB* 1k A + B (R 3)
AB* + M 2k AB + M (R 4)
where A and B denote atom or radical and M is the third body partner. Under the assumption
of the steady-state concentration of AB*, the reaction rate for the product formation can be
written as:
21
1 2
[ ]1 [ ] ( )[ ][ ] [ ]rec
k Md AB k kA B dt k k M
(1.1)
6
Eqn 1.1 can be simplified and written as:
,0, ,
, ,0
[ ][ ]
ETET rec ET
ET ET
k Mk k
k k M
(1.2)
with the limiting low-pressure rate coefficient when [M] 0,
kET,0 = (k1/k-1) k2 [M] (1.3)
which is characterized by an equilibrium between A, B, and AB*, and the limiting high–
pressure rate coefficient when [M] ,
kET,∞= k1 (1.4)
which is characterized by the rate-determining association of A and B forming AB*; here,
AB* is efficiently depleted by fast collisional stabilization. Eqn. 1.3 shows that at very low
pressures the first order rate constant increases linearly with the bath gas concentration and at
very high pressures it becomes pressure independent.
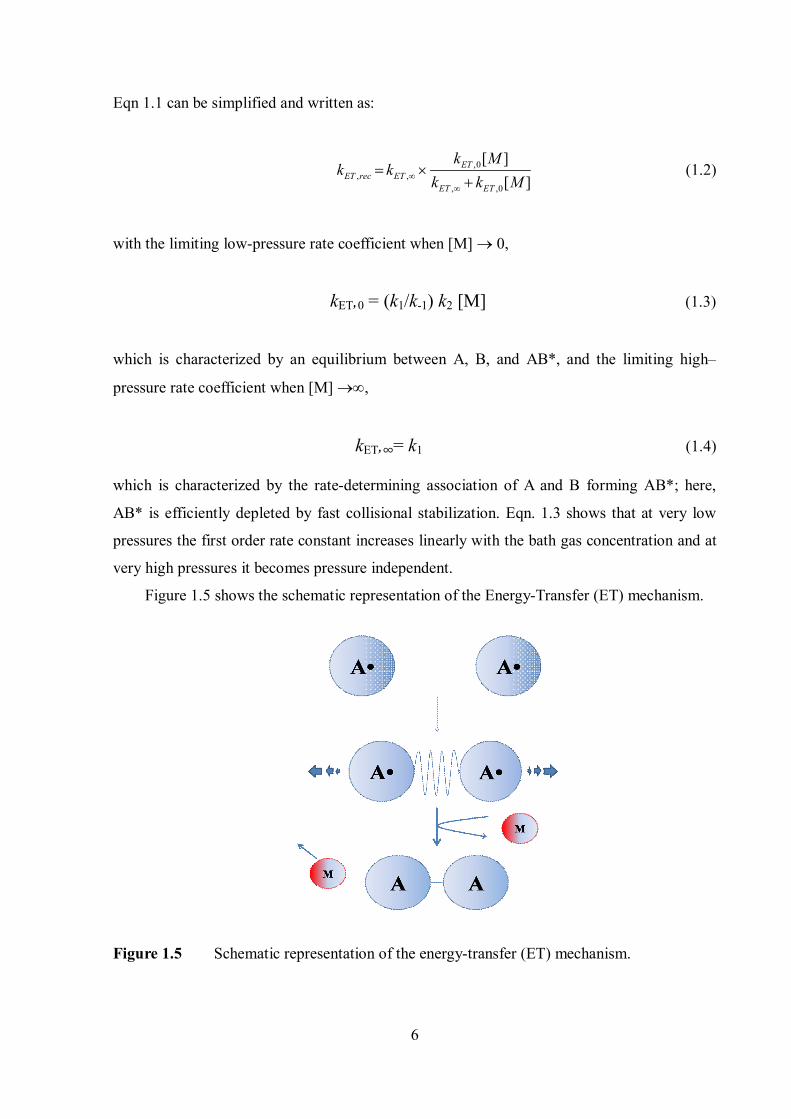
Figure 1.5 shows the schematic representation of the Energy-Transfer (ET) mechanism.
Figure 1.5 Schematic representation of the energy-transfer (ET) mechanism.
7
The “reduced form” of the recombination rate constant is derived by dividing eqn. 1.2 by the
limiting high-pressure rate coefficient:
,0 ,
, ,0 ,
[ ] /1 [ ] /
ETET ETrec
ET ET ET
k M kkk k M k
(1.5)
Eqn. 1.5 is the reduced fall-off expression of the Lindemann model and has a particularly
simple form. Unfortunately, the experimental fall-off curves were not well represented by eqn.
1.5. By introducing “broadening factors” F(kET,0/kET,∞),15 the deviation can be compensated.
The broadening of the reduced fall-off expressions are represented as
,0 ,,0 ,
, ,0 ,
[ ] /( / )
1 [ ] /
ETET ETrec
ET ETET ET ET
k M kk F k kk k M k
(1.6)
The details of broadening factors depend on the correct choice of kET,0 and kET,∞. The "center
broadening factors"
Fcent = F(kET,0/kET,∞ = 1) (1.7)
in particular depend on the selected k0 and k∞. There are several reasons for the appearance of
the F broadening factors in eqn. 1.5. First, the excited species AB* in the Energy-Transfer
mechanism are formed over a wide range of energies E and angular momentum (quantum
number J). The second reason is the multistep character of the reactions (R.2), (R.3) and (R.4).
1.2 Radical-Complex (RC) mechanism
Experimental measurements of atom and radical combination rates have indicated that
the behavior is consistent with the predictions based on the Energy-Transfer mechanism, but
that sometimes the observed rates are much higher. For example, Porter16 found that the
combination rate constant of iodine atoms with argon as chaperon at 27°C is 3.0109 dm6
mol-2 s-1, and it was proven that this value has the right order of magnitude to be explained by
the ET mechanism.17 On the other hand, with benzene as chaperon, the rate constant is about
30 times higher than the calculated value by Laidler.17 Also, some atmospheric association
8
reactions have been postulated to follow a different mechanism. To explain such discrepancies,
a different mechanism, the Radical-Complex (RC) mechanism, originally postulated as the
“chaperon mechanism” of atom recombination,16,18 was suggested. The radical-complex
mechanism can be formulated symbolically in terms of the steps :
A + M → AM ka, KA (R.5)
AM → A + M k-a, (R.6)
B + M → BM kb, KB (R.7)
BM → B + M k-b (R.8)
AM + B → AB + M kAM+B (R.9)
BM + A → AB + M kBM+A (R.10)
AM + BM → AB + 2M kAM+BM (R.11)
The competing intermolecular-complex mechanism may play an important role and the atom
or radical may form a complex with the third-body particles in the RC mechanism. The
stabilization of the energized adduct (AB*) takes place not via energy transfer to the bath gas
but via the dissociation of the formed van der Waals complexes. These reaction steps lead to a
rate coefficient in the form:
2
, 2
( )[ ] [ ]1 ( )[ ] [ ]
A AM A B BM A A B AM BMRC rec
A B A B
K k K k M K K k MkK K M K K M
(1.8)
Similar to the ET mechanism, it is shown that at very low pressures the first–order rate
constant increases linearly with the bath gas concentration and at very high pressures it
becomes pressure–independent.
kRC,0 = (KA kAM+B + KB kBM+A) [M] = k0[M] (1.9)
kRC,∞ = kAM+BM = k∞ (1.10)
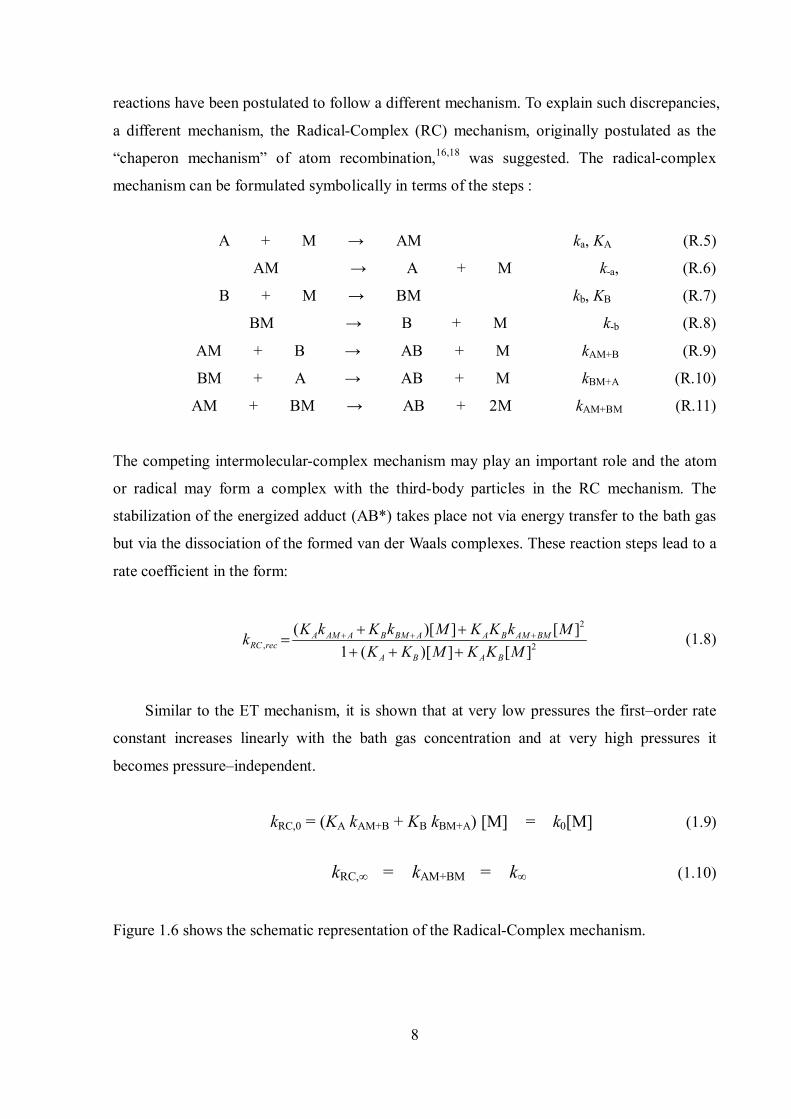
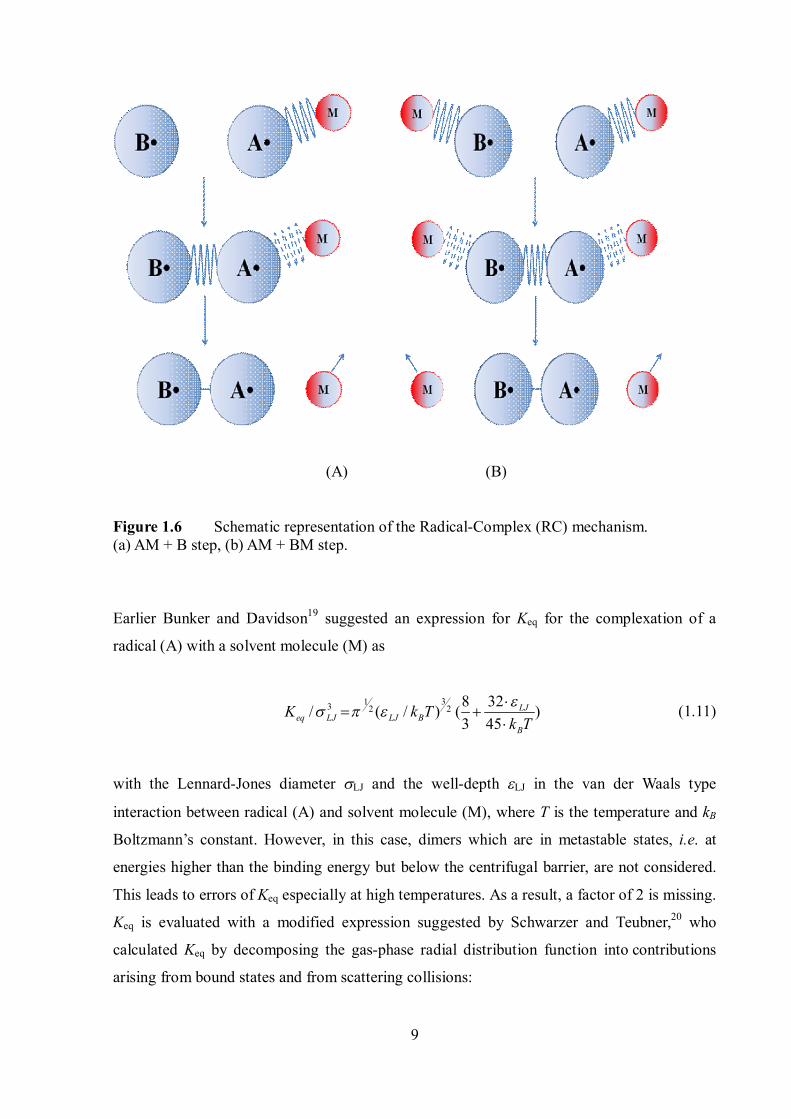
Figure 1.6 shows the schematic representation of the Radical-Complex mechanism.
9
(A) (B)
Figure 1.6 Schematic representation of the Radical-Complex (RC) mechanism. (a) AM + B step, (b) AM + BM step.
Earlier Bunker and Davidson19 suggested an expression for Keq for the complexation of a
radical (A) with a solvent molecule (M) as
313 2 2 328/ ( / ) ( )
3 45LJ
eq LJ LJ BB
K k Tk T
(1.11)
with the Lennard-Jones diameter LJ and the well-depth LJ in the van der Waals type
interaction between radical (A) and solvent molecule (M), where T is the temperature and kB
Boltzmann’s constant. However, in this case, dimers which are in metastable states, i.e. at
energies higher than the binding energy but below the centrifugal barrier, are not considered.
This leads to errors of Keq especially at high temperatures. As a result, a factor of 2 is missing.
Keq is evaluated with a modified expression suggested by Schwarzer and Teubner,20 who
calculated Keq by decomposing the gas-phase radial distribution function into contributions
arising from bound states and from scattering collisions:
10
2
2
4 [ ( ) ( )]
1 [ ]4 [ ( ) ( )]scattering
eqscattering
r g r g r drK
M r g r g r dr
(1.12)
where g(r) is the radial distribution function, gscattering(r) the part of g(r) from the scattering
collision, and [M] the concentration of the third body. The condition, [AM] [A], should
be fulfilled to use this equation.
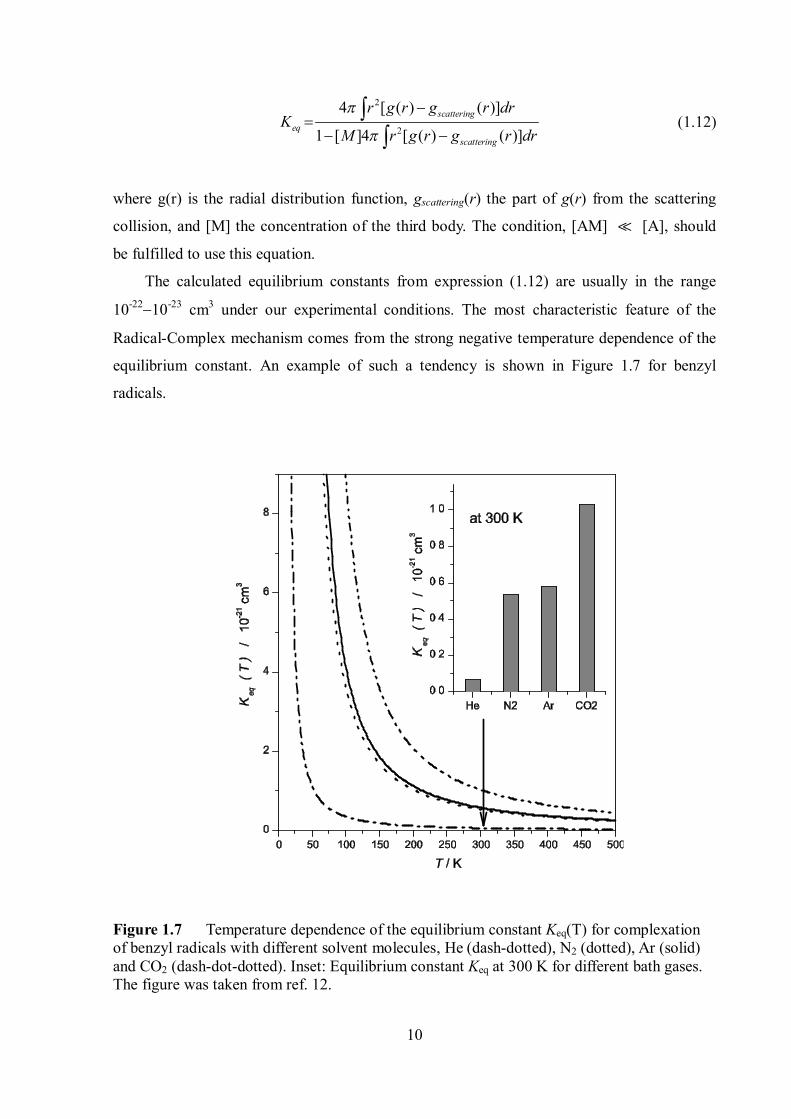
The calculated equilibrium constants from expression (1.12) are usually in the range
10-2210-23 cm3 under our experimental conditions. The most characteristic feature of the
Radical-Complex mechanism comes from the strong negative temperature dependence of the
equilibrium constant. An example of such a tendency is shown in Figure 1.7 for benzyl
radicals.
Figure 1.7 Temperature dependence of the equilibrium constant Keq(T) for complexation of benzyl radicals with different solvent molecules, He (dash-dotted), N2 (dotted), Ar (solid) and CO2 (dash-dot-dotted). Inset: Equilibrium constant Keq at 300 K for different bath gases. The figure was taken from ref. 12.
11
From the equilibrium constant, the degree of complexation (),
[AM] 11[A] [AM] , , [M] 1eq AM AMK T
(1.13)
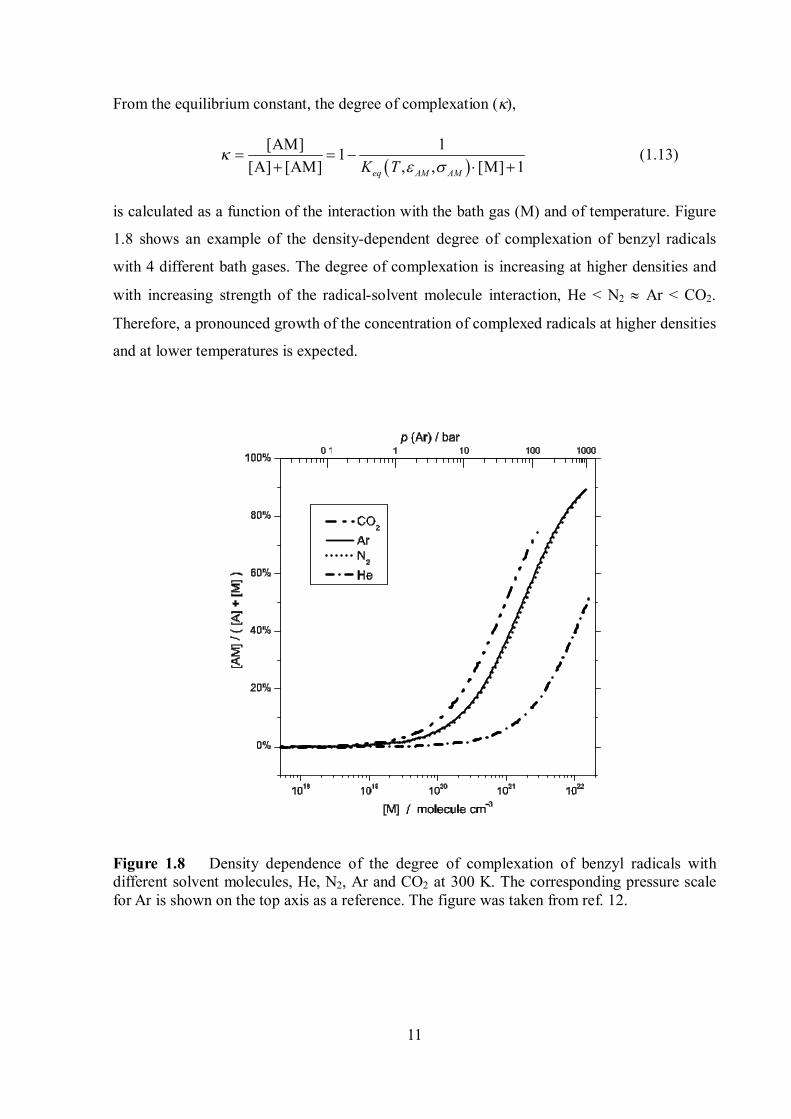
is calculated as a function of the interaction with the bath gas (M) and of temperature. Figure
1.8 shows an example of the density-dependent degree of complexation of benzyl radicals
with 4 different bath gases. The degree of complexation is increasing at higher densities and
with increasing strength of the radical-solvent molecule interaction, He < N2 Ar < CO2.
Therefore, a pronounced growth of the concentration of complexed radicals at higher densities
and at lower temperatures is expected.
Figure 1.8 Density dependence of the degree of complexation of benzyl radicals with different solvent molecules, He, N2, Ar and CO2 at 300 K. The corresponding pressure scale for Ar is shown on the top axis as a reference. The figure was taken from ref. 12.
12
1.3 Combination of ET and RC mechanisms
The total radical combination rate constant can be expressed by the combined form of
the Energy-Transfer and Radical-Complex mechanisms. As the recombination rate constant is
strongly affected by the individual mechanisms, the rate constant depends on the rate
constants of the elementary reactions and the equilibrium constant.
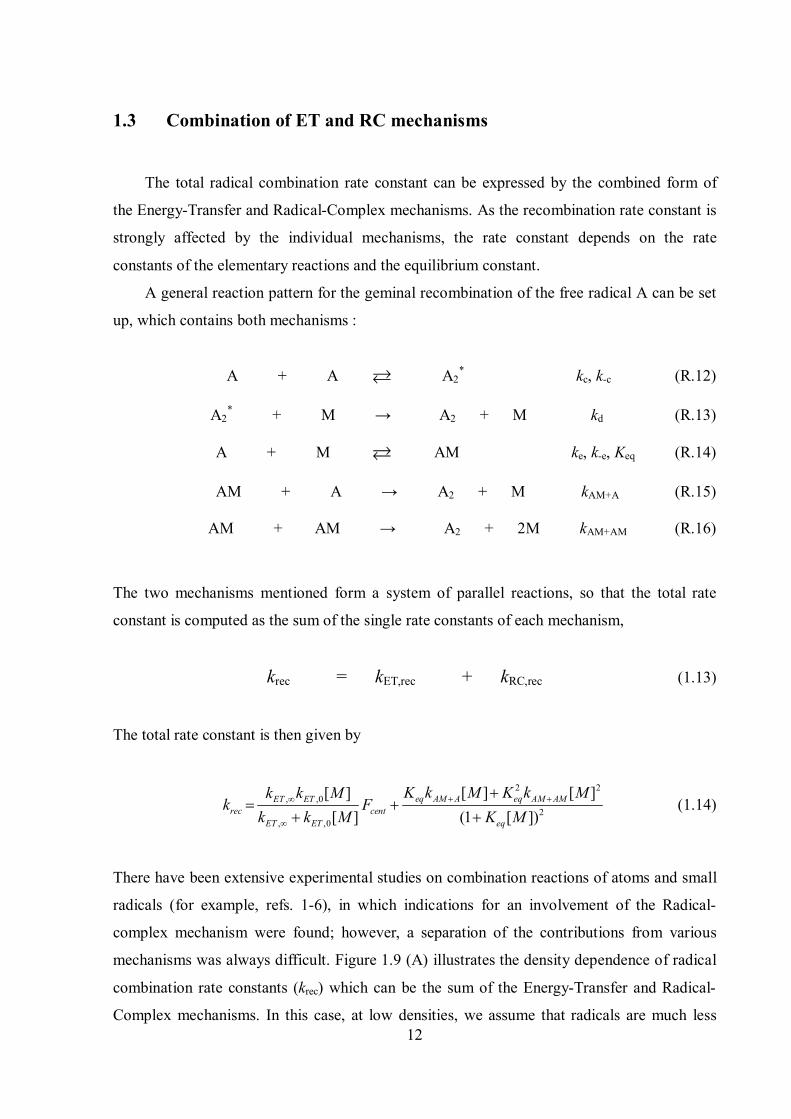
A general reaction pattern for the geminal recombination of the free radical A can be set
up, which contains both mechanisms :
A + A A2* kc, k-c (R.12)
A2* + M → A2 + M kd (R.13)
A + M AM ke, k-e, Keq (R.14)
AM + A → A2 + M kAM+A (R.15)
AM + AM → A2 + 2M kAM+AM (R.16)
The two mechanisms mentioned form a system of parallel reactions, so that the total rate
constant is computed as the sum of the single rate constants of each mechanism,
krec = kET,rec + kRC,rec (1.13)
The total rate constant is then given by
2 2
, ,02
, ,0
[ ] [ ][ ][ ] (1 [ ])
eq AM A eq AM AMET ETrec cent
ET ET eq
K k M K k Mk k Mk F
k k M K M
(1.14)
There have been extensive experimental studies on combination reactions of atoms and small
radicals (for example, refs. 1-6), in which indications for an involvement of the Radical-
complex mechanism were found; however, a separation of the contributions from various
mechanisms was always difficult. Figure 1.9 (A) illustrates the density dependence of radical
combination rate constants (krec) which can be the sum of the Energy-Transfer and Radical-
Complex mechanisms. In this case, at low densities, we assume that radicals are much less
13
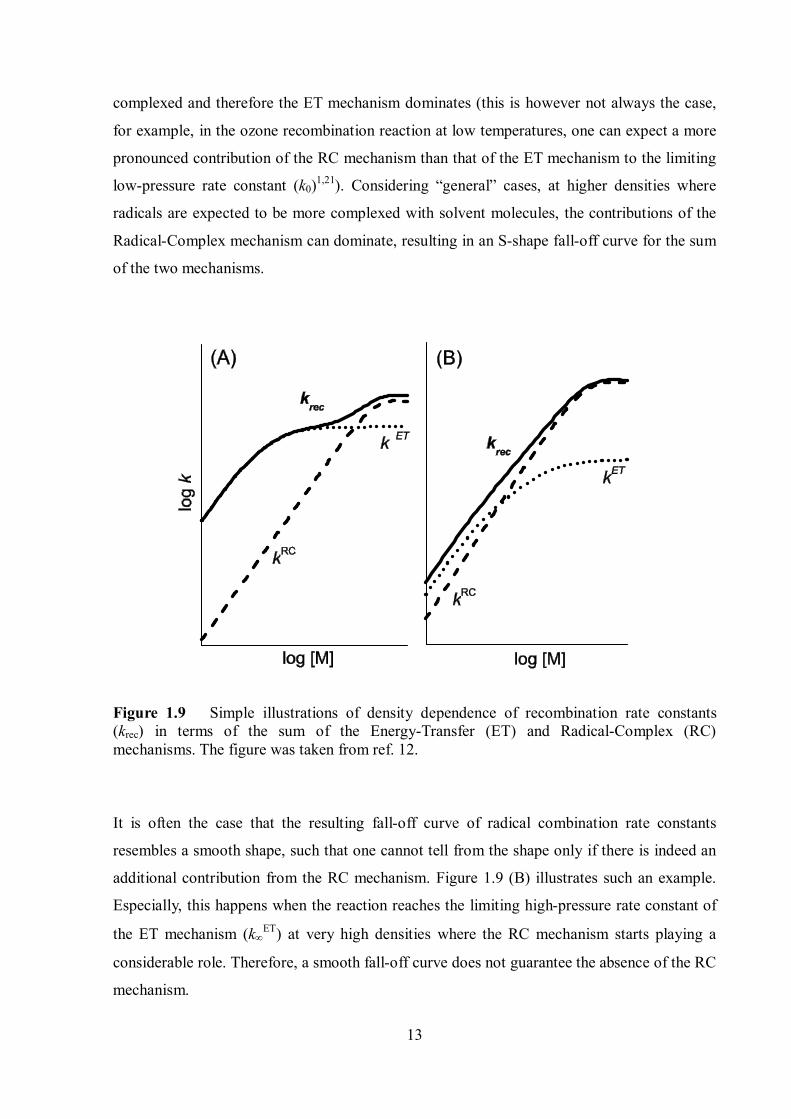
complexed and therefore the ET mechanism dominates (this is however not always the case,
for example, in the ozone recombination reaction at low temperatures, one can expect a more
pronounced contribution of the RC mechanism than that of the ET mechanism to the limiting
low-pressure rate constant (k0)1,21). Considering “general” cases, at higher densities where
radicals are expected to be more complexed with solvent molecules, the contributions of the
Radical-Complex mechanism can dominate, resulting in an S-shape fall-off curve for the sum
of the two mechanisms.
Figure 1.9 Simple illustrations of density dependence of recombination rate constants (krec) in terms of the sum of the Energy-Transfer (ET) and Radical-Complex (RC) mechanisms. The figure was taken from ref. 12.
It is often the case that the resulting fall-off curve of radical combination rate constants
resembles a smooth shape, such that one cannot tell from the shape only if there is indeed an
additional contribution from the RC mechanism. Figure 1.9 (B) illustrates such an example.
Especially, this happens when the reaction reaches the limiting high-pressure rate constant of
the ET mechanism (kET) at very high densities where the RC mechanism starts playing a
considerable role. Therefore, a smooth fall-off curve does not guarantee the absence of the RC
mechanism.
14
1.4 Diffusion-controlled kinetics
Even at relatively low pressures, recombination reaction rate constants for large
molecules are already essentially determined by the limiting high-pressure rate constant of the
ET mechanism, which is independent of the bath gas density. But with increasing pressure, it
must be considered that the diffusion-controlled kinetics of the radicals in the bath gas can
play an additional role. The larger viscosity of the gas mixture increases the time interval
between two impacts, so that diffusion becomes the rate-determining factor.
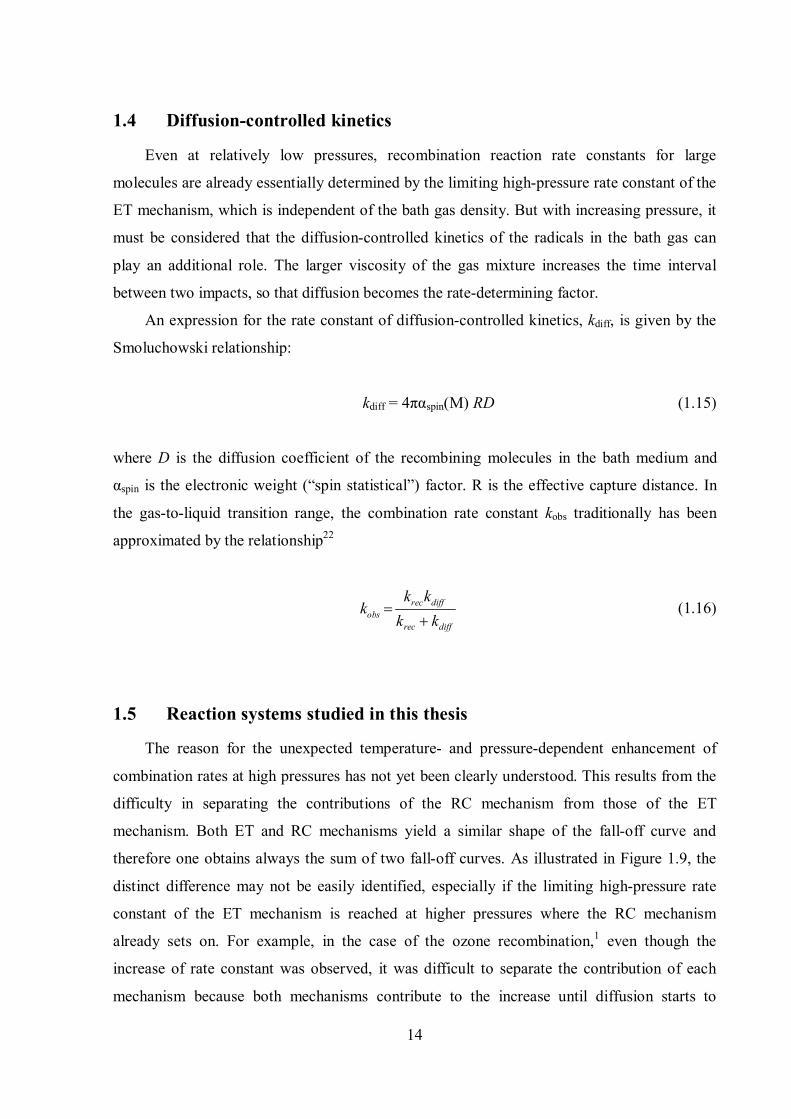
An expression for the rate constant of diffusion-controlled kinetics, kdiff, is given by the
Smoluchowski relationship:
kdiff = 4παspin(M) RD (1.15)
where D is the diffusion coefficient of the recombining molecules in the bath medium and
αspin is the electronic weight (“spin statistical”) factor. R is the effective capture distance. In
the gas-to-liquid transition range, the combination rate constant kobs traditionally has been
approximated by the relationship22
rec diffobs
rec diff
k kk
k k
(1.16)
1.5 Reaction systems studied in this thesis
The reason for the unexpected temperature- and pressure-dependent enhancement of
combination rates at high pressures has not yet been clearly understood. This results from the
difficulty in separating the contributions of the RC mechanism from those of the ET
mechanism. Both ET and RC mechanisms yield a similar shape of the fall-off curve and
therefore one obtains always the sum of two fall-off curves. As illustrated in Figure 1.9, the
distinct difference may not be easily identified, especially if the limiting high-pressure rate
constant of the ET mechanism is reached at higher pressures where the RC mechanism
already sets on. For example, in the case of the ozone recombination,1 even though the
increase of rate constant was observed, it was difficult to separate the contribution of each
mechanism because both mechanisms contribute to the increase until diffusion starts to
15
influence the rate constant. Therefore, the need to separate and clarify qualitatively and
quantitatively the contribution of the RC mechanism to the radical combination kinetics in the
gas-to-liquid transition region is urgently required to explain such an unexpected increase of
recombination rate constants.
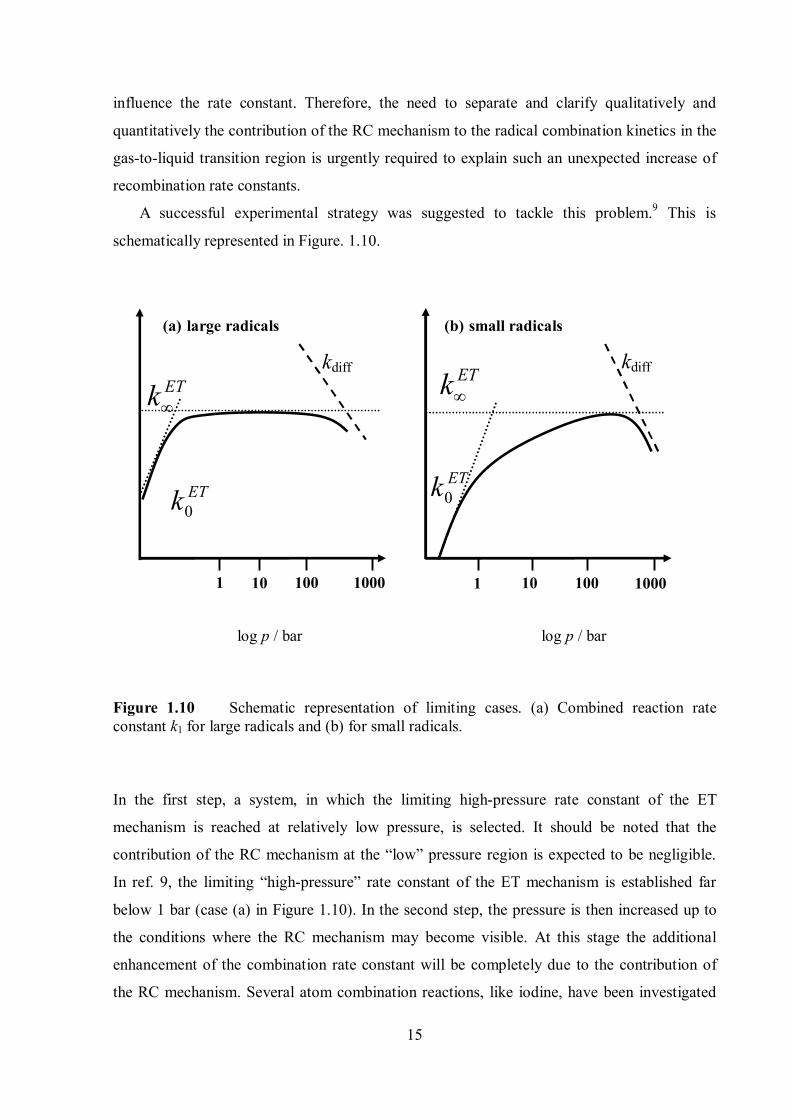
A successful experimental strategy was suggested to tackle this problem.9 This is
schematically represented in Figure. 1.10.
0ETk
Figure 1.10 Schematic representation of limiting cases. (a) Combined reaction rate constant k1 for large radicals and (b) for small radicals.
In the first step, a system, in which the limiting high-pressure rate constant of the ET
mechanism is reached at relatively low pressure, is selected. It should be noted that the
contribution of the RC mechanism at the “low” pressure region is expected to be negligible.
In ref. 9, the limiting “high-pressure” rate constant of the ET mechanism is established far
below 1 bar (case (a) in Figure 1.10). In the second step, the pressure is then increased up to
the conditions where the RC mechanism may become visible. At this stage the additional
enhancement of the combination rate constant will be completely due to the contribution of
the RC mechanism. Several atom combination reactions, like iodine, have been investigated
1 10 10 100 1000
kdiff kdiff ETk
100 1000 1
log p / bar log p / bar
(a) large radicals (b) small radicals
0ETk
ETk
16
and a higher value of the rate constant than the value calculated from the ET mechanism
observed. But as atom and small radical recombination reactions belong to case (b) in Figure
1.10, it was difficult to separate the contribution of the RC mechanism. On the other hand,
large radicals such as benzyl and p-fluorobenzyl radical, belong to case (a).
Oum et al.9 selected the benzyl radical as target radical and investigated the contribution
of the RC mechanism to the increase of the combination rate constant. In the present thesis,
we also selected the benzyl radical as the target system and investigated the temperature and
pressure dependence of the recombination rate constant in the bath gases (M) CF3H, CF4 and
SF6.
C6H5CH2 + C6H5CH2 (+M) → C14H14 (+M) (R.17)
The benzyl radical is a prototype aromatic free radical and an important intermediate in
various chemical reactive systems involving toluene; for example, at room temperature, it is
formed in a preliminary step of the tropospheric oxidation mechanism of toluene initiated by
OH radicals.23 Subsequent reactions with O2 and possibly with NO2 in polluted urban
atmospheres are responsible for the observed final oxidation products.23 Benzyl is also an
important species in high-temperature processes involving toluene, such as pyrolysis or
combustion.24-26 The spectroscopic characteristics of the benzyl radical have been studied
both in the gas-phase and in the condensed phase. In addition to such important properties of
benzyl radicals, pressures below 1 bar are required for approaching the high-pressure limit
and truly constant k∞ET are measured over a broad density range before the additional pressure
dependence of the rate constant is observed. Therefore, the benzyl radical is a suitable species
to separate and investigate the contribution of the RC mechanism to the combination reaction
constants.
In addition to benzyl radicals, several recombination reactions of benzyl-type radicals
were studied in a systematic variation of the effect of the steric hindrance around the newly
forming bond and functional groups which can influence the rotation of the radical. The
recombination reactions of p-fluorobenzyl radicals and p-methylbenzyl radicals were
investigated to see if the enhancement of recombination rate constants at high pressures can
also be found in these systems.
17
p-Fluorobenzyl radical:
p-F-C6H4CH2 + p-F-C6H4CH2 (+M) → C14H12F2 (+M) (R.18)
p-Methylbenzyl radical:
p-CH3-C6H4CH2 + p-CH3-C6H4CH2 (+M) → C16H18 (+M) (R.19)
Helium, argon, N2, and CO2 were employed as bath gases to investigate the effect of different
properties of the solvent molecules, such as dipole moment, polarizability, mass, etc.
Furthermore, we employed a mixture of He and CO2 as bath gas to investigate the preferential
local composition effect in the RC mechanism.
In addition, the transient UV absorption spectra of p-fluorobenzyl radicals and p-
methylbenzyl radicals were investigated, because no direct studies of the absorption band of
these radicals in the UV region are available. The absorption coefficient of each radical and its
temperature dependence were determined over the range 300450 K.
In the following sections, the details of these studies are described. We focus on the view
of the role of radical complexes in the radical combination reactions, consistently observed
throughout several reaction systems tested here.
18
Chapter 2
Experimental set-up
This chapter describes the equipment, instrumental set-up, and methodology that were used
for the measurement of recombination rate constants for benzyl, p-fluorobenzyl and p-
methylbenzyl radicals over the pressure range 1–700 bar and the temperature range 300–520
K in different bath gases.
2.1. Laser system
2.1.1. Excimer laser
The target radicals (benzyl, p-fluorobenzyl and p-methylbenzyl radicals) were generated
through a series of reaction steps. Laser flash photolysis of Cl2, and subsequent H-atom
abstraction reactions by the photolytically produced Cl atom are involved in these steps. A
308 nm XeCl excimer laser (Lambda Physik, model COMPEX) with a ca. 15 ns pulse length
and pulse energies of ca. 200 mJ was used as excitation source. The laser was externally
triggered by a TTL-pulse (11 V intensity, 5 μs pulse width). A pulse / delay generator
(Stanford Research Systems, model DG 535/02) was interfaced with the laser controlling
system. First, the TTL-pulse with 5 μs width and 1.1 V intensity was prepared, which was
then amplified to 11 V using the pulse / delay generator. The laser energy was measured behind the optical cell with a piezoelectric detector. The
measured laser energy of each pulse was monitored by an oscilloscope and recorded in the
computer.
19
2.1.2. Generation of radicals
The radicals were generated by laser photolysis of Cl2 at 308 nm and the subsequent fast
bimolecular reaction of chlorine atoms with an excess amount of precursors. Toluene (C6H5-
CH3), p-fluorotoluene (p-F-C6H4-CH3) and p-xylene (p-CH3-C6H4-CH3) were used as
precursors for benzyl, p-fluorobenzyl and p-methylbenzyl radicals, respectively:
Cl2 + hν → 2 Cl (R 2.1)
Cl + C6H5CH3 → C6H5CH2 + HCl (R 2.2)
The reaction rate constant for reaction 2.2 is known to be k = 6.110-11 cm3 molecule-1 s-1. The
use of an excess amount of precursors ensured that chlorine atoms were instantly and
stoichiometrically converted to benzyl radicals.27
2.2. The optical flow cells
Two slightly different types of optical flow cell for high-pressure measurements and one
glass-cell for low-pressure (below 1 bar) experiments were used in the present work for
different experimental conditions. One of the high-pressure optical flow cells which can be
cooled or heated over the temperature range 200 – 420 K at pressures of 1 – 1000 bar. The
other cell can be heated up to 600 K at pressure of 1 – 1000 bar but cannot be cooled. The cell
used for experiments below 1 bar was a glass flow cell. Both high-pressure cells and the glass
cell were designed for laser flash photolysis experiments and are described in detail below.
2.2.1. The coolable and heatable high-pressure optical flow cell
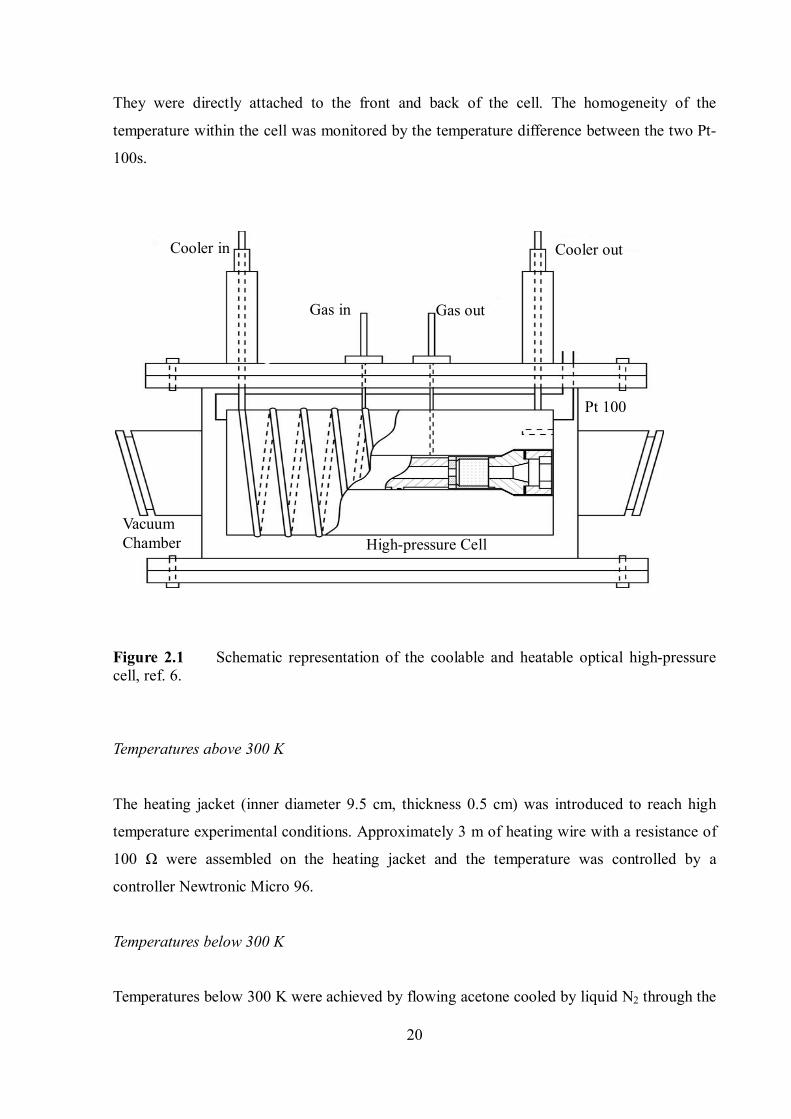
The cell was made of stainless steel (RGT 601) and the schematic diagram of the cell is
shown in Figure 2.1. The cell has a path length of 10 cm and an optical diameter of 0.9 cm. As
shown in Figure 2.1, an additional cooling or heating jacket was used. The desired
temperature conditions were achieved by simply exchanging the jacket.
The temperature was measured by two platinum resistance thermometers (Pt-100), which
have high accuracy, fast response, and a wide measurable range of temperatures (70 1000 K).
20
They were directly attached to the front and back of the cell. The homogeneity of the
temperature within the cell was monitored by the temperature difference between the two Pt-
100s.
Figure 2.1 Schematic representation of the coolable and heatable optical high-pressure cell, ref. 6.
Temperatures above 300 K
The heating jacket (inner diameter 9.5 cm, thickness 0.5 cm) was introduced to reach high
temperature experimental conditions. Approximately 3 m of heating wire with a resistance of
100 Ω were assembled on the heating jacket and the temperature was controlled by a
controller Newtronic Micro 96.
Temperatures below 300 K
Temperatures below 300 K were achieved by flowing acetone cooled by liquid N2 through the
Cooler in Cooler out
Gas in Gas out
Vacuum Chamber High-pressure Cell
Pt 100
21
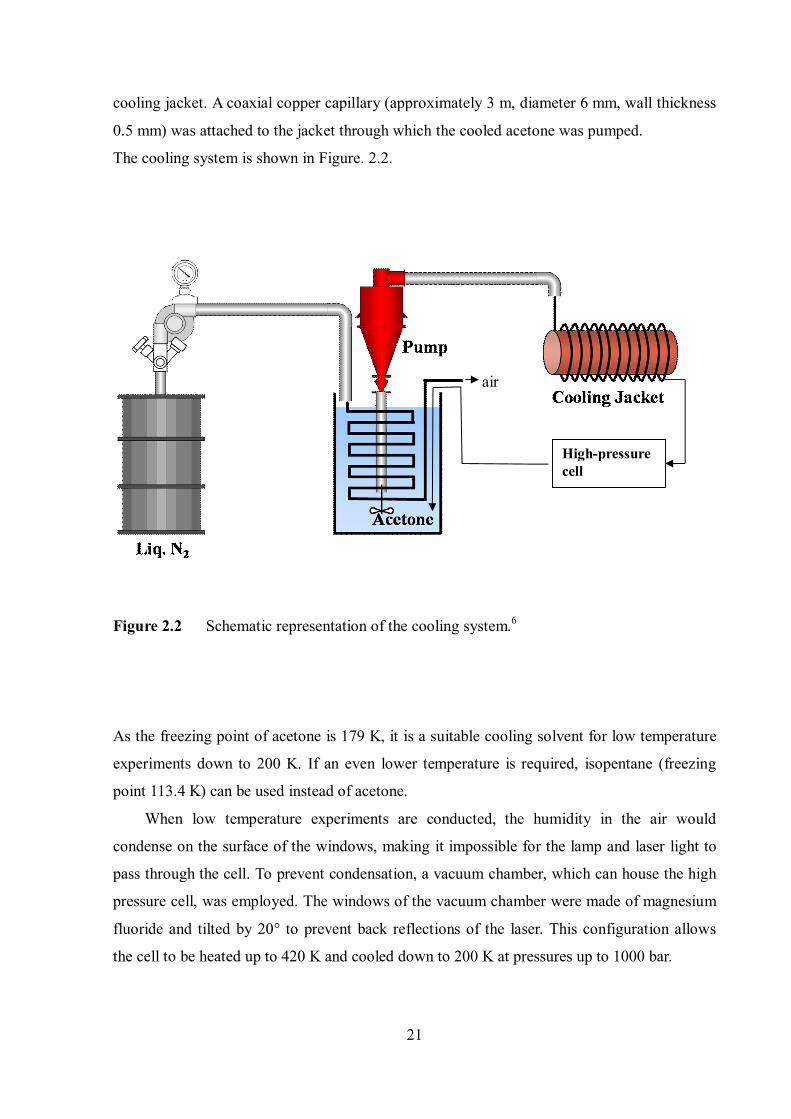
cooling jacket. A coaxial copper capillary (approximately 3 m, diameter 6 mm, wall thickness
0.5 mm) was attached to the jacket through which the cooled acetone was pumped.
The cooling system is shown in Figure. 2.2.
Figure 2.2 Schematic representation of the cooling system.6
As the freezing point of acetone is 179 K, it is a suitable cooling solvent for low temperature
experiments down to 200 K. If an even lower temperature is required, isopentane (freezing
point 113.4 K) can be used instead of acetone.
When low temperature experiments are conducted, the humidity in the air would
condense on the surface of the windows, making it impossible for the lamp and laser light to
pass through the cell. To prevent condensation, a vacuum chamber, which can house the high
pressure cell, was employed. The windows of the vacuum chamber were made of magnesium
fluoride and tilted by 20° to prevent back reflections of the laser. This configuration allows
the cell to be heated up to 420 K and cooled down to 200 K at pressures up to 1000 bar.
air
High-pressure cell
22
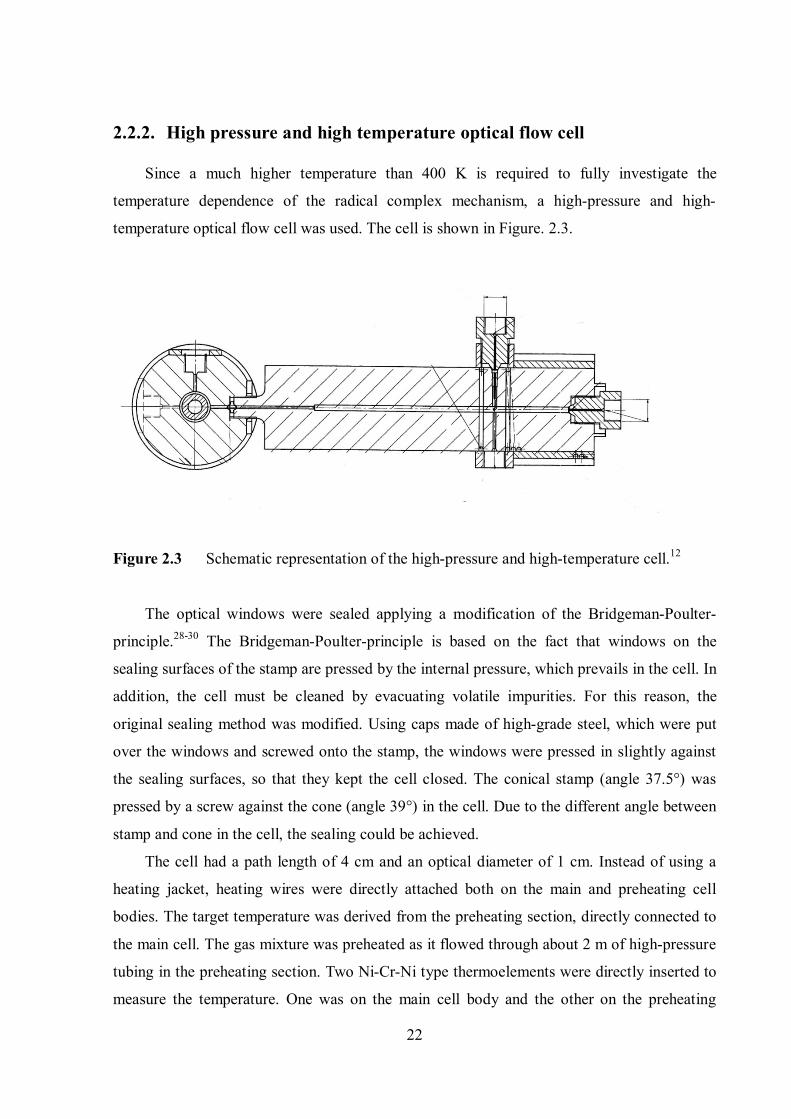
2.2.2. High pressure and high temperature optical flow cell
Since a much higher temperature than 400 K is required to fully investigate the
temperature dependence of the radical complex mechanism, a high-pressure and high-
temperature optical flow cell was used. The cell is shown in Figure. 2.3.
Figure 2.3 Schematic representation of the high-pressure and high-temperature cell.12
The optical windows were sealed applying a modification of the Bridgeman-Poulter-
principle.28-30 The Bridgeman-Poulter-principle is based on the fact that windows on the
sealing surfaces of the stamp are pressed by the internal pressure, which prevails in the cell. In
addition, the cell must be cleaned by evacuating volatile impurities. For this reason, the
original sealing method was modified. Using caps made of high-grade steel, which were put
over the windows and screwed onto the stamp, the windows were pressed in slightly against
the sealing surfaces, so that they kept the cell closed. The conical stamp (angle 37.5°) was
pressed by a screw against the cone (angle 39°) in the cell. Due to the different angle between
stamp and cone in the cell, the sealing could be achieved.
The cell had a path length of 4 cm and an optical diameter of 1 cm. Instead of using a
heating jacket, heating wires were directly attached both on the main and preheating cell
bodies. The target temperature was derived from the preheating section, directly connected to
the main cell. The gas mixture was preheated as it flowed through about 2 m of high-pressure
tubing in the preheating section. Two Ni-Cr-Ni type thermoelements were directly inserted to
measure the temperature. One was on the main cell body and the other on the preheating
23
section. Based on the temperature from the two thermoelements, the temperature was
registered by a temperature controller (Eurotherm Type 2408) with an accuracy of 0.1 K. This
configuration allowed the cell to be heated above 600 K and pressurized up to 700 bar.
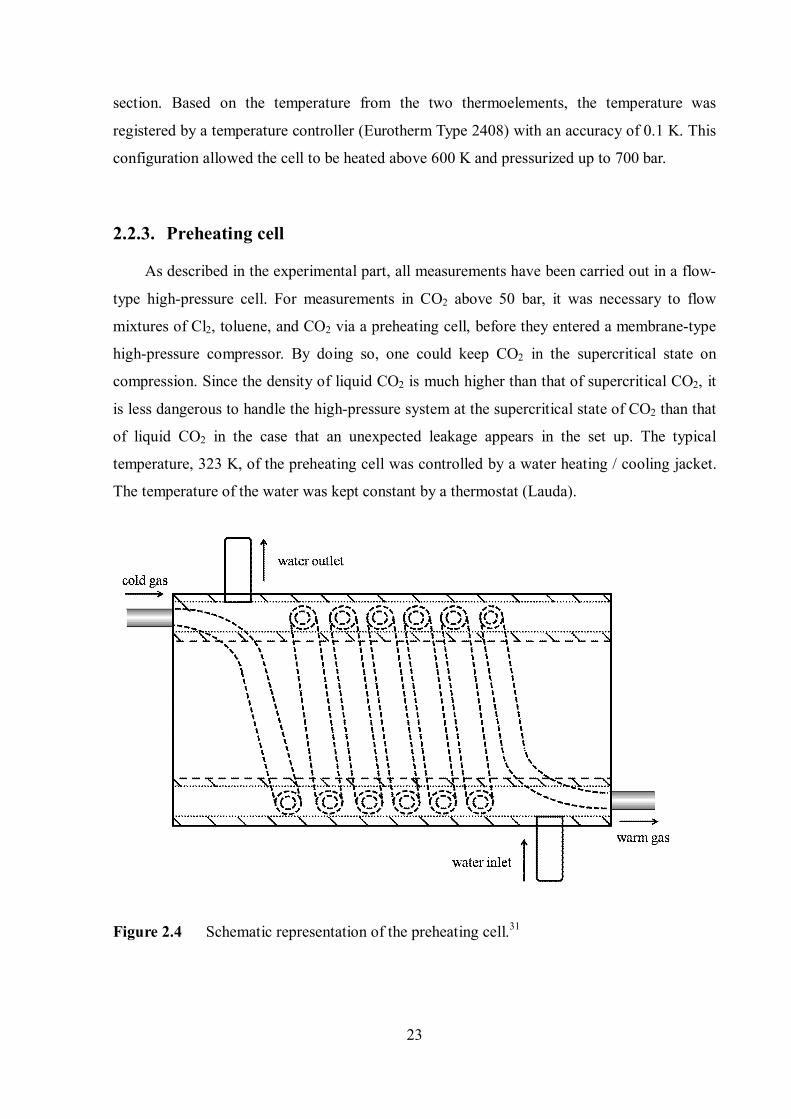
2.2.3. Preheating cell
As described in the experimental part, all measurements have been carried out in a flow-
type high-pressure cell. For measurements in CO2 above 50 bar, it was necessary to flow
mixtures of Cl2, toluene, and CO2 via a preheating cell, before they entered a membrane-type
high-pressure compressor. By doing so, one could keep CO2 in the supercritical state on
compression. Since the density of liquid CO2 is much higher than that of supercritical CO2, it
is less dangerous to handle the high-pressure system at the supercritical state of CO2 than that
of liquid CO2 in the case that an unexpected leakage appears in the set up. The typical
temperature, 323 K, of the preheating cell was controlled by a water heating / cooling jacket.
The temperature of the water was kept constant by a thermostat (Lauda).
Figure 2.4 Schematic representation of the preheating cell.31
24
To prevent cooling down of the CO2 behind the preheating cell, the compressor was heated up
to 310 K, and the temperature was measured just after the preheating cell and in the outlet part
of the compressor (Nova Swiss, Model 2122). Figure 2.4 shows the schematic diagram of the
preheating cell, used in the high-pressure CO2 experiments.
2.2.4. Low pressure (< 1 bar) optical flow cell
To determine the high-pressure limit of the rate constant in the energy-transfer
mechanism, 1,ETk , for experiments below 1 bar, an existing flow cell made of glass was used.
This glass cell had an optical path length of 52 cm and an optical diameter of 3 cm. Basically,
the signal intensity was proportional to the concentration of Cl2. As the concentration of Cl2
was low for the experiments < 1 bar, the optical path length was increased to improve the
signal intensity. Quartz windows were used, and the windows were tilted at Brewster’s angle.
The evacuation of the glass cell to reach pressures below 1 bar was performed using a rotary
vacuum pump. The target pressure was achieved by controlling two needle valves, one before
the inlet and the other one behind the outlet of the cell.
2.3. Flow system
The high-pressure capillary, which can hold high pressures up to 4000 bar (Nova Swiss,
TBG 60 – 4, 1/4” outer diameter, 3/32” inner diameter), was used in the high-pressure section
(from the compressor outlet to high-pressure cell outlet). Also, all components such as valves,
unions, and reducers could withstand up to at least 1000 bar (Nova Swiss). On the other hand,
standard 6 mm OD tubing (Swagelok) connected the sample vessel to the compressor,
because the maximum pressure was less than 200 bar in this section. For experiments below
100 bar, a high pressure gas mixture was connected directly to the high-pressure optical cell
without a compressor. Typically, gas mixtures with a pressure 20 bar above the highest
pressure needed were prepared and used under flow condition for the experiments conducted
without compression. The pressure inside the cell was controlled by two high-pressure micro-
metering valves (Nova Swiss, Model 530.6131).
25
(a) (b)
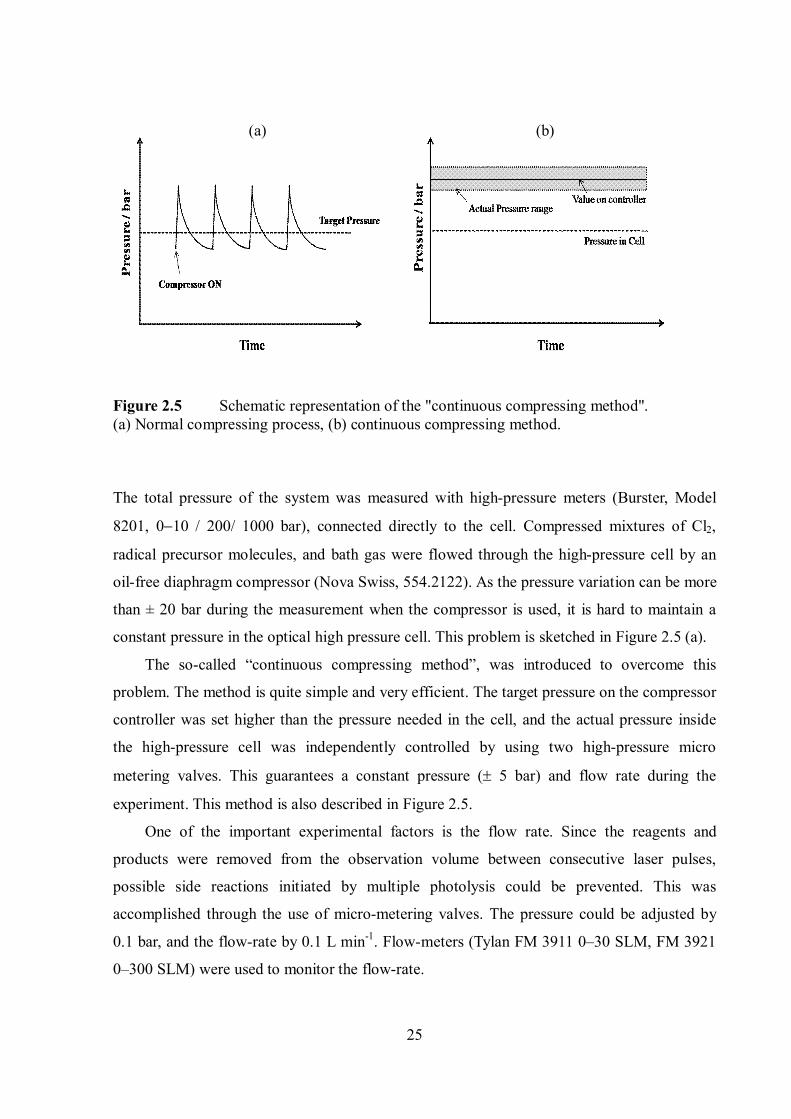
Figure 2.5 Schematic representation of the "continuous compressing method". (a) Normal compressing process, (b) continuous compressing method.
The total pressure of the system was measured with high-pressure meters (Burster, Model
8201, 010 / 200/ 1000 bar), connected directly to the cell. Compressed mixtures of Cl2,
radical precursor molecules, and bath gas were flowed through the high-pressure cell by an
oil-free diaphragm compressor (Nova Swiss, 554.2122). As the pressure variation can be more
than ± 20 bar during the measurement when the compressor is used, it is hard to maintain a
constant pressure in the optical high pressure cell. This problem is sketched in Figure 2.5 (a).
The so-called “continuous compressing method”, was introduced to overcome this
problem. The method is quite simple and very efficient. The target pressure on the compressor
controller was set higher than the pressure needed in the cell, and the actual pressure inside
the high-pressure cell was independently controlled by using two high-pressure micro
metering valves. This guarantees a constant pressure ( 5 bar) and flow rate during the
experiment. This method is also described in Figure 2.5.
One of the important experimental factors is the flow rate. Since the reagents and
products were removed from the observation volume between consecutive laser pulses,
possible side reactions initiated by multiple photolysis could be prevented. This was
accomplished through the use of micro-metering valves. The pressure could be adjusted by
0.1 bar, and the flow-rate by 0.1 L min-1. Flow-meters (Tylan FM 3911 0–30 SLM, FM 3921
0–300 SLM) were used to monitor the flow-rate.
26
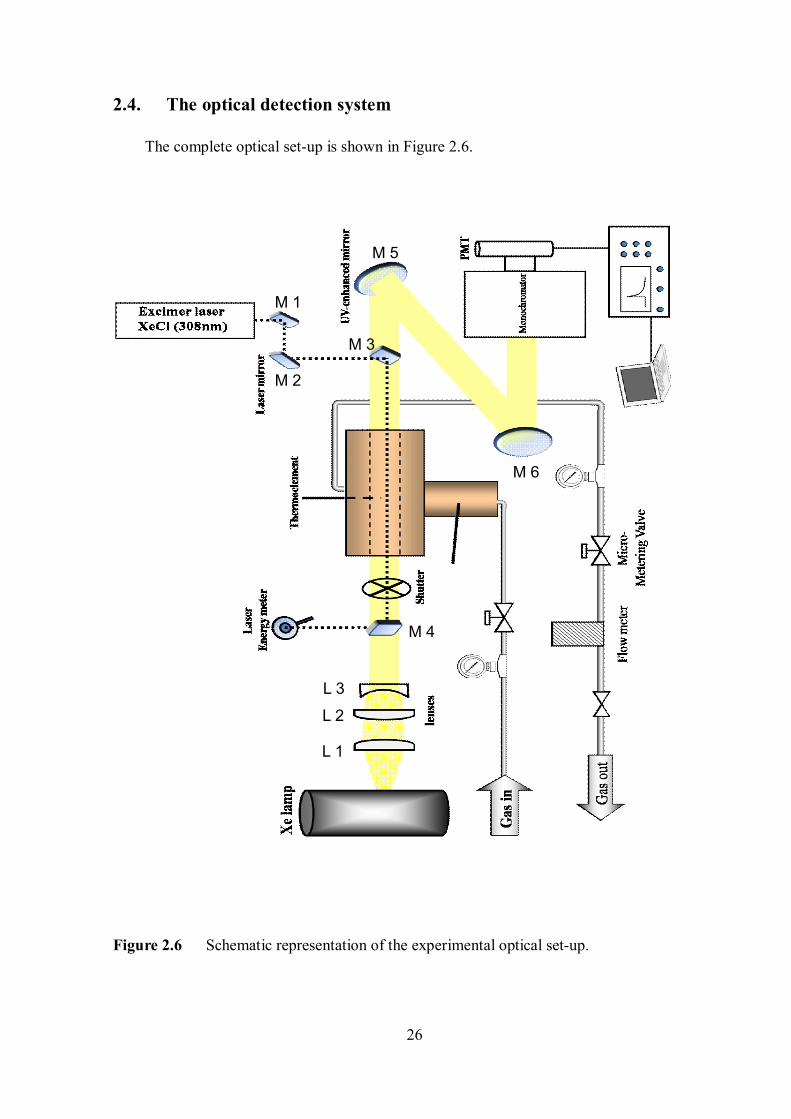
2.4. The optical detection system
The complete optical set-up is shown in Figure 2.6.
Figure 2.6 Schematic representation of the experimental optical set-up.
M 1
M 2
M 3
M 4
L 1
L 2
L 3
M 5
M 6
27
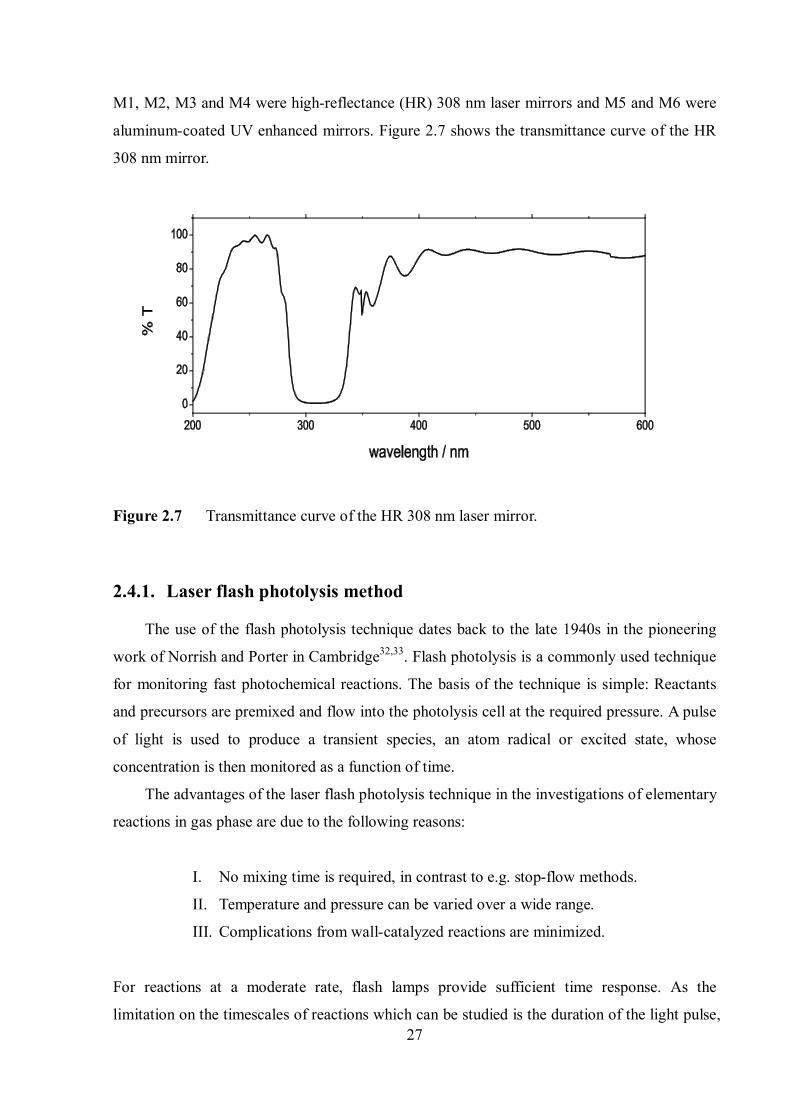
M1, M2, M3 and M4 were high-reflectance (HR) 308 nm laser mirrors and M5 and M6 were
aluminum-coated UV enhanced mirrors. Figure 2.7 shows the transmittance curve of the HR
308 nm mirror.
Figure 2.7 Transmittance curve of the HR 308 nm laser mirror.
2.4.1. Laser flash photolysis method
The use of the flash photolysis technique dates back to the late 1940s in the pioneering
work of Norrish and Porter in Cambridge32,33. Flash photolysis is a commonly used technique
for monitoring fast photochemical reactions. The basis of the technique is simple: Reactants
and precursors are premixed and flow into the photolysis cell at the required pressure. A pulse
of light is used to produce a transient species, an atom radical or excited state, whose
concentration is then monitored as a function of time.
The advantages of the laser flash photolysis technique in the investigations of elementary
reactions in gas phase are due to the following reasons:
I. No mixing time is required, in contrast to e.g. stop-flow methods.
II. Temperature and pressure can be varied over a wide range.
III. Complications from wall-catalyzed reactions are minimized.
For reactions at a moderate rate, flash lamps provide sufficient time response. As the
limitation on the timescales of reactions which can be studied is the duration of the light pulse,
28
pulsed xenon lamps are not suitable for very fast reactions. In general the pulse width of the
light source must be much shorter than the half-life of the chemical reaction. Whilst lamps are
still employed, the majority of flash photolysis experiments are now conducted with lasers.
For faster reactions, lasers must be used that have pulse widths in the nanosecond range.
Using ultrafast pulsed lasers allows processes in the sub-picosecond time scale to be studied.
The excimer laser is particularly widely employed due to useful properties such as a pulse
duration of ca.15 ns, repetition rates of up to 500 Hz and high pulse energies. In the present
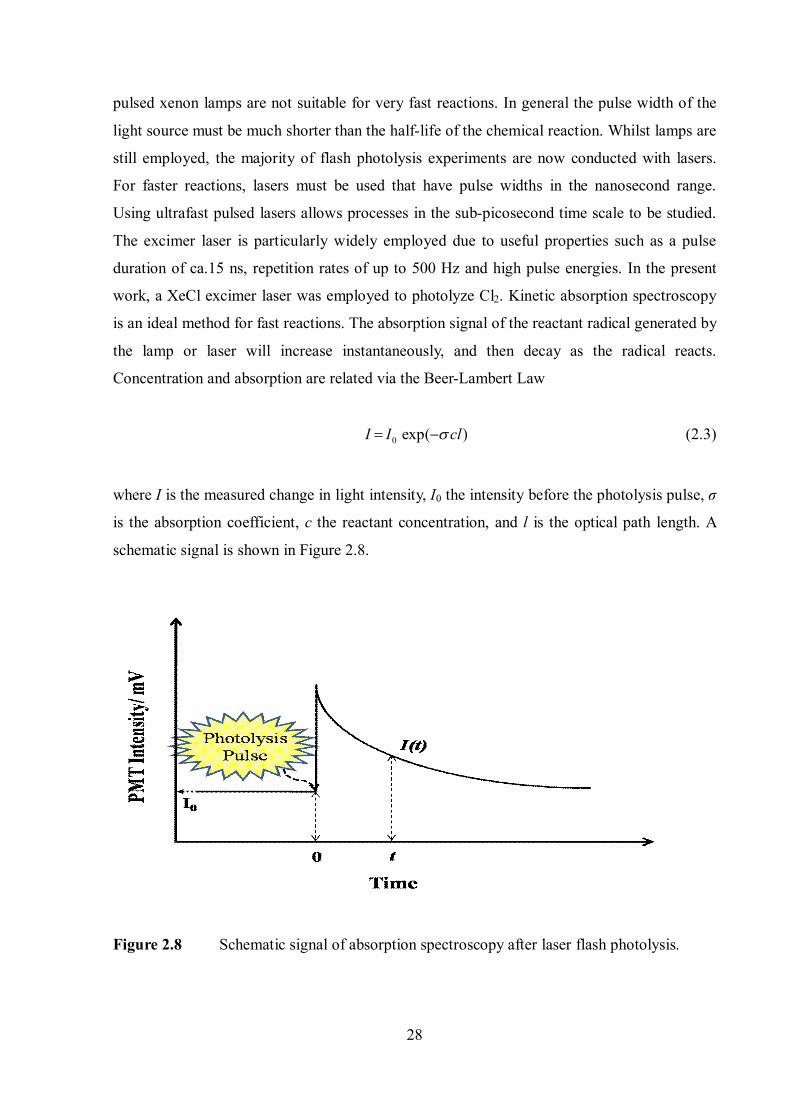
work, a XeCl excimer laser was employed to photolyze Cl2. Kinetic absorption spectroscopy
is an ideal method for fast reactions. The absorption signal of the reactant radical generated by
the lamp or laser will increase instantaneously, and then decay as the radical reacts.
Concentration and absorption are related via the Beer-Lambert Law
0 exp( )I I cl (2.3)
where I is the measured change in light intensity, I0 the intensity before the photolysis pulse, σ
is the absorption coefficient, c the reactant concentration, and l is the optical path length. A
schematic signal is shown in Figure 2.8.
Figure 2.8 Schematic signal of absorption spectroscopy after laser flash photolysis.
29
2.4.2. Detection
The detection wavelength was determined based on the UV absorption spectrum of each
radical. A wavelength of 253 nm for benzyl and p-fluorobenzyl, and 260 nm for the p-
methylbenzyl radical (p-xylyl) were selected based on reference and measured UV absorption
spectra. The transient absorption spectrum of each radical is discussed in detail later. The
progress of each radical recombination reaction was monitored by recording the absorption
signal of each radical at the selected wavelength on time scales of μs to ms. The light source
used to monitor the absorption signals of benzyl and p-fluorobenzyl was a high-intensity Hg-
Xe lamp (Ushio, model UXM-200 H, 200 W) because the lamp has a strong peak at 253 nm,
which was ideal for these radicals. For a broadband absorption experiment, a high-pressure
xenon arc lamp (Osram, model XBO 150W/1) was used as a light source instead of the Hg-Xe
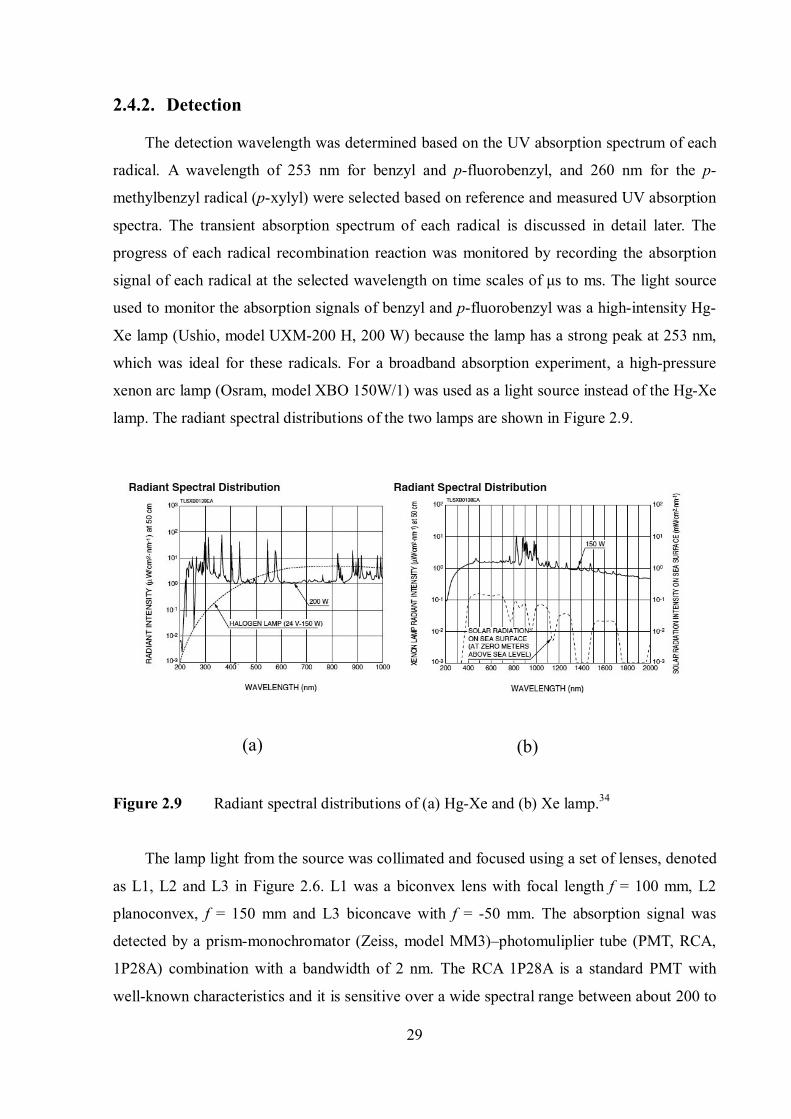
lamp. The radiant spectral distributions of the two lamps are shown in Figure 2.9.
Figure 2.9 Radiant spectral distributions of (a) Hg-Xe and (b) Xe lamp.34
The lamp light from the source was collimated and focused using a set of lenses, denoted
as L1, L2 and L3 in Figure 2.6. L1 was a biconvex lens with focal length f = 100 mm, L2
planoconvex, f = 150 mm and L3 biconcave with f = -50 mm. The absorption signal was
detected by a prism-monochromator (Zeiss, model MM3)–photomuliplier tube (PMT, RCA,
1P28A) combination with a bandwidth of 2 nm. The RCA 1P28A is a standard PMT with
well-known characteristics and it is sensitive over a wide spectral range between about 200 to
(a) (b)
30
500 nm with a good quantum efficiency. The monochromator was set for wavelengths
between 240 and 280 nm but most of the experiments were carried out at 253 nm or 260 nm,
where the benzyl radical and p-methylbenzyl radical are found to possess maximum
absorption coefficients, respectively.
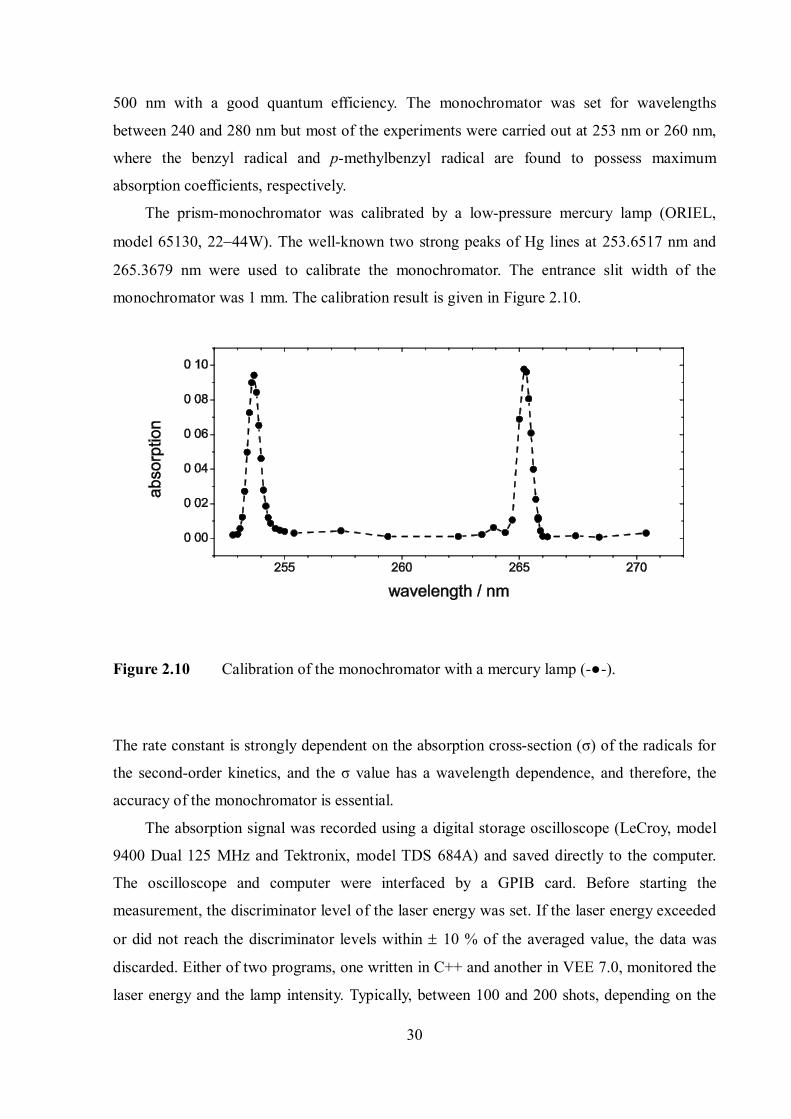
The prism-monochromator was calibrated by a low-pressure mercury lamp (ORIEL,
model 65130, 2244W). The well-known two strong peaks of Hg lines at 253.6517 nm and
265.3679 nm were used to calibrate the monochromator. The entrance slit width of the
monochromator was 1 mm. The calibration result is given in Figure 2.10.
Figure 2.10 Calibration of the monochromator with a mercury lamp (-●-).
The rate constant is strongly dependent on the absorption cross-section (σ) of the radicals for
the second-order kinetics, and the σ value has a wavelength dependence, and therefore, the
accuracy of the monochromator is essential.
The absorption signal was recorded using a digital storage oscilloscope (LeCroy, model
9400 Dual 125 MHz and Tektronix, model TDS 684A) and saved directly to the computer.
The oscilloscope and computer were interfaced by a GPIB card. Before starting the
measurement, the discriminator level of the laser energy was set. If the laser energy exceeded
or did not reach the discriminator levels within 10 % of the averaged value, the data was
discarded. Either of two programs, one written in C++ and another in VEE 7.0, monitored the
laser energy and the lamp intensity. Typically, between 100 and 200 shots, depending on the
31
signal intensity, were averaged. As p-methylbenzyl radicals have smaller absorption
coefficients compared to benzyl, at least one hundred shots were averaged to get a satisfactory
signal-to-noise ratio. Usually 2500 data points were recorded by the oscilloscope in each
measurement.
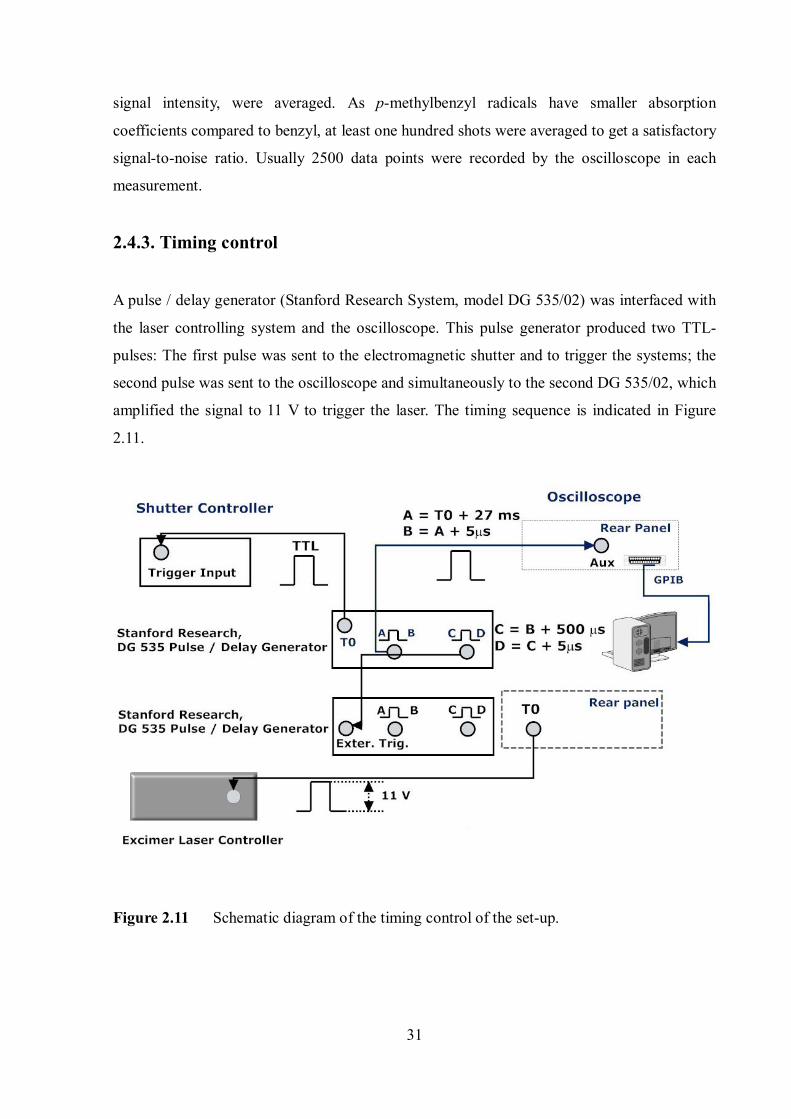
2.4.3. Timing control
A pulse / delay generator (Stanford Research System, model DG 535/02) was interfaced with
the laser controlling system and the oscilloscope. This pulse generator produced two TTL-
pulses: The first pulse was sent to the electromagnetic shutter and to trigger the systems; the
second pulse was sent to the oscilloscope and simultaneously to the second DG 535/02, which
amplified the signal to 11 V to trigger the laser. The timing sequence is indicated in Figure
2.11.
Figure 2.11 Schematic diagram of the timing control of the set-up.
32
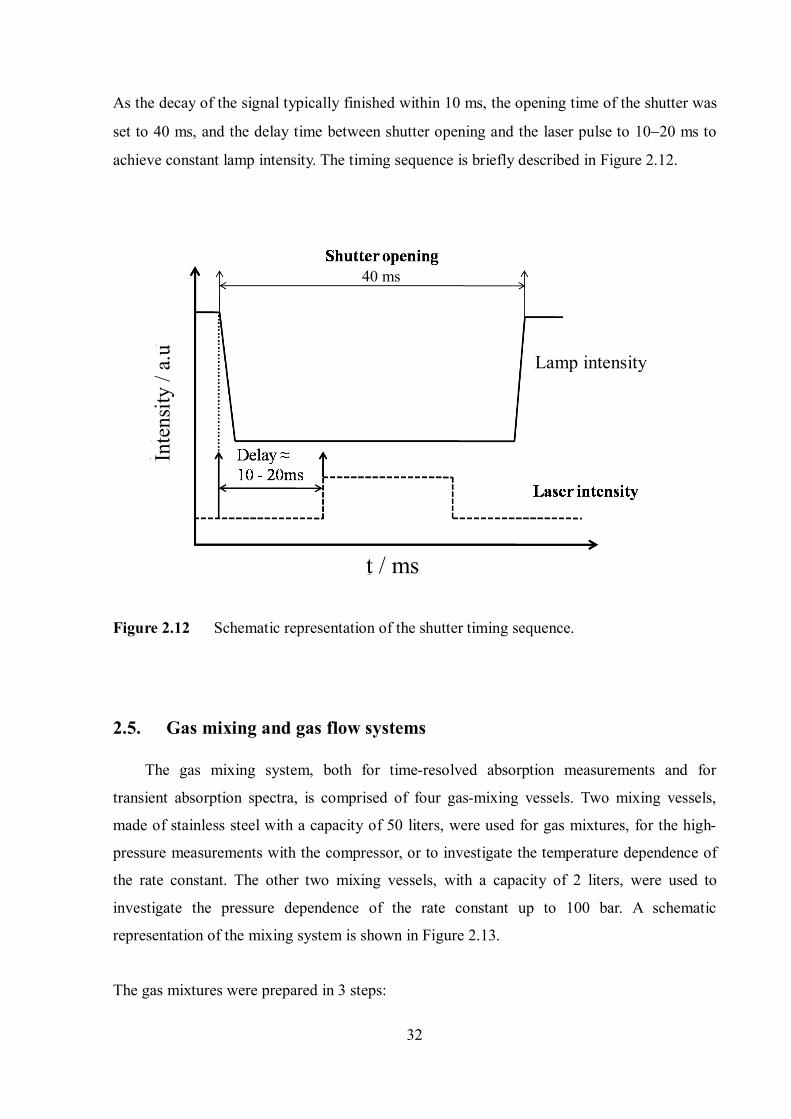
As the decay of the signal typically finished within 10 ms, the opening time of the shutter was
set to 40 ms, and the delay time between shutter opening and the laser pulse to 1020 ms to
achieve constant lamp intensity. The timing sequence is briefly described in Figure 2.12.
Figure 2.12 Schematic representation of the shutter timing sequence.
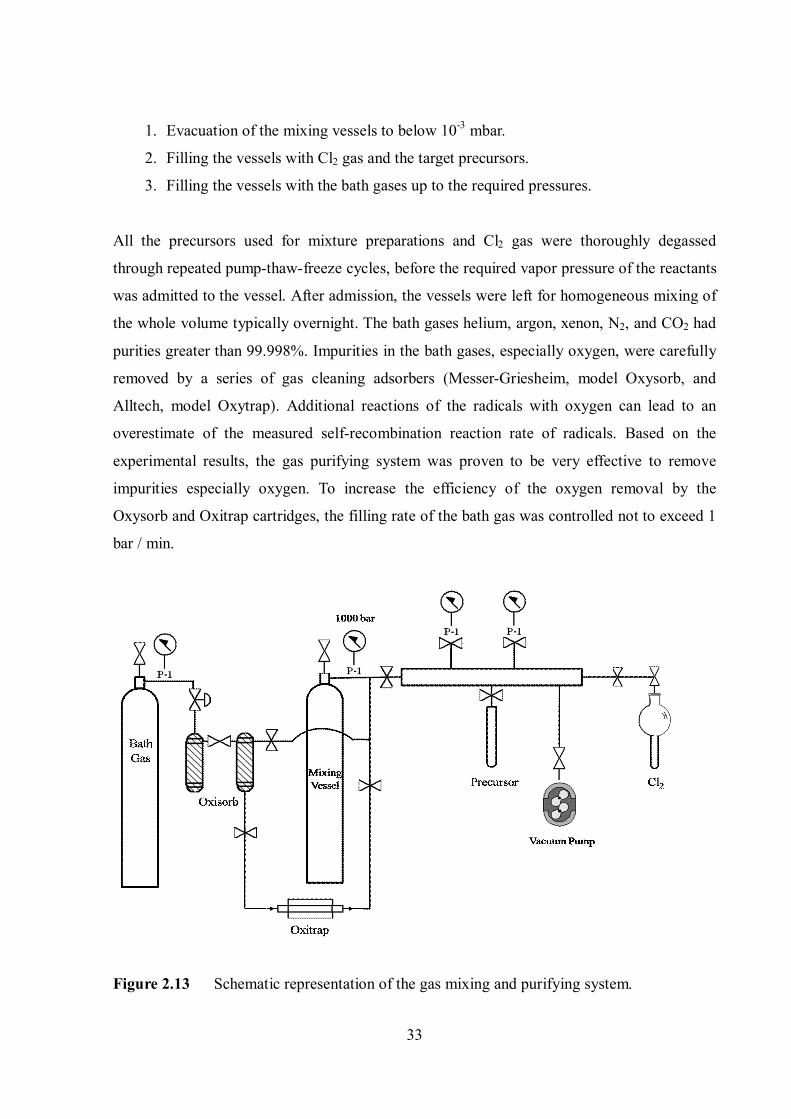
2.5. Gas mixing and gas flow systems
The gas mixing system, both for time-resolved absorption measurements and for
transient absorption spectra, is comprised of four gas-mixing vessels. Two mixing vessels,
made of stainless steel with a capacity of 50 liters, were used for gas mixtures, for the high-
pressure measurements with the compressor, or to investigate the temperature dependence of
the rate constant. The other two mixing vessels, with a capacity of 2 liters, were used to
investigate the pressure dependence of the rate constant up to 100 bar. A schematic
representation of the mixing system is shown in Figure 2.13.
The gas mixtures were prepared in 3 steps:
Inte
nsity
/ a.
u
Lamp intensity
40 ms
t / ms
33
1. Evacuation of the mixing vessels to below 10-3 mbar.
2. Filling the vessels with Cl2 gas and the target precursors.
3. Filling the vessels with the bath gases up to the required pressures.
All the precursors used for mixture preparations and Cl2 gas were thoroughly degassed
through repeated pump-thaw-freeze cycles, before the required vapor pressure of the reactants
was admitted to the vessel. After admission, the vessels were left for homogeneous mixing of
the whole volume typically overnight. The bath gases helium, argon, xenon, N2, and CO2 had
purities greater than 99.998%. Impurities in the bath gases, especially oxygen, were carefully
removed by a series of gas cleaning adsorbers (Messer-Griesheim, model Oxysorb, and
Alltech, model Oxytrap). Additional reactions of the radicals with oxygen can lead to an
overestimate of the measured self-recombination reaction rate of radicals. Based on the
experimental results, the gas purifying system was proven to be very effective to remove
impurities especially oxygen. To increase the efficiency of the oxygen removal by the
Oxysorb and Oxitrap cartridges, the filling rate of the bath gas was controlled not to exceed 1
bar / min.
Figure 2.13 Schematic representation of the gas mixing and purifying system.
34
Pressures up to 120 bar could be reached without the use of a compressor. The mixing
vessels were directly connected to the high-pressure optical cell and the pressure was
controlled by two micro-metering valves. The compressor was used to acquire pressures
higher than 120 bar and was placed between the high-pressure cell and the mixing vessel.
Usually, the value from the pressure gauge, placed directly on the high-pressure cell, was sent
to the controller of the compressor as the reference value. As the pressures between the micro-
metering valve and inside the cell are different, a manometer was used to check the pressure
between the compressor outlet and the first micro metering valve for safety reasons.
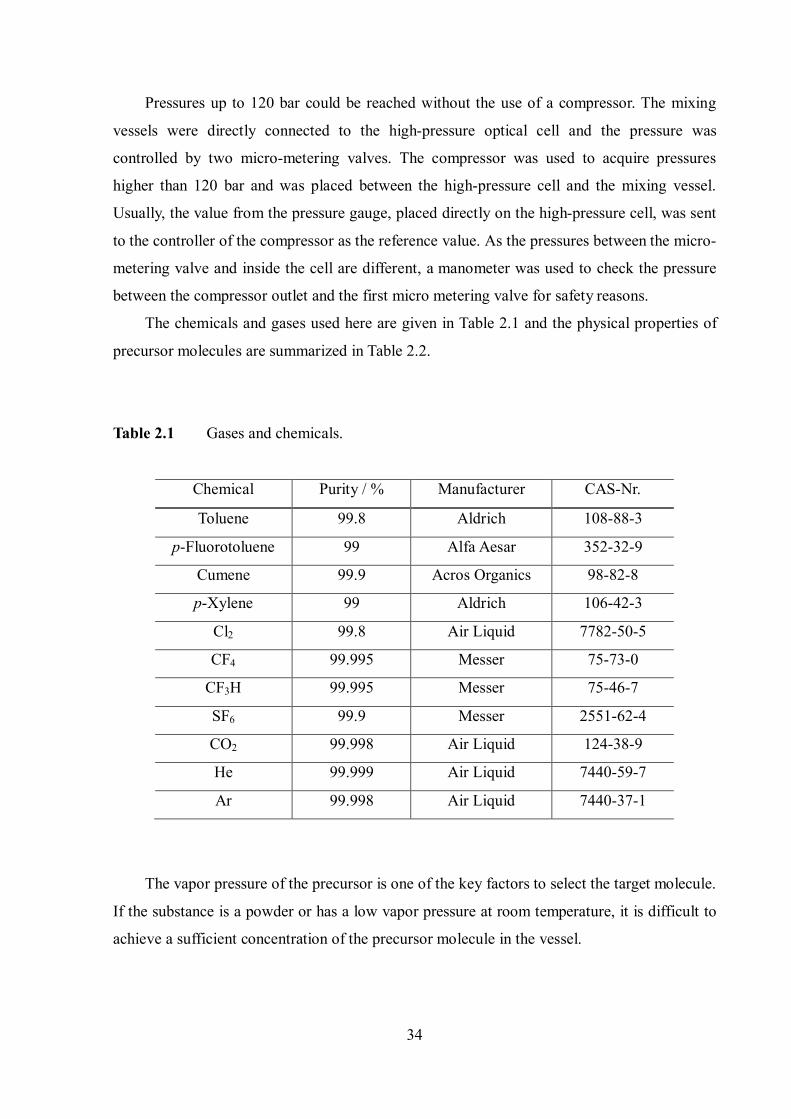
The chemicals and gases used here are given in Table 2.1 and the physical properties of
precursor molecules are summarized in Table 2.2.
Table 2.1 Gases and chemicals.
Chemical Purity / % Manufacturer CAS-Nr.
Toluene 99.8 Aldrich 108-88-3
p-Fluorotoluene 99 Alfa Aesar 352-32-9
Cumene 99.9 Acros Organics 98-82-8
p-Xylene 99 Aldrich 106-42-3
Cl2 99.8 Air Liquid 7782-50-5
CF4 99.995 Messer 75-73-0
CF3H 99.995 Messer 75-46-7
SF6 99.9 Messer 2551-62-4
CO2 99.998 Air Liquid 124-38-9
He 99.999 Air Liquid 7440-59-7
Ar 99.998 Air Liquid 7440-37-1
The vapor pressure of the precursor is one of the key factors to select the target molecule.
If the substance is a powder or has a low vapor pressure at room temperature, it is difficult to
achieve a sufficient concentration of the precursor molecule in the vessel.
35
Table 2.2 The physical properties of the precursor molecules.
Molecule Molecular
weight / u
Vapor pressure
/mbar at 293 K
Boiling point
/ K
Melting point
/ K
Toluene 92.1384 29.8 383 180
p-Fluorotoluene 110.1289 54.2 389 217
p-Xylene 106.1650 12.2 411 285
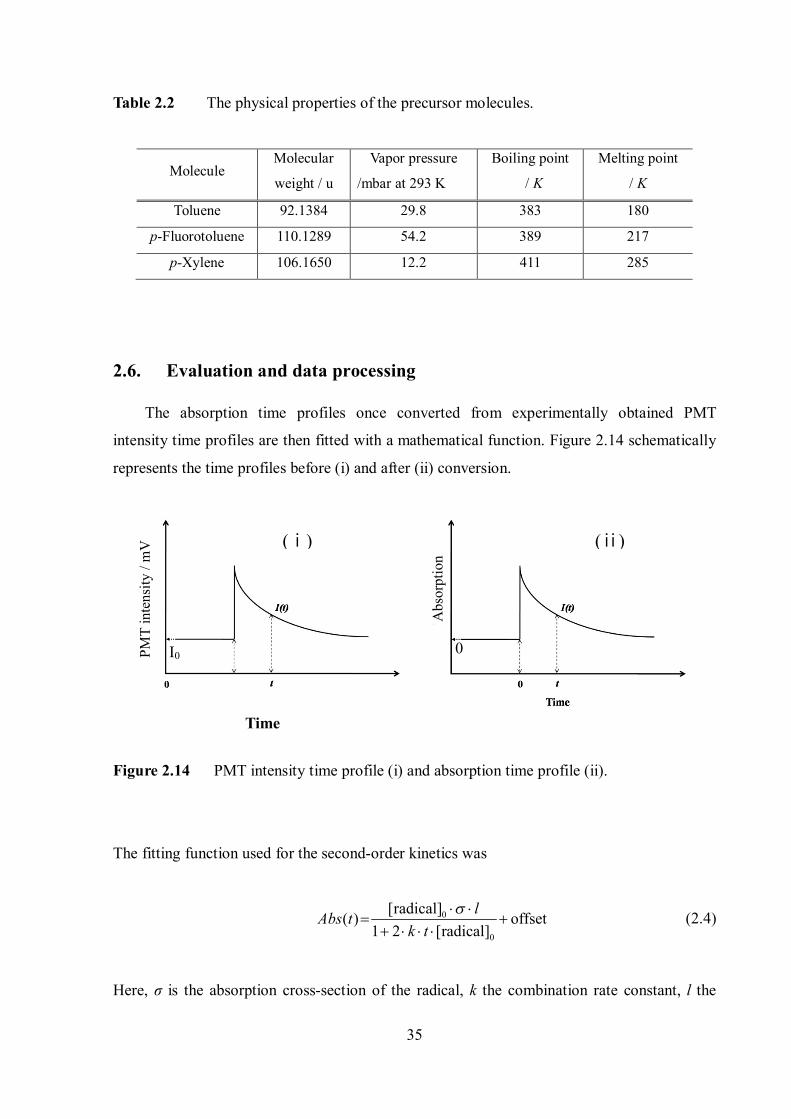
2.6. Evaluation and data processing
The absorption time profiles once converted from experimentally obtained PMT
intensity time profiles are then fitted with a mathematical function. Figure 2.14 schematically
represents the time profiles before (i) and after (ii) conversion.
Figure 2.14 PMT intensity time profile (i) and absorption time profile (ii).
The fitting function used for the second-order kinetics was
0
0
[radical]( ) offset1 2 [radical]
lAbs tk t
(2.4)
Here, σ is the absorption cross-section of the radical, k the combination rate constant, l the
PMT
inte
nsity
/ m
V
I0
Time
Abs
orpt
ion
0
(ⅰ) (ⅱ)

36
optical path length and [radical]0 the concentration of the radicals at t = 0. [radical]0, k and
offset are the fitting parameters. The k values were obtained by fitting the experimental data
with this function within a ± 95% confidence level.
37
Chapter 3
Results
3.1 Recombination reaction of p-fluorobenzyl radicals
Oum et al.10 studied pressure and temperature dependent combination rate constants of
benzyl radicals in helium, argon, xenon, N2, and CO2. An unexpected increase of the rate
constant over the limiting high-pressure rate constant ( ETk ) was reported, which one obtains
based on the traditional ET mechanism. In ref. 10, the magnitude of increase of the rate
constant depended on the bath gas and increased in the order He < N2 Ar Xe < CO2.
The RC mechanism was used to interpret the observed rate constants of the benzyl radical
combination reaction. The combination of p-fluorobenzyl radicals has been investigated in order to see if the
enhancement of recombination rate constants at high pressures, observed in the benzyl radical
recombination reaction, can also be found in the case of p-fluorobenzyl radicals.35
Additionally, the effect of fluorine substitution of the benzyl ring was investigated. As
fluorine is the strongest electron-withdrawing substituent, the substituent effect on the radical
stability and the relation between the radical stability and recombination rate constant can also
be investigated. The rate constants of the combination reaction
p-F-C6H4-CH2 + p-F-C6H4-CH2 (+M) → C14H12F2 (+M) k1 (3.1.1)
38
have been measured over the pressure range 0.2–800 bar and the temperature range 255-420
K. Helium, argon, and CO2 were employed as bath gases (M). There have been several
previous measurements related to p-flurobenzyl radicals in the gas-phase. The reaction rates
of p- and m-fluorobenzyl radicals with O2, NO and NO2 were investigated by discharge
flow/laser-induced fluorescence experiments.36,37 As the fluorine substituted aromatic
compounds emit strong fluorescence in the visible region, most of the spectroscopic
measurements of p-fluorobenzyl radicals were conducted in the visible region (absorption and
fluorescence spectra, fluorescence lifetime).1,2,9,38,39 However, no direct study of the
absorption band of p-fluorobenzyl radicals in the UV region is available, and there has been
no direct measurement of reaction (3.1.1) in the gas-phase either.
In the present work, first, the transient UV absorption spectrum of p-fluorobenzyl radicals
at room temperature was measured and then the pressure- and temperature-dependence of the
absorption coefficient was investigated. The study of the pressure- and temperature-dependent
rate constant, k1, which may provide another example for a significant contribution of the
radical-complex mechanism in the gas-liquid transition region are presented.
Like benzyl radicals, p-fluorobenzyl radicals were generated by laser flash photolysis of
Cl2 at 308 nm and the subsequent reaction of Cl atoms with excess p-fluorotoluene
Cl2 + hν (308 nm) → 2Cl (3.1.2)
Cl + p-F-C6H4-CH3 → p-F-C6H4-CH2 + HCl (3.1.3)
The processes to generate p-fluorobenzyl radicals are similar to those of benzyl radicals.3 The
rate constant of reaction (3.1.3) is nearly as large as k(Cl + toluene) = 106 10 cm3 molecule-1
s-1.4 Under these conditions, Cl atoms are instantly and stoichiometically converted to p-
fluorobenzyl radicals. Typical concentrations were [Cl]0 (=[p-fluorobenzyl]0) = 13(1 5) 10
molecule s-3 and [p-fluorotoluene] = 16(0.7 7) 10 molecule cm-3.
39
3.1.1. Determination of σp-fluorobenzyl and the radical spectrum of p-fluorobenzyl radical
As reaction (3.1.3) follows second-order kinetics and therefore the measured rates are
sensitive to the absorption coefficient σp-fluorobenzyl, it is essential to determine values of σp-
fluorobenzyl prior to the kinetic analysis. In the following, we describe how they were
experimentally determined. We employed benzyl radicals as a calibration source at the probe
wavelength of 253 nm; the absorption coefficient σbenzyl at 253 nm is already known in the
literature.9 Such a calibration procedure was necessary mainly because one cannot easily
determine the excitation yield of Cl2 and the subsequent quantity of [Cl]0 in equation 3.1.2.
This quantity can be estimated, if one keeps the same initial concentrations of [Cl2] for two
independent gas mixtures of [Cl2]0 + [toluene] and [Cl2]0 + [p-Fluorotoluene]0.
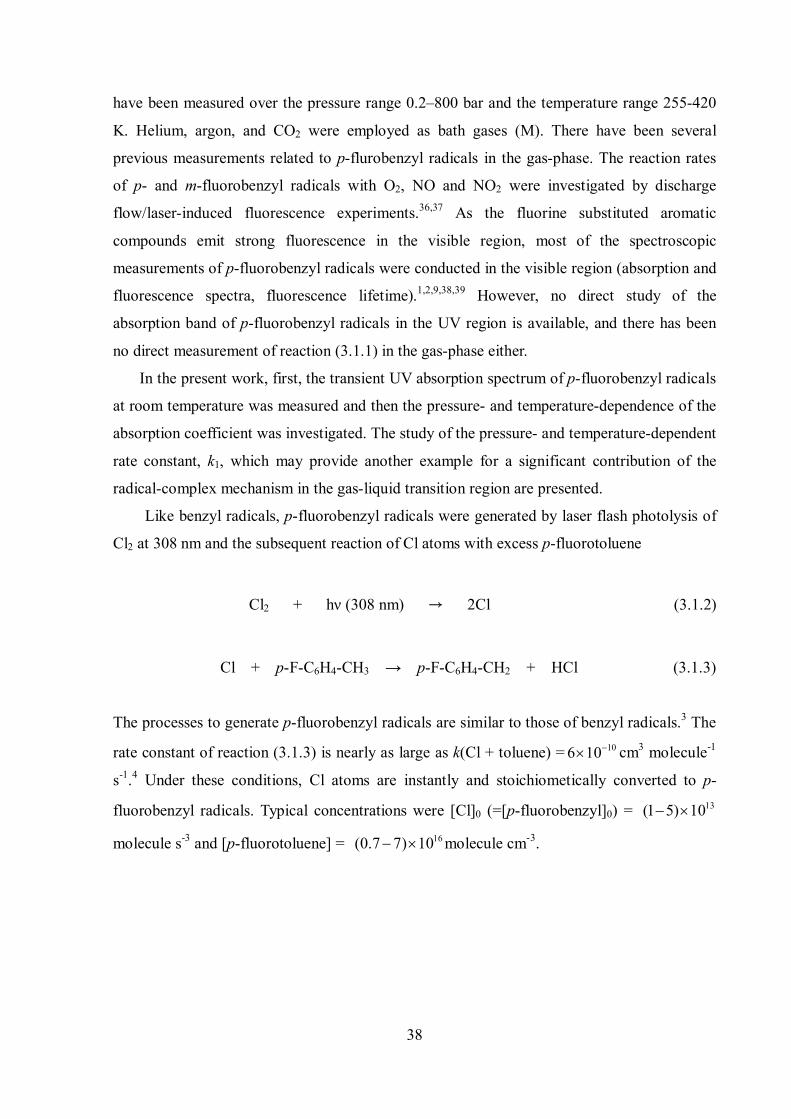
Figure 3.1.1 Typical transient absorption signals of benzyl (○) and p-fluorobenzyl radicals ( ) at 253 nm. Signals were recorded after the photolysis at 308 nm of mixtures with the same initial concentration: 0.06 mbar of Cl2 and 0.28 mbar of toluene and p-fluorotoluene in 700 mbar Ar at 300 K.
First, we measured the absorption-time traces of benzyl radicals at 253 nm, produced in
reaction 3.1.1 when toluene was employed instead of p-fluorotoluene. Then, for the same
initial concentration of Cl2, absorption-time traces of p-fluorobenzyl radicals were measured.
The absorption maxima were normalized to the laser intensities. Finally, the differences in the
absorption signals were compared as shown in Figure 3.1.1 as an example.
The time traces of benzyl radical and p-fluorobenzyl radicals under the same
experimental conditions are shown in Figure 3.1.1. Such time traces of both radicals were
40
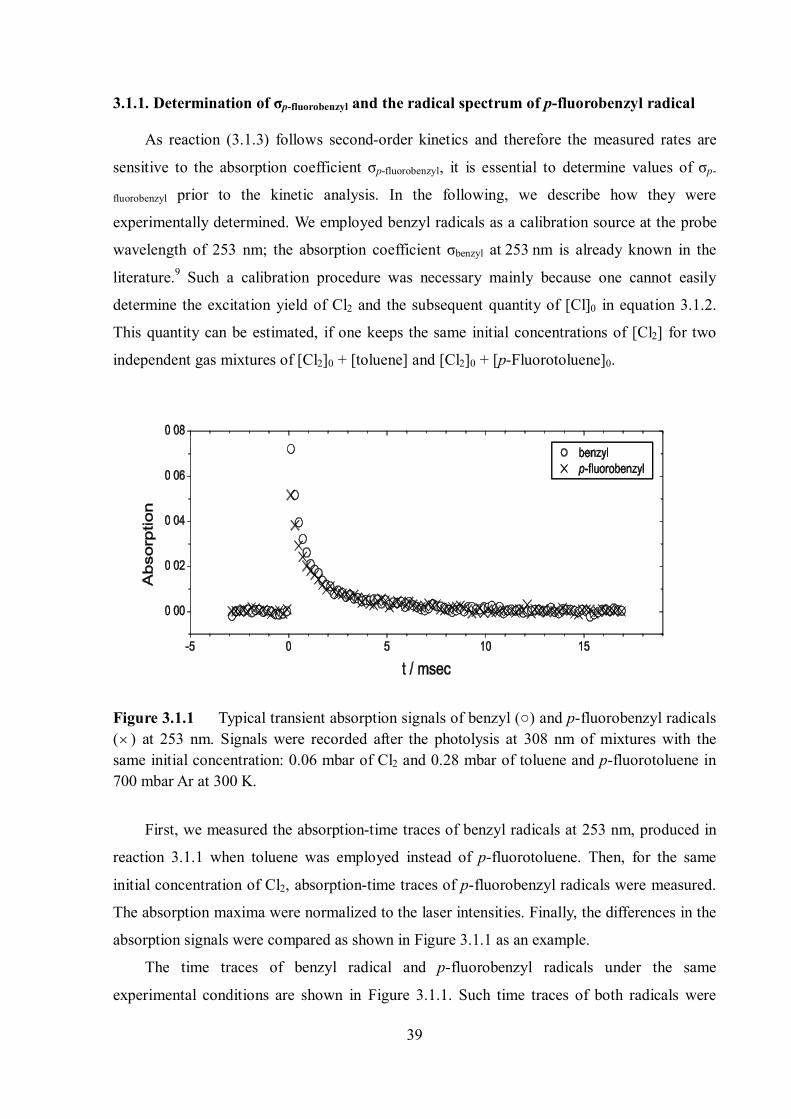
measured at various pressures and Absp-fluorobenzyl / Absbenzyl ratios measured under various
experimental conditions are presented in Figure 3.1.2. As a result, the absorption signals of p-
fluorobenzyl radicals were found to be (65 ± 8) % of those of benzyl radicals.
Figure 3.1.2 The ratio of Absmax(p-fluorobenzyl) to Absmax(benzyl) in the pressure range 150 – 700 mbar in Ar at 300 K. Different symbols indicate the data obtained at different days of experiments.
Since the absorption coefficient of benzyl radicals at 253 nm is known to be σbenzyl (253
nm) = 1.3 10-16 cm2 molecule-1, we could determine σp-fluorobenzyl (253 nm) to be (8.4 ± 1.0)
10-17 cm2 molecule-1 based on the experimental results presented in Figure 3.1.2. The
absorption-time profiles of p-fluorobenzyl radicals were measured at different detection
wavelengths between 237 nm and 262 nm with identical initial concentrations of Cl2 and p-
fluorotoluene. As we kept the same experimental conditions during all measurements, the
difference of maximum absorption at each wavelength is due to the absorption coefficient.
First, we measured the maximum absorption at each wavelength, and these values were
corrected with respect to the laser energy and the lamp intensity. As σp-fluorobenzyl (253 nm, 300
K) was determined to be 8.4 10-17 cm2molecule-1, absorption coefficients of p-
fluorobenzyl radical at other wavelengths were then scaled to the value at 253 nm. The
resulting σp-fluorobenzyl (λ, 300 K) is shown in Figure 3.1.3. and the values are summarized in
Table 3.1.1.
41
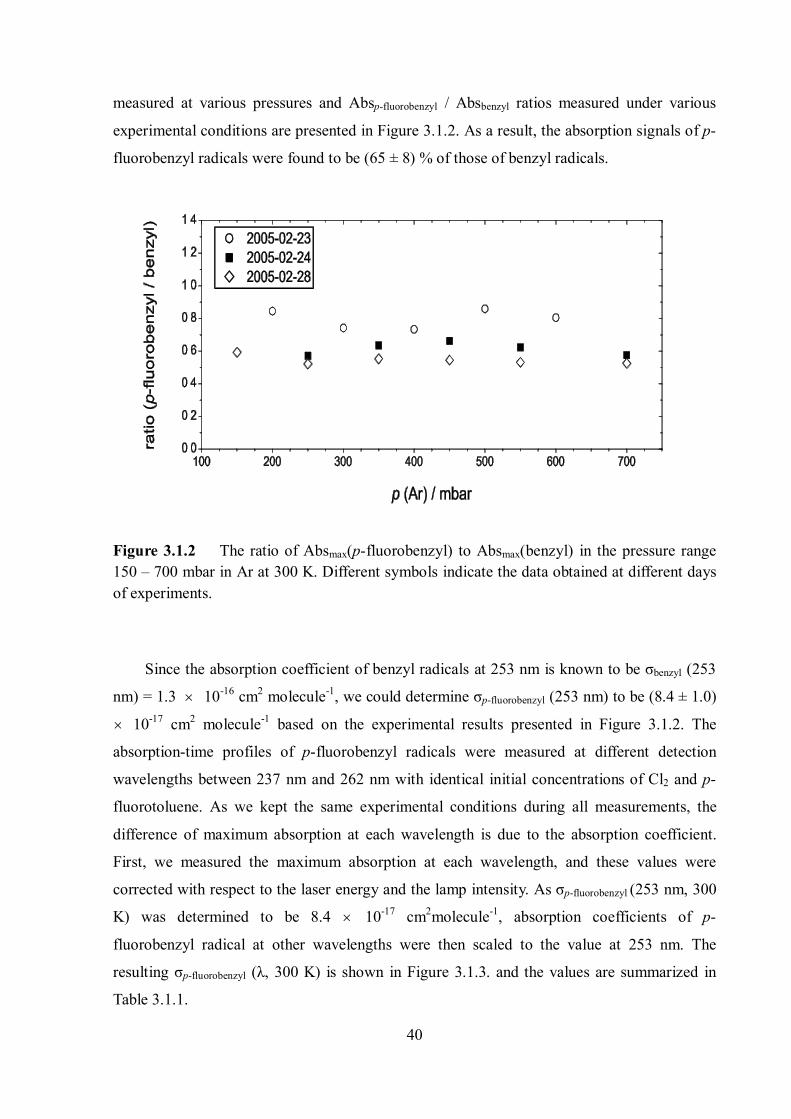
Figure 3.1.3 Transient absorption spectrum of p-fluorobenzyl radicals in 350 mbar Ar at 300 K. The σp-fluorobenzyl values were calibrated with the reference value of the well-known σbenzyl at 253 nm (see text). Error bars indicate the statistical error.
The maximum absorption was located at 256 nm, slightly shifted to the red relative to that of
benzyl radical (253 nm).
Table 3.1.1 Absorption coefficients of p-fluorobenzyl radicals, σp-flurorbenzyl, at 300 K.
λ / nm σp-fluorobenzyla λ / nm σp-fluorobenzyl
a λ / nm σp-fluorobenzyla
237 0.4 ± 2.4 251 6.2 ± 0.9 256 9.6 ± 0.7 240 0.7 ± 2.1 251.5 6.8 ± 0.8 256.5 9.3 ± 0.8 242 1.1 ± 1.6 252 7.0 ± 0.9 257 7.8 ± 0.9 244 2.0 ± 1.2 252.5 8.1 ± 1.0 258 4.6 ± 1.0 246 2.9 ± 1.2 253 8.4 ± 1.0 259 3.0 ± 1.0 247 3.8 ± 1.2 253.5 8.5 ± 1.0 260 1.3 ± 1.0 248 4.4 ± 0.9 254 8.5 ± 0.7 261 0.5 ± 0.7 249 4.7 ± 1.0 254.5 8.9 ± 0.7 262 0.3 ± 0.8 250 5.3 ± 0.9 255 9.3 ± 0.7
250.5 5.3 ± 0.9 255.5 9.8 ± 0.7
a Absorption coefficients, given in 10-17 cm2 molecule-1
42
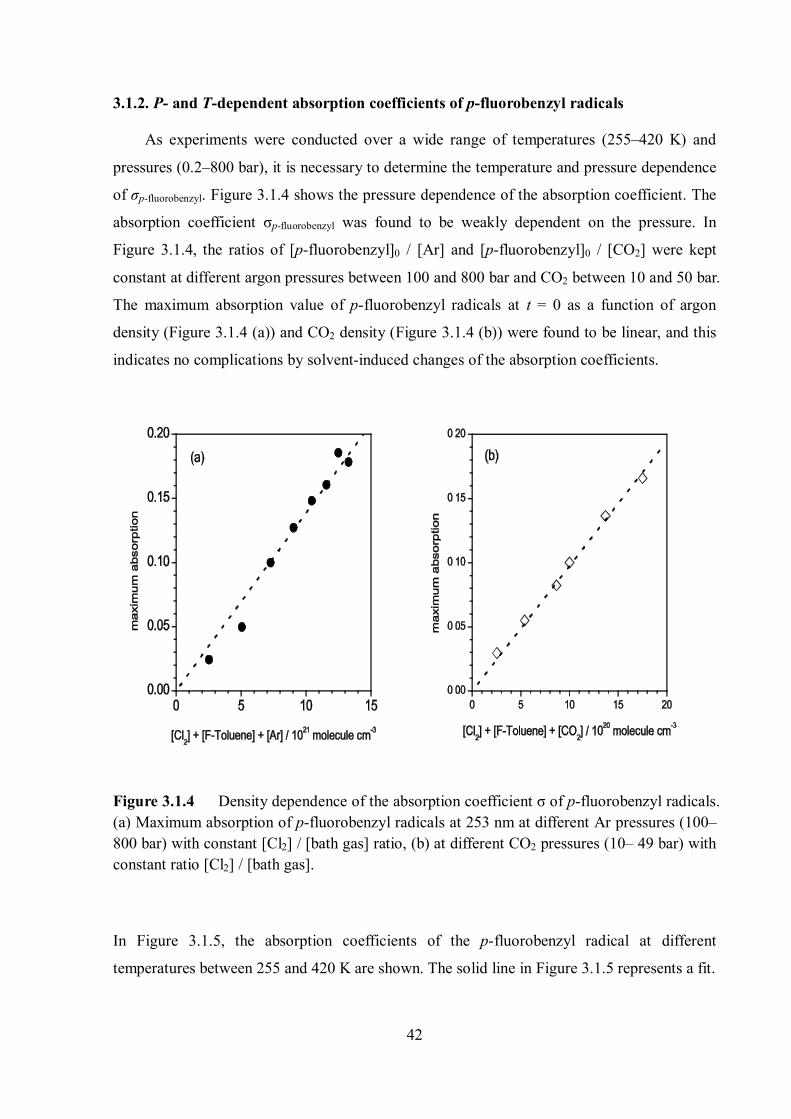
3.1.2. P- and T-dependent absorption coefficients of p-fluorobenzyl radicals
As experiments were conducted over a wide range of temperatures (255–420 K) and
pressures (0.2–800 bar), it is necessary to determine the temperature and pressure dependence
of σp-fluorobenzyl. Figure 3.1.4 shows the pressure dependence of the absorption coefficient. The
absorption coefficient σp-fluorobenzyl was found to be weakly dependent on the pressure. In
Figure 3.1.4, the ratios of [p-fluorobenzyl]0 / [Ar] and [p-fluorobenzyl]0 / [CO2] were kept
constant at different argon pressures between 100 and 800 bar and CO2 between 10 and 50 bar.
The maximum absorption value of p-fluorobenzyl radicals at t = 0 as a function of argon
density (Figure 3.1.4 (a)) and CO2 density (Figure 3.1.4 (b)) were found to be linear, and this
indicates no complications by solvent-induced changes of the absorption coefficients.
Figure 3.1.4 Density dependence of the absorption coefficient σ of p-fluorobenzyl radicals. (a) Maximum absorption of p-fluorobenzyl radicals at 253 nm at different Ar pressures (100– 800 bar) with constant [Cl2] / [bath gas] ratio, (b) at different CO2 pressures (10– 49 bar) with constant ratio [Cl2] / [bath gas].
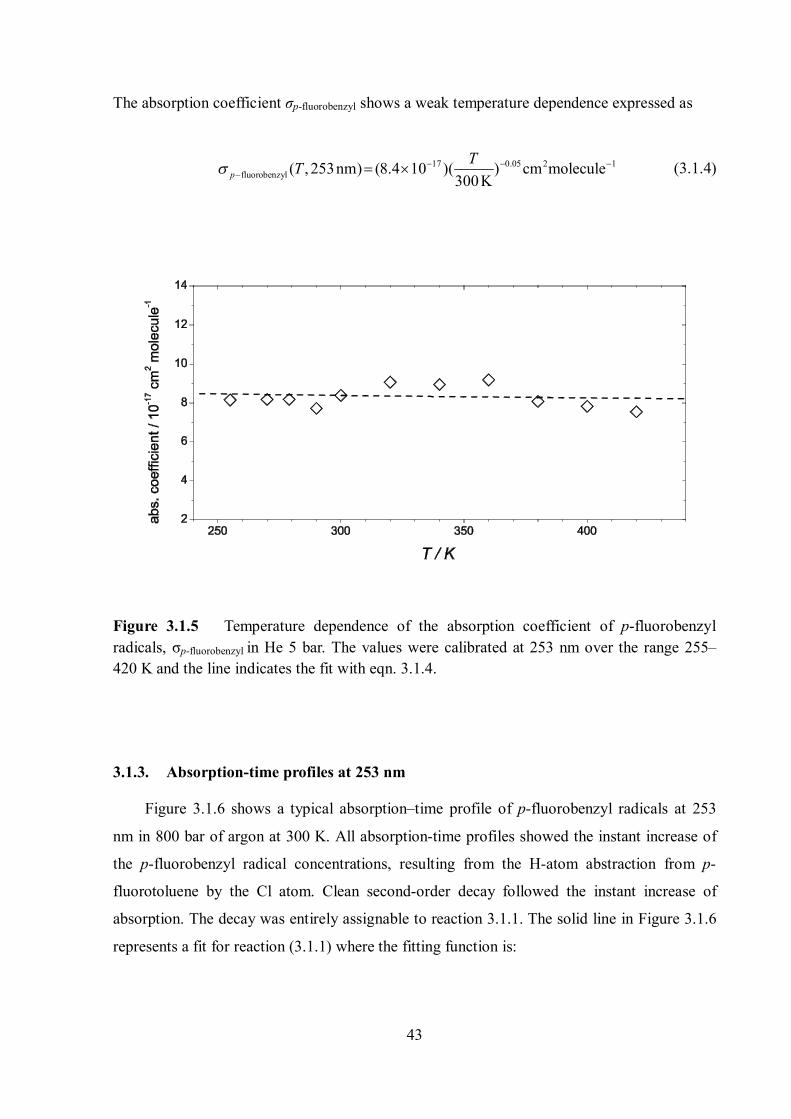
In Figure 3.1.5, the absorption coefficients of the p-fluorobenzyl radical at different
temperatures between 255 and 420 K are shown. The solid line in Figure 3.1.5 represents a fit.
43
The absorption coefficient σp-fluorobenzyl shows a weak temperature dependence expressed as
17 0.05 2 1fluorobenzyl ( , 253nm) (8.4 10 )( ) cm molecule
300KpTT
(3.1.4)
Figure 3.1.5 Temperature dependence of the absorption coefficient of p-fluorobenzyl radicals, σp-fluorobenzyl in He 5 bar. The values were calibrated at 253 nm over the range 255– 420 K and the line indicates the fit with eqn. 3.1.4.
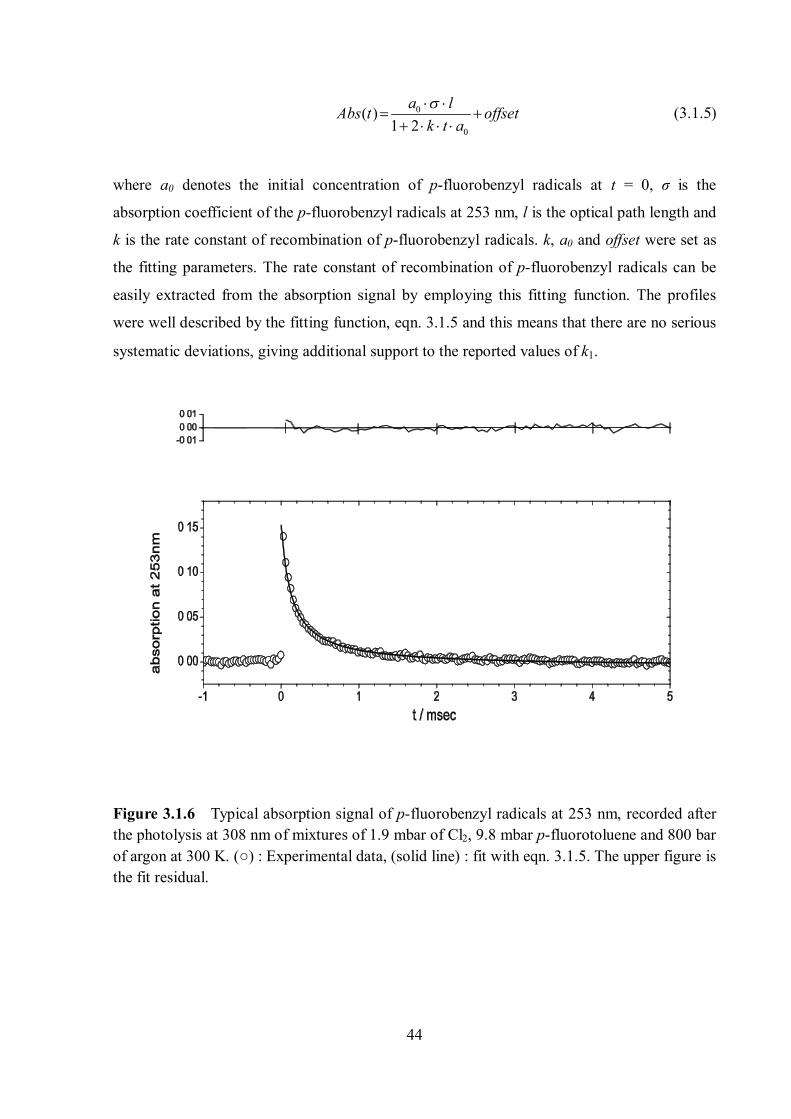
3.1.3. Absorption-time profiles at 253 nm
Figure 3.1.6 shows a typical absorption–time profile of p-fluorobenzyl radicals at 253
nm in 800 bar of argon at 300 K. All absorption-time profiles showed the instant increase of
the p-fluorobenzyl radical concentrations, resulting from the H-atom abstraction from p-
fluorotoluene by the Cl atom. Clean second-order decay followed the instant increase of
absorption. The decay was entirely assignable to reaction 3.1.1. The solid line in Figure 3.1.6
represents a fit for reaction (3.1.1) where the fitting function is:
44
0
0
( )1 2
a lAbs t offsetk t a
(3.1.5)
where a0 denotes the initial concentration of p-fluorobenzyl radicals at t = 0, σ is the
absorption coefficient of the p-fluorobenzyl radicals at 253 nm, l is the optical path length and
k is the rate constant of recombination of p-fluorobenzyl radicals. k, a0 and offset were set as
the fitting parameters. The rate constant of recombination of p-fluorobenzyl radicals can be
easily extracted from the absorption signal by employing this fitting function. The profiles
were well described by the fitting function, eqn. 3.1.5 and this means that there are no serious
systematic deviations, giving additional support to the reported values of k1.
Figure 3.1.6 Typical absorption signal of p-fluorobenzyl radicals at 253 nm, recorded after the photolysis at 308 nm of mixtures of 1.9 mbar of Cl2, 9.8 mbar p-fluorotoluene and 800 bar of argon at 300 K. (○) : Experimental data, (solid line) : fit with eqn. 3.1.5. The upper figure is the fit residual.
45
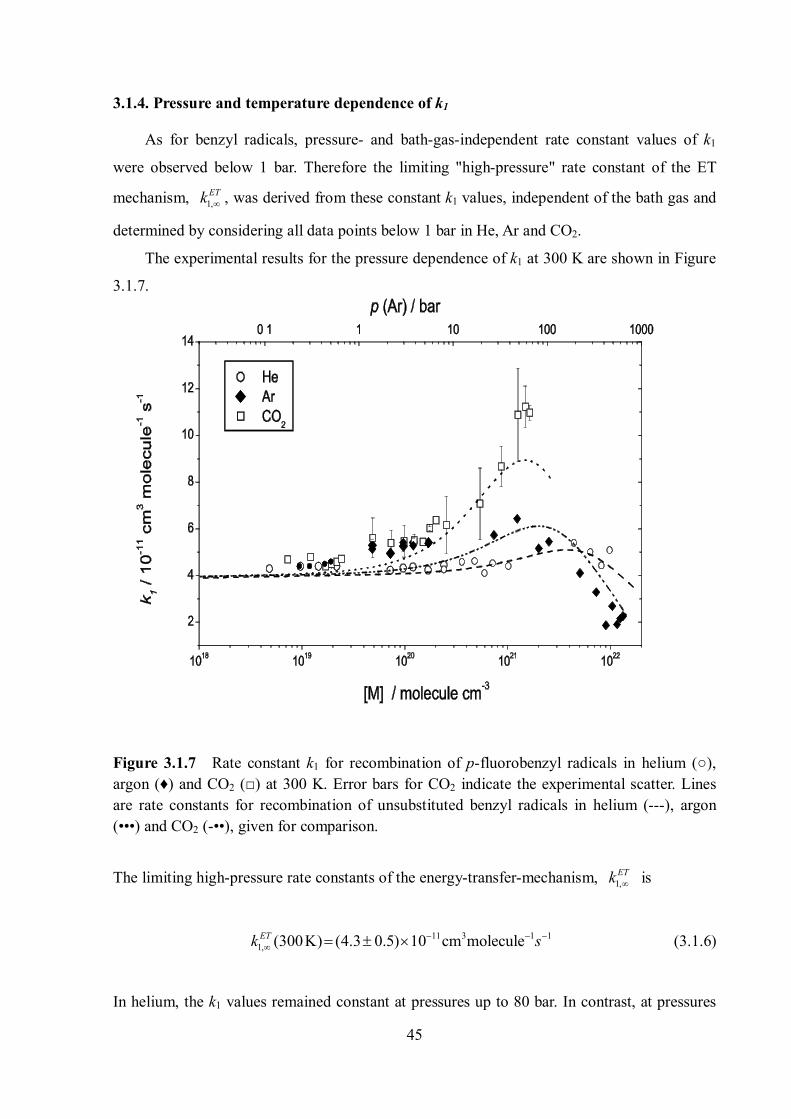
3.1.4. Pressure and temperature dependence of k1
As for benzyl radicals, pressure- and bath-gas-independent rate constant values of k1
were observed below 1 bar. Therefore the limiting "high-pressure" rate constant of the ET
mechanism, 1,ETk , was derived from these constant k1 values, independent of the bath gas and
determined by considering all data points below 1 bar in He, Ar and CO2.
The experimental results for the pressure dependence of k1 at 300 K are shown in Figure
3.1.7.
Figure 3.1.7 Rate constant k1 for recombination of p-fluorobenzyl radicals in helium (○), argon (♦) and CO2 (□) at 300 K. Error bars for CO2 indicate the experimental scatter. Lines are rate constants for recombination of unsubstituted benzyl radicals in helium (---), argon (•••) and CO2 (-••), given for comparison.
The limiting high-pressure rate constants of the energy-transfer-mechanism, 1,ETk is
11 3 1 11, (300K) (4.3 0.5) 10 cm moleculeETk s (3.1.6)
In helium, the k1 values remained constant at pressures up to 80 bar. In contrast, at pressures
46
above 5 bar, clear indications of a further increase of k1 were recognized in the bath gases
argon and CO2 in Figure 3.1.7. The results of the pressure dependence of k1 at 300 K are also
summarized in Table 3.1.2.
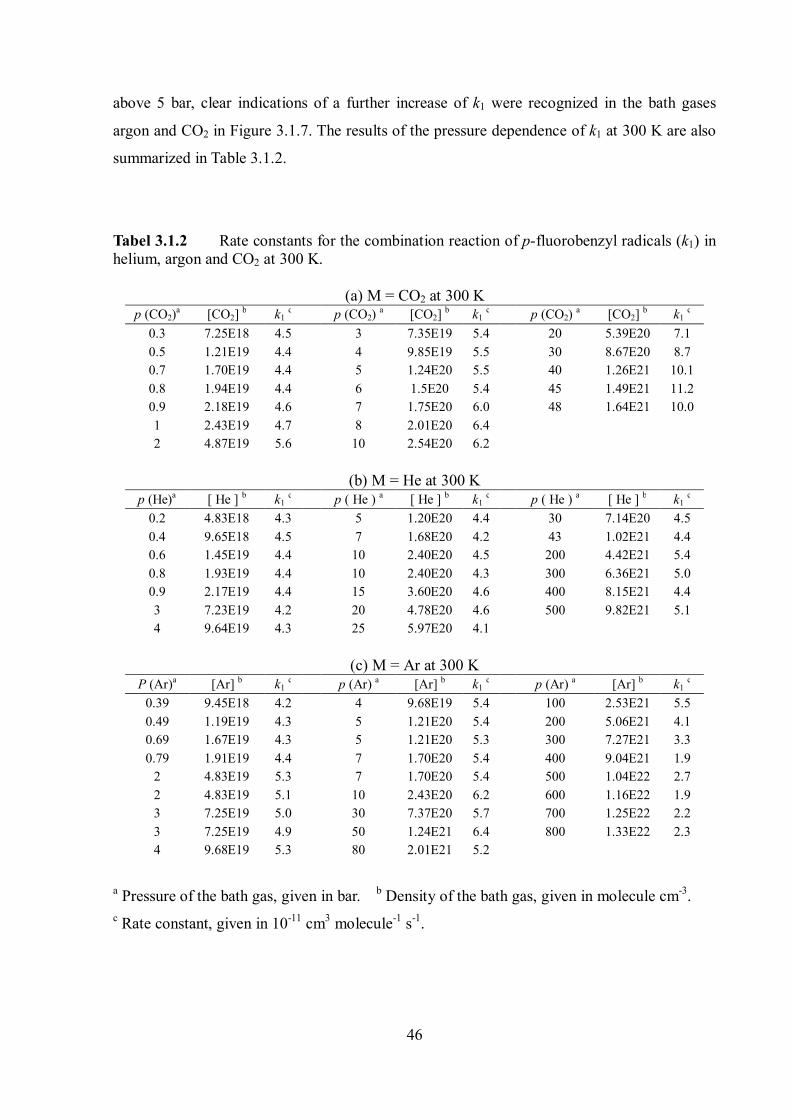
Tabel 3.1.2 Rate constants for the combination reaction of p-fluorobenzyl radicals (k1) in helium, argon and CO2 at 300 K.
(a) M = CO2 at 300 K p (CO2)a [CO2] b k1 c p (CO2) a [CO2] b k1 c p (CO2) a [CO2] b k1 c
0.3 7.25E18 4.5 3 7.35E19 5.4 20 5.39E20 7.1 0.5 1.21E19 4.4 4 9.85E19 5.5 30 8.67E20 8.7 0.7 1.70E19 4.4 5 1.24E20 5.5 40 1.26E21 10.1 0.8 1.94E19 4.4 6 1.5E20 5.4 45 1.49E21 11.2 0.9 2.18E19 4.6 7 1.75E20 6.0 48 1.64E21 10.0 1 2.43E19 4.7 8 2.01E20 6.4 2 4.87E19 5.6 10 2.54E20 6.2
(b) M = He at 300 K p (He)a [ He ] b k1 c p ( He ) a [ He ] b k1 c p ( He ) a [ He ] b k1 c
0.2 4.83E18 4.3 5 1.20E20 4.4 30 7.14E20 4.5 0.4 9.65E18 4.5 7 1.68E20 4.2 43 1.02E21 4.4 0.6 1.45E19 4.4 10 2.40E20 4.5 200 4.42E21 5.4 0.8 1.93E19 4.4 10 2.40E20 4.3 300 6.36E21 5.0 0.9 2.17E19 4.4 15 3.60E20 4.6 400 8.15E21 4.4 3 7.23E19 4.2 20 4.78E20 4.6 500 9.82E21 5.1 4 9.64E19 4.3 25 5.97E20 4.1
(c) M = Ar at 300 K P (Ar)a [Ar] b k1 c p (Ar) a [Ar] b k1 c p (Ar) a [Ar] b k1 c
0.39 9.45E18 4.2 4 9.68E19 5.4 100 2.53E21 5.5 0.49 1.19E19 4.3 5 1.21E20 5.4 200 5.06E21 4.1 0.69 1.67E19 4.3 5 1.21E20 5.3 300 7.27E21 3.3 0.79 1.91E19 4.4 7 1.70E20 5.4 400 9.04E21 1.9
2 4.83E19 5.3 7 1.70E20 5.4 500 1.04E22 2.7 2 4.83E19 5.1 10 2.43E20 6.2 600 1.16E22 1.9 3 7.25E19 5.0 30 7.37E20 5.7 700 1.25E22 2.2 3 7.25E19 4.9 50 1.24E21 6.4 800 1.33E22 2.3 4 9.68E19 5.3 80 2.01E21 5.2
a Pressure of the bath gas, given in bar. b Density of the bath gas, given in molecule cm-3. c Rate constant, given in 10-11 cm3 molecule-1 s-1.
47
The rate constant gradually increases until it levels off at densities where the influence of
diffusion control sets in. The finally observed decrease of the rate constants at high pressures
corresponds to the regime of diffusion-controlled kinetics as expected for these densities. The
pressure-induced enhancement of k1 increases in the order He < Ar < CO2, similarly to recent
studies of combination reactions of CCl3 radicals5 and benzyl radicals.7 For the comparison
with earlier results on the recombination of unsubstituted benzyl radicals, three lines
representing the pressure dependence of benzyl radical recombination in helium, argon, and
CO2 were added in Figure 3.1.7. Except for a slightly earlier onset of the enhancement of the
k1 values with a slightly larger magnitude in the present results, there were large similarities
between the results from p-fluorobenzyl radicals and those from unsubstituted benzyl radicals.
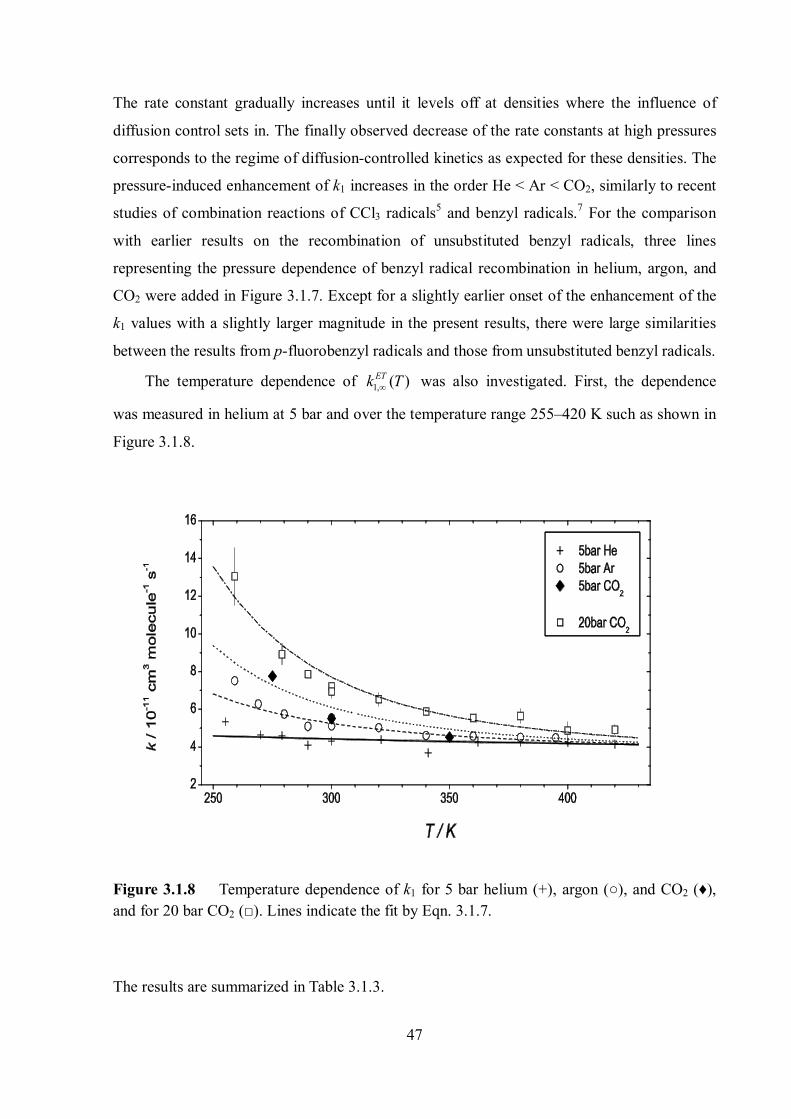
The temperature dependence of 1, ( )ETk T was also investigated. First, the dependence
was measured in helium at 5 bar and over the temperature range 255–420 K such as shown in
Figure 3.1.8.
Figure 3.1.8 Temperature dependence of k1 for 5 bar helium (+), argon (○), and CO2 (♦), and for 20 bar CO2 (□). Lines indicate the fit by Eqn. 3.1.7.
The results are summarized in Table 3.1.3.
48
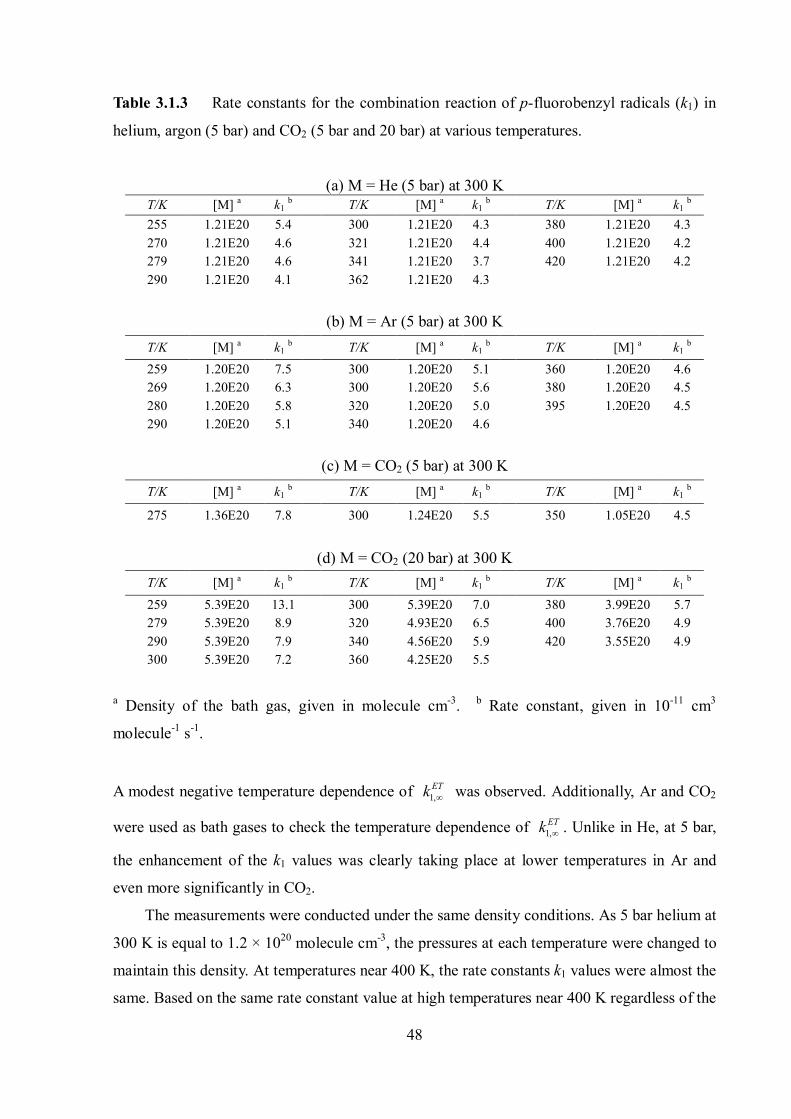
Table 3.1.3 Rate constants for the combination reaction of p-fluorobenzyl radicals (k1) in
helium, argon (5 bar) and CO2 (5 bar and 20 bar) at various temperatures.
(a) M = He (5 bar) at 300 K T/K [M] a k1 b T/K [M] a k1 b T/K [M] a k1 b 255 1.21E20 5.4 300 1.21E20 4.3 380 1.21E20 4.3 270 1.21E20 4.6 321 1.21E20 4.4 400 1.21E20 4.2 279 1.21E20 4.6 341 1.21E20 3.7 420 1.21E20 4.2 290 1.21E20 4.1 362 1.21E20 4.3
(b) M = Ar (5 bar) at 300 K T/K [M] a k1 b T/K [M] a k1 b T/K [M] a k1 b 259 1.20E20 7.5 300 1.20E20 5.1 360 1.20E20 4.6 269 1.20E20 6.3 300 1.20E20 5.6 380 1.20E20 4.5 280 1.20E20 5.8 320 1.20E20 5.0 395 1.20E20 4.5 290 1.20E20 5.1 340 1.20E20 4.6
(c) M = CO2 (5 bar) at 300 K T/K [M] a k1 b T/K [M] a k1 b T/K [M] a k1 b
275 1.36E20 7.8 300 1.24E20 5.5 350 1.05E20 4.5
(d) M = CO2 (20 bar) at 300 K T/K [M] a k1 b T/K [M] a k1 b T/K [M] a k1 b
259 5.39E20 13.1 300 5.39E20 7.0 380 3.99E20 5.7 279 5.39E20 8.9 320 4.93E20 6.5 400 3.76E20 4.9 290 5.39E20 7.9 340 4.56E20 5.9 420 3.55E20 4.9 300 5.39E20 7.2 360 4.25E20 5.5
a Density of the bath gas, given in molecule cm-3. b Rate constant, given in 10-11 cm3
molecule-1 s-1.
A modest negative temperature dependence of 1,ETk was observed. Additionally, Ar and CO2
were used as bath gases to check the temperature dependence of 1,ETk . Unlike in He, at 5 bar,
the enhancement of the k1 values was clearly taking place at lower temperatures in Ar and
even more significantly in CO2.
The measurements were conducted under the same density conditions. As 5 bar helium at
300 K is equal to 1.2 × 10²⁰ molecule cm-3, the pressures at each temperature were changed to
maintain this density. At temperatures near 400 K, the rate constants k1 values were almost the
same. Based on the same rate constant value at high temperatures near 400 K regardless of the
49
bath gas employed, the temperature dependence of 1,ETk could be safely determined from the
results in He (5 bar). The resulting temperature dependence of 1,ETk over the temperature
range 255–420 K can be expressed as
11 0.2 3 1 11, (4.3 0.5) 10 ( ) cm molecule s
300KET Tk (3.1.7)
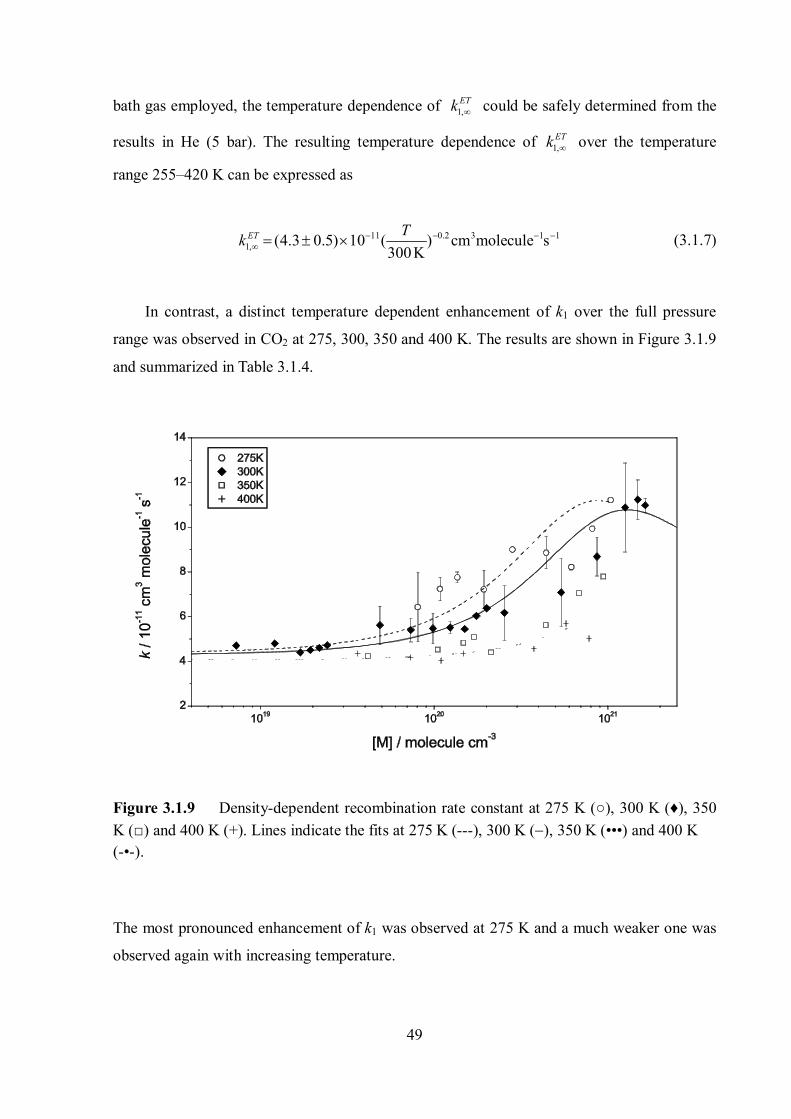
In contrast, a distinct temperature dependent enhancement of k1 over the full pressure
range was observed in CO2 at 275, 300, 350 and 400 K. The results are shown in Figure 3.1.9
and summarized in Table 3.1.4.
Figure 3.1.9 Density-dependent recombination rate constant at 275 K (○), 300 K (♦), 350 K (□) and 400 K (+). Lines indicate the fits at 275 K (---), 300 K (), 350 K (•••) and 400 K (-•-).
The most pronounced enhancement of k1 was observed at 275 K and a much weaker one was
observed again with increasing temperature.
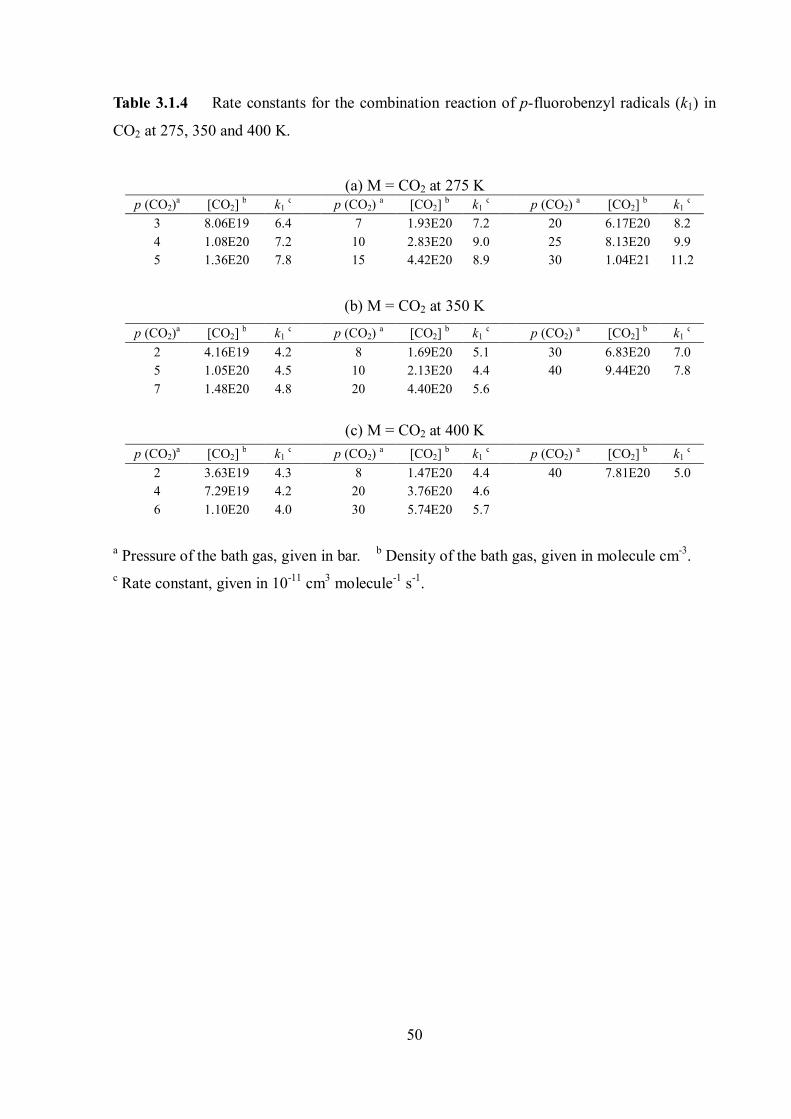
50
Table 3.1.4 Rate constants for the combination reaction of p-fluorobenzyl radicals (k1) in
CO2 at 275, 350 and 400 K.
(a) M = CO2 at 275 K p (CO2)a [CO2] b k1 c p (CO2) a [CO2] b k1 c p (CO2) a [CO2] b k1 c
3 8.06E19 6.4 7 1.93E20 7.2 20 6.17E20 8.2 4 1.08E20 7.2 10 2.83E20 9.0 25 8.13E20 9.9 5 1.36E20 7.8 15 4.42E20 8.9 30 1.04E21 11.2
(b) M = CO2 at 350 K
p (CO2)a [CO2] b k1 c p (CO2) a [CO2] b k1 c p (CO2) a [CO2] b k1 c 2 4.16E19 4.2 8 1.69E20 5.1 30 6.83E20 7.0 5 1.05E20 4.5 10 2.13E20 4.4 40 9.44E20 7.8 7 1.48E20 4.8 20 4.40E20 5.6
(c) M = CO2 at 400 K p (CO2)a [CO2] b k1 c p (CO2) a [CO2] b k1 c p (CO2) a [CO2] b k1 c
2 3.63E19 4.3 8 1.47E20 4.4 40 7.81E20 5.0 4 7.29E19 4.2 20 3.76E20 4.6 6 1.10E20 4.0 30 5.74E20 5.7
a Pressure of the bath gas, given in bar. b Density of the bath gas, given in molecule cm-3. c Rate constant, given in 10-11 cm3 molecule-1 s-1.
51
3.2 Recombination reaction of p-methylbenzyl radicals
p-Methylbenzyl radical was selected to determine if there is also an enhancement of
recombination rate constants k1 at high pressures in slightly larger alkyl-substituted systems.
p-CH3C6H4CH2 + p-CH3C6H4CH2 → C16H18 k1 (3.2.1)
The rate constants of the combination reaction, k1, have been measured over the pressure
range 2–200 bar and the temperature range 300–515 K. Helium, argon, and CO2 were used as
the bath gas (M). p-Methylbenzyl radicals have been widely used in reactions to study para-
substituent effects on the reaction of benzyl radical: Tokumura et al. investigated the
oxygenation reaction rates of benzyl and p-methylbenzyl radical in solution by using the UV
absorption technique.36 However, no direct measurement of reaction (3.2.1) in the gas phase
has been conducted so far. There are numerous spectroscopic studies of p-methylbenzyl
radical in the UV and visible range. The doublet-doublet fluorescence of benzyl radicals, p-
methylbenzyl, and p-chlorobenzyl radicals in solution were detected and the substituent effect
was studied.37 The absorption band of p-methylbenzyl radicals in the UV region was
measured and the spectral features of p-xylene, and the p-methylbenzyl radical were not quite
different from those of toluene and benzyl radicals.51-54 However, as these measurements were
done at high temperatures of over 1000 K, no direct study of the absorption band of p-
methylbenzyl radicals in the UV region at room temperature is available.
We present the first direct measurement of the recombination reaction of p-methylbenzyl
radicals in the gas-phase at room temperature. In the following section, the experimental
method is briefly described and the experimental results of recombination rate constants for p-
methylbenzyl radicals are presented. Also the transient UV absorption spectrum of p-
methylbenzyl radicals and their absorption coefficient (σp-methylbenzyl) at room temperature were
determined.
In the present work, the recombination rate constants of p-methylbenzyl radicals have
been investigated by directly monitoring the absorption signal of the p-methylbenzyl radical.
Cl2 + hν → 2 Cl (3.2.2)
Cl + p-CH3C6H4CH3 → p-CH3C6H4CH2 + HCl (3.2.3)
52
p-Methylbenzyl radicals were generated via reactions (3.2.2) and (3.2.3) following excimer
laser flash photolysis similarly to the case of p-fluorobenzyl radicals. p-Xylene was used as a
precursor for p-methylbenzyl radical. The reagent grade p-xylene was obtained from Aldrich,
and was purified in a pump-thaw-freezing cycle prior to use. Reaction (3.2.3) is known to
solely proceed through a fast H-atom abstraction channel. The reported rate constant for
reaction 3.2.3 is 13.310-11cm3molecule-1s-1, 55 or 15 ± 0.110-11cm3molecule-1 s-1,56 which is
about twice as large as k(Cl + toluene) = 610-11 cm3 molecule-1 s-1.27
Initial mixtures ranging from [Cl]0 = (0.8 – 3.6)1014 molecule cm-3 and [p-xylene] =
(0.5 – 1.3) 1017 molecule cm-3 were prepared with the target bath gas. The experiments
were carried out in a temperature-controlled heatable high-pressure optical cell. Based on the
benzyl and p-fluorobenzyl radical experiments, the rate constants below 1 bar were not
measured on assumption that the rate constants below 1 bar are constant and similar to that of
2 bar. Since only the heatable high-pressure cell was used, the temperature dependence of the
enhancement of the rate constant was investigated in the high temperature range above 400 K
instead of low temperatures. The absorption coefficients of the p-methylbenzyl radical at the
desired wavelength and temperature were not known. To determine σp-methylbenzyl, two mixtures
with the same initial concentration of Cl2 and precursors (toluene and p-xylene) were prepared
separately, and the absorption-time profiles were measured under the same conditions. Finally,
comparing the differences in the absorption signals, the absorption coefficient of p-
methylbenzyl radical, based on that of benzyl radical, could be calibrated.
3.2.1 Transient absorption spectrum of p-methylbenzyl radical
The spectral features of the p-methylbenzyl radical were similar to those of benzyl
radicals, but the wavelength, where the maximum absorption λmax of p-methylbenzyl radicals
was observed at 300 K, was shifted by about 10 nm to longer wavelength, compared to benzyl
radical.1,7
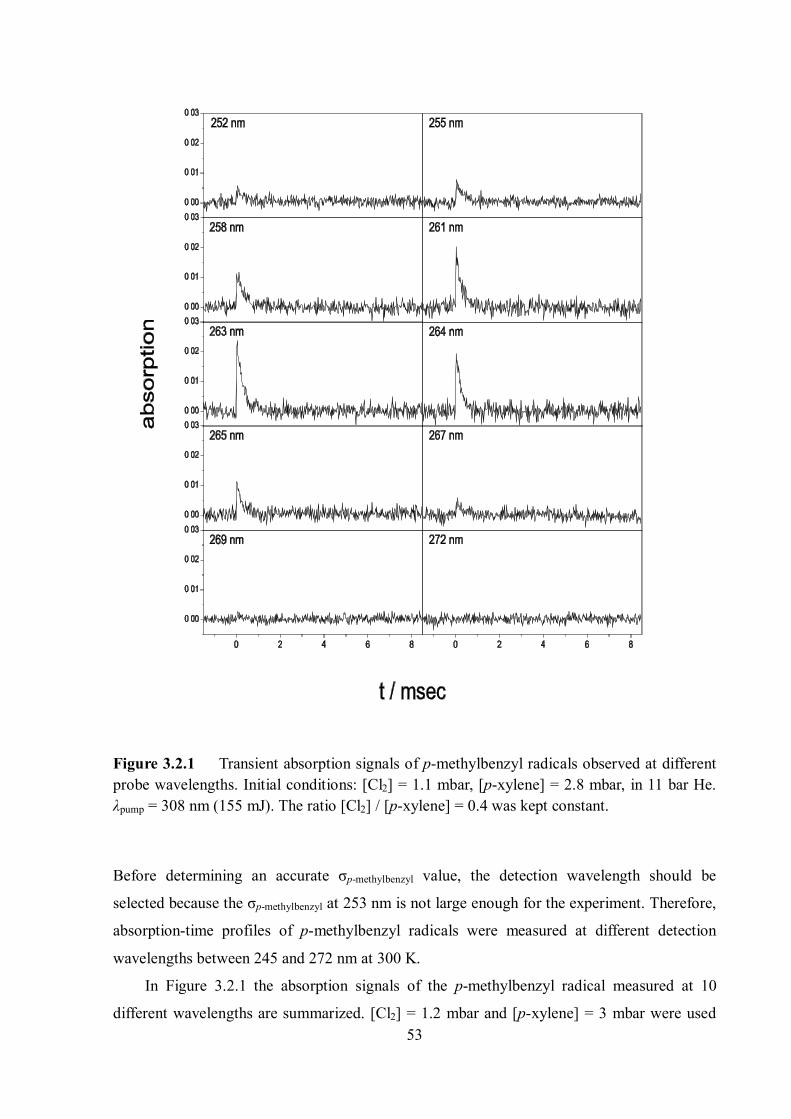
53
Figure 3.2.1 Transient absorption signals of p-methylbenzyl radicals observed at different probe wavelengths. Initial conditions: [Cl2] = 1.1 mbar, [p-xylene] = 2.8 mbar, in 11 bar He. λpump = 308 nm (155 mJ). The ratio [Cl2] / [p-xylene] = 0.4 was kept constant.
Before determining an accurate σp-methylbenzyl value, the detection wavelength should be
selected because the σp-methylbenzyl at 253 nm is not large enough for the experiment. Therefore,
absorption-time profiles of p-methylbenzyl radicals were measured at different detection
wavelengths between 245 and 272 nm at 300 K.
In Figure 3.2.1 the absorption signals of the p-methylbenzyl radical measured at 10
different wavelengths are summarized. [Cl2] = 1.2 mbar and [p-xylene] = 3 mbar were used
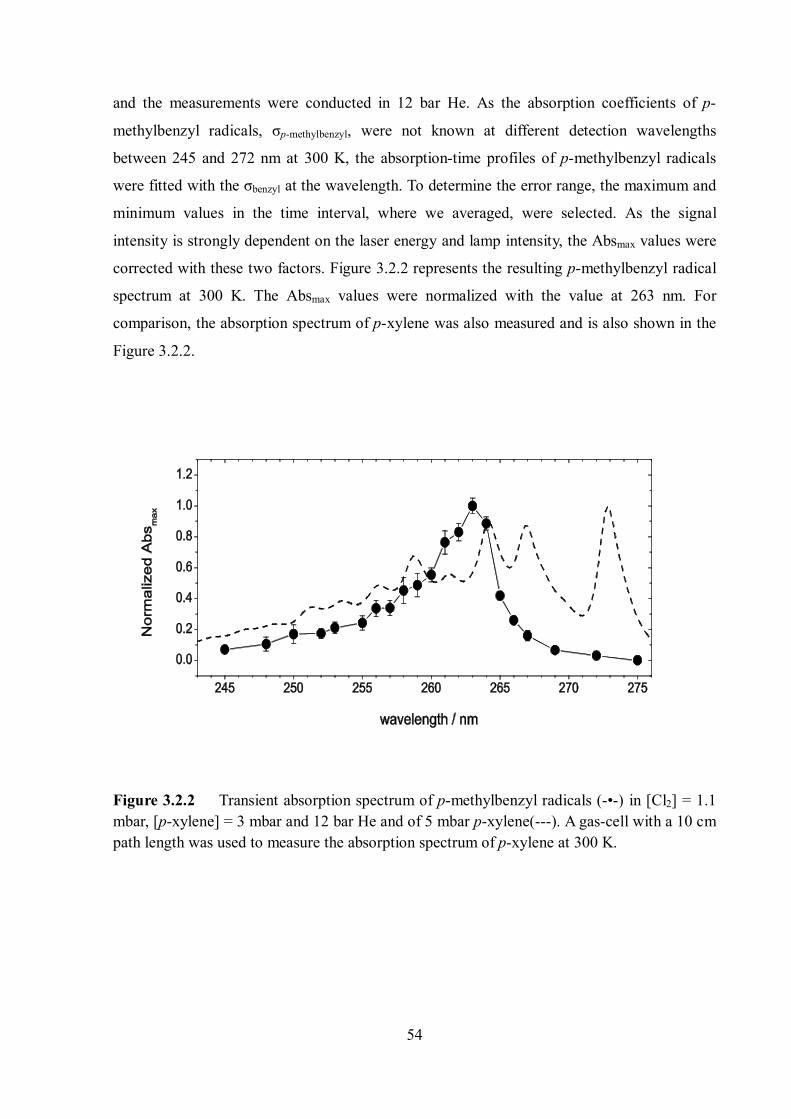
54
and the measurements were conducted in 12 bar He. As the absorption coefficients of p-
methylbenzyl radicals, σp-methylbenzyl, were not known at different detection wavelengths
between 245 and 272 nm at 300 K, the absorption-time profiles of p-methylbenzyl radicals
were fitted with the σbenzyl at the wavelength. To determine the error range, the maximum and
minimum values in the time interval, where we averaged, were selected. As the signal
intensity is strongly dependent on the laser energy and lamp intensity, the Absmax values were
corrected with these two factors. Figure 3.2.2 represents the resulting p-methylbenzyl radical
spectrum at 300 K. The Absmax values were normalized with the value at 263 nm. For
comparison, the absorption spectrum of p-xylene was also measured and is also shown in the
Figure 3.2.2.
Figure 3.2.2 Transient absorption spectrum of p-methylbenzyl radicals (-•-) in [Cl2] = 1.1 mbar, [p-xylene] = 3 mbar and 12 bar He and of 5 mbar p-xylene(---). A gas-cell with a 10 cm path length was used to measure the absorption spectrum of p-xylene at 300 K.
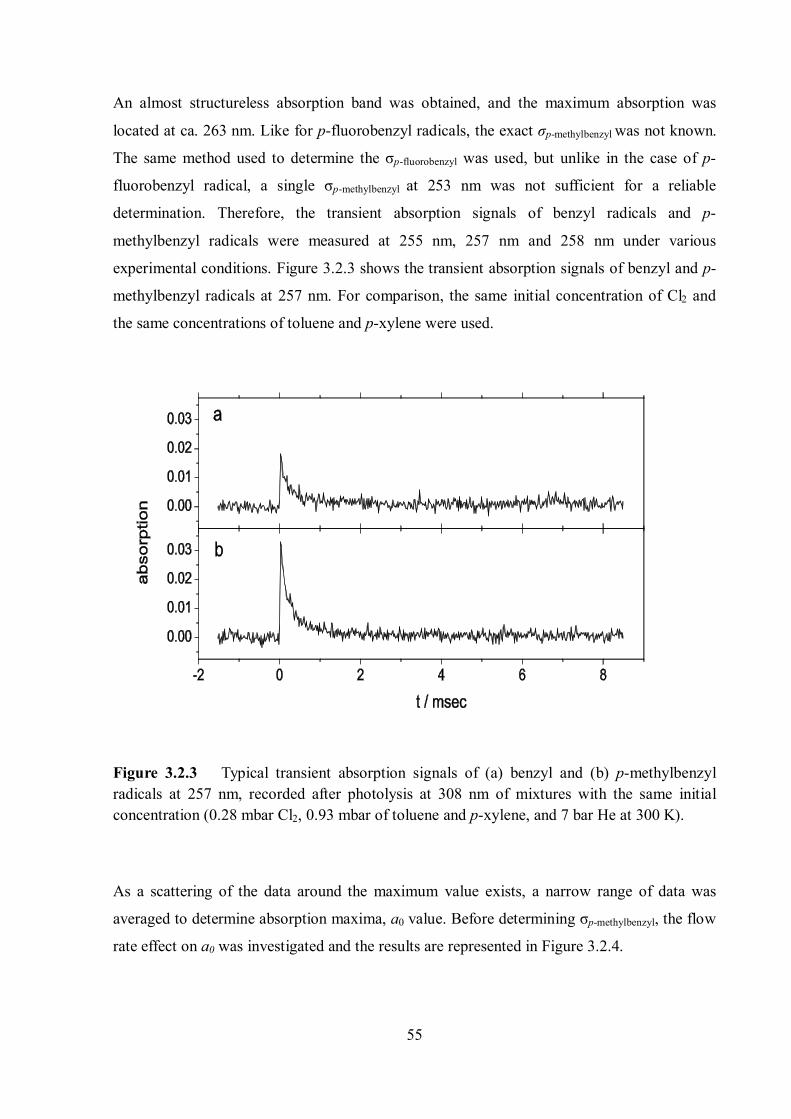
55
An almost structureless absorption band was obtained, and the maximum absorption was
located at ca. 263 nm. Like for p-fluorobenzyl radicals, the exact σp-methylbenzyl was not known.
The same method used to determine the σp-fluorobenzyl was used, but unlike in the case of p-
fluorobenzyl radical, a single σp-methylbenzyl at 253 nm was not sufficient for a reliable
determination. Therefore, the transient absorption signals of benzyl radicals and p-
methylbenzyl radicals were measured at 255 nm, 257 nm and 258 nm under various
experimental conditions. Figure 3.2.3 shows the transient absorption signals of benzyl and p-
methylbenzyl radicals at 257 nm. For comparison, the same initial concentration of Cl2 and
the same concentrations of toluene and p-xylene were used.
Figure 3.2.3 Typical transient absorption signals of (a) benzyl and (b) p-methylbenzyl radicals at 257 nm, recorded after photolysis at 308 nm of mixtures with the same initial concentration (0.28 mbar Cl2, 0.93 mbar of toluene and p-xylene, and 7 bar He at 300 K).
As a scattering of the data around the maximum value exists, a narrow range of data was
averaged to determine absorption maxima, a0 value. Before determining σp-methylbenzyl, the flow
rate effect on a0 was investigated and the results are represented in Figure 3.2.4.
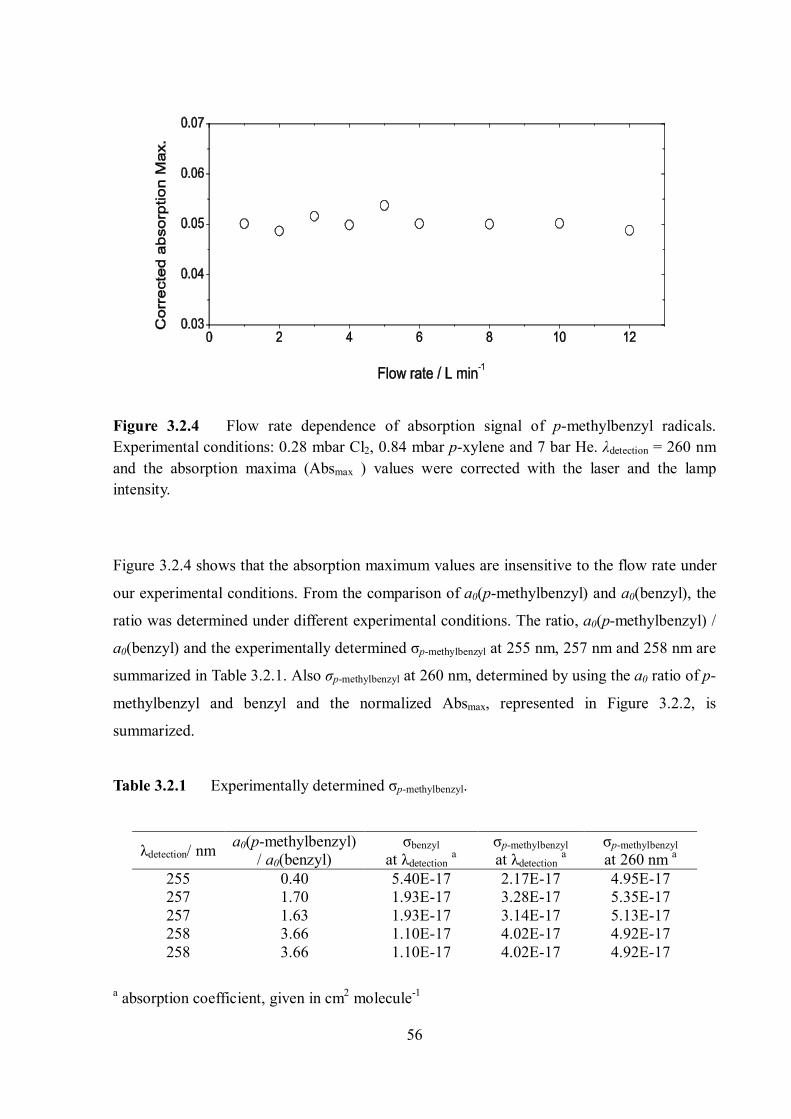
56
Figure 3.2.4 Flow rate dependence of absorption signal of p-methylbenzyl radicals. Experimental conditions: 0.28 mbar Cl2, 0.84 mbar p-xylene and 7 bar He. λdetection = 260 nm and the absorption maxima (Absmax ) values were corrected with the laser and the lamp intensity.
Figure 3.2.4 shows that the absorption maximum values are insensitive to the flow rate under
our experimental conditions. From the comparison of a0(p-methylbenzyl) and a0(benzyl), the
ratio was determined under different experimental conditions. The ratio, a0(p-methylbenzyl) /
a0(benzyl) and the experimentally determined σp-methylbenzyl at 255 nm, 257 nm and 258 nm are
summarized in Table 3.2.1. Also σp-methylbenzyl at 260 nm, determined by using the a0 ratio of p-
methylbenzyl and benzyl and the normalized Absmax, represented in Figure 3.2.2, is
summarized.
Table 3.2.1 Experimentally determined σp-methylbenzyl.
λdetection/ nm a0(p-methylbenzyl) / a0(benzyl)
σbenzyl at λdetection a
σp-methylbenzyl at λdetection a
σp-methylbenzyl at 260 nm a
255 0.40 5.40E-17 2.17E-17 4.95E-17 257 1.70 1.93E-17 3.28E-17 5.35E-17 257 1.63 1.93E-17 3.14E-17 5.13E-17 258 3.66 1.10E-17 4.02E-17 4.92E-17 258 3.66 1.10E-17 4.02E-17 4.92E-17
a absorption coefficient, given in cm2 molecule-1
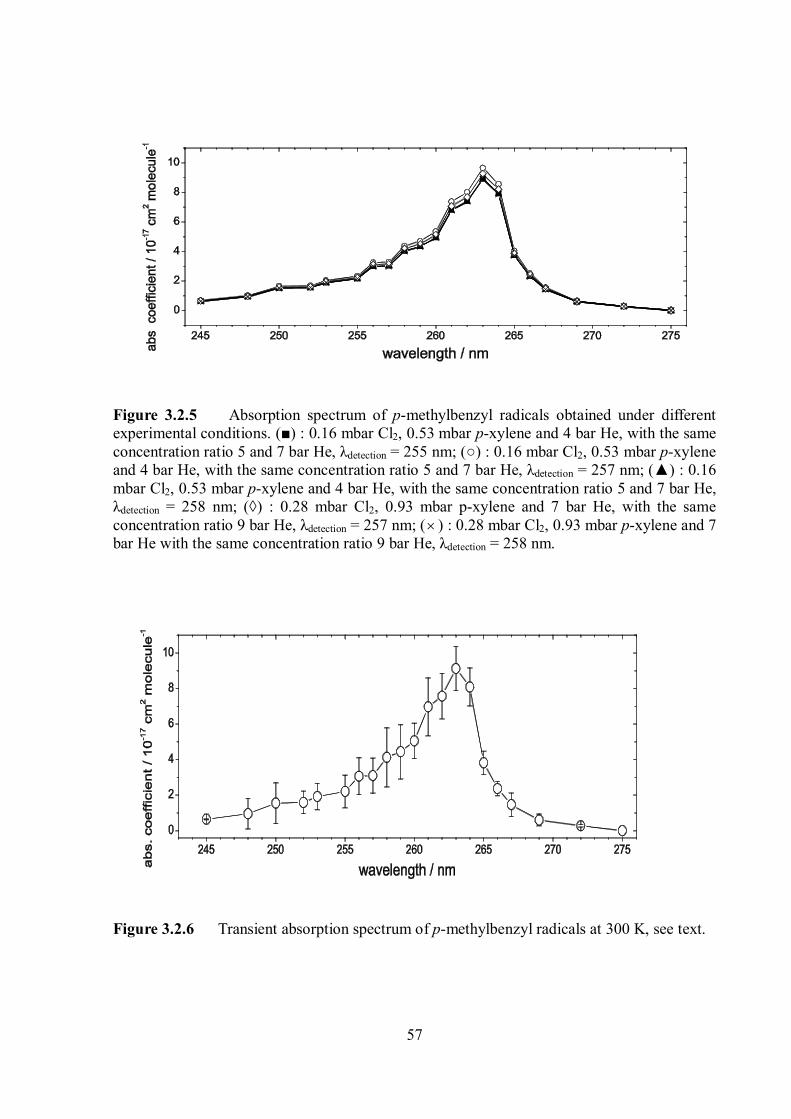
57
Figure 3.2.5 Absorption spectrum of p-methylbenzyl radicals obtained under different experimental conditions. (■) : 0.16 mbar Cl2, 0.53 mbar p-xylene and 4 bar He, with the same concentration ratio 5 and 7 bar He, λdetection = 255 nm; (○) : 0.16 mbar Cl2, 0.53 mbar p-xylene and 4 bar He, with the same concentration ratio 5 and 7 bar He, λdetection = 257 nm; (▲) : 0.16 mbar Cl2, 0.53 mbar p-xylene and 4 bar He, with the same concentration ratio 5 and 7 bar He, λdetection = 258 nm; (◊) : 0.28 mbar Cl2, 0.93 mbar p-xylene and 7 bar He, with the same concentration ratio 9 bar He, λdetection = 257 nm; ( ) : 0.28 mbar Cl2, 0.93 mbar p-xylene and 7 bar He with the same concentration ratio 9 bar He, λdetection = 258 nm. Figure 3.2.6 Transient absorption spectrum of p-methylbenzyl radicals at 300 K, see text.
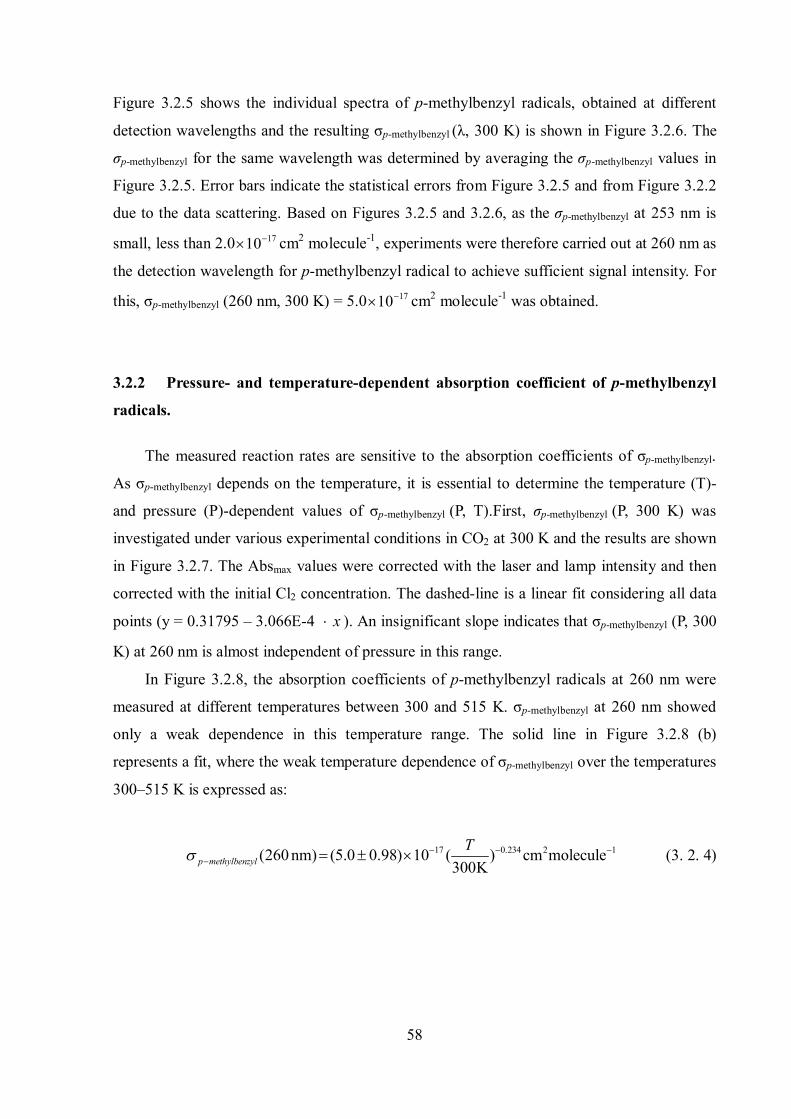
58
Figure 3.2.5 shows the individual spectra of p-methylbenzyl radicals, obtained at different
detection wavelengths and the resulting σp-methylbenzyl (λ, 300 K) is shown in Figure 3.2.6. The
σp-methylbenzyl for the same wavelength was determined by averaging the σp-methylbenzyl values in
Figure 3.2.5. Error bars indicate the statistical errors from Figure 3.2.5 and from Figure 3.2.2
due to the data scattering. Based on Figures 3.2.5 and 3.2.6, as the σp-methylbenzyl at 253 nm is
small, less than 2.0 1710 cm2 molecule-1, experiments were therefore carried out at 260 nm as
the detection wavelength for p-methylbenzyl radical to achieve sufficient signal intensity. For
this, σp-methylbenzyl (260 nm, 300 K) = 5.0 1710 cm2 molecule-1 was obtained.
3.2.2 Pressure- and temperature-dependent absorption coefficient of p-methylbenzyl
radicals.
The measured reaction rates are sensitive to the absorption coefficients of σp-methylbenzyl.
As σp-methylbenzyl depends on the temperature, it is essential to determine the temperature (T)-
and pressure (P)-dependent values of σp-methylbenzyl (P, T).First, σp-methylbenzyl (P, 300 K) was
investigated under various experimental conditions in CO2 at 300 K and the results are shown
in Figure 3.2.7. The Absmax values were corrected with the laser and lamp intensity and then
corrected with the initial Cl2 concentration. The dashed-line is a linear fit considering all data
points (y = 0.31795 – 3.066E-4 x ). An insignificant slope indicates that σp-methylbenzyl (P, 300
K) at 260 nm is almost independent of pressure in this range.
In Figure 3.2.8, the absorption coefficients of p-methylbenzyl radicals at 260 nm were
measured at different temperatures between 300 and 515 K. σp-methylbenzyl at 260 nm showed
only a weak dependence in this temperature range. The solid line in Figure 3.2.8 (b)
represents a fit, where the weak temperature dependence of σp-methylbenzyl over the temperatures
300–515 K is expressed as:
17 0.234 2 1(260 nm) (5.0 0.98) 10 ( ) cm molecule300Kp methylbenzyl
T
(3. 2. 4)
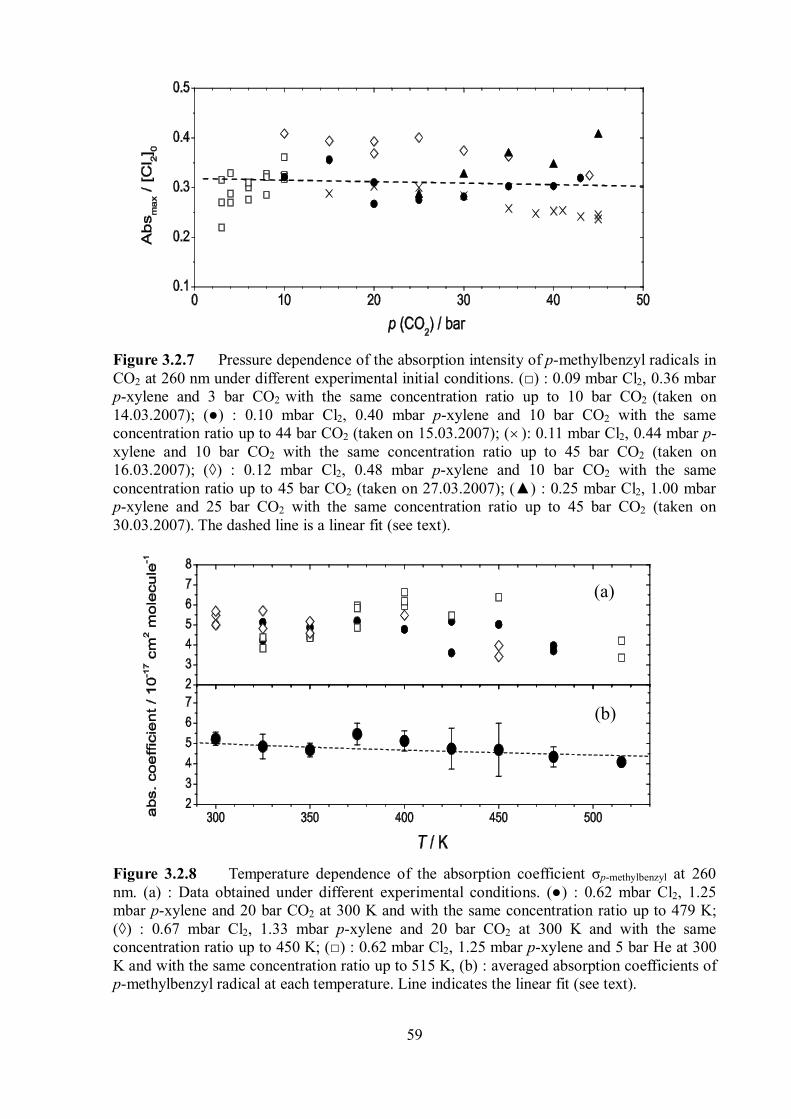
59
Figure 3.2.7 Pressure dependence of the absorption intensity of p-methylbenzyl radicals in CO2 at 260 nm under different experimental initial conditions. (□) : 0.09 mbar Cl2, 0.36 mbar p-xylene and 3 bar CO2 with the same concentration ratio up to 10 bar CO2 (taken on 14.03.2007); (●) : 0.10 mbar Cl2, 0.40 mbar p-xylene and 10 bar CO2 with the same concentration ratio up to 44 bar CO2 (taken on 15.03.2007); ( ): 0.11 mbar Cl2, 0.44 mbar p-xylene and 10 bar CO2 with the same concentration ratio up to 45 bar CO2 (taken on 16.03.2007); (◊) : 0.12 mbar Cl2, 0.48 mbar p-xylene and 10 bar CO2 with the same concentration ratio up to 45 bar CO2 (taken on 27.03.2007); (▲) : 0.25 mbar Cl2, 1.00 mbar p-xylene and 25 bar CO2 with the same concentration ratio up to 45 bar CO2 (taken on 30.03.2007). The dashed line is a linear fit (see text).
Figure 3.2.8 Temperature dependence of the absorption coefficient σp-methylbenzyl at 260 nm. (a) : Data obtained under different experimental conditions. (●) : 0.62 mbar Cl2, 1.25 mbar p-xylene and 20 bar CO2 at 300 K and with the same concentration ratio up to 479 K; (◊) : 0.67 mbar Cl2, 1.33 mbar p-xylene and 20 bar CO2 at 300 K and with the same concentration ratio up to 450 K; (□) : 0.62 mbar Cl2, 1.25 mbar p-xylene and 5 bar He at 300 K and with the same concentration ratio up to 515 K, (b) : averaged absorption coefficients of p-methylbenzyl radical at each temperature. Line indicates the linear fit (see text).
(a)
(b)
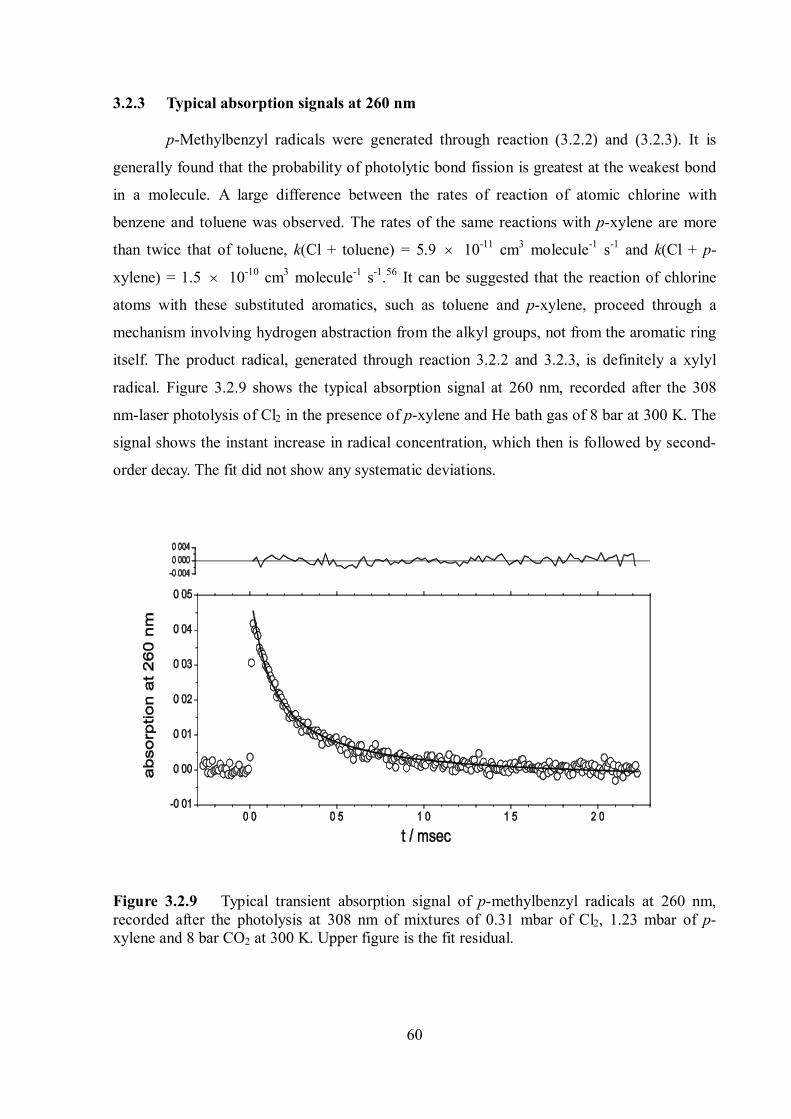
60
3.2.3 Typical absorption signals at 260 nm
p-Methylbenzyl radicals were generated through reaction (3.2.2) and (3.2.3). It is
generally found that the probability of photolytic bond fission is greatest at the weakest bond
in a molecule. A large difference between the rates of reaction of atomic chlorine with
benzene and toluene was observed. The rates of the same reactions with p-xylene are more
than twice that of toluene, k(Cl + toluene) = 5.9 10-11 cm3 molecule-1 s-1 and k(Cl + p-
xylene) = 1.5 10-10 cm3 molecule-1 s-1.56 It can be suggested that the reaction of chlorine
atoms with these substituted aromatics, such as toluene and p-xylene, proceed through a
mechanism involving hydrogen abstraction from the alkyl groups, not from the aromatic ring
itself. The product radical, generated through reaction 3.2.2 and 3.2.3, is definitely a xylyl
radical. Figure 3.2.9 shows the typical absorption signal at 260 nm, recorded after the 308
nm-laser photolysis of Cl2 in the presence of p-xylene and He bath gas of 8 bar at 300 K. The
signal shows the instant increase in radical concentration, which then is followed by second-
order decay. The fit did not show any systematic deviations.
Figure 3.2.9 Typical transient absorption signal of p-methylbenzyl radicals at 260 nm, recorded after the photolysis at 308 nm of mixtures of 0.31 mbar of Cl2, 1.23 mbar of p-xylene and 8 bar CO2 at 300 K. Upper figure is the fit residual.
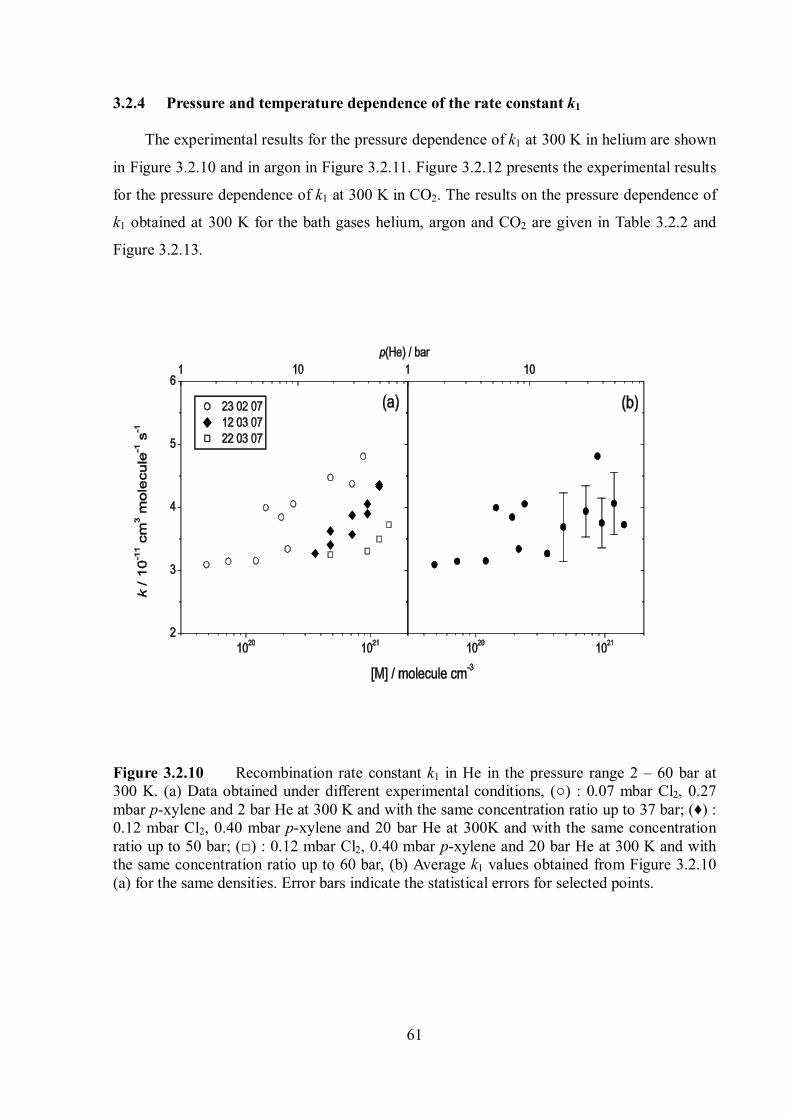
61
3.2.4 Pressure and temperature dependence of the rate constant k1
The experimental results for the pressure dependence of k1 at 300 K in helium are shown
in Figure 3.2.10 and in argon in Figure 3.2.11. Figure 3.2.12 presents the experimental results
for the pressure dependence of k1 at 300 K in CO2. The results on the pressure dependence of
k1 obtained at 300 K for the bath gases helium, argon and CO2 are given in Table 3.2.2 and
Figure 3.2.13.
Figure 3.2.10 Recombination rate constant k1 in He in the pressure range 2 – 60 bar at 300 K. (a) Data obtained under different experimental conditions, (○) : 0.07 mbar Cl2, 0.27 mbar p-xylene and 2 bar He at 300 K and with the same concentration ratio up to 37 bar; (♦) : 0.12 mbar Cl2, 0.40 mbar p-xylene and 20 bar He at 300K and with the same concentration ratio up to 50 bar; (□) : 0.12 mbar Cl2, 0.40 mbar p-xylene and 20 bar He at 300 K and with the same concentration ratio up to 60 bar, (b) Average k1 values obtained from Figure 3.2.10 (a) for the same densities. Error bars indicate the statistical errors for selected points.
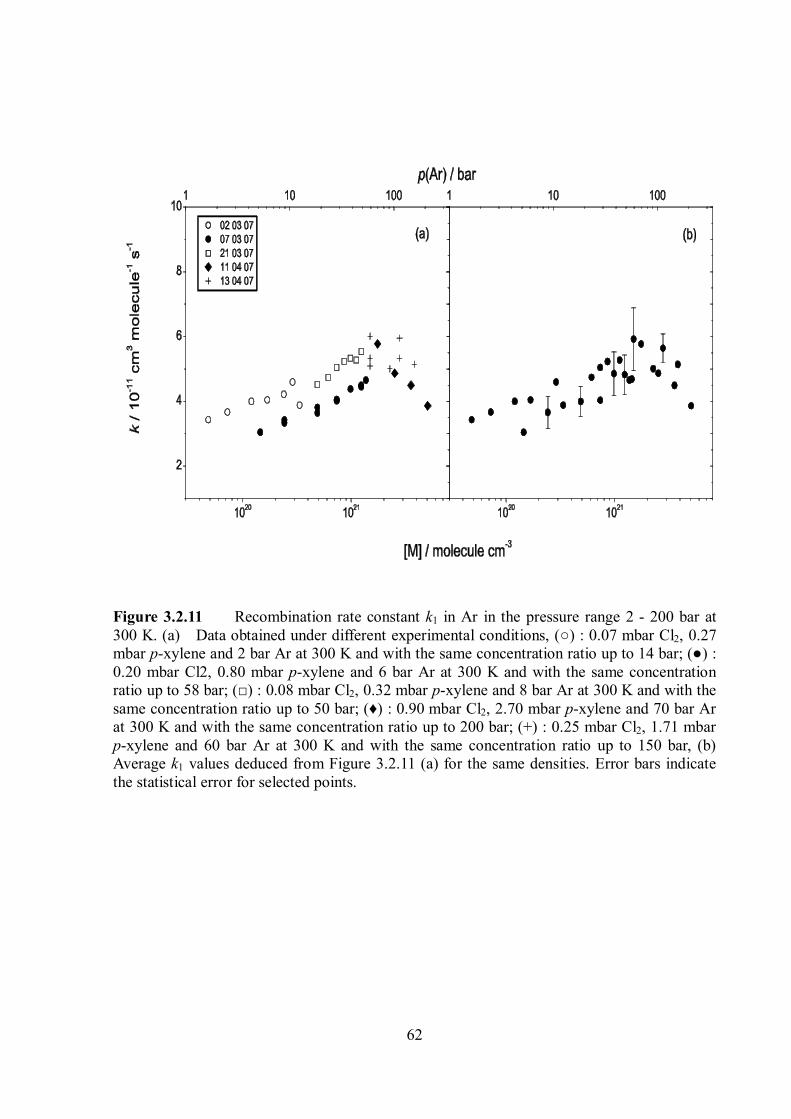
62
Figure 3.2.11 Recombination rate constant k1 in Ar in the pressure range 2 - 200 bar at 300 K. (a) Data obtained under different experimental conditions, (○) : 0.07 mbar Cl2, 0.27 mbar p-xylene and 2 bar Ar at 300 K and with the same concentration ratio up to 14 bar; (●) : 0.20 mbar Cl2, 0.80 mbar p-xylene and 6 bar Ar at 300 K and with the same concentration ratio up to 58 bar; (□) : 0.08 mbar Cl2, 0.32 mbar p-xylene and 8 bar Ar at 300 K and with the same concentration ratio up to 50 bar; (♦) : 0.90 mbar Cl2, 2.70 mbar p-xylene and 70 bar Ar at 300 K and with the same concentration ratio up to 200 bar; (+) : 0.25 mbar Cl2, 1.71 mbar p-xylene and 60 bar Ar at 300 K and with the same concentration ratio up to 150 bar, (b) Average k1 values deduced from Figure 3.2.11 (a) for the same densities. Error bars indicate the statistical error for selected points.
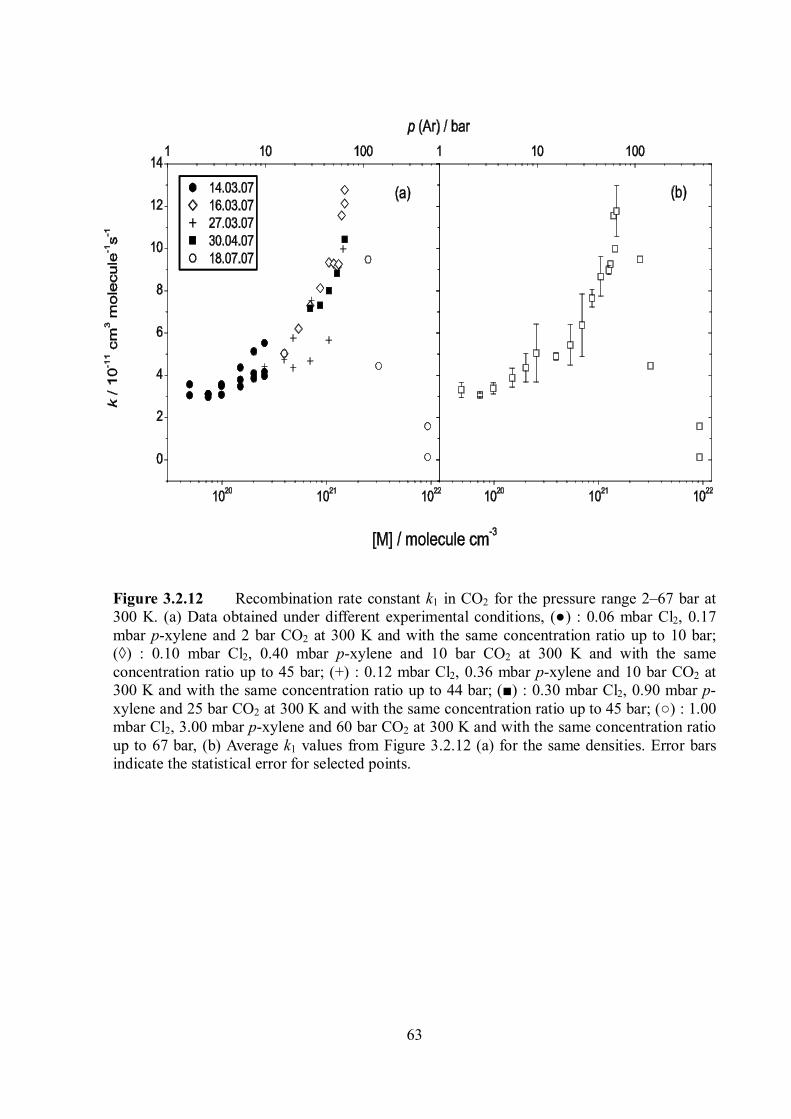
63
Figure 3.2.12 Recombination rate constant k1 in CO2 for the pressure range 2–67 bar at 300 K. (a) Data obtained under different experimental conditions, (●) : 0.06 mbar Cl2, 0.17 mbar p-xylene and 2 bar CO2 at 300 K and with the same concentration ratio up to 10 bar; (◊) : 0.10 mbar Cl2, 0.40 mbar p-xylene and 10 bar CO2 at 300 K and with the same concentration ratio up to 45 bar; (+) : 0.12 mbar Cl2, 0.36 mbar p-xylene and 10 bar CO2 at 300 K and with the same concentration ratio up to 44 bar; (■) : 0.30 mbar Cl2, 0.90 mbar p-xylene and 25 bar CO2 at 300 K and with the same concentration ratio up to 45 bar; (○) : 1.00 mbar Cl2, 3.00 mbar p-xylene and 60 bar CO2 at 300 K and with the same concentration ratio up to 67 bar, (b) Average k1 values from Figure 3.2.12 (a) for the same densities. Error bars indicate the statistical error for selected points.
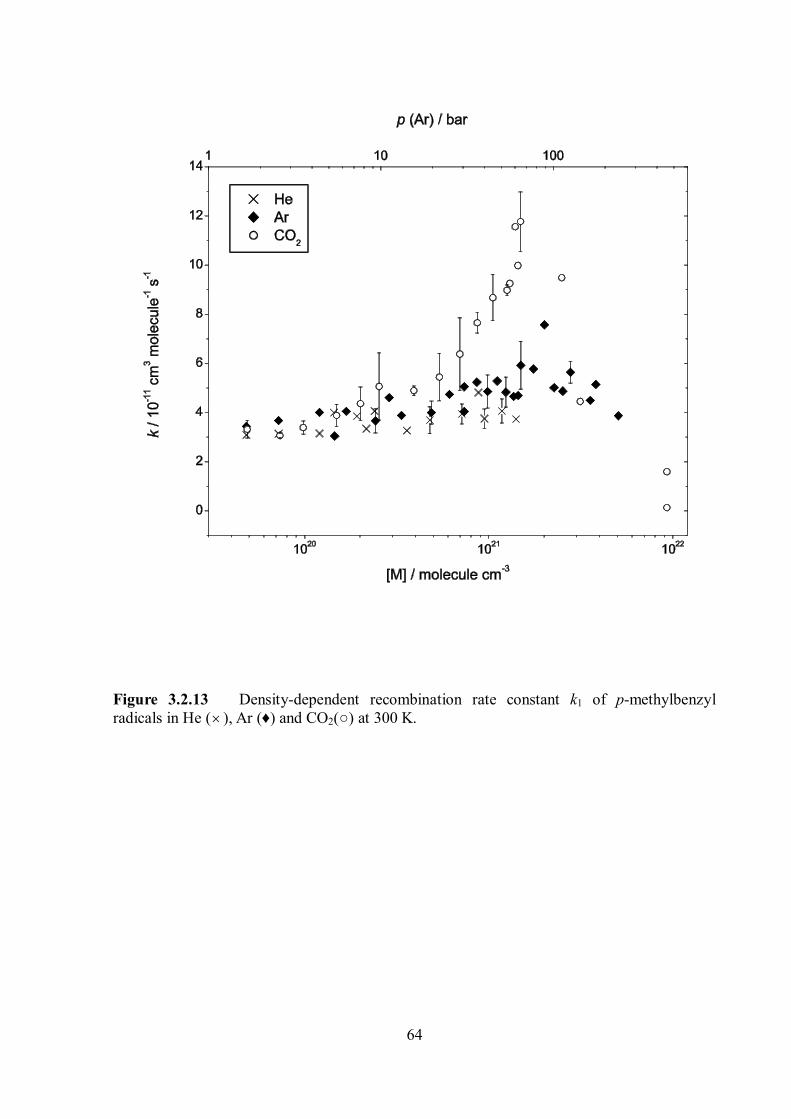
64
Figure 3.2.13 Density-dependent recombination rate constant k1 of p-methylbenzyl radicals in He ( ), Ar (♦) and CO2(○) at 300 K.
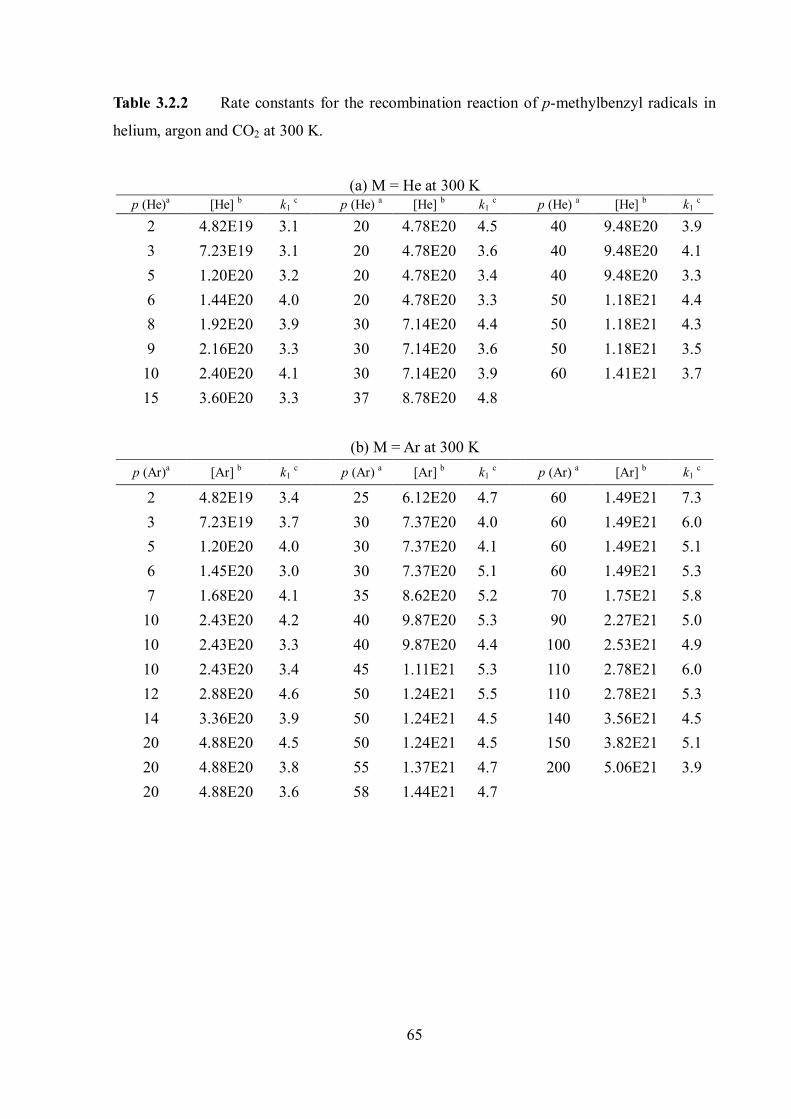
65
Table 3.2.2 Rate constants for the recombination reaction of p-methylbenzyl radicals in
helium, argon and CO2 at 300 K.
(a) M = He at 300 K p (He)a [He] b k1 c p (He) a [He] b k1 c p (He) a [He] b k1 c
2 4.82E19 3.1 20 4.78E20 4.5 40 9.48E20 3.9 3 7.23E19 3.1 20 4.78E20 3.6 40 9.48E20 4.1 5 1.20E20 3.2 20 4.78E20 3.4 40 9.48E20 3.3 6 1.44E20 4.0 20 4.78E20 3.3 50 1.18E21 4.4 8 1.92E20 3.9 30 7.14E20 4.4 50 1.18E21 4.3 9 2.16E20 3.3 30 7.14E20 3.6 50 1.18E21 3.5
10 2.40E20 4.1 30 7.14E20 3.9 60 1.41E21 3.7 15 3.60E20 3.3 37 8.78E20 4.8
(b) M = Ar at 300 K
p (Ar)a [Ar] b k1 c p (Ar) a [Ar] b k1 c p (Ar) a [Ar] b k1 c
2 4.82E19 3.4 25 6.12E20 4.7 60 1.49E21 7.3 3 7.23E19 3.7 30 7.37E20 4.0 60 1.49E21 6.0 5 1.20E20 4.0 30 7.37E20 4.1 60 1.49E21 5.1 6 1.45E20 3.0 30 7.37E20 5.1 60 1.49E21 5.3 7 1.68E20 4.1 35 8.62E20 5.2 70 1.75E21 5.8
10 2.43E20 4.2 40 9.87E20 5.3 90 2.27E21 5.0 10 2.43E20 3.3 40 9.87E20 4.4 100 2.53E21 4.9 10 2.43E20 3.4 45 1.11E21 5.3 110 2.78E21 6.0 12 2.88E20 4.6 50 1.24E21 5.5 110 2.78E21 5.3 14 3.36E20 3.9 50 1.24E21 4.5 140 3.56E21 4.5 20 4.88E20 4.5 50 1.24E21 4.5 150 3.82E21 5.1 20 4.88E20 3.8 55 1.37E21 4.7 200 5.06E21 3.9 20 4.88E20 3.6 58 1.44E21 4.7
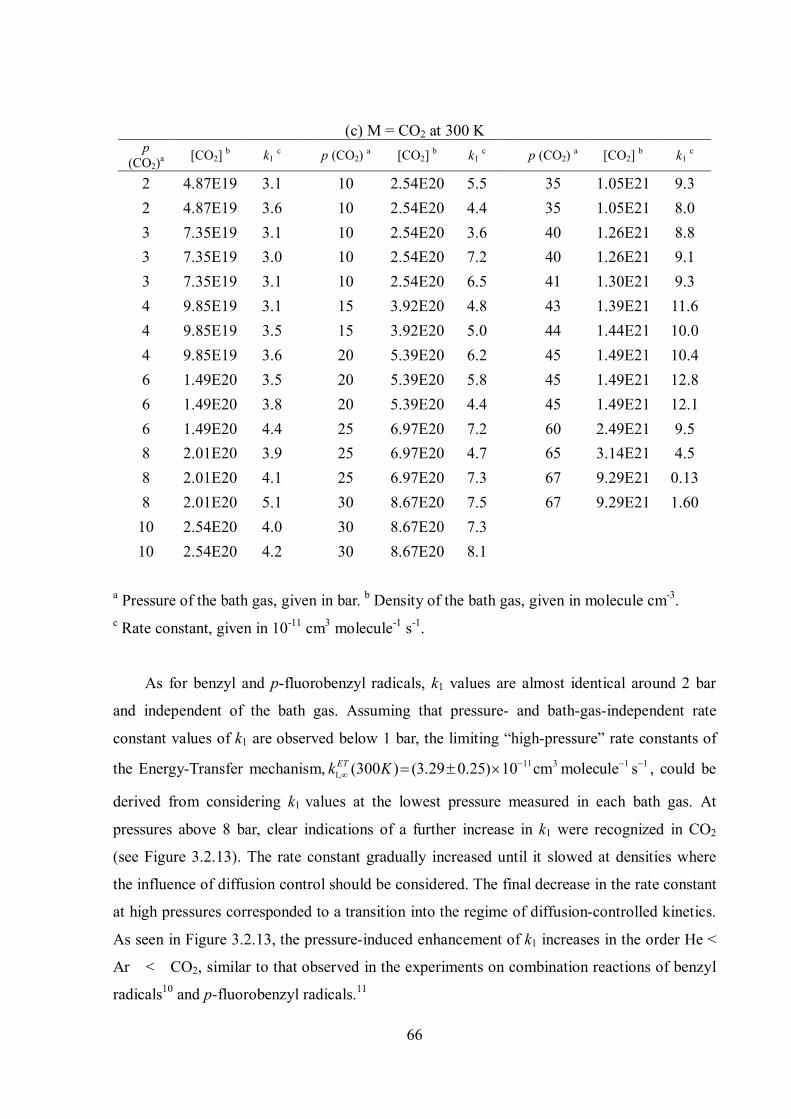
66
(c) M = CO2 at 300 K p
(CO2)a [CO2] b k1 c p (CO2) a [CO2] b k1 c p (CO2) a [CO2] b k1 c
2 4.87E19 3.1 10 2.54E20 5.5 35 1.05E21 9.3 2 4.87E19 3.6 10 2.54E20 4.4 35 1.05E21 8.0 3 7.35E19 3.1 10 2.54E20 3.6 40 1.26E21 8.8 3 7.35E19 3.0 10 2.54E20 7.2 40 1.26E21 9.1 3 7.35E19 3.1 10 2.54E20 6.5 41 1.30E21 9.3 4 9.85E19 3.1 15 3.92E20 4.8 43 1.39E21 11.6 4 9.85E19 3.5 15 3.92E20 5.0 44 1.44E21 10.0 4 9.85E19 3.6 20 5.39E20 6.2 45 1.49E21 10.4 6 1.49E20 3.5 20 5.39E20 5.8 45 1.49E21 12.8 6 1.49E20 3.8 20 5.39E20 4.4 45 1.49E21 12.1 6 1.49E20 4.4 25 6.97E20 7.2 60 2.49E21 9.5 8 2.01E20 3.9 25 6.97E20 4.7 65 3.14E21 4.5 8 2.01E20 4.1 25 6.97E20 7.3 67 9.29E21 0.13 8 2.01E20 5.1 30 8.67E20 7.5 67 9.29E21 1.60
10 2.54E20 4.0 30 8.67E20 7.3 10 2.54E20 4.2 30 8.67E20 8.1
a Pressure of the bath gas, given in bar. b Density of the bath gas, given in molecule cm-3. c Rate constant, given in 10-11 cm3 molecule-1 s-1.
As for benzyl and p-fluorobenzyl radicals, k1 values are almost identical around 2 bar
and independent of the bath gas. Assuming that pressure- and bath-gas-independent rate
constant values of k1 are observed below 1 bar, the limiting “high-pressure” rate constants of
the Energy-Transfer mechanism, 11 3 1 11, (300 ) (3.29 0.25) 10 cm molecule sETk K , could be
derived from considering k1 values at the lowest pressure measured in each bath gas. At
pressures above 8 bar, clear indications of a further increase in k1 were recognized in CO2
(see Figure 3.2.13). The rate constant gradually increased until it slowed at densities where
the influence of diffusion control should be considered. The final decrease in the rate constant
at high pressures corresponded to a transition into the regime of diffusion-controlled kinetics.
As seen in Figure 3.2.13, the pressure-induced enhancement of k1 increases in the order He <
Ar < CO2, similar to that observed in the experiments on combination reactions of benzyl
radicals10 and p-fluorobenzyl radicals.11
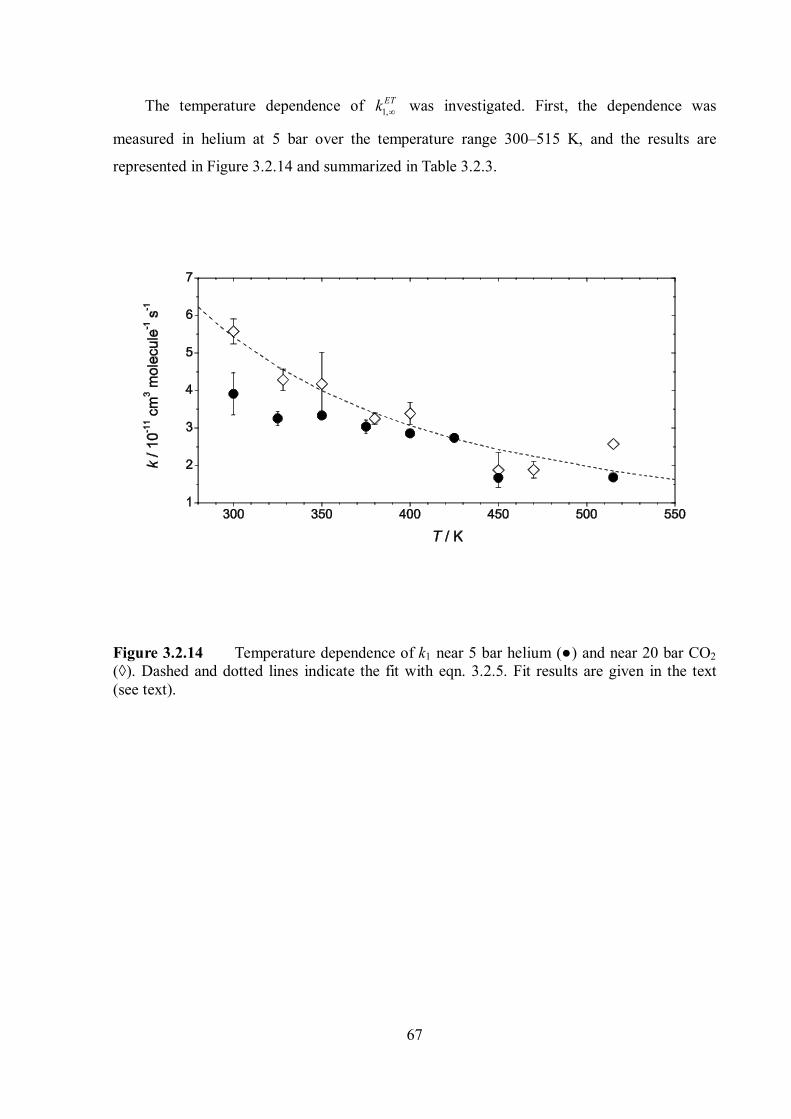
67
The temperature dependence of 1,ETk was investigated. First, the dependence was
measured in helium at 5 bar over the temperature range 300–515 K, and the results are
represented in Figure 3.2.14 and summarized in Table 3.2.3.
Figure 3.2.14 Temperature dependence of k1 near 5 bar helium (●) and near 20 bar CO2 (◊). Dashed and dotted lines indicate the fit with eqn. 3.2.5. Fit results are given in the text (see text).
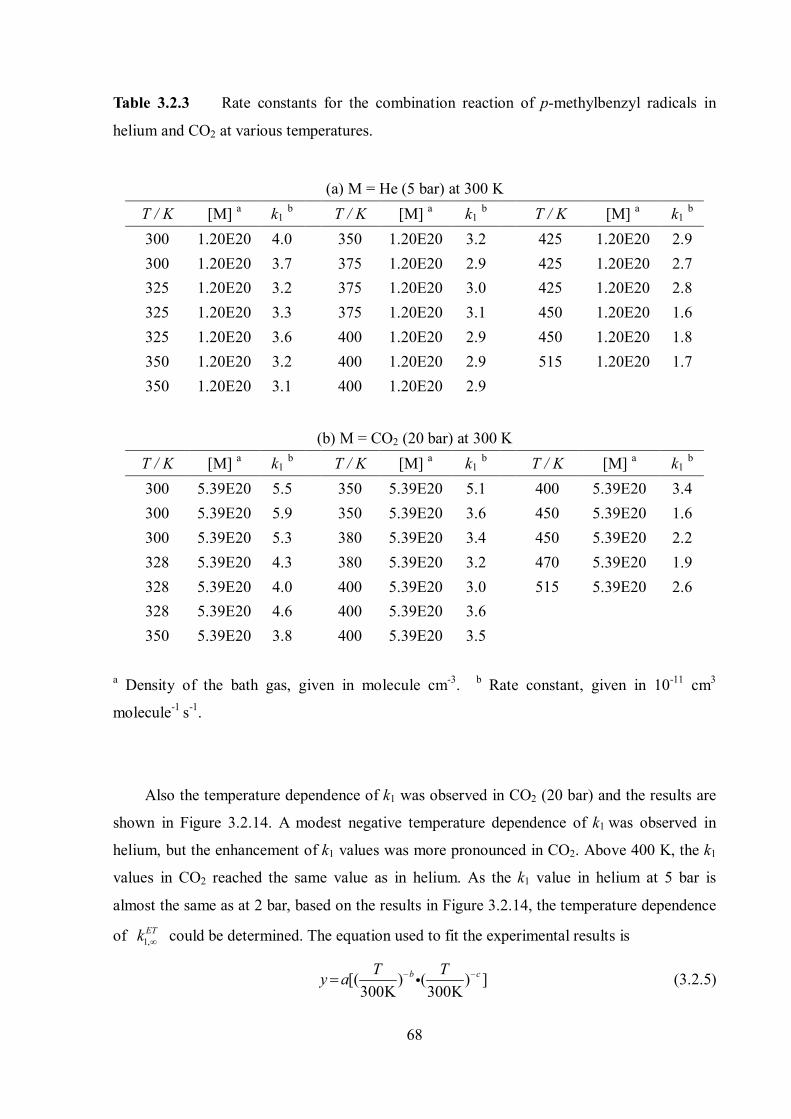
68
Table 3.2.3 Rate constants for the combination reaction of p-methylbenzyl radicals in
helium and CO2 at various temperatures.
(a) M = He (5 bar) at 300 K T / K [M] a k1 b T / K [M] a k1 b T / K [M] a k1 b 300 1.20E20 4.0 350 1.20E20 3.2 425 1.20E20 2.9 300 1.20E20 3.7 375 1.20E20 2.9 425 1.20E20 2.7 325 1.20E20 3.2 375 1.20E20 3.0 425 1.20E20 2.8 325 1.20E20 3.3 375 1.20E20 3.1 450 1.20E20 1.6 325 1.20E20 3.6 400 1.20E20 2.9 450 1.20E20 1.8 350 1.20E20 3.2 400 1.20E20 2.9 515 1.20E20 1.7 350 1.20E20 3.1 400 1.20E20 2.9
(b) M = CO2 (20 bar) at 300 K T / K [M] a k1 b T / K [M] a k1 b T / K [M] a k1 b 300 5.39E20 5.5 350 5.39E20 5.1 400 5.39E20 3.4 300 5.39E20 5.9 350 5.39E20 3.6 450 5.39E20 1.6 300 5.39E20 5.3 380 5.39E20 3.4 450 5.39E20 2.2 328 5.39E20 4.3 380 5.39E20 3.2 470 5.39E20 1.9 328 5.39E20 4.0 400 5.39E20 3.0 515 5.39E20 2.6 328 5.39E20 4.6 400 5.39E20 3.6 350 5.39E20 3.8 400 5.39E20 3.5
a Density of the bath gas, given in molecule cm-3. b Rate constant, given in 10-11 cm3
molecule-1 s-1.
Also the temperature dependence of k1 was observed in CO2 (20 bar) and the results are
shown in Figure 3.2.14. A modest negative temperature dependence of k1 was observed in
helium, but the enhancement of k1 values was more pronounced in CO2. Above 400 K, the k1
values in CO2 reached the same value as in helium. As the k1 value in helium at 5 bar is
almost the same as at 2 bar, based on the results in Figure 3.2.14, the temperature dependence
of 1,ETk could be determined. The equation used to fit the experimental results is
[( ) ( ) ]300K 300K
b cT Ty a (3.2.5)
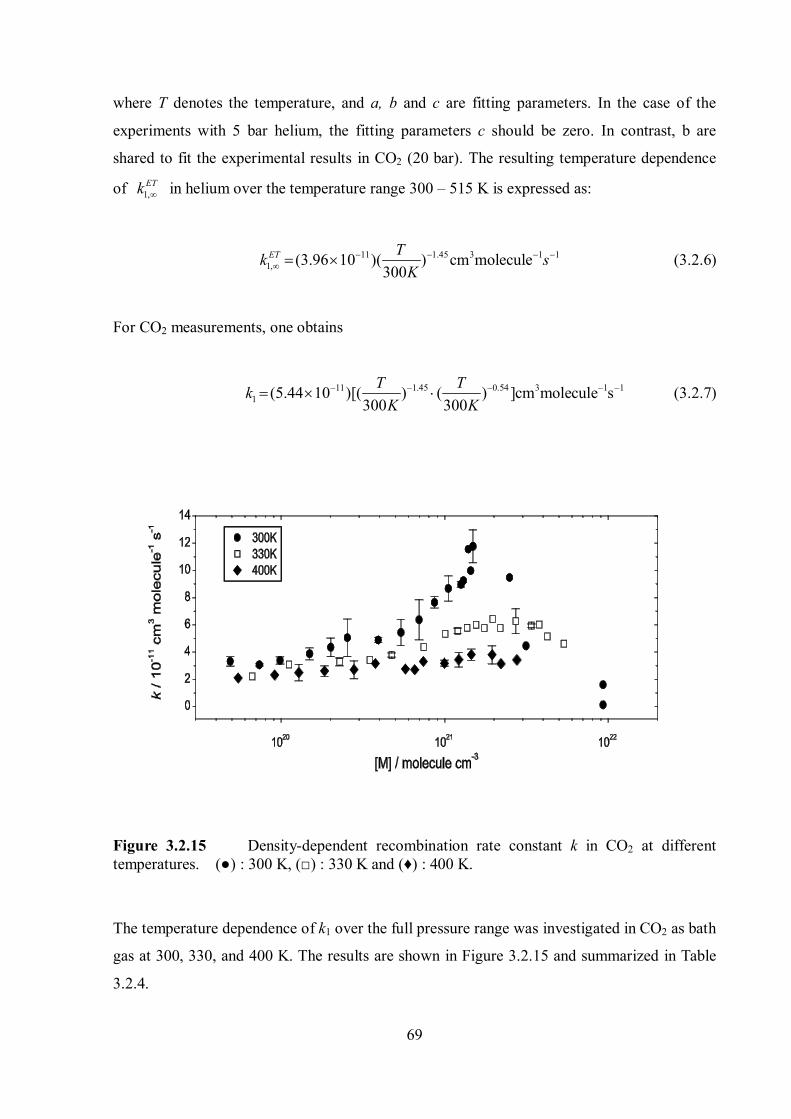
69
where T denotes the temperature, and a, b and c are fitting parameters. In the case of the
experiments with 5 bar helium, the fitting parameters c should be zero. In contrast, b are
shared to fit the experimental results in CO2 (20 bar). The resulting temperature dependence
of 1,ETk in helium over the temperature range 300 – 515 K is expressed as:
11 1.45 3 1 11, (3.96 10 )( ) cm molecule
300ET Tk s
K
(3.2.6)
For CO2 measurements, one obtains
11 1.45 0.54 3 1 11 (5.44 10 )[( ) ( ) ]cm molecule s
300 300T Tk
K K (3.2.7)
Figure 3.2.15 Density-dependent recombination rate constant k in CO2 at different temperatures. (●) : 300 K, (□) : 330 K and (♦) : 400 K.
The temperature dependence of k1 over the full pressure range was investigated in CO2 as bath
gas at 300, 330, and 400 K. The results are shown in Figure 3.2.15 and summarized in Table
3.2.4.
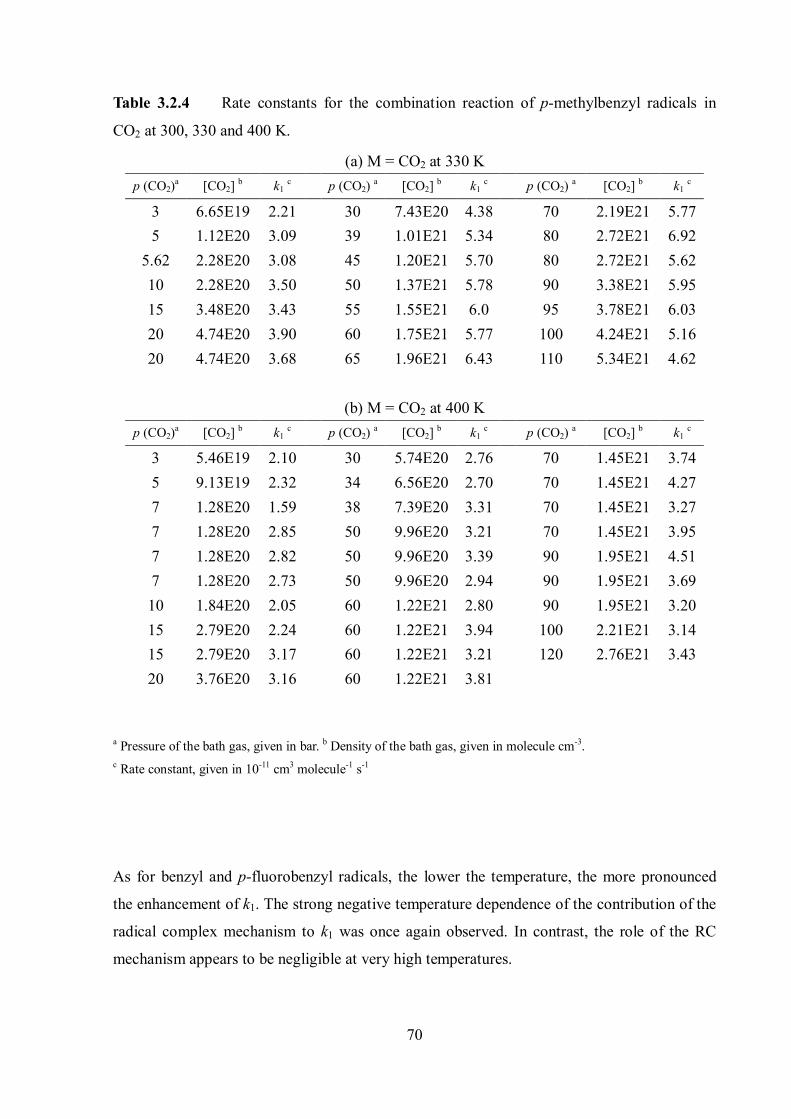
70
Table 3.2.4 Rate constants for the combination reaction of p-methylbenzyl radicals in
CO2 at 300, 330 and 400 K.
(a) M = CO2 at 330 K p (CO2)a [CO2] b k1 c p (CO2) a [CO2] b k1 c p (CO2) a [CO2] b k1 c
3 6.65E19 2.21 30 7.43E20 4.38 70 2.19E21 5.77 5 1.12E20 3.09 39 1.01E21 5.34 80 2.72E21 6.92
5.62 2.28E20 3.08 45 1.20E21 5.70 80 2.72E21 5.62 10 2.28E20 3.50 50 1.37E21 5.78 90 3.38E21 5.95 15 3.48E20 3.43 55 1.55E21 6.0 95 3.78E21 6.03 20 4.74E20 3.90 60 1.75E21 5.77 100 4.24E21 5.16 20 4.74E20 3.68 65 1.96E21 6.43 110 5.34E21 4.62
(b) M = CO2 at 400 K
p (CO2)a [CO2] b k1 c p (CO2) a [CO2] b k1 c p (CO2) a [CO2] b k1 c
3 5.46E19 2.10 30 5.74E20 2.76 70 1.45E21 3.74 5 9.13E19 2.32 34 6.56E20 2.70 70 1.45E21 4.27 7 1.28E20 1.59 38 7.39E20 3.31 70 1.45E21 3.27 7 1.28E20 2.85 50 9.96E20 3.21 70 1.45E21 3.95 7 1.28E20 2.82 50 9.96E20 3.39 90 1.95E21 4.51 7 1.28E20 2.73 50 9.96E20 2.94 90 1.95E21 3.69 10 1.84E20 2.05 60 1.22E21 2.80 90 1.95E21 3.20 15 2.79E20 2.24 60 1.22E21 3.94 100 2.21E21 3.14 15 2.79E20 3.17 60 1.22E21 3.21 120 2.76E21 3.43 20 3.76E20 3.16 60 1.22E21 3.81
a Pressure of the bath gas, given in bar. b Density of the bath gas, given in molecule cm-3. c Rate constant, given in 10-11 cm3 molecule-1 s-1
As for benzyl and p-fluorobenzyl radicals, the lower the temperature, the more pronounced
the enhancement of k1. The strong negative temperature dependence of the contribution of the
radical complex mechanism to k1 was once again observed. In contrast, the role of the RC
mechanism appears to be negligible at very high temperatures.
71
3.3 Recombination reaction of benzyl radicals
Even though indications for the RC mechanism have been found in several experimental
studies on combination reactions of atoms and small radicals, it was difficult to quantify its
exact contribution. The reason is that both the ET mechanism and the RC mechanism
contribute simultaneously to the combination rate constant. Oum et al.9,10 set an effective
strategy to overcome this problem by investigating combination reactions of large organic
radicals. The contribution of the RC mechanism to the combination rate constant k1 was
successfully interpreted and quantified by investigating the benzyl radical recombination
reaction.
C6H5CH2 + C6H5CH2 (+M) → C14H14 (+M) k1 (3.3.1)
As shown in Chapter 1, Oum et al.10 studied pressure and temperature dependent combination
rate constants of benzyl radicals in helium, argon, xenon, N2, and CO2. An unexpected
increase of the rate constant above the limiting high-pressure rate constant ( 1,ETk ) was reported,
which one obtains based on the traditional mechanism. The Radical–Complex mechanism has
been successfully used to reproduce the observed rate constants of the benzyl radical
combination reaction. This mechanism is related to the strength of van der Waals type
interactions between radical and solvent molecules (AM) (A denotes the target radical, and M
is the bath gas). One of the important factors is the well-depth of the bath gas. Usually the
effective well-depth of AM is influenced by several molecular properties such as dipole
moment and polarizability. CF4, CF3H and SF6 are good candidates as solvent molecules to
elucidate how combination rate constants are influenced by the nature of the radical-solvent
molecule interaction.
In this work, we investigated pressure-and temperature-dependent combination rates of
benzyl radicals in CF3H, CF4 and SF6 over the pressure range 1-50 bar and temperature range
250-400 K, where earlier measurements in CO2 showed a marked increase of rate constants
beyond the plateau of the limiting high-pressure rate constant.
In ref. 10, the influence of the co-bath gas effect was investigated using bath gas
mixtures of argon and xenon. No notable increase of k1 compared to the measurements in pure
argon was found, indicating that the contribution from quenching of electronic states by heavy
atoms is insignificant in the benzyl radical recombination. From the earlier measurements of
72
benzyl radical recombination in refs. 9 and 10, the most significant increase of k1 was
observed in CO2, and the least in helium. Based on this information, the co-bath gas effect on
the increase of the combination rate constant k1 of benzyl radical was investigated in bath gas
mixtures of CO2 and helium in the range of 40 – 160 bar at 300 K. In ref. 10, the decrease of
the rate constant, k1, due to the influence of diffusion was not observed in CO2, because it was
difficult to reach more than 50 bar CO2 without a compressor. The rate constant k1 of benzyl
radicals was therefore measured in the high-pressure range up to 60 bar in CO2 at 300 K in
this work.
In this work, benzyl radicals were generated by the laser photolysis of Cl2 at 308 nm
using an excimer laser, and the subsequent fast bimolecular reaction of chlorine atoms with an
excess amount of toluene.
Cl2 + hν (308 nm) → 2 Cl (3.3.2)
Cl + C6H5CH3 → C6H5CH2 + HCl (3.3.3)
The recombination rate constant, k1, of reaction (3.3.1) was measured by monitoring the UV-
absorption signal of benzyl radicals at 253 nm on time scales of μs to ms.
According to ref. 10, the reaction (3.3.1) is the major channel, and other possible side
reactions should be insignificant, because toluene was always present in excess. Also, due to
the small absorption coefficients of products like bibenzyl (σbibenzyl ≈ 19 2 11.0 10 cm molecule )5 compared to the strong absorption of benzyl radical, the effect of
residual absorption from products should be negligible. Typical concentrations of chlorine and
toluene were: [Cl]0 = (1–5) 1013 molecule cm-3 and [Toluene] = (0.7–
7) 16 310 moleculecm . Because of the second order kinetics of reaction (3.3.1), measured k1
values are very sensitive to the absorption coefficient of benzyl radicals. In the present work,
the temperature dependent σbenzyl (T) values from ref. 10 were used, which are in good
agreement with the literature value of Ikeda et al.42
16 0.25 2 1( ) 1.3 10 ( ) cm molecule300benzyl
TTK
(3.1.4)
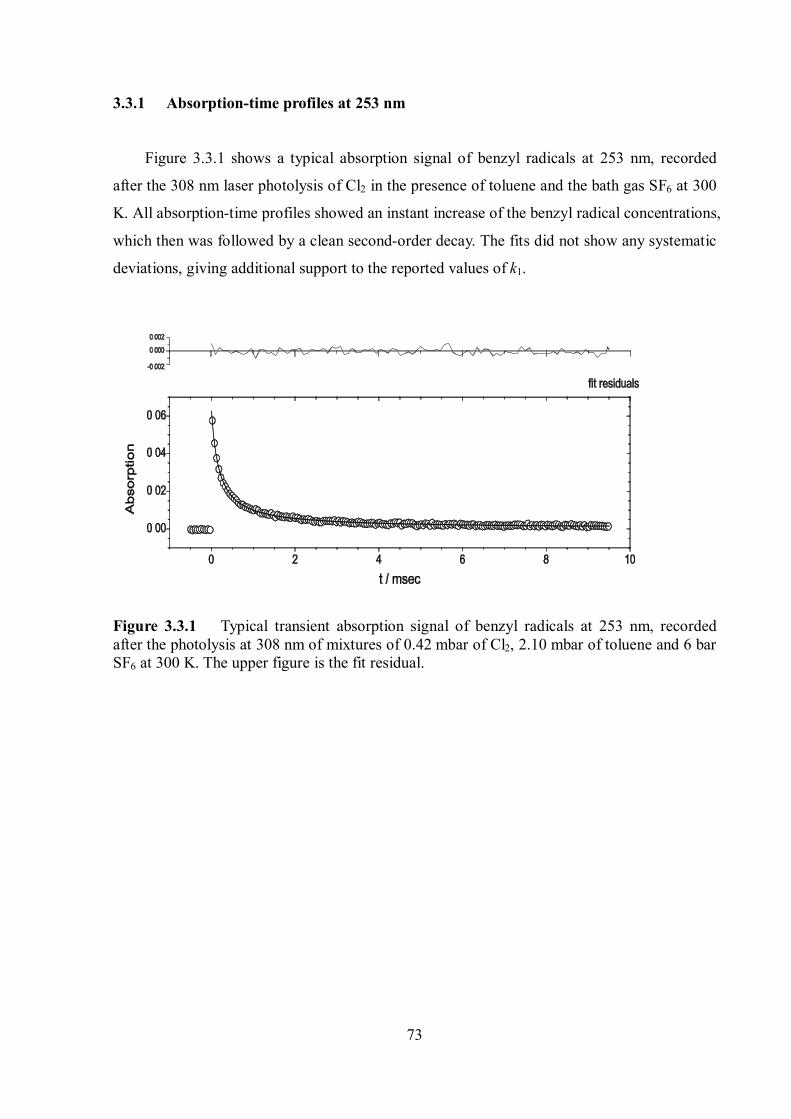
73
3.3.1 Absorption-time profiles at 253 nm
Figure 3.3.1 shows a typical absorption signal of benzyl radicals at 253 nm, recorded
after the 308 nm laser photolysis of Cl2 in the presence of toluene and the bath gas SF6 at 300
K. All absorption-time profiles showed an instant increase of the benzyl radical concentrations,
which then was followed by a clean second-order decay. The fits did not show any systematic
deviations, giving additional support to the reported values of k1.
Figure 3.3.1 Typical transient absorption signal of benzyl radicals at 253 nm, recorded after the photolysis at 308 nm of mixtures of 0.42 mbar of Cl2, 2.10 mbar of toluene and 6 bar SF6 at 300 K. The upper figure is the fit residual.
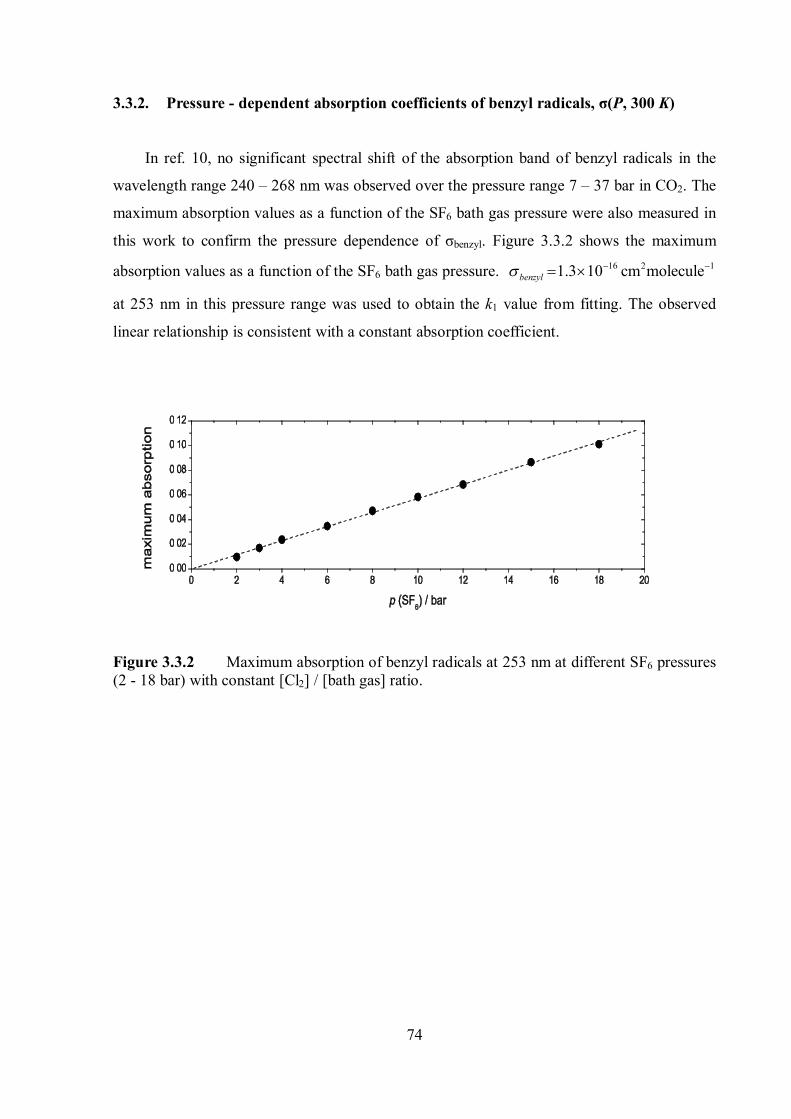
74
3.3.2. Pressure - dependent absorption coefficients of benzyl radicals, σ(P, 300 K)
In ref. 10, no significant spectral shift of the absorption band of benzyl radicals in the
wavelength range 240 – 268 nm was observed over the pressure range 7 – 37 bar in CO2. The
maximum absorption values as a function of the SF6 bath gas pressure were also measured in
this work to confirm the pressure dependence of σbenzyl. Figure 3.3.2 shows the maximum
absorption values as a function of the SF6 bath gas pressure. 16 2 11.3 10 cm moleculebenzyl
at 253 nm in this pressure range was used to obtain the k1 value from fitting. The observed
linear relationship is consistent with a constant absorption coefficient.
Figure 3.3.2 Maximum absorption of benzyl radicals at 253 nm at different SF6 pressures (2 - 18 bar) with constant [Cl2] / [bath gas] ratio.
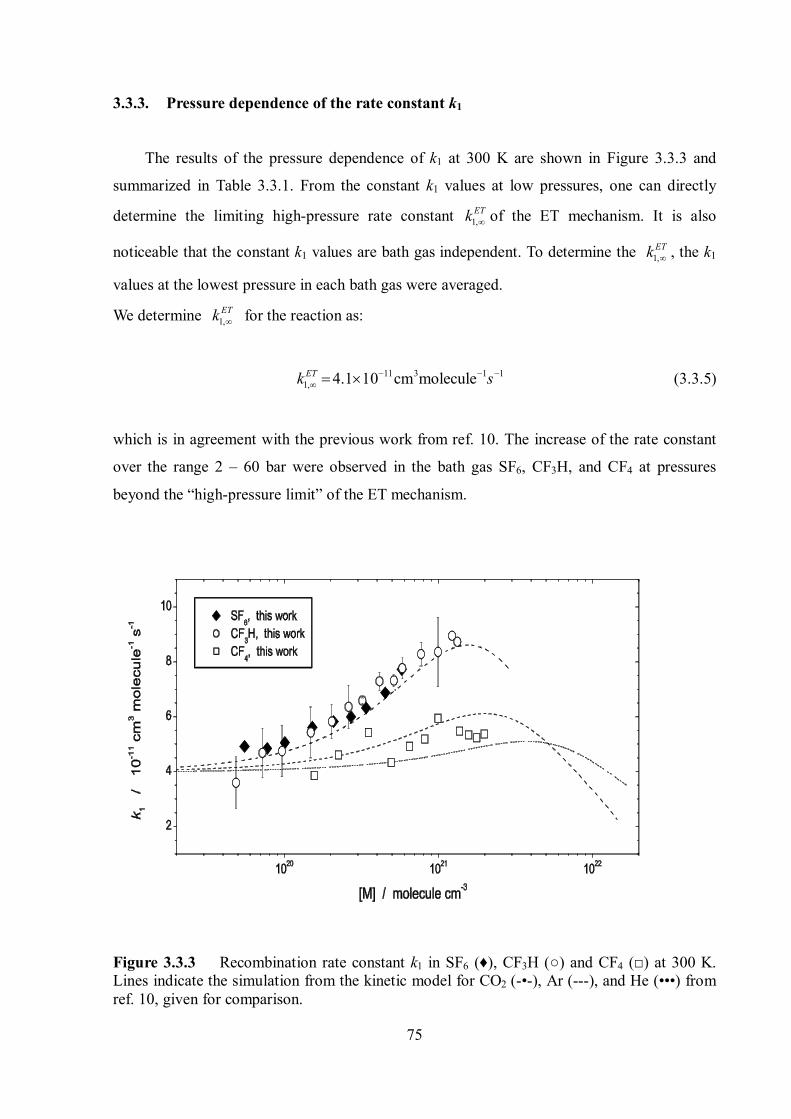
75
3.3.3. Pressure dependence of the rate constant k1
The results of the pressure dependence of k1 at 300 K are shown in Figure 3.3.3 and
summarized in Table 3.3.1. From the constant k1 values at low pressures, one can directly
determine the limiting high-pressure rate constant 1,ETk of the ET mechanism. It is also
noticeable that the constant k1 values are bath gas independent. To determine the 1,ETk , the k1
values at the lowest pressure in each bath gas were averaged.
We determine 1,ETk for the reaction as:
11 3 1 1
1, 4.1 10 cm moleculeETk s (3.3.5)
which is in agreement with the previous work from ref. 10. The increase of the rate constant
over the range 2 – 60 bar were observed in the bath gas SF6, CF3H, and CF4 at pressures
beyond the “high-pressure limit” of the ET mechanism.
Figure 3.3.3 Recombination rate constant k1 in SF6 (♦), CF3H (○) and CF4 (□) at 300 K. Lines indicate the simulation from the kinetic model for CO2 (-•-), Ar (---), and He (•••) from ref. 10, given for comparison.
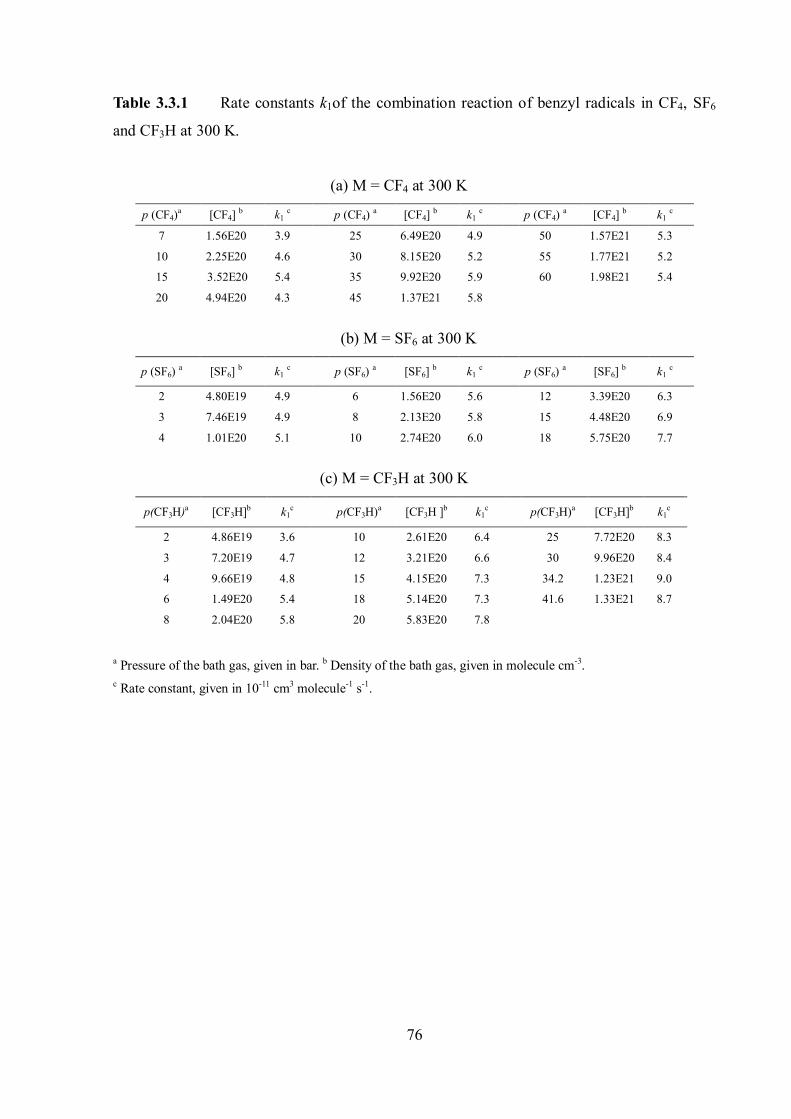
76
Table 3.3.1 Rate constants k1of the combination reaction of benzyl radicals in CF4, SF6
and CF3H at 300 K.
(a) M = CF4 at 300 K
p (CF4)a [CF4] b k1 c p (CF4) a [CF4] b k1 c p (CF4) a [CF4] b k1 c
7 1.56E20 3.9 25 6.49E20 4.9 50 1.57E21 5.3
10 2.25E20 4.6 30 8.15E20 5.2 55 1.77E21 5.2
15 3.52E20 5.4 35 9.92E20 5.9 60 1.98E21 5.4
20 4.94E20 4.3 45 1.37E21 5.8
(b) M = SF6 at 300 K
p (SF6) a [SF6] b k1 c p (SF6) a [SF6] b k1 c p (SF6) a [SF6] b k1 c
2 4.80E19 4.9 6 1.56E20 5.6 12 3.39E20 6.3
3 7.46E19 4.9 8 2.13E20 5.8 15 4.48E20 6.9
4 1.01E20 5.1 10 2.74E20 6.0 18 5.75E20 7.7
(c) M = CF3H at 300 K
p(CF3H)a [CF3H]b k1c p(CF3H)a [CF3H ]b k1
c p(CF3H)a [CF3H]b k1c
2 4.86E19 3.6 10 2.61E20 6.4 25 7.72E20 8.3
3 7.20E19 4.7 12 3.21E20 6.6 30 9.96E20 8.4
4 9.66E19 4.8 15 4.15E20 7.3 34.2 1.23E21 9.0
6 1.49E20 5.4 18 5.14E20 7.3 41.6 1.33E21 8.7
8 2.04E20 5.8 20 5.83E20 7.8
a Pressure of the bath gas, given in bar. b Density of the bath gas, given in molecule cm-3. c Rate constant, given in 10-11 cm3 molecule-1 s-1.
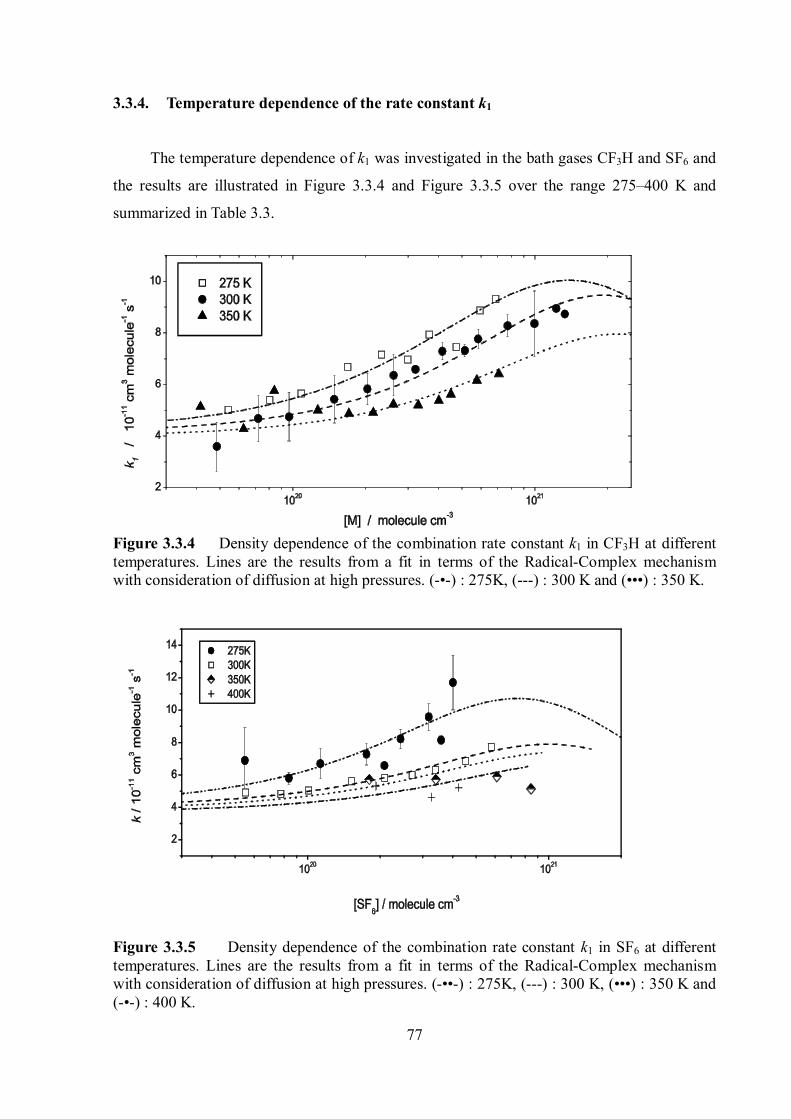
77
3.3.4. Temperature dependence of the rate constant k1
The temperature dependence of k1 was investigated in the bath gases CF3H and SF6 and
the results are illustrated in Figure 3.3.4 and Figure 3.3.5 over the range 275–400 K and
summarized in Table 3.3.
Figure 3.3.4 Density dependence of the combination rate constant k1 in CF3H at different temperatures. Lines are the results from a fit in terms of the Radical-Complex mechanism with consideration of diffusion at high pressures. (-•-) : 275K, (---) : 300 K and (•••) : 350 K.
Figure 3.3.5 Density dependence of the combination rate constant k1 in SF6 at different temperatures. Lines are the results from a fit in terms of the Radical-Complex mechanism with consideration of diffusion at high pressures. (-••-) : 275K, (---) : 300 K, (•••) : 350 K and (-•-) : 400 K.
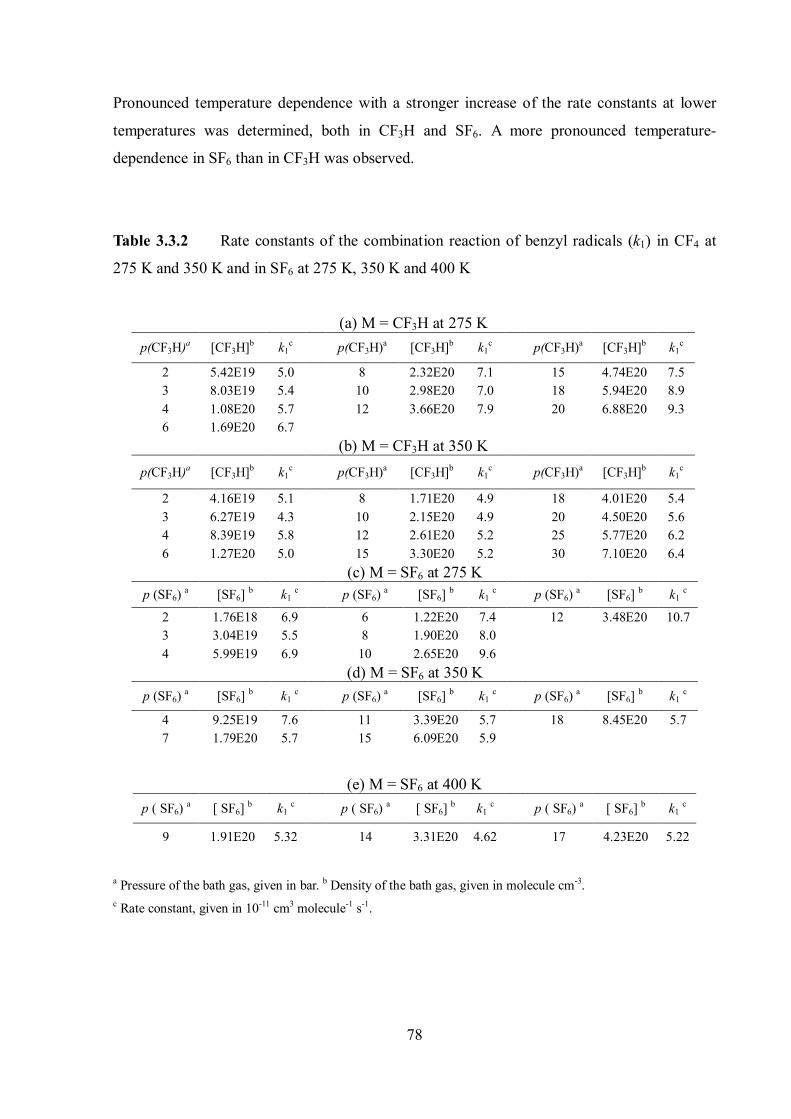
78
Pronounced temperature dependence with a stronger increase of the rate constants at lower
temperatures was determined, both in CF3H and SF6. A more pronounced temperature-
dependence in SF6 than in CF3H was observed.
Table 3.3.2 Rate constants of the combination reaction of benzyl radicals (k1) in CF4 at
275 K and 350 K and in SF6 at 275 K, 350 K and 400 K
(a) M = CF3H at 275 K p(CF3H)a [CF3H]b k1
c p(CF3H)a [CF3H]b k1c p(CF3H)a [CF3H]b k1
c
2 5.42E19 5.0 8 2.32E20 7.1 15 4.74E20 7.5 3 8.03E19 5.4 10 2.98E20 7.0 18 5.94E20 8.9 4 1.08E20 5.7 12 3.66E20 7.9 20 6.88E20 9.3 6 1.69E20 6.7
(b) M = CF3H at 350 K p(CF3H)a [CF3H]b k1
c p(CF3H)a [CF3H]b k1c p(CF3H)a [CF3H]b k1
c
2 4.16E19 5.1 8 1.71E20 4.9 18 4.01E20 5.4 3 6.27E19 4.3 10 2.15E20 4.9 20 4.50E20 5.6 4 8.39E19 5.8 12 2.61E20 5.2 25 5.77E20 6.2 6 1.27E20 5.0 15 3.30E20 5.2 30 7.10E20 6.4
(c) M = SF6 at 275 K p (SF6) a [SF6] b k1 c p (SF6) a [SF6] b k1 c p (SF6) a [SF6] b k1 c
2 1.76E18 6.9 6 1.22E20 7.4 12 3.48E20 10.7 3 3.04E19 5.5 8 1.90E20 8.0 4 5.99E19 6.9 10 2.65E20 9.6
(d) M = SF6 at 350 K p (SF6) a [SF6] b k1 c p (SF6) a [SF6] b k1 c p (SF6) a [SF6] b k1 c
4 9.25E19 7.6 11 3.39E20 5.7 18 8.45E20 5.7 7 1.79E20 5.7 15 6.09E20 5.9
(e) M = SF6 at 400 K p ( SF6) a [ SF6] b k1 c p ( SF6) a [ SF6] b k1 c p ( SF6) a [ SF6] b k1 c
9 1.91E20 5.32 14 3.31E20 4.62 17 4.23E20 5.22
a Pressure of the bath gas, given in bar. b Density of the bath gas, given in molecule cm-3. c Rate constant, given in 10-11 cm3 molecule-1 s-1.
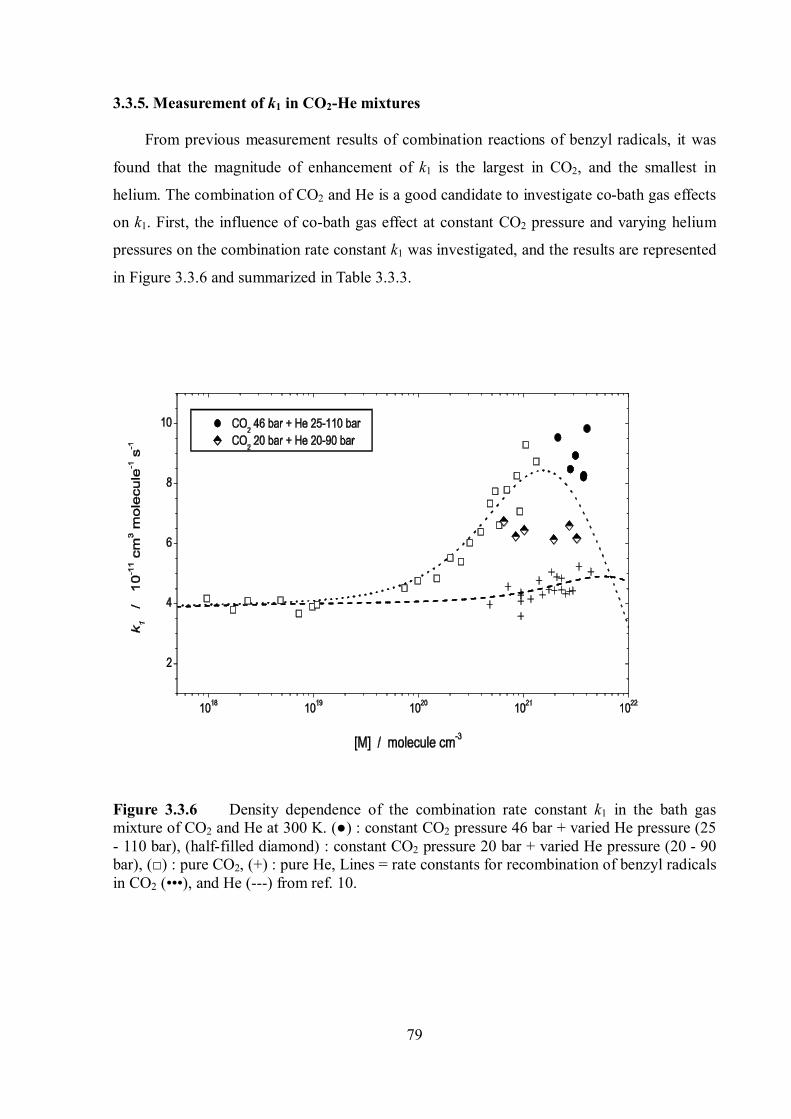
79
3.3.5. Measurement of k1 in CO2-He mixtures
From previous measurement results of combination reactions of benzyl radicals, it was
found that the magnitude of enhancement of k1 is the largest in CO2, and the smallest in
helium. The combination of CO2 and He is a good candidate to investigate co-bath gas effects
on k1. First, the influence of co-bath gas effect at constant CO2 pressure and varying helium
pressures on the combination rate constant k1 was investigated, and the results are represented
in Figure 3.3.6 and summarized in Table 3.3.3.
Figure 3.3.6 Density dependence of the combination rate constant k1 in the bath gas mixture of CO2 and He at 300 K. (●) : constant CO2 pressure 46 bar + varied He pressure (25 - 110 bar), (half-filled diamond) : constant CO2 pressure 20 bar + varied He pressure (20 - 90 bar), (□) : pure CO2, (+) : pure He, Lines = rate constants for recombination of benzyl radicals in CO2 (•••), and He (---) from ref. 10.
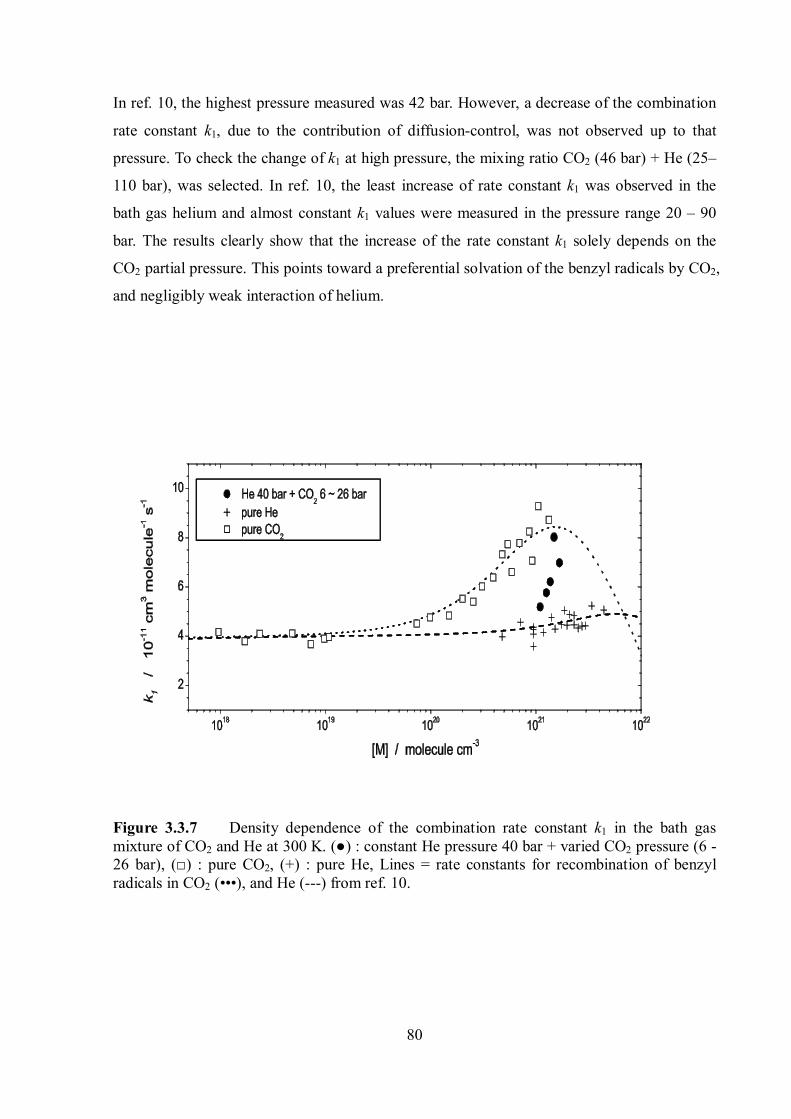
80
In ref. 10, the highest pressure measured was 42 bar. However, a decrease of the combination
rate constant k1, due to the contribution of diffusion-control, was not observed up to that
pressure. To check the change of k1 at high pressure, the mixing ratio CO2 (46 bar) + He (25–
110 bar), was selected. In ref. 10, the least increase of rate constant k1 was observed in the
bath gas helium and almost constant k1 values were measured in the pressure range 20 – 90
bar. The results clearly show that the increase of the rate constant k1 solely depends on the
CO2 partial pressure. This points toward a preferential solvation of the benzyl radicals by CO2,
and negligibly weak interaction of helium.
Figure 3.3.7 Density dependence of the combination rate constant k1 in the bath gas mixture of CO2 and He at 300 K. (●) : constant He pressure 40 bar + varied CO2 pressure (6 - 26 bar), (□) : pure CO2, (+) : pure He, Lines = rate constants for recombination of benzyl radicals in CO2 (•••), and He (---) from ref. 10.
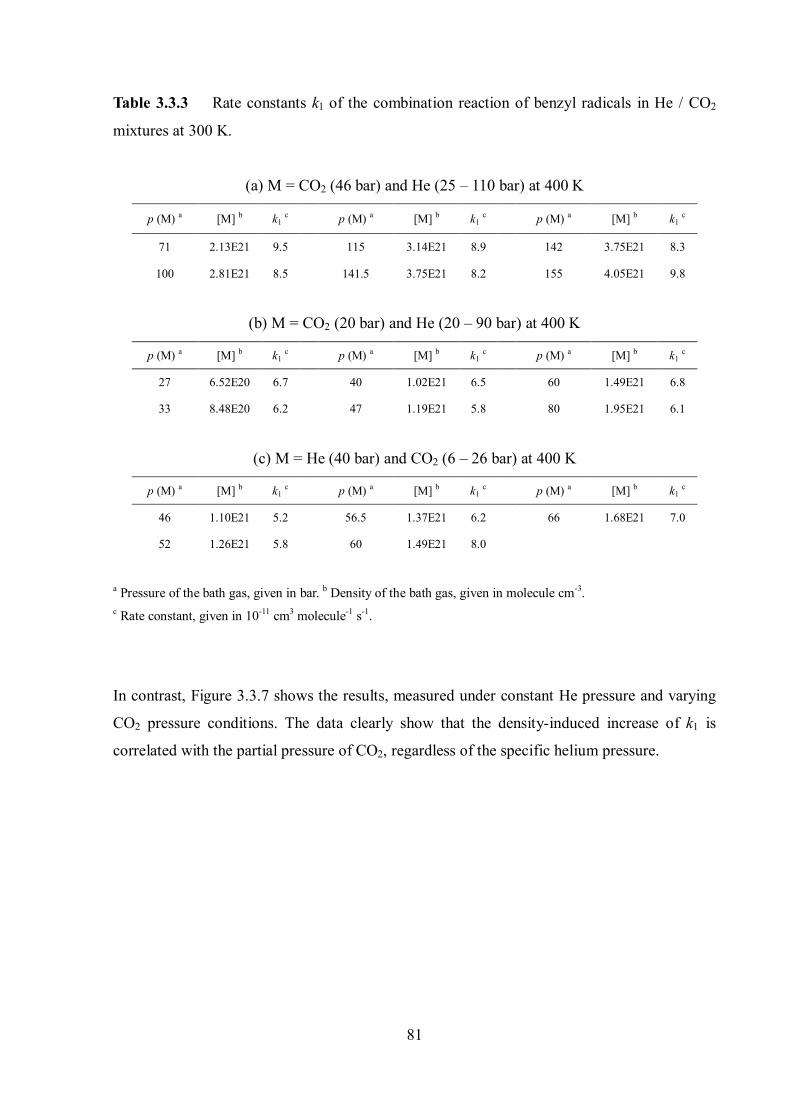
81
Table 3.3.3 Rate constants k1 of the combination reaction of benzyl radicals in He / CO2
mixtures at 300 K.
(a) M = CO2 (46 bar) and He (25 – 110 bar) at 400 K
p (M) a [M] b k1 c p (M) a [M] b k1 c p (M) a [M] b k1 c
71 2.13E21 9.5 115 3.14E21 8.9 142 3.75E21 8.3
100 2.81E21 8.5 141.5 3.75E21 8.2 155 4.05E21 9.8
(b) M = CO2 (20 bar) and He (20 – 90 bar) at 400 K
p (M) a [M] b k1 c p (M) a [M] b k1 c p (M) a [M] b k1 c
27 6.52E20 6.7 40 1.02E21 6.5 60 1.49E21 6.8
33 8.48E20 6.2 47 1.19E21 5.8 80 1.95E21 6.1
(c) M = He (40 bar) and CO2 (6 – 26 bar) at 400 K
p (M) a [M] b k1 c p (M) a [M] b k1 c p (M) a [M] b k1 c
46 1.10E21 5.2 56.5 1.37E21 6.2 66 1.68E21 7.0
52 1.26E21 5.8 60 1.49E21 8.0
a Pressure of the bath gas, given in bar. b Density of the bath gas, given in molecule cm-3. c Rate constant, given in 10-11 cm3 molecule-1 s-1.
In contrast, Figure 3.3.7 shows the results, measured under constant He pressure and varying
CO2 pressure conditions. The data clearly show that the density-induced increase of k1 is
correlated with the partial pressure of CO2, regardless of the specific helium pressure.
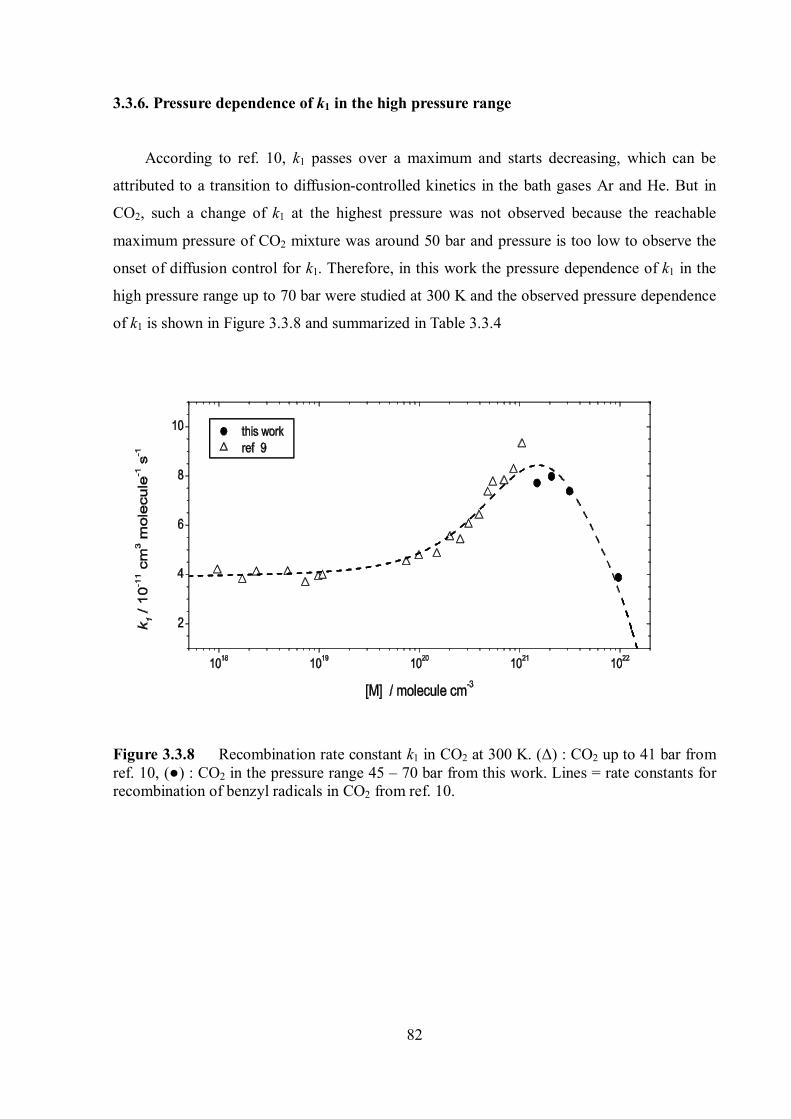
82
3.3.6. Pressure dependence of k1 in the high pressure range
According to ref. 10, k1 passes over a maximum and starts decreasing, which can be
attributed to a transition to diffusion-controlled kinetics in the bath gases Ar and He. But in
CO2, such a change of k1 at the highest pressure was not observed because the reachable
maximum pressure of CO2 mixture was around 50 bar and pressure is too low to observe the
onset of diffusion control for k1. Therefore, in this work the pressure dependence of k1 in the
high pressure range up to 70 bar were studied at 300 K and the observed pressure dependence
of k1 is shown in Figure 3.3.8 and summarized in Table 3.3.4
Figure 3.3.8 Recombination rate constant k1 in CO2 at 300 K. (Δ) : CO2 up to 41 bar from ref. 10, (●) : CO2 in the pressure range 45 – 70 bar from this work. Lines = rate constants for recombination of benzyl radicals in CO2 from ref. 10.
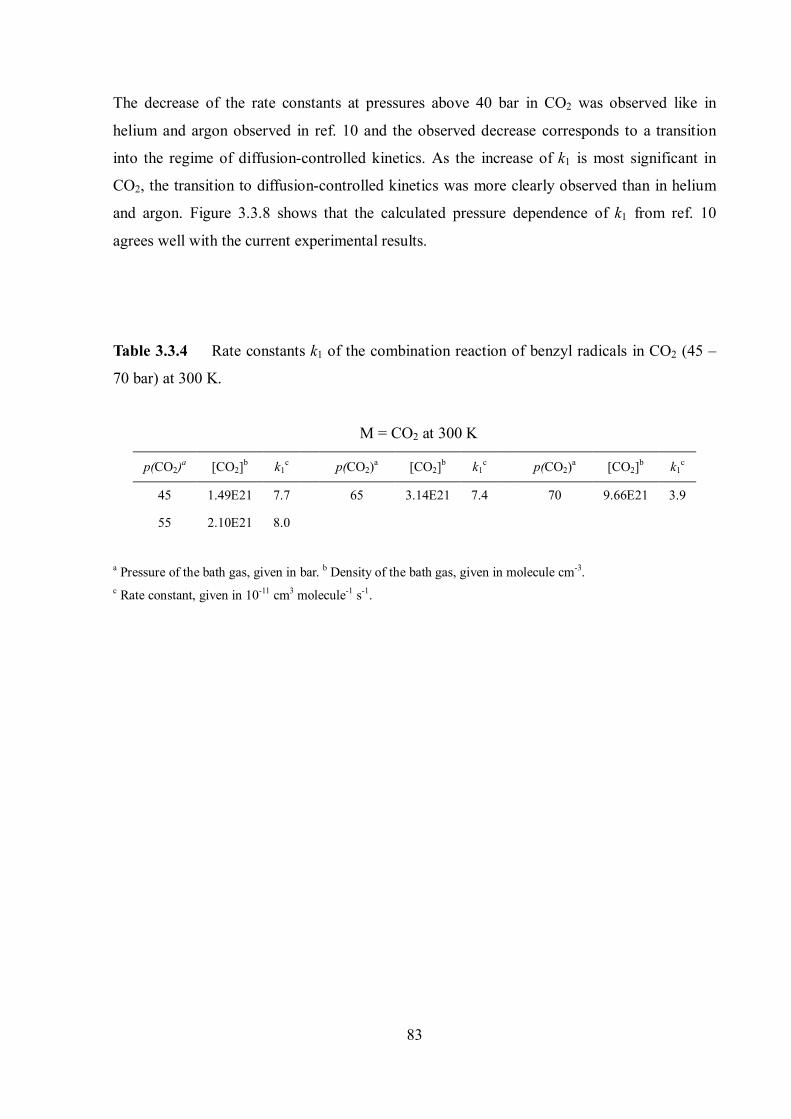
83
The decrease of the rate constants at pressures above 40 bar in CO2 was observed like in
helium and argon observed in ref. 10 and the observed decrease corresponds to a transition
into the regime of diffusion-controlled kinetics. As the increase of k1 is most significant in
CO2, the transition to diffusion-controlled kinetics was more clearly observed than in helium
and argon. Figure 3.3.8 shows that the calculated pressure dependence of k1 from ref. 10
agrees well with the current experimental results.
Table 3.3.4 Rate constants k1 of the combination reaction of benzyl radicals in CO2 (45 –
70 bar) at 300 K.
M = CO2 at 300 K
p(CO2)a [CO2]b k1c p(CO2)a [CO2]b k1
c p(CO2)a [CO2]b k1c
45 1.49E21 7.7 65 3.14E21 7.4 70 9.66E21 3.9
55 2.10E21 8.0
a Pressure of the bath gas, given in bar. b Density of the bath gas, given in molecule cm-3. c Rate constant, given in 10-11 cm3 molecule-1 s-1.
84
Chapter 4
Discussion and outlook
4.1 Transient absorption spectra of benzyl-type radicals
The shape of the room-temperature gas-phase transient absorption bands of p-
fluorobenzyl near 256 nm and of p-methylbenzyl radicals near 263 nm does not significantly
differ from that of benzyl radicals. In Figure 4.1, we compare the transient absorption spectra
of these radicals. The absorption maxima, corresponding to the X2B2 42B2 transition, are
shifted to the red for the p-fluorobenzyl radicals (max. at ca. 256 nm), for the cumyl radicals
(max. at ca. 258 nm) and for the p-methylbenzyl radicals (max. at ca. 263 nm), compared to
benzyl radicals (max. at 255 nm). Claridge and Fischer43 investigated several electronic
spectra of substituted benzyl radicals in cyclohexane at 295 K. Three band systems have been
known with 0-0 transitions from the 2B2 ground electronic state to the 42B2 (near 258 nm),
22A2 (near 316 nm), and 12A2 (near 463 nm) excited states, respectively. The authors found
similar red shifts of the absorption maxima of the X2B2 42B2 transition for substituted
benzyl radicals; e.g., absorption maxima in cyclohexane lie at 258 nm for benzyl radical, at
269 nm for 4-chlorobenzyl, and at 263 nm for 4-methoxybenzyl radicals.
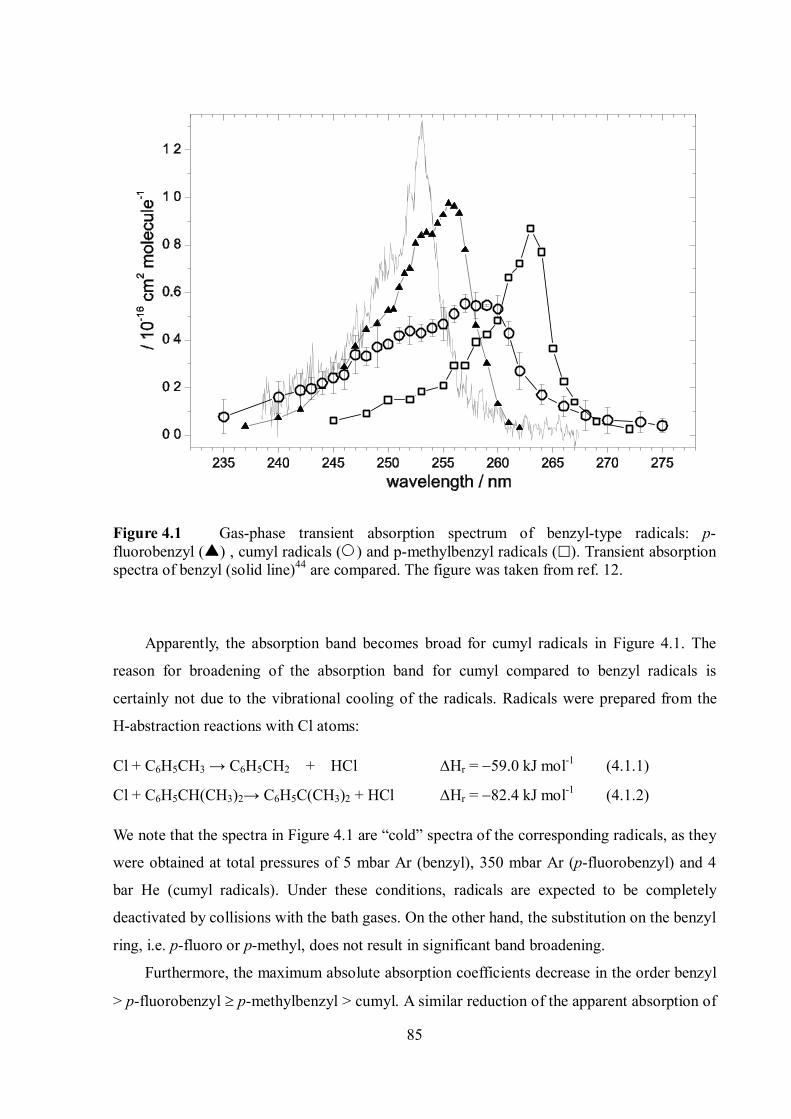
85
Figure 4.1 Gas-phase transient absorption spectrum of benzyl-type radicals: p-fluorobenzyl () , cumyl radicals () and p-methylbenzyl radicals (). Transient absorption spectra of benzyl (solid line)44 are compared. The figure was taken from ref. 12.
Apparently, the absorption band becomes broad for cumyl radicals in Figure 4.1. The
reason for broadening of the absorption band for cumyl compared to benzyl radicals is
certainly not due to the vibrational cooling of the radicals. Radicals were prepared from the
H-abstraction reactions with Cl atoms:
Cl + C6H5CH3 → C6H5CH2 + HCl Hr = 59.0 kJ mol-1 (4.1.1)
Cl + C6H5CH(CH3)2→ C6H5C(CH3)2 + HCl Hr = 82.4 kJ mol-1 (4.1.2)
We note that the spectra in Figure 4.1 are “cold” spectra of the corresponding radicals, as they
were obtained at total pressures of 5 mbar Ar (benzyl), 350 mbar Ar (p-fluorobenzyl) and 4
bar He (cumyl radicals). Under these conditions, radicals are expected to be completely
deactivated by collisions with the bath gases. On the other hand, the substitution on the benzyl
ring, i.e. p-fluoro or p-methyl, does not result in significant band broadening.
Furthermore, the maximum absolute absorption coefficients decrease in the order benzyl
> p-fluorobenzyl p-methylbenzyl > cumyl. A similar reduction of the apparent absorption of
86
the 258 nm band was observed in several substituted benzyl radicals in solution.43 For
example, they found that the addition of a second chlorine to the benzyl ring lowers the
absorption coefficients to ca. 56 %. The authors excluded the possible complex formation of
radicals with parent molecules in solution as the reason for such a reduction, as suggested by
Sangster et al.,45 however the reason for such an experimental observation still remains
unclear.
We note here that recombination rate constants (k) obtained in this thesis are from a
model based on second-order kinetics, where we assumed that the absorption coefficients of
the radicals are insensitive to the change of density of the solvent medium. There were some
apparent experimental indications that the change in absorption coefficients of benzyl, p-
fluorobenzyl and p-methylbenzyl radicals as a function of pressure was only a minor effect,
see for example, Figure 3.1.4 and Figure 3.2.7. We note, however, that there is growing
experimental evidence of a density-dependent spectral shift and broadening of the absorption
bands of the benzyl type radicals from a recent work of Sölter et al.46 When the details of the
pressure-dependent absorption coefficients of the radicals as a function of the pressure of the
bath gas, especially CO2, are available, the density-dependent enhancement of the
recombination rate constants obtained in this thesis has to be revisited.
4.2 Limiting high-pressure rate constants of the ET mechanism
In the following sections, we compare the current results on the pressure- and
temperature-dependent radical recombination rate constants for three benzyl-type radicals, i.e.
benzyl, p-fluorobenzyl and p-methylbenzyl radicals. This can be done from different aspects
of the Energy-Transfer mechanism, Radical-Complex mechanism and finally diffusion-
controlled kinetics. Figure 4.2 summarizes the current results of the pressure dependence of
krec for those three benzyl-type radicals. Several points can be made. First, the experimental
limiting high-pressure rate constants of the Energy-Transfer mechanism, ETk for the three
benzyl-type radicals are very similar (compare the pressure-independent krec values below ca.
5 bar):
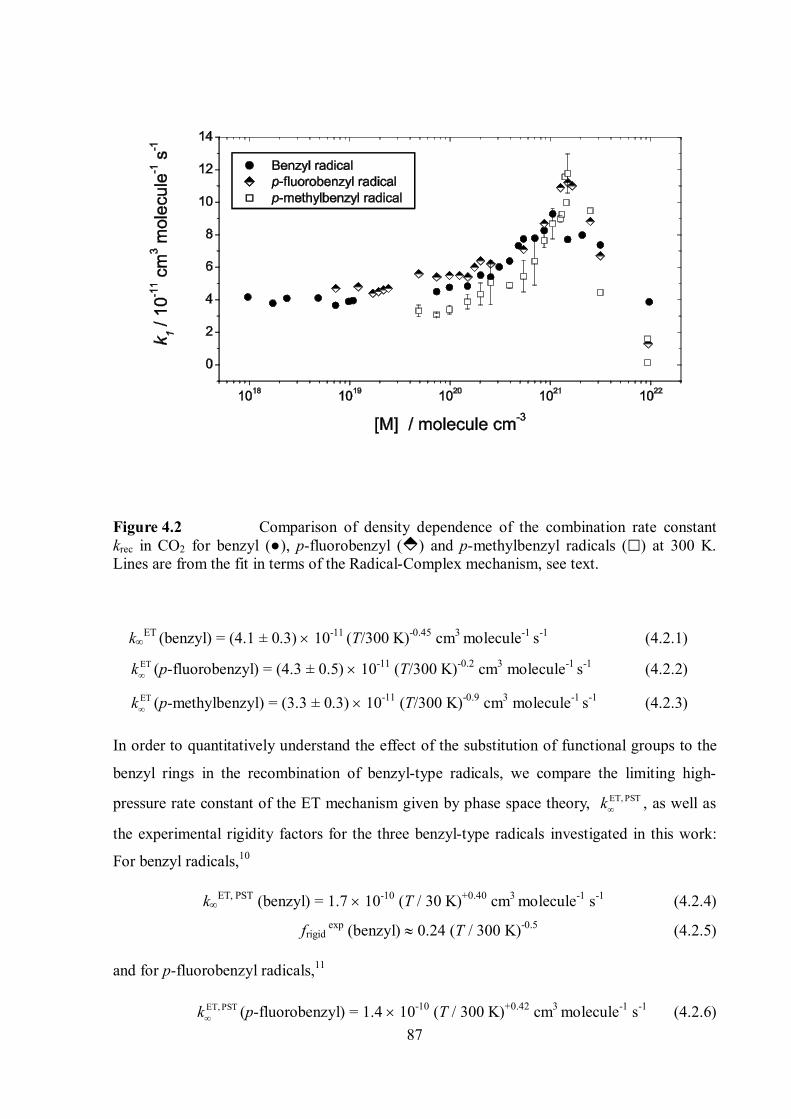
87
Figure 4.2 Comparison of density dependence of the combination rate constant krec in CO2 for benzyl (●), p-fluorobenzyl () and p-methylbenzyl radicals () at 300 K. Lines are from the fit in terms of the Radical-Complex mechanism, see text.
kET (benzyl) = (4.1 ± 0.3) 10-11 (T/300 K)-0.45 cm3 molecule-1 s-1 (4.2.1)
ETk (p-fluorobenzyl) = (4.3 ± 0.5) 10-11 (T/300 K)-0.2 cm3 molecule-1 s-1 (4.2.2)
ETk (p-methylbenzyl) = (3.3 ± 0.3) 10-11 (T/300 K)-0.9 cm3 molecule-1 s-1 (4.2.3)
In order to quantitatively understand the effect of the substitution of functional groups to the
benzyl rings in the recombination of benzyl-type radicals, we compare the limiting high-
pressure rate constant of the ET mechanism given by phase space theory, ET, PSTk , as well as
the experimental rigidity factors for the three benzyl-type radicals investigated in this work:
For benzyl radicals,10
kET, PST (benzyl) = 1.7 10-10 (T / 30 K)+0.40 cm3 molecule-1 s-1 (4.2.4)
frigid exp (benzyl) 0.24 (T / 300 K)-0.5 (4.2.5)
and for p-fluorobenzyl radicals,11
ET, PSTk (p-fluorobenzyl) = 1.4 10-10 (T / 300 K)+0.42 cm3 molecule-1 s-1 (4.2.6)
88
exprigidf (p-fluorobenzyl) 0.31 (T / 300 K)-0.6 (4.2.7)
ET, PSTk appear to decrease only slightly on the absolute scale, and slightly increasing
experimental rigidity factors as benzyl p-fluorobenzyl.
4.3 RC mechanism
Secondly, the enhancement of krec beyond the ETk value was observed for all three
benzyl-type radicals in the present work, which qualitatively resembles that of benzyl radicals.
Quantitatively, however, its onset is observed to occur earlier for p-fluorobenzyl radicals (at
already ca. 5 bar) than for benzyl radicals (ca. 10 bar). Furthermore, the degree of the
enhancement of krec at higher pressures (before the onset of diffusion control) is somewhat
increasing in the order benzyl < p-fluorobenzyl < p-methylbenzyl radicals. This indicates that
the limiting high-pressure rate constant of the radical-complex mechanism, kAM+AM, is slightly
sensitive to additional substitution of functional groups at the para-position of the benzyl
rings: this may influence the rotational hindrance of the radicals and eventually the
recombination kinetics.
4.4 Effect of steric hindrance on the recombination rates
The question of the steric effect of the reactants on the recombination rate constants is an
interesting but difficult one to answer. For example, from the evaluation of experimental high-
pressure rate constants of the radical recombination reactions from Cobos and Troe,47 ET, PSTk values seem less sensitive to the change of the molecular complexity of the radicals in
a series of methyl-type radical reactions, while ETk becomes slower for heavier and larger
CCl3 radicals:
CH3 + CH3 C2H6; ET, PSTk = 3.010-10 and ETk = 4.710-11 cm3 molecule-1 s-1 (4.4.1)
CCl3+CCl3 C2Cl6; ET, PSTk = 3.710-10 and ETk = 1.010-11 cm3 molecule-1 s-1 (4.4.2)
For tert-butyl radical recombination, an even slower ETk 410-12 cm3 molecule-1 s-1 was
reported in ref. 48. It is interesting to note that Naroznik and Niedzielski predict a “stronger”
89
negative temperature dependence (n) in ET 300 nk T K as CH3 (n = 0.5, over 300700 K) <
tert-butyl (n = 1.5) and attribute this due to the steric hindrance. Interesting comparative study
to our current results is the investigation of reactive of polycyclic aromatic aryl radicals in the
gas-phase. Chen et al.49 investigated the reactions of phenyl, 1- and 2-naphtahlenyl, and 9-
anthracenyl radicals with toluene and naphthalene in the gas-phase at 400 and 450 °C. The
relative arylation rates with toluene were almost similar for all 4 radicals, regardless of the
complexity of the substitutients to the benzyl-ring. It is important to note that, in order to
correlate the kinetic data with respect to the steric effect of the radicals in the recombination
reaction, the quantity which one has to compare is probably the rigidity factor, not the
absolute limiting high-pressure rate constants.12
Such an interpretation can be however irrelevant unless one determines the correct
diffusion kinetics of the radicals, where in most cases the interaction between radical and
solvent molecules is not considered. The measured values in solution can be simply reflecting
the difference in diffusion coefficients of the corresponding radicals, rather than the reactivity
of the steric hindrance effect. We state another experimental example. Claridge and Fischer
investigated self-termination reaction of several substituted benzyl radicals in solution and
discussed about the question whether the slower rates of some of the substituted benzyl
radicals, especially 2-chloro and 2-methoxybenzyl, are deviations from complete diffusion
control caused by steric factors.43 The measured termination rate constants (kt) in cyclohexane
decrease from 3.9, 3.1, 1.810-12, cm3 molecule-1 s-1 for benzyl, 4-chlorobenzyl and 2-
chlorobenzyl radicals, respectively. Considering diffusion coefficients of corresponding
substituted toluene, the ratio of kt / kdiff was found to be decreasing in the order benzyl (1.23)
> 4-chlorobenzyl (1.10) > 2-chlorobenzyl (0.64) radicals. The authors attributed this reduction
of the ratio kt / kdiff for more substituted benzyl radicals to the steric hindrance effect. However,
it should be mentioned that these authors estimated the diffusion rate constants by the
Smoluchowski equation with the diffusion coefficient, D, of the radical approximated by that
of the corresponding hydrocarbon, RH: this is then assumed to be the upper limit of the
recombination rate constants in solution. At this moment, we can only emphasize the
importance of estimate the correct diffusion coefficients of radicals, which must have been
overestimated in the work of Claridge and Fischer.43 Therefore, we cannot tell if their
observation of reduced termination rate constants in cyclohexane for substituted benzyl
radicals is correlated to the steric hindrance alone or due to the combination of slower
diffusion rate constant and steric effects.
90
4.5 Common features of the role of the RC mechanism in combination reactions of “small” polyatomic and “large” organic radicals We have presented experimental results of the radical combination reactions of several
benzyl-type radicals over the gas-to-liquid transition range. The reaction systems which have
been studied here can be grouped into two categories including previous works: one case
where the limiting high-pressure rate constant of the energy-transfer mechanism (kET) is
reached at already ca. 1 bar, and the other case where kET can be reached at relatively higher
pressures (e.g., at ca. 1000 bar) such that the diffusion-controlled kinetics starts influencing
on the recombination rate constants at pressures where kET is not yet reached. The former
system includes the combination reactions of CCl3+CCl3, CCl3+Br,7 the self-combination
reactions of benzyl radicals,10 p-fluorobenzyl radicals11 and preliminary results of p-
methylbenzyl radical recombinations from this thesis. The latter system covers CCl3+O2,50
O+O2,1,21 and unpublished results of self-combination of ClO radicals.6 As a general rule, in
the latter case, one cannot easily identify and/or separate the role of radical-complex
mechanism from the measured recombination rate constants (krec). This is mainly because the
increasing contribution from the radical-complex mechanism on krec values is added up at
higher pressures but still the resulting fall-off curves can appear smooth without revealing an
S-shape. Furthermore, near 1000 bar, the diffusion-controlled kinetics will bring down krec
values for most polyatomic radicals, then it is difficult to determine the limiting high-pressure
values of both mechanisms. Therefore, such experimental observations of the enhancement of
recombination rate constants of large organic radicals in the gas-to-liquid transition region
where density-independent kET is expected, lay the groundwork for identifying and
understanding the role of the RC mechanism in radical combination reactions.
4.6 The nature of the radical-solvent molecule interaction
While AM concentrations influence (linearly or quadratically) kRC, the competing ET
dynamics is not restricted to the remaining and decreasing concentration of uncomplexed
[A]eq = [A] – [AM]eq. Radical complexes can as well participate in an ET type dynamics, e.g.
AM + A + M → A2M + M (or A2 + 2M). Interesting differences may influence the shape of
the pressure-dependent transition from k0RC to kRC. If radical complexes AM are very weak,
with correspondingly short life times of AM, the reactions really follow the original
“chaperon” model. In these cases the reaction always process under dynamical “high pressure
91
conditions”, i.e. “stabilization” of A2 (by A2M A2 + M or A2M2 A2 + 2 M) is faster than
the alternative “redissociation” (A2M A + AM or A2M2 AM + AM).” In all such cases
the transition corresponds to the same curve of transition k0 → k which is simply the density
dependent increase and saturation of the AM concentration (neglecting here higher
complexes). If however AM complexes are bound sufficiently strongly, fast stabilization of
the A2 or A2M product from AM + AM by dissociation of an M is no longer automatically
guaranteed. In such cases even at the saturation level of AM concentration the combination
reaction may show further pressure dependence of the ET-type, when the AM “complexes”
then mainly behave like somewhat larger ordinary molecules (AM+AM+M), stabilized by
additional bath gas collisions.
The interpretation of our observations in terms of a contribution from the radical-
complex mechanism can only be correct if the rate constants for the reaction AM+AM are
larger than the corresponding values for A+A (likewise, the reaction AM+BM should be faster
than A+B). If kAM+A and kAM+AM would not be larger than kA+A, then no rate constant
enhancement of krec would have been observed. It is, therefore, of central importance to
rationalize the conclusion about the order of the rate constants, i.e. kA+A < kAM+A < kAM+AM.
Our current interpretation in terms of the different rigidity factor appears consistent with
the experimental observations. At present these interpretations still have some hypothetical
character and need further backup from quantitative tests in other experimental systems and
from detailed CT calculations of the capture process on improved potential surfaces. Both are
underway and a corresponding comprehensive treatment will be given in the future. However
the present study already provides another piece of experimental evidence for the assumed
role of the radical-complex mechanism: A pronounced negative temperature dependence of
the rate constant enhancement at the elevated densities was observed, just in line with basic
expectations for increasing contributions from radical-complex mechanism at decreasing
temperatures.
92
References
(1) Hippler, H.; Rahn, R.; Troe, J. J. Chem. Phys. 1990, 93, 6560.
(2) Hippler, H.; Luther, K.; Troe, J. Chem. Phys. Lett. 1972, 16, 174.
(3) Hippler, H.; Luther, K.; Troe, J. Ber. Bunsen Phys. Chem. 1973, 77, 1020.
(4) Hippler, H.; Troe, J. Int. J. Chem. Kin. 1976, 8, 501.
(5) Baer, S.; Hippler, H.; Rahn, R.; Siefke, M.; Seitzinger, N.; Troe, J. J. Chem.
Phys. 1991, 95, 6463.
(6) Stark, H. Ph.D. Thesis, Göttingen University, 1999.
(7) Oum, K.; Luther, K.; Troe, J. J. Phys. Chem. A 2004, 108, 2690.
(8) Fernandes, R. X.; Luther, K.; Troe, J. J. Phys Chem. A 2006, 110, 4442.
(9) Oum, K.; Sekiguchi, K.; Luther, K.; Troe, J. Phys. Chem. Chem. Phys. 2003,
5, 2931
(10) Luther, K.; Oum, K.; Sekiguchi, K.; Troe, J. Phys. Chem. Chem. Phys. 2004,
6, 4133.
(11) Lee, C. Y.; Luther, K.; Oum, K.; Troe, J. J. Phys. Chem. A. 2006, 110, 2613.
(12) Oum, K. Habilitation Thesis, Uni. Göttingen, 2008.
(13) Lindemann, F. A. Trans. Faraday Soc. 1921, 17, 598.
(14) Christiansen, J. A. Ph.D thesis, Universitaet Kopenhagen, 1921.
(15) Troe, J. J. Phys Chem. 1979, 83, 114.
(16) Porter, G.; Smith, J. A. Proc. Roy. Soc., A 1961, 261, 28.
(17) Eusuf, M.; Laidler, K. J. Trans. Faraday Soc. 1963, 59, 2790.
(18) Rabinowitch, E. Trans. Faraday Soc. 1937, 33, 283.
(19) Bunker, D. L.; Davidson, N. J. Am. Chem. Soc. 1958, 80, 5090.
(20) Schwarzer, D.; Teubner, M. J. Chem. Phys. 2002, 116, 5680.
(21) Luther, K.; Oum, K.; Troe, J. Phys. Chem. Chem. Phys. 2005, 7, 2764.
(22) Troe, J. Ann. Rev. Phys. Chem. 1978, 29, 223.
(23) Atkinson, R. Chem. Rev. 1986, 86, 69.
(24) Robaugh, D.; Tsang, W. J. Phys Chem. 1986, 90, 4159.
(25) Braun-Unkhoff, M.; Frank, P.; Just, T. 22nd Symposium on Combustion,
93
1988, Seattle.
(26) Litzingen, T. A.; Brezinsky, K.; Glassman, I. Combustion Flame 1986, 63,
251.
(27) Noziere, B.; Lesclaus, R.; Hurley, M. D.; Dearth, M. A.; Wallington, T. J. J.
Phys. Chem. 1994, 98, 2864.
(28) Poulter, T. C. Phys. Rev. 1930, 35, 297.
(29) Poulter, T. C. Phys. Rev. 1932, 40, 860.
(30) Bridgeman, P. W. Rev. Mod. Phys. 1946, 18, 1.
(31) Hahn, J. Ph.D. Thesis, Uni. Göttingen, 2004.
(32) Porter, G. Proc. Roy. Soc. London 1950, A200, 284.
(33) Norrish, R. G. W.; Porter, G. Proc. Roy. Soc. London 1952, A210, 439.
(34) Handbook, LOT-Orel.
(35) Husain, D.; Pritchard, H. O. J. Chem. Phys. 1959, 30, 1101.
(36) Kajimoto, O. Chem. Rev. 1999, 99, 355.
(37) Brennecke, J.; Chateauneuf, J. E. Chem. Rev. 1999, 99, 433.
(38) Gao, D. F.; Stockwell, W. R.; Milford, J. B. J. Geophys. Res. [Atmos] 1995,
100, 23153.
(39) Hansen, J. C.; Francisco, J. S. Chem. Phys. Chem 2002, 3, 833.
(40) Keck, J. C. J. Chem. Phys. 1958, 29.
(41) Hippler, H.; Luther, K.; Troe, J. Ber. Bunsen Phys. Chem. 1973, 77, 1104.
(42) Ikeda, N.; Nakashima, N.; Yoshihara, K. J. Phys. Chem. 1984, 88, 5803.
(43) Clarldge, R. F. C.; Fischer, H. J. Phys. Chem. 1983, 87, 1960.
(44) Fay, N. Untersuchungen zur Temperatureabhängigkeit des Energietransfers
hoch schwingungsangeregten Biphenylens. Ph. D. Thesis, Göttingen University, 1997.
(45) McAskill, N. A.; Sanster, D. F. Aust. J. Chem. Soc. 1977, 30, 2107.
(46) Sölter, L. Diploma Thesis, Uni. Göttingen, 2008.
(47) Cobos, C. J.; Hippler, H.; Luther, K.; Ravishankara, A. R.; Troe, J. J. Phys.
Chem. 1985, 89, 4332.
(48) Naroznik, M.; Niedzielski, J. Theor. Chem. Acc. 2002, 108, 103.
(49) Chen, R. H.; Kafafi, S. A.; Stein, S. E. J. Am. Chem. Soc. 1989, 111, 1418.
(50) Luther, K.; Oum, K.; Troe, J. J. Phys. Chem. A 2001, 105, 5535.
(51) Shimada, T.; Ojima, Y.; Nakashima, N.; Izawa. Y.; Yamanaka. C.
J. Phys. Chem. 1992, 96, 6298
(52) Brand. U.; Hippler. H.; Lindemann. L.; Tro. J. J. Phys. Chem. 1990, 94, 6305

94
(53) Bolovinos, A.; Philis, J.; Pantos, E.; Tsekeris, P.; Andritsopoulos. G.. J. Mol.
Spectrosc. 1982, 94, 55
(54) Brouser, L. D.; Mueller-Markgraf. W.; Troe. J. J. Phys. Chem. 1988, 92, 4905
(55) Wallington, T. J.;Skewes, L. M.; Siegl, W.O. J. Photochem. Photobio, A:
chemistry. 1988, 45, 167
(56) Shi. J.; Bernhard, M. J. Int. Jour. Chem. Kinet. 1997, 29, 349
95
Curriculum Vitae
Persönliche Daten
Name Changyoul Lee
Geburtsdatum 20. 01.1975
Geburtsort Cheonan-si, Südkorea
Staatsangehörigkeit Südkorea
Ausbildung
03/1991 - 02/1993 Allgemeine Hochschulreife (Jungang High School, Südkorea)
03/1993 - 02/2000 Chemiestudium an der Chungnam National Universität in Daejeon,
Südkorea
02/2000 B. Sc in Chemie
11/1994 - 01/1997 Wehrdienst
03/2000 - 02/2002 Masterarbeit mit dem Titel “Electroacoustic application for the
enzymatic reaction; the hydrolysis of urea catalyzed by urease" in
der Gruppe von Prof. Dr. Joong-Gill Choi an der Yonsei Universität
in Seoul, Südkorea
02/2002 M. Sc in Chemie
05/2003 - 03/2004 Gastwissenschaftler von PD. Dr. Kawon Oum am Institut für
Physikalische Chemie der Universität Göttingen, Deutschland
04/2004 - heute Doktorarbeit mit dem Titel “ Pressure and temperature dependence
of recombination reactions of benzyl-type radicals” in der Gruppe
von Prof. Dr. J. Troe und PD. Dr. K. Oum am Institut für
Physikalische Chemie der Universität Göttingen, Deutschland