Embed Size (px)
Citation preview
Pressure Vs TemperaturePressure Vs Temperature
A Second Look at Nature’s A Second Look at Nature’s Natural Temperature Scale.Natural Temperature Scale.
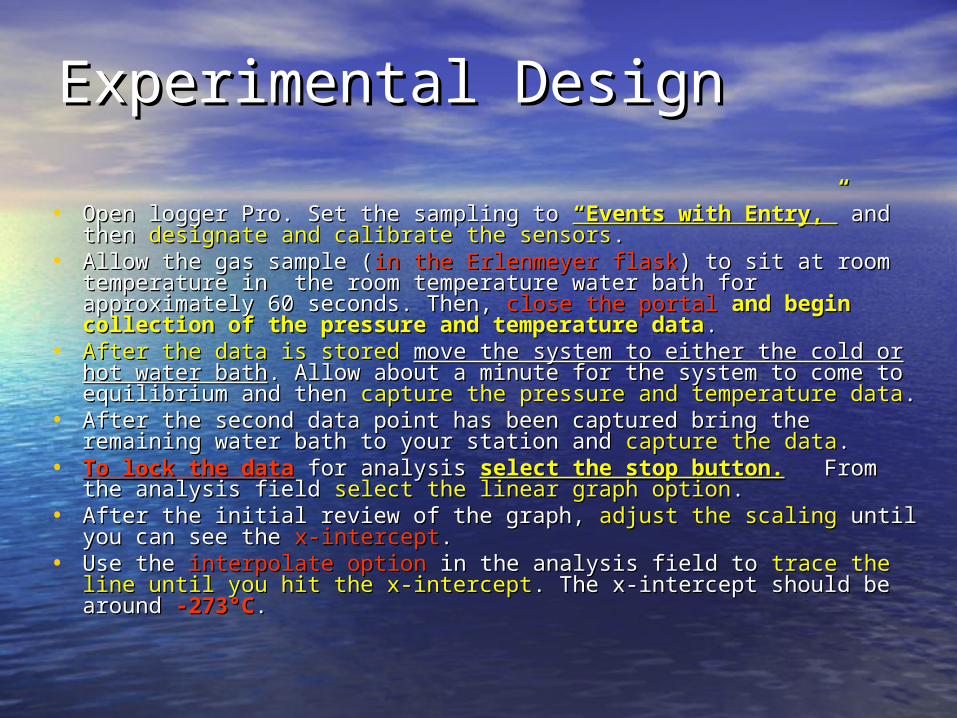
Experimental DesignExperimental Design
• Open logger Pro. Set the sampling to Open logger Pro. Set the sampling to “Events with Entry,”“Events with Entry,” and and then then designate and calibrate the sensorsdesignate and calibrate the sensors..
• Allow the gas sample (Allow the gas sample (in the Erlenmeyer flaskin the Erlenmeyer flask) to sit at room ) to sit at room temperature in the room temperature water bath for approximately temperature in the room temperature water bath for approximately 60 seconds. Then, 60 seconds. Then, close the portalclose the portal and begin collection of the and begin collection of the pressure and temperature datapressure and temperature data..
• After the data is storedAfter the data is stored move the system to either the cold or hot move the system to either the cold or hot water bathwater bath. Allow about a minute for the system to come to . Allow about a minute for the system to come to equilibrium and then equilibrium and then capture the pressure and temperature datacapture the pressure and temperature data..
• After the second data point has been captured bring the remaining After the second data point has been captured bring the remaining water bath to your station and water bath to your station and capture the datacapture the data..
• To lock the dataTo lock the data for analysis for analysis select the stop button.select the stop button. From the From the analysis field analysis field select the linear graph optionselect the linear graph option..
• After the initial review of the graph, After the initial review of the graph, adjust the scalingadjust the scaling until you can until you can see the see the x-interceptx-intercept..
• Use the Use the interpolate optioninterpolate option in the analysis field to in the analysis field to trace the line until trace the line until you hit the x-interceptyou hit the x-intercept. The x-intercept should be around . The x-intercept should be around -273-273°C°C..
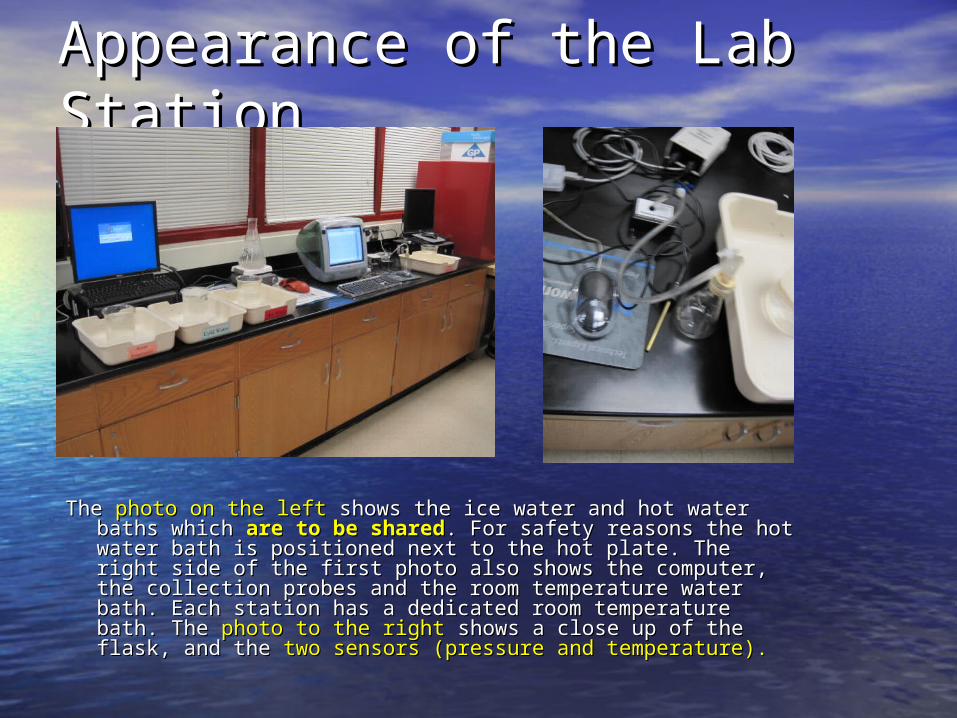
Appearance of the Lab Appearance of the Lab StationStation
The The photo on the leftphoto on the left shows the ice water and hot water baths shows the ice water and hot water baths which which are to be sharedare to be shared. For safety reasons the hot water . For safety reasons the hot water bath is positioned next to the hot plate. The right side of bath is positioned next to the hot plate. The right side of the first photo also shows the computer, the collection the first photo also shows the computer, the collection probes and the room temperature water bath. Each station probes and the room temperature water bath. Each station has a dedicated room temperature bath. The has a dedicated room temperature bath. The photo to the photo to the rightright shows a close up of the flask, and the shows a close up of the flask, and the two sensors two sensors (pressure and temperature).(pressure and temperature).
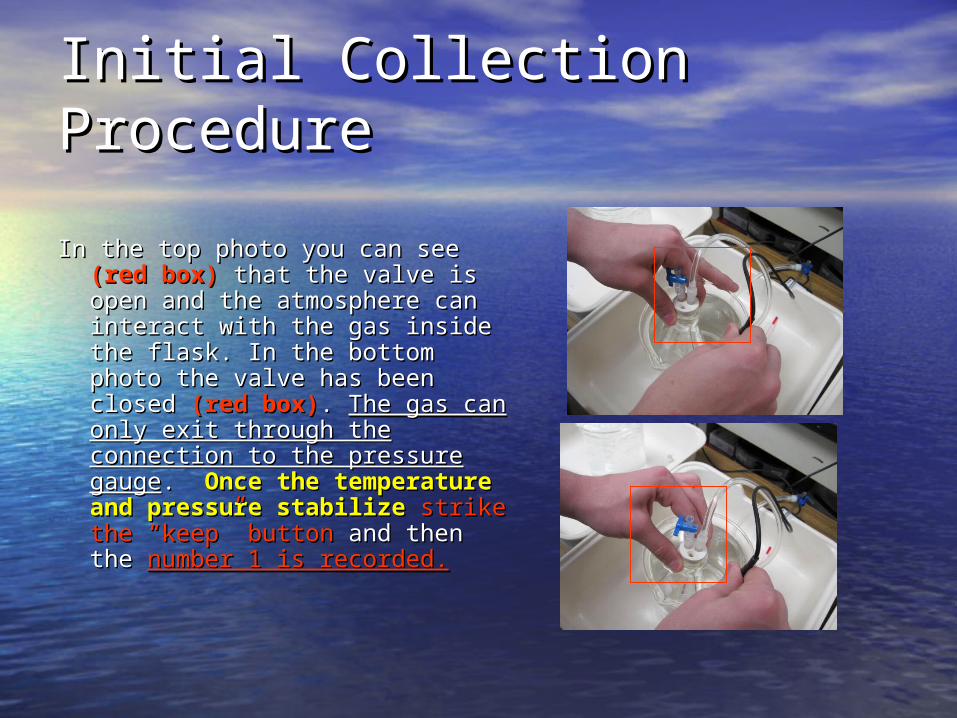
Initial Collection ProcedureInitial Collection Procedure
In the top photo you can see In the top photo you can see (red (red box)box) that the valve is open and that the valve is open and the atmosphere can interact the atmosphere can interact with the gas inside the flask. In with the gas inside the flask. In the bottom photo the valve has the bottom photo the valve has been closed been closed (red box)(red box). . The gas The gas can only exit through the can only exit through the connection to the pressure connection to the pressure gaugegauge. . Once the Once the temperature and pressure temperature and pressure stabilizestabilize strike thestrike the “keep”“keep” buttonbutton and then the and then the number 1 number 1 is recorded.is recorded.
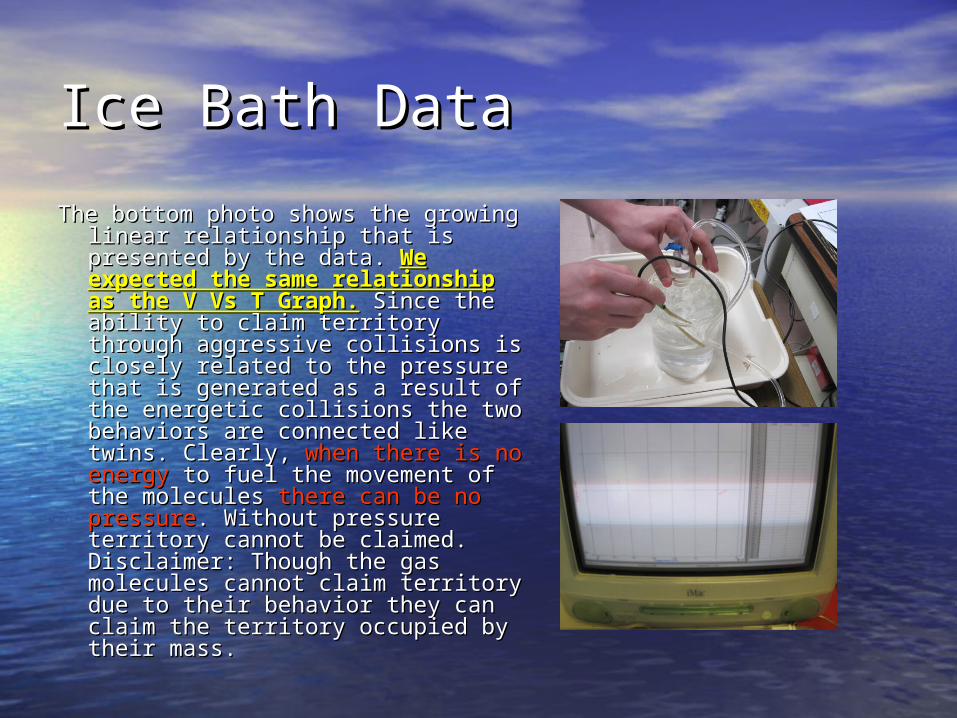
Ice Bath DataIce Bath Data
The bottom photo shows the growing The bottom photo shows the growing linear relationship that is presented linear relationship that is presented by the data. by the data. We expected the We expected the same relationship as the V Vs T same relationship as the V Vs T Graph.Graph. Since the ability to claim Since the ability to claim territory through aggressive territory through aggressive collisions is closely related to the collisions is closely related to the pressure that is generated as a pressure that is generated as a result of the energetic collisions the result of the energetic collisions the two behaviors are connected like two behaviors are connected like twins. Clearly, twins. Clearly, when there is no when there is no energyenergy to fuel the movement of the to fuel the movement of the molecules molecules there can be no pressurethere can be no pressure. . Without pressure territory cannot be Without pressure territory cannot be claimed. Disclaimer: Though the gas claimed. Disclaimer: Though the gas molecules cannot claim territory molecules cannot claim territory due to their behavior they can claim due to their behavior they can claim the territory occupied by their mass. the territory occupied by their mass.
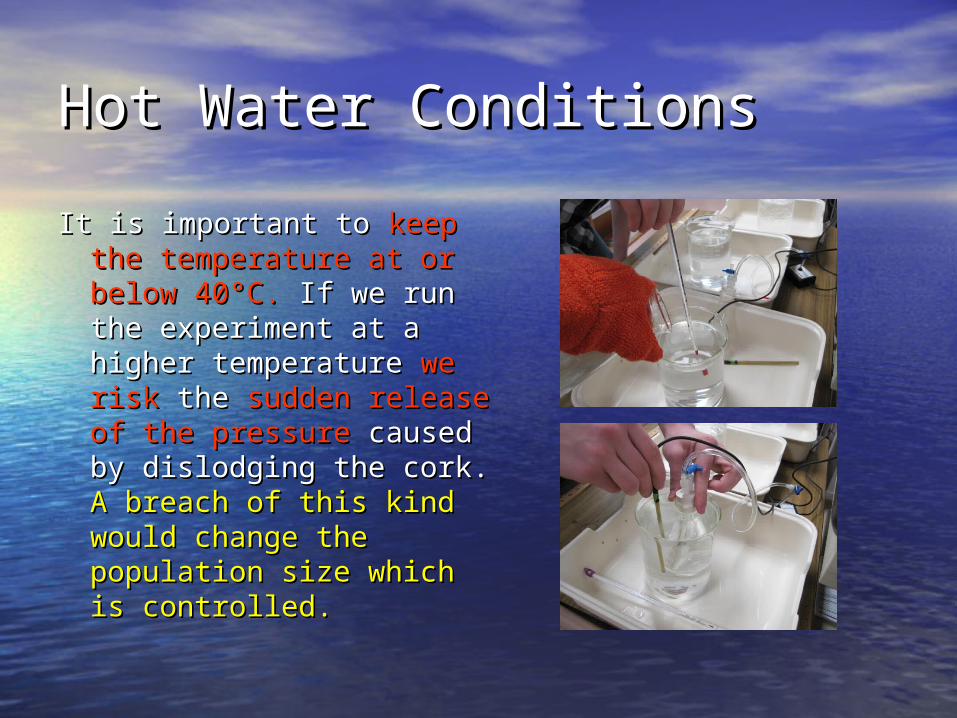
Hot Water ConditionsHot Water Conditions
It is important to It is important to keep the keep the temperature at or below temperature at or below 4040°C.°C. If we run the If we run the experiment at a higher experiment at a higher temperature temperature we riskwe risk the the sudden release of the sudden release of the pressurepressure caused by caused by dislodging the cork. dislodging the cork. A A breach of this kind would breach of this kind would change the population change the population size which is controlled.size which is controlled.
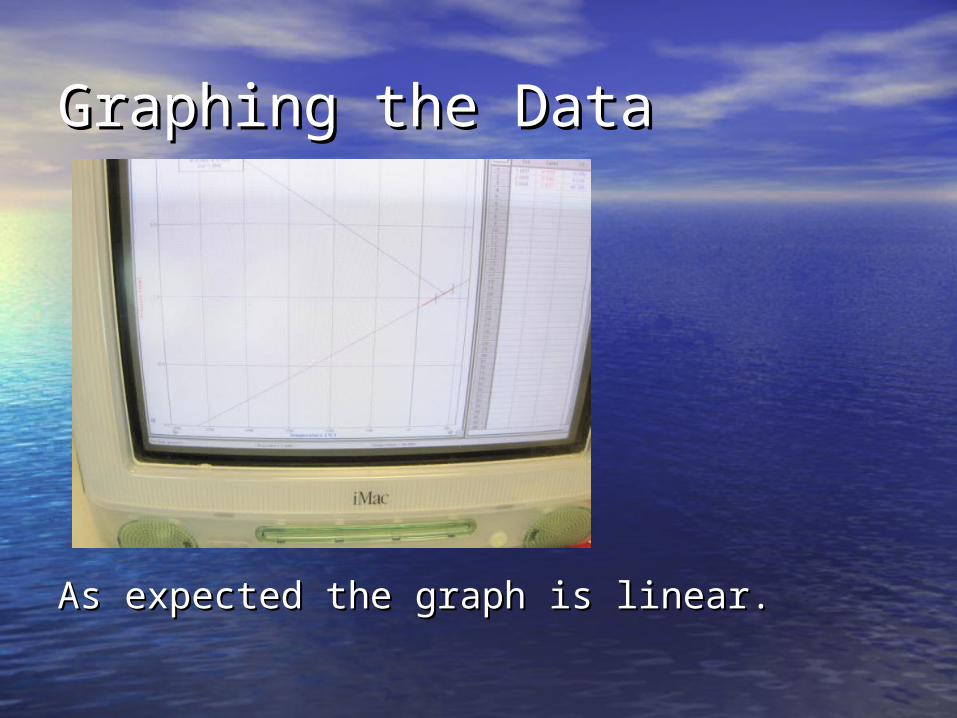
Graphing the DataGraphing the Data
As expected the graph is linear.As expected the graph is linear.
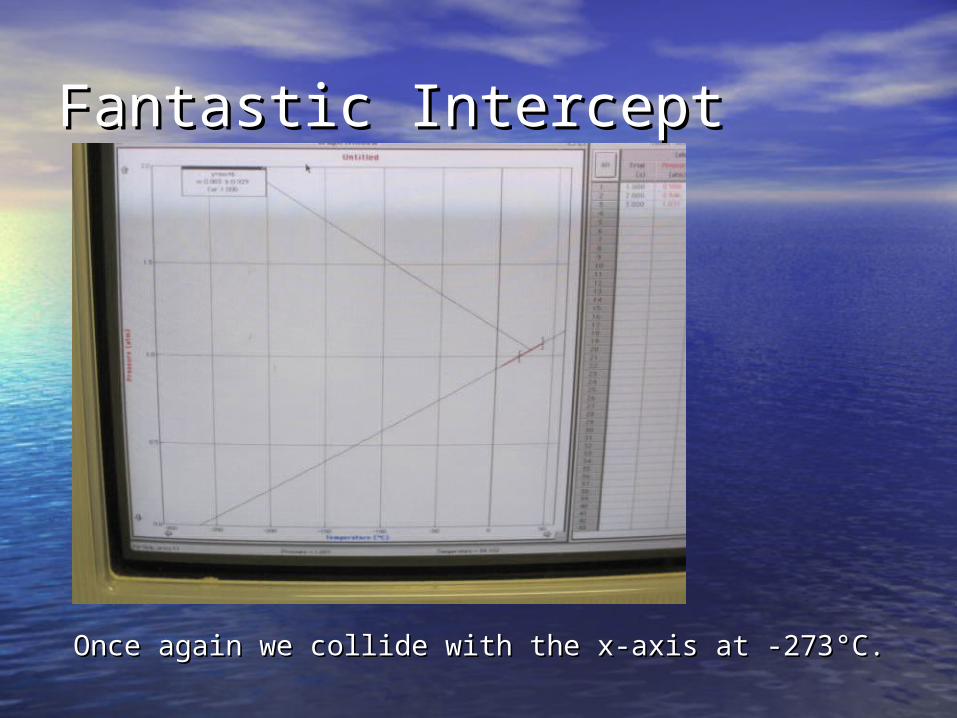
Fantastic InterceptFantastic Intercept
Once again we collide with the x-axis at -273Once again we collide with the x-axis at -273°C.°C.
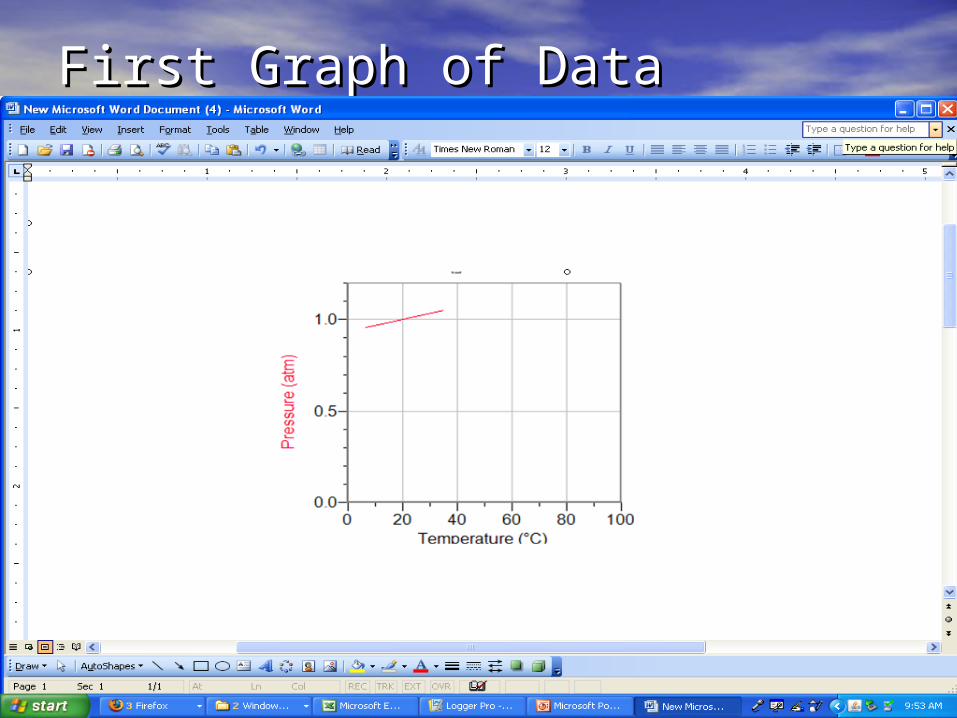
First Graph of DataFirst Graph of Data
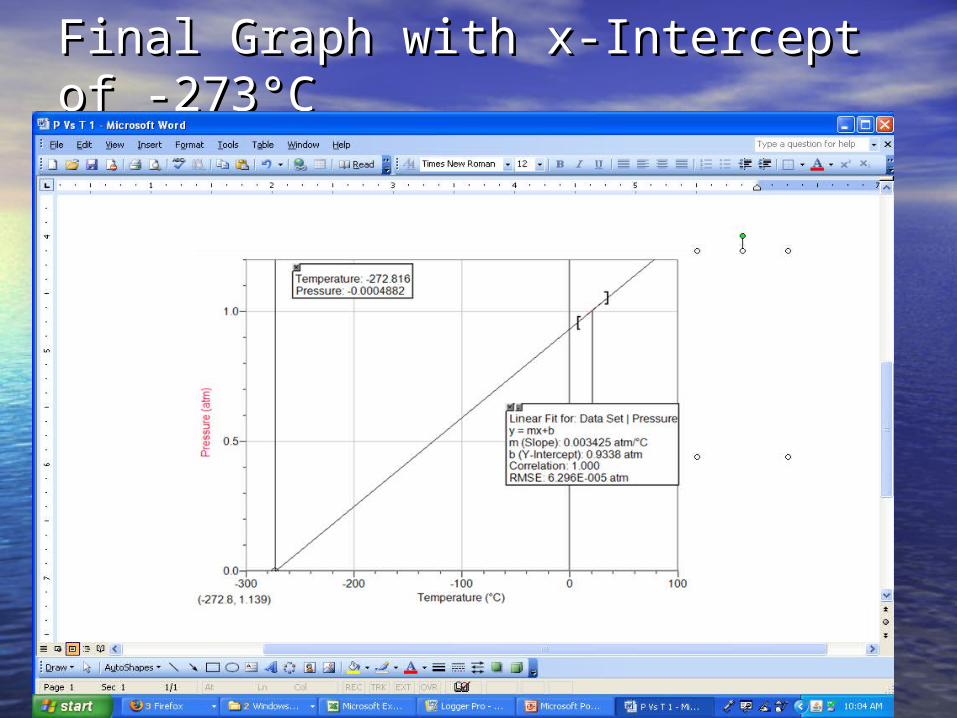
Final Graph with x-Intercept of -Final Graph with x-Intercept of -273273°C°C
Final ThoughtsFinal Thoughts
As mentioned earlier As mentioned earlier there is a direct relationship there is a direct relationship between the pressure generated by a gas and the between the pressure generated by a gas and the ability of that gas to obtain territory (occupy a ability of that gas to obtain territory (occupy a volume).volume). This lab allowed us to independently This lab allowed us to independently verify verify Nature’s Natural Temperature ScaleNature’s Natural Temperature Scale. The . The laws that grew from these experiments ( P Vs T and laws that grew from these experiments ( P Vs T and V Vs T) V Vs T) require usrequire us to use the Kelvin scale. to use the Kelvin scale. Never Never insert Celsius into any gas law equation.insert Celsius into any gas law equation. The The DVM relationships that we are using are true only DVM relationships that we are using are true only because we use Kelvin. because we use Kelvin. Unfortunately we seldom Unfortunately we seldom use Kelvin as our daily thermometeruse Kelvin as our daily thermometer. You must be . You must be prepared to convert Celsius to Kelvin and Kelvin prepared to convert Celsius to Kelvin and Kelvin back to Celsius. back to Celsius. The equation you require to make The equation you require to make these conversions came from this lab….K = these conversions came from this lab….K = °C + 273.°C + 273.
Lab Report RequirementsLab Report RequirementsAs mentioned in class I want you to As mentioned in class I want you to discuss the aggressive discuss the aggressive
naturenature of gases. In that discussion you must of gases. In that discussion you must explain how explain how gases use their aggressive nature to take territorygases use their aggressive nature to take territory. . You must clearly You must clearly examine what is going on in the flaskexamine what is going on in the flask as we as we expose the gas system to the three different temperatures. expose the gas system to the three different temperatures. Please be sure to Please be sure to use the language of scienceuse the language of science (independent and dependent variables, controls etc…). In a (independent and dependent variables, controls etc…). In a second paragraph second paragraph discuss the datadiscuss the data. Insert pictures from . Insert pictures from this powerpoint where appropriate. Fully explain what we this powerpoint where appropriate. Fully explain what we mean by Nature’s Natural Temperature Scale. mean by Nature’s Natural Temperature Scale. Make the Make the experience real to the readerexperience real to the reader ….. ….. That would be me That would be me ..
Every team did a fine jobEvery team did a fine job collecting the data. Your discussion of collecting the data. Your discussion of the data should include comments regarding what we look the data should include comments regarding what we look for in good data. for in good data. Explore possible sources of errorExplore possible sources of error (we (we mentioned a big one the day before the lab). For the truly mentioned a big one the day before the lab). For the truly motivated student, discuss how we could motivated student, discuss how we could quantify the quantify the possible impact of this major source of error.possible impact of this major source of error. Use your Use your math skills. The more you write the more you will learn. math skills. The more you write the more you will learn.