Embed Size (px)
Citation preview
PRESTRESSED CONCRETE CONTAINMENT MODEL
By Sami H. Rizkallal1 A. M. ASeE, Sidney H. Simmonds,2
and James G. MacGregor/ Members, ASeE
AeSTRACT: The construction and testing of a model of a prestressed concrete containment structure is described. The test structure consisted of a reinforced concrete base, cylindrical wall, ring beam and dome built of prestressed concrete with construction details patterned after the Canadian CANDU reactor containment. The overall height above the base was 12 ft-6 in. (3,810 mm), and the outer diameter was 10 ft-6 in. (3,200 mm). Internal pressure was obtained using water, and leakage was prevented by using a flexible plastic liner. Measurements made during the test included internal pressure, steel and concrete strains, crack widths and spacing, and curvatures at the base of the cylindrical wall. The test structure began to exhibit cracking at a pressure of 30 psi (0.28 MPa), and yielding of the reinforcement at approximately 110 psi (0.76 MPa). The structure displayed considerable ductility before failing at internal pressure of 159 psi (1.10 MPa) by rupture of three horizontal tendons at midheight of the wall. Outward deflection of the walls damaged the anchorage zones of some of the tendons. The cracking behavior and failure mechanism are described.
INTRODUCTION
Containment structures are built around the reactors and the primary containments in nuclear generating plants to enclose heat exchanges, and to prevent the release of any possible radioactive materials into the atmosphere. These structures frequently are constructed from prestressed concrete.
The design specification for the prototype secondary containment structure required that the concrete on the interior face remain free of tensile stresses under normal operating conditions, pressure test loading, a certain specified design basis accident pressure, and earthquake conditions. Consequently, the serviceability requirements under design basis accident pressure constitute one of the governing limit states of the structure design. The prototype structure did not have a steel liner.
Hypothesizing that internal pressure may increase without limit, a series of additional limit states can be identified. During a continuous increase of the internal pressure, areas of the interior face will be subjected to tension followed by cracking of concrete and yielding of the reinforcement. With further increases of the pressure, the cracks would penetrate through the concrete, followed, after further load, by plastic deformation of the reinforcement and prestressing tendons 'a{1d would finally rupture, an event which constitutes collapse of the structure.
To evaluate the behavior of such structures at these various limit states, a comprehensive analytical and experimental study was undertaken at the University of Alberta, Edmonton, Canada. The analytical techniques
IAssoc. Prof. of Civ. Engrg., Univ. of Manitoba, Winnipeg, Manitoba. 2prof. of Civ. Engrg., Univ. of Alberta, Edmonton, Alberta. lProf. of Civ. Engrg., Univ. of Alberta, Edmonton, Alberta. Note.-Discussion open until September 1, 1984. To extend the closing date
one month, a written request must be filed with the ASCE Manager of Technical and Professional Publications. The manuscript for this paper was submitted for review and possible publication on February 25, 1983. This paper is part of the Journal of Structural Engineering, Vol. 110, No.4, April, 1984. ~A5CE, 155N 0733-9445/84/0004-0730/$01.00. Paper No. 18761.
730
from the vertical wall. A 24-in. x 3D-in. (610-mm x 762-mm) tunnel along a diam provided access through the base to the interior of the structure through a 30-in. square hatch which was sealed by an aluminum door.
The thickness of the wall and dome were selected on the basis of construction of the test structure and the desired sequence of behavior rather
(a)
(b)
(e)
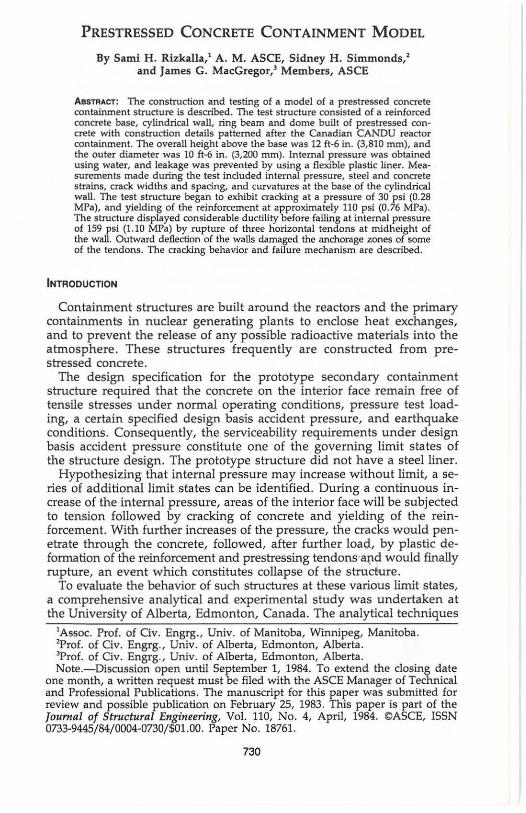
FIG. 4.-Relnforcement Details Prior to Placing Concrete: (a) Dome Reinforcement; (b) Base Reinforcement; (e) Wall Reinforcement
733

than as scaled values of the prototype. The dome thickness selected was 4 in. (100 mm) which was the minimum thickness that could be used to accomodate two l.O-in. (25-mm) ducts for post-tensioning in orthogonal directions, and two layers of reinforcing in each face, and to maintain 1/2-in. (13-mm) cover. For a similar reason, the wall thickness was selected as 5 in. (127 mm). The amounts of both horizontal and vertical prestressing were selected to obtain the desired cracking sequence.
The circumferential steel in the wall was provided by #3 bars (10 mm diam) spaced at 3 in. (76 mm) on centers with a yield strength of 50 ksi (345 MPa). Nominal 6-mm diam deformed bars conforming to Swedish specification with a yield paint of 70 ksi (482 MPa) were used for both the vertical wall reinforcing and dome reinforcing. Details of the reinforcing and prestressing tendons for base-wall connection, wall, and dome reinforcing are given in Fig. 3(a- c). Fig. 4(a- c) shows the base, wall, and dome reinforcing prior to placing of concrete. Further details are provided in Ref. 3.
Normal sand and gravel concrete with a maximum aggregate size of 3/8 in. (10 mm) and a compressive strength of 4,500 psi (30 MPa) was specified for the model. Liquid plasticizer Melment LlO was specified to improve workability. However .. due to delays in placing the concrete in the wall the life of the plasticizer was exceeded during casting of the wall, resulting in poor compaction of the concrete in the upper portion of the wall. This required chopping out the upper layer of the poorly compacted concrete. The remainder of the wall section was placed by shotereting. The properties of the two types of concrete were accounted for in the analysis of the test structure and did not significantly influence the behavior or the mode of failure .
POST-TENSIONING SEQUENCE
The vertical wall tendons were post-tensioned first. Each tendon was anchored at the base where a load cell was located and tensioned from the top. Four jacks were used so that four tendons located at 90° intervals around the perimeter could be pulled simultaneously to full tension of 14 kips (62 kN).
The horizontal wall tendons extended over only one-hall of the circumference to reduce friction, The tendons were anchored in vertical buttresses shown in Figs. 1 and 3(c). Adjacent pairs of tendons were staggered by 90° resulting in the four buttresses to accommodate the anchorages being located symmetrically around the wall. The two horizontal tendons at a given elevation were tensioned simultaneously from each end using four jacks to half the design tension in a sequence to maintain as close to a uniform stress distribution as possible. The same sequence was then used to retension all tendons to full design tension.
The dome tendons were tensioned in pairs using four jacks, one at each end, with a load cell at one end only. Starting with the tendon crossing the crown in one direction and progressing symmetrically to parallel tendons all of the tendons in one direction were stressed to half the design force, The sequence was repeated in the orthogonal direction. The same procedure was then used to pull the tendons to final values.
It was noted that with both the horizontal wall tendons and the dome
734
tendons some had to be retensioned to achieve final values within the acceptable tolerance, After all tendons had been fully stressed, they were grouted with cement grout using a pressure grouting system,
INSTRUMENTATION
Extensive measurements were made during the various tests of the containment structure. Measured quantities included internal pressure, deflections, steel and concrete strains, meridian rotations, crack widths and crack locations.
A total of 24 deflection readings were taken electronically along the meridian referred to as line 1. Line 1 extended from the base of the cylinder to the top of the dome and was located on the south face midway between buttresses, and along a circumferential line 2,25 ft (686 mm) from the base in the south quadrant,
Strains were measured using electric resistance gages along and across line 1 located, as previously mentioned, on line 2 located on the meridian diametrically opposite line 1, and on line 3 located along the southwest buttress. In addition, average strains were measured manually along and across line 2 using Demec mechanical extensometers. A total of 207 electric resistance strain gages located on steel reinforcing, 38 electrical resistance gages on concrete faces, and 74 Dernec gages were read.
Along a vertical line located 6 in, (150 mm) east of line 1 and starting at the base, a series of five 1/2 in, diam rods at 5 in, spacing protruded from the wall, Dial gages graduated in 0,0001 in, clivisions were mounted on these rods in such a manner that it was possible to compute the angle changes at each of the rods and the elongation of the midplane of the wall. From the angle changes the average curvatures and horizontal deflection of the wall could be calculated,
All the cr~cks observed on the west quadrant were marked with felt pens. Crack widths were measured across and along two vertical and two horizontal lines on both the north and west faces using a 40 power microscope, Readings were recorded to the nearest 0,001 in, (0,025 mm),
In general, strain and deflection readings were taken electronically at intervals of internal pressure of 5 psi and manual readings of crack widths and strain at 10 psi, although in later stages readings were taken at smaller intervals, the interval being controlled by strain measurements. Above 140 psi (0,97 MPa) only electronic readings were taken,
The internal pressure, deflections and electric resistance strain gages were read and recorded into data files automatically using the Nova 210/ E digital computer and data acquisition system. Manual readings were typed into computer files immediately after each test so that data reduction and plotting of results could be completed quickly using computer routines.
TESTING
Water was the agent used to develop the internal pressure in the test structure, The pressure was obtained using a hand-operated pump to pressures of 140 psi (0,97 MPa) above which a truck mounted, highcapacity, high-pressure pump was used, To prevent the water from leak-
735

ing through the containment wall after cracking and still provide the opportunity of viewing the interior concrete face after selected loading sequences, a removable liner made from a heavy plastic material was fitted to the inside surface. A series of five test runs below the initial cracking pressure were made to test the effectiveness of the liner and to evaluate the response of the instrumentation and data reduction routines. As a result of these runs the seal around the hatch was replaced and certain gages were replaced and rewired.
The first major loading sequence, referred to as load F, was terminated at an internal pressure of 80 psi (0.55 MPa) due to the difficulty of maintaining pressure because water was leaking through the cracks in the walls. After draining the tank and removing the liner it was found that several seams in the liner had failed. A new liner was fabricated that incorporated several modifications learned from experiences with the first liner. Using this liner the final load test, referred to as load G, was taken to rupture of the structure at a pressure of 159 psi (1.10 MPa). No leakage of the second liner was observed until the test structure failed.
OVERALL BEHAVIOR OF TeST STRUCTURE
The first crack developed at a pressure of 30 psi (0.2 MPa) on the inside face of the dome. The first visible signs of meridional and circumferential cracking in the cylindrical wall occurred at 40 psi (0.28 MPa). With further loading these cracks became wider and new cracks developed. Fig. 5 shows the crack pattern on the west face of the wall at a pressure just over 130 psi (0.90 MPa) at which time the crack pattern was essentially fully developed. Cracks also appeared at 40 psi in the outer surface of the dome in directions essentially parallel and perpendicular to the meridians except in the region extending approximately 4 It (1,220 mm) from the outer edge of the ring beam in which there were no visible cracks even at the end of the test. The widths of cracks at the
FIG. 5.-Crack Pallern and Bulging of Wall at 130 psi (0.90 MPaj
FIG. 6.-Crack Pallern In Dome at 130 psi (0.90 MPaj
736
.0
.. ..
r """,dOomr 0 0-..-131
\""."15.,.., .a-. ~" .... 225
15 .iI 30 ~:;
Oefleclion (inches)
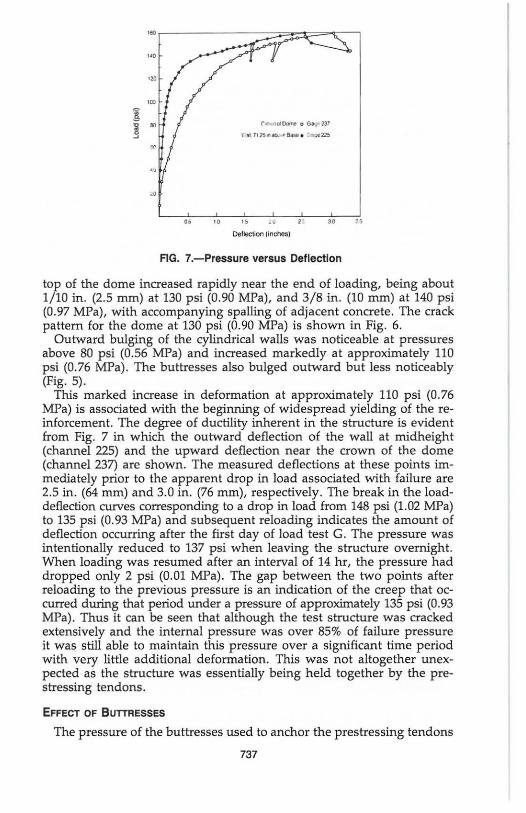
FIG. 7.-Pressure versus Deflection
top of the dome increased rapidly near the end of loading, being about 1/10 in. (2.5 mm) at 130 psi (0.90 MPa), and 3/8 in. (10 mm) at 140 psi (0.97 MPa), with accompanying spalling of adjacent concrete. The crack pattern for the dome at 130 psi (0.90 MPa) is shown in Fig. 6.
Outward bulging of the cylindrical walls was noticeable at pressures above 80 psi (0.56 MPa) and increased markedly at approximately 110 psi (0.76 MPa) . The buttresses also bulged outward but less noticeably (Fig. 5).
This marked increase in deformation at approximately 110 psi (0.76 MPa) is associated with the beginning of widespread yielding of the reinforcement. The degree of ductility inherent in the structure is evident from Fig. 7 in which the outward deflection of the wall at midheight (channel 225) and the upward deflection near the crown of the dome (channel 237) are shown. The measured deflections at these points immediately prior to the apparent drop in load associated with failure are 2.5 in. (64 mm) and 3.0 in. (76 mm), respectively. The break in the loaddeflection curves corresponding to a drop in load from 148 psi (1.02 MPa) to 135 psi (0.93 MPa) and subsequent reloading indicates the amount of deflection occurring after the first day of load test G. The pressure was intentionally reduced to 137 psi when leaving the structure overnight. When loading was resumed after an interval of 14 hr, the pressure had dropped only 2 psi (0.01 MPa). The gap between the two points after reloading to the previous pressure is an indication of the creep that occurred during that period under a pressure of approximately 135 psi (0.93 MPa). Thus it can be seen that although the test structure was cracked extensively and the internal pressure was over 85% of failure pressure it was still able to maintain this pressure over a significant time period with very little additional deformation. This was not altogether unexpected as the structure was essentially being held together by the prestressing tendons.
EFFECT OF BUTTRESSES
The pressure of the buttresses used to anchor the prestressing tendons
737
had a localized stiffening effect on the wall of the structure . Since this effect could not be modeled adequately using the axi-symmetric analyses developed, the influence of the buttresses in the prototype must be inferred from the test structure.
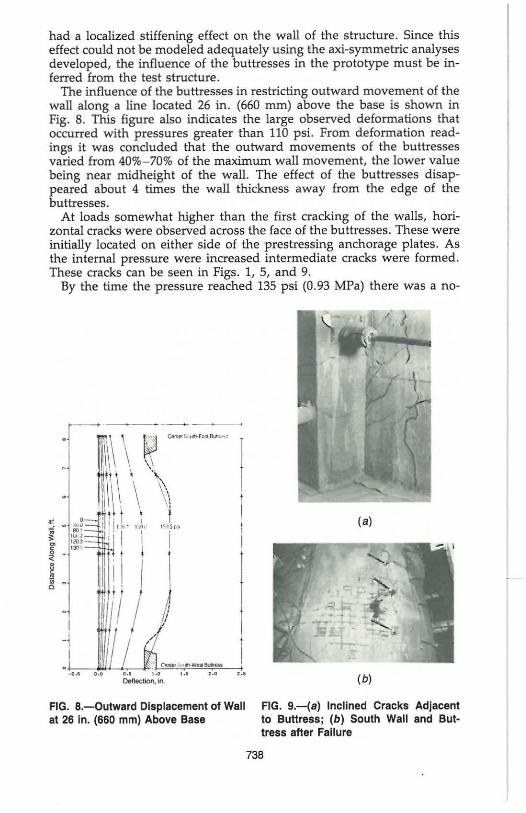
The influence of the buttresses in restricting outward movement of the wall along a line located 26 in. (660 mm) above the base is shown in Fig. 8. This figure also indicates the large observed deformations that occurred with pressures greater than 110 psi. From deformation readings it was concluded that the outward movements of the buttresses varied from 40%- 70% of the maximum wall movement, the lower value being near mid height of the wall. The effect of the buttresses disappeared about 4 times the wall thickness away from the edge of the buttresses.
At loads somewhat higher than the first cracking of the walls, horizontal cracks were observed across the face of the buttresses. These were initially located on either side of the prestressing anchorage plates. As the internal pressure were increased intermediate cracks were formed. These cracks can be seen in Figs. 1, 5, and 9.
By the time the pressure reached 135 psi (0.93 MPa) there was a no-
_ ._----~\\ \ ~ ---n \ '\
\ \ 11\ , \ \,
~ 0 . I j , 1 ~
~,
':! '{" 'T "r" •• '" ~ ,~,
• ,~ .
',1 I 1 < g I,) . "
NI ) -j ~U ~,---~ .1 ,
_0 . • 0 •• .., ,., ,., ,.' ,., Deflection, In.
FIG. S,-Outward Displacement of Wall at 26 In. (660 mm) Above Base
(s)
(b)
FIG. 9.-(a) Inclined Cracks Adjacent to Buttress; (b) South Wall and Buttress after Failure
738
ticeable outward movement or spalling of the concrete across the face of the buttress in the region adjacent to the tendons. In some instances this outward wedging of concrete was accompanied by an inward movement of the anchorage plates. At several locations the inward movement of the anchorage plates into the abutment increased as the load increased.
FAILURE MaCE OF TEST STRUCTURE
Failure of the test structure occurred when three horizontal tendons and one vertical tendon fractured at midheight near the south-east buttress. These were accompanied by a loud bang and an unravelling of the strand extending beyond the anchorage . Immediately prior to failure, the concrete cover over one of the horizontal tendon anchorages at this buttress was observed to pop outwards, followed by rapid opening of the cracks in the immediate vicinity and spalling of the concrete. The plastic liner ruptured at this point, relieving the pressure. The failure region showing the spalling and the ruptured tendons is shown in Fig. 9(b).
ANALYSIS OF TEST RESULTS
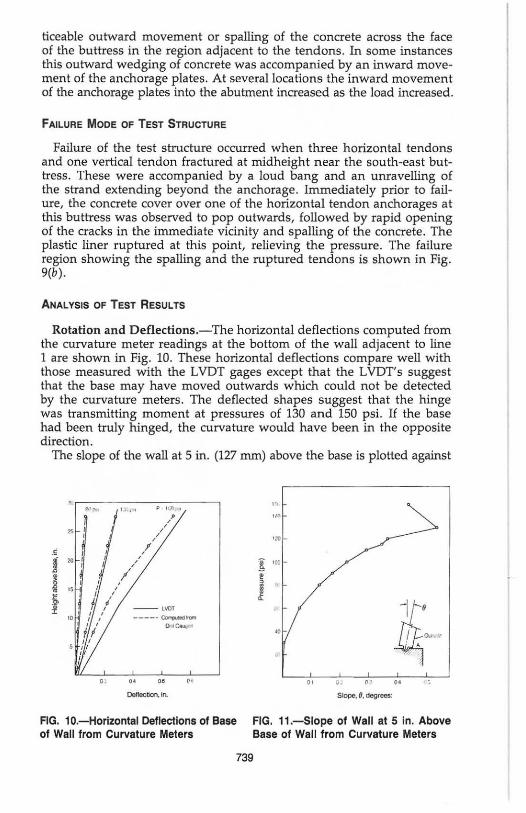
Rotation and Deflections.-The horizontal deflections computed from the curvature meter readings at the bottom of the wall adjacent to line 1 are shown in Fig. 10. These horizontal deflections compare well with those measured with the L VDT gages except that the LVDT's suggest that the base may have moved outwards which could not be detected by the curvature meters. The deflected shapes suggest that the hinge was transmitting moment at pressures of 130 and 150 psi. If the base had been truly hinged, the curvature would have been in the opposite direction.
The slope of the wall at 5 in. (127 mm) above the base is plotted against
-- ,~
-----~-. ,"-
.. .. .. Delleclion. in
FIG. 10.-Horizontal Dellections 01 Base of Wall from Curvature Meters
,', , .. ,~
! '. , J
~
" .. , , Slope," deg.ees:
FIG. 11 .-Slope 01 Wan at 5 In. Above Base of Wall from Curvature Meters
739
.. .. , .. ,
" " r 1
" " .. I ~ . ,·J ..... I ~
Ip· ,ro_1 . [,_ .... - .......... , ,, ..
""" __ roo ,· e r._ I --
--". '. ,
,~, ,~ 0.010 ,
'0001 .. - .~, .- 0.010
Meridional Oeml!(: Strain Pfolile Circumferential De ...... Strilin Protilft
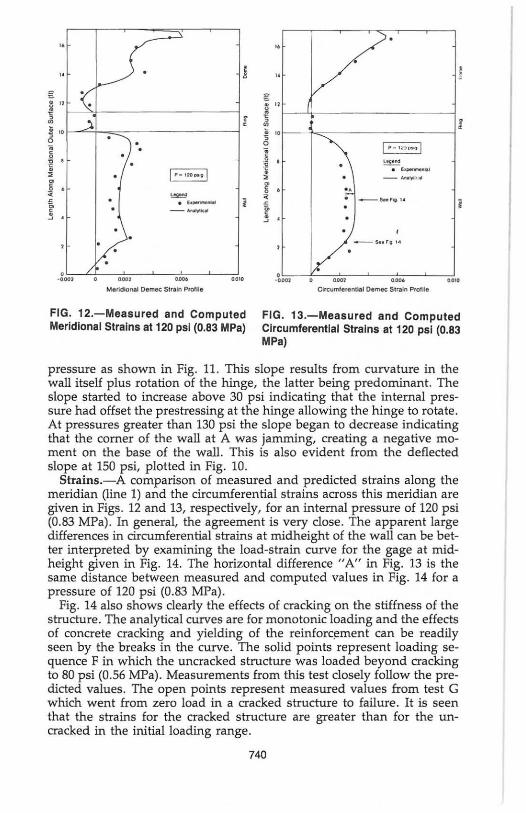
FIG. 12.-Measured and Computed FIG. l3.-Measured and Computed Meridional Strains at t20 psi (0.83 MPa) Circumferential Strains at 120 psi (0.83
MPa)
pressure as shown in Fig. 11 . This slope results from curvature in the wall itself plus rotation of the hinge, the latter being predominant. The slope started to increase above 30 psi indicating that the internal pressure had offset the prestressing at the hinge allowing the hinge to rotate. At pressures greater than 130 psi the slope began to decrease indicating that the corner of the wall at A was jamming, creating a negative moment on the base of the wall. This is also evident from the deflected slope at 150 psi, plotted in Fig. 10.
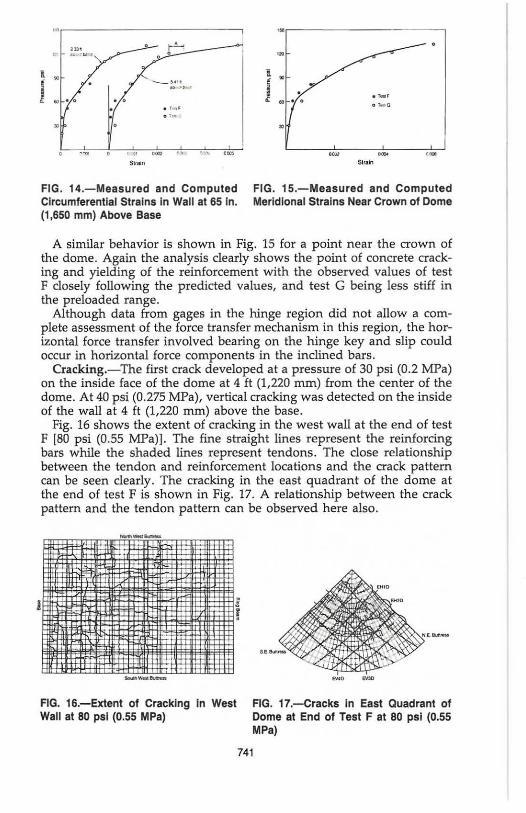
Strains.- A comparison of measured and predicted strains along the meridian (line 1) and the circumferential strains across this meridian are given in Figs. 12 and 13, respectively, for an internal pressure of 120 psi (0.83 MPa). In general, the agreement is very close. The apparent large differences in circumferential strains at midheight of the wall can be better interpreted by examining the load-strain curve for the gage at midheight given in Fig. 14. The horizontal difference "A" in Fig. 13 is the same distance between measured and computed values in Fig. 14 for a pressure of 120 psi (0.83 MPa) .
Fig. 14 also shows clearly the effects of cracking on the stiffness of the structure . The analytical curves are for monotonic loading and the effects of concrete cracking and yielding of the reinforcement can be readily seen by the breaks in the curve. The solid points represent loading sequence F in which the uncracked structure was loaded beyond cracking to 80 psi (0.56 MPa). Measurements from this test closely follow the predicted values. The open points represent measured values from test G which went from zero load in a cracked structure to failure . It is seen that the strains for the cracked structure are greater than for the uncracked in the initial loading range.
740
m
I • I
• • 0
•
,"' " , .. COol>
FIG. 14.-Measured and Computed Circumferential Strains In Wall at 65 In. (1,650 mm) Above Base
.• '.
! • ! . 0
. T • •
• G T_ G
•
.~ .~ ,~
SII.ln
FIG. 15.-Measured and Computed Meridional Strains Near Crown of Dome
A similar behavior is shown in Fig. 15 for a point near the crown of the dome. Again the analysis clearly shows the point of concrete cracking and yielding of the reinforcement with the observed values of test F closely following the predicted values, and test G being less stiff in the preloaded range.
Although data from gages in the hinge region did not allow a complete assessment of the force transfer mechanism in this region, the horizontal force transfer involved bearing on the hinge key and slip could occur in horizontal force components in the inclined bars .
Cracking.-The first crack developed at a pressure of 30 psi (0.2 MPa) on the inside face of the dome at 4 It (1,220 mm) from the center of the dome. At 40 psi (0.275 MPa), vertical cracking was detected on the inside of the wall at 4 ft (1,220 mm) above the base.
Fig. 16 shows the extent of cracking in the west wall at the end of test F [80 psi (0.55 MPa)]. The fine straight lines represent the reinforcing bars while the shaded lines represent tendons. The close relationship between the tendon and reinforcement locations and the crack pattern can be seen clearly. The cracking in the east quadrant of the dome at the end of test F is shown in Fig. 17. A relationship between the crack pattern and the tendon pattern can be observed here also .
FIG. 16.-Extent of Cracking In West Wall at 80 psi (0.55 MPa)
741
..
FIG. H .-Cracks in East Quadrant of Dome at End of Test F at 80 psi (0.55 MPa)

In a number of regions the cracking loads and deformations were affected by discontinuities in the reinforcement pattern. This is the reason for the apparently erratic nature of the computed and measured strains in Fig. 12.
Failure.-If the structure had been tested without a watertight liner, "failure" would have occurred due to excessive leakage prior to failure of any structural components. With leakage prevented, " failure" was due to the rupture of a horizontal tendon. This was initiated by the crushing of the concrete under the prestressing anchors in the buttresses of the tendons immediately above and below the fractured tendon. These anchorage zones had been weakened by the flexural cracks resulting from the outward bulging of the buttresses.
PRACTICAL ApPLICATIONS
The test structure has verified the ductile behavior expected in such a structure and has verified the predictive capability of the analyses developed in this program. These, in turn, have been used to predict ultimate capacity and leakage of the prototype at various stages in its loading history.
The cracking of the buttresses due to the outward bulging of the walls is of considerable practical importance. Such cracking could be expected at overloads in prototype containments and in prestressed water tanks and silos. This cracking affected the strength of the prestressing anchorages .
CONCLUSIONS
This paper describes a test of a prestressed concrete structure designed to behave in a manner similar to a containment building for a nuclear power plant. The model was loaded to failure to observe the different limit states caused by internal pressure conditions. The model cracked extensively and deformed in a ductile manner before failing. The following conclusions can be drawn from this test:
1. The test structure behaved in a highly ductile manner. The corresponding prototype structure could be expected to do so also .
2. The ring beam, dome, and center half of each wall quadrant had strains and deflections corresponding to axi-symmetric behavior. In the region extending, roughly, 20-25' each way from the center of each buttress, the behavior was affected by the flexural stiffness of the buttresses.
3. Crack patterns were strongly affected by tendon locations with major cracks in the walls and dome following the tendons. Cracks formed between the tendons at roughly every second reinforcing bar.
4. The outward bending of the buttresses resulted in cracks adjacent to most of the anchorages for the horizontal wall tendons. Final failure appeared to have been initiated by distress at several of these anchorage zones. Additional study is required of the strength and stiffness needed in the buttresses to prevent anchorage zone distress.
ACKNOWLEDGMENTS
The work described in this paper was sponsored by the Atomic En-
742
ergy Control Board of Canada, Ottawa, Canada, KIP 559, and carried out at the University of Alberta, Edmonton, Canada. The project was supervised by Dr. W. D. Smythe, Dr. F. Campbell, Dr. G. j. K. Asmis and Mr. D. Whelan, all of AECB. The prestressing was carried out by Can-Force Products Ltd. at no cost to the project.
ApPENDIX.-REFERENCES
1. Chitnuyanondh, L., RizkaUa, S. H" Murray, D. W./ and MacGregor, J. G., "An Effective Uniaxial Tensile Stress-Strain Relationship for Prestressed Concrete," Strudural Engineering Report No. 74, Department of Civil Engineering, University of Alberta, Edmonton, Alberta, Canada, Feb., 1979.
2. MacGregor, ]. G., Rizkalla, S. H" and Simmonds, S. H" "Cracking of Reinforced and Prestressed Concrete Wall Segments," Structural Engineering Report No. 82, Department of Civil Engineering, University of Alberta, Edmonton, Alberta, Canada, No. 82, Mar., 1980.
3. MacGregor, J. G., Simmonds, S. H" and Rizkalla, S. H" "Test of a Prestressed Concrete Secondary Containment Structure/' Structural Engineering Report No. 85, Department of Civil Engineering, University of Alberta, Edmonton, Alberta, Canada, Apr., 1980.
4. Murray, D. W., Chitnuyanondh, L., and Wong, c., "Modelling and Predicting Behavior of Prestressed Concrete Secondary Containment Structures Using BOSOR5/' Proceedings of the 5th International Conference on Structural Mechanics in Reactor Technology, Berlin, West Germany, Vol. It No. 3/5.
5. Rizkalla, S. H., Simmonds, S. H., and MacGregor, J. G., "Leakage Tests of Wall Segments of Reactor Containments," Proceedings of the 6th International Conference on Structural Mechanics in Reactor Technology, Paris, France, Vol. J. No. 5/14, pp. 1-8.
743