Embed Size (px)
Citation preview
http://dx.doi.org/10.5277/ppmp160135
Physicochem. Probl. Miner. Process. 52(1), 2016, 422−436 Physicochemical Problems
of Mineral Processing
www.minproc.pwr.wroc.pl/journal ISSN 1643-1049 (print)
ISSN 2084-4735 (online)
Received December 17, 2015; reviewed; accepted May 29, 2015
PRETREATMENT OF COKING WASTEWATER BY AN
ADSORPTION PROCESS USING FINE COKING COAL
Lihui GAO*, Shulei LI
*, Yongtian WANG
**, Xiahui GUI
**, Hongxiang XU
*
* School of Chemical Engineering and Technology, China University of Mining and Technology,
Xuzhou 221116, Jiangsu, China, [email protected] (L. Gao), ** Chinese National Engineering Research Center of Coal Preparation and Purification, Xuzhou 221116 ,
Jiangsu, China, [email protected] (Y. Wang)
Abstract: A new technique for pretreatment of coking wastewater is introduced based on the concept of
circular economy. Coal is fed into a coking system after adsorption. This study validates the feasibility of
using coking coal to adsorb organic pollutants in coking wastewater. The sorption kinetics and
equilibrium sorption isotherms of coking coal for removal of chemical oxygen demand (COD) and phenol
from coking wastewater was also discussed in this paper. Gas chromatograph/mass spectroscopy
(GC/MS) was used to detect changes in the quality of coking wastewater. The results showed that when
coking coal dosage was 120 g/dm3, 65% of COD and 34% of phenol in waste water can be removed after
40 min of agitation. The surface functional groups of coking coal before and after adsorption were
observed with a Fourier transform infrared spectrometer. The kinetics of COD and phenol adsorption
from coking wastewater by coking coal fitted the pseudo second-order model. The adsorption process of
coking coal can be classified into two categories, namely, rapid and slow. The Freundlich isotherm
provided a better fit with all adsorption isotherms than the Langmuir isotherm. Coking coal could be a
suitable low-cost adsorbent for recalcitrant organic pollutants.
Keywords: coking coal, coking wastewater, adsorption, COD, phenol
Introduction
Coking wastewater is a type of highly concentrated organic wastewater generated
from a process of making coke, purifying coal gas and recovering coke products (Wu
and Zhu, 2012). Coking wastewater is a kind of intractable wastewater which is
composed of complex inorganic and organic contaminants such as ammonia, cyanide,
sulfate, phenolic compounds, polycyclic aromatic hydrocarbons and polycyclic
nitrogen (Zhou, 2010; Burmistrz and Burmistrz, 2013; Burmistrz et al., 2014). The
high concentration of chemical oxygen demand (COD) and phenol in coking

Pretreatment of coking wastewater by an adsorption process using fine coking coal 423
wastewater causes significant harm to water and soil (Sun et al., 2008). Thus, coking
wastewater must be treated appropriately prior to discharge.
Current treatment methods for coking wastewater generally adopt pretreatment–
biological treatment–advanced treatment. Different biodegradation techniques have
been proposed for treatment of coking wastewater including anaerobic-anoxic-oxic
membrane bioreactor, sequential bath reactor, activated sludge and moving bed
biofilm reactors (Staib and Lant, 2006; Maranon et al., 2007; Zhao et al., 2009).
Nevertheless, coexistence of toxic compounds in coking wastewater can cause
inhibitory effects on the biodegradation process. Hence, it is very important to choose
appropriate methods for coking wastewater pretreatment to improve the treatment
efficiency of biological processes. As a consequence, multiple pretreatment processes
have been studied such as catalytic oxidation treatment (Oulego et al., 2014),
flocculation treatment (Pi et al., 2009), Fenton oxidation process (Lai and Zhao, 2012;
Zhu, 2012) and others. Although these methods work on coking wastewater, the
complexity of operation and high energy consumption make them impractical to be
applied at an industrial scale.
Adsorption is an effective technique for removal of organic pollutants from coking
wastewater (Vazquez et al., 2007; Burmistrz et al., 2014). Adsorbents are the key part
of this technique. In the past years, some conventional adsorbents (e.g., activated
carbon, zeolite, resins, silica gels, coke dust, lignite, and bottom ash) were usually
applied to adsorb pollutions. Nowadays, their shortcomings of low adsorption capacity
and high regeneration energy consumption requirements, however, restrict their
extensive applications.
In this study a new technique for coking wastewater treatment is introduced in
which coal was utilized to adsorb organic pollutants in coking wastewater based on a
treatment proprietary process disclosed previously (Wang et al., 2014). In this process
(Fig. 1), coal is fed into the coking system and wastewater is poured into biological
treatment after adsorption. The process facilitates coking coal recycling. This paper
focuses on the feasibility of using coking coal to adsorb organic pollutants from
coking wastewater.
Coking wastewater
Coking coal
Mixing tankFilter Biological treatment
Coking coal
and sediment Filtrate
Coal cake
Coking system
Fig. 1. Schematic of plant for coking wastewater treatment
L. Gao, S. Li, Y. Wang, X. Gui, Hongxiang Xu 424
Materials and methods
Coking wastewater and coal
The coking wastewater used in the experiments was obtained from Huayu Coke Plant,
China. It was treated by ammonia distillation. The wastewater (pH value of 9.56) was
deep brown in color and emitted a foul odor. Table 1 shows the analytical results of
the coking wastewater sample.
Table 1. Water quality of coking wastewater
Parameter Value
Color Deep brown
pH 9.56
COD (g/dm3) 7.600
Phenol (mg/dm3) 418.35
Ammonia (mg/dm3) 118.50
Coking coal was also obtained from the Huayu Coke Plant, China. The particle size
ranged from 0.5 to 30 mm. The samples were ground and screened to produce
different particle sizes, such as +0.5, 0.5–0.25, 0.25–0.125, 0.125–0.074 and –
0.074 mm. The mineral components, functional groups of the coal surface were
analyzed with an X ray diffractometer (D8 ADVANCE, Bruker, Germany), a Fourier
transform infrared spectrometer (VERTEX 80/80v, Bruker, Germany), respectively.
Through the XRD analysis, coking coal was mainly composed of amorphous coal
with some minerals including quartz, kaolinite, illite and pyrite. Coal composition has
an important role in adsorption although minerals also have some adsorption capacity,
they can be ignored because of their low contents.
Experimental methods
Different quantities of coking coal with a specific size were added into a 250 cm3
triangular flask and 100 cm3 coking wastewater was then added. H2SO4 (1:10) was
utilized to adjust the pH value. All the experiments were conducted in a water bath
shaker for different adsorption times at 25 °C. After adsorption, the water samples
were centrifuged at 3000 rpm for 10 min. The supernate was analyzed for chemical
oxygen demand (COD), ammonia, and phenol removal.
An orthogonal test was implemented to examine the effect of particle size (A), coal
dosage (B), coking wastewater pH value (C) and adsorption time (D) (Table 2). The
experiment was designed according to the L25 (56) table (Table 3). The optimum
experimental condition was determined based on the removal rate of COD, ammonia,
and phenol.

Pretreatment of coking wastewater by an adsorption process using fine coking coal 425
Table 2. Factors and levels of orthogonal experiment
Level Factors
A particle (mm) B dosage (g) C pH D adsorption time (min)
1 A1 = –0.074 B1 = 8 C1 = 2 D1 = 10
2 A2 = 0.074–0.125 B2 = 10 C2 = 4 D2 = 20
3 A3 = 0.125–0.25 B3 = 12 C3 = 5 D3 = 40
4 A4 = 0.25–0.5 B4 = 15 C4 = 6 D4 = 100
5 A5 = +0.5 B5 = 20 C5 = 7 D5 = 150
Table 3. L25(56) orthogonal array
A B C D E F G
Exp.
Particle
Size
(mm)
Dosage
(g) pH
Adsorption
Time
(min)
The removal rate
of ammonium
(%)
The removal rate
of
Phenol (%)
The removal
rate of COD
(%)
1 A1 B1 C1 D1 8.48 23.59 47.37
2 A1 B2 C2 D2 14.14 33.58 73.68
3 A1 B3 C3 D3 6.50 39.02 78.43
4 A1 B4 C4 D4 14.89 28.46 51.47
5 A1 B5 C5 D5 9.79 31.65 56.86
6 A2 B1 C2 D3 4.04 15.43 78.43
7 A2 B2 C3 D4 11.46 16.33 52.07
8 A2 B3 C4 D5 10.23 23.39 56.86
9 A2 B4 C5 D1 5.80 26.54 51.84
10 A2 B5 C1 D2 3.86 28.21 63.16
11 A3 B1 C3 D5 6.28 13.61 62.25
12 A3 B2 C4 D1 6.68 26.95 47.37
13 A3 B3 C5 D2 15.37 23.59 57.89
14 A3 B4 C1 D3 4.57 24.06 69.43
15 A3 B5 C2 D4 15.33 26.76 67.64
16 A4 B1 C4 D2 20.29 9.98 60.16
17 A4 B2 C5 D3 5.27 8.17 46.07
18 A4 B3 C1 D4 6.28 10.89 69.43
19 A4 B4 C2 D5 8.04 10.80 66.43
20 A4 B5 C3 D1 5.53 13.61 63.16
21 A5 B1 C5 D4 11.73 8.17 68.04
22 A5 B2 C1 D5 9.27 17.24 62.25
23 A5 B3 C2 D1 4.57 15.43 67.68
24 A5 B4 C3 D2 10.32 16.54 52.63
25 A5 B5 C4 D3 3.95 11.80 40.68
L. Gao, S. Li, Y. Wang, X. Gui, Hongxiang Xu 426
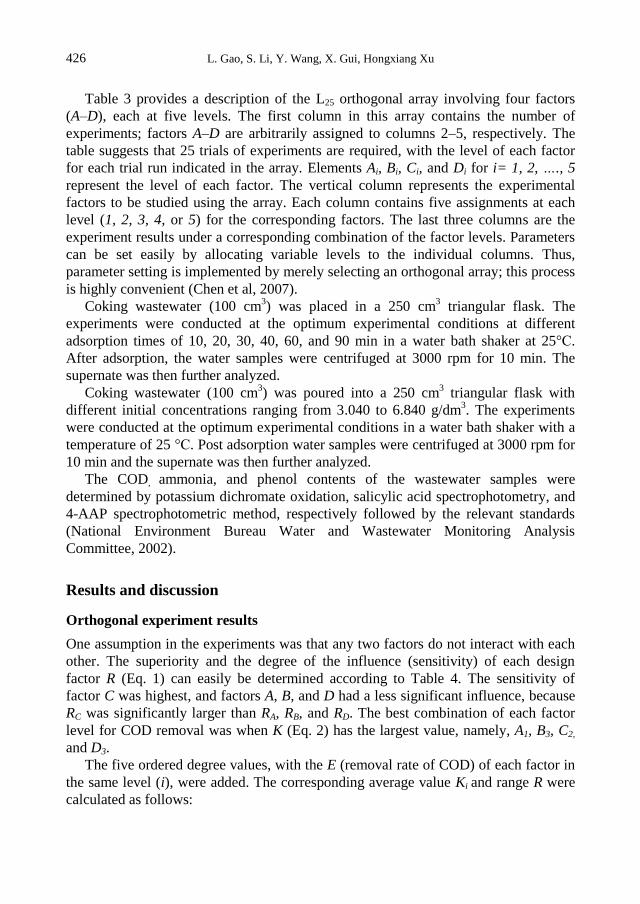
Table 3 provides a description of the L25 orthogonal array involving four factors
(A–D), each at five levels. The first column in this array contains the number of
experiments; factors A–D are arbitrarily assigned to columns 2–5, respectively. The
table suggests that 25 trials of experiments are required, with the level of each factor
for each trial run indicated in the array. Elements Ai, Bi, Ci, and Di for i= 1, 2, …., 5
represent the level of each factor. The vertical column represents the experimental
factors to be studied using the array. Each column contains five assignments at each
level (1, 2, 3, 4, or 5) for the corresponding factors. The last three columns are the
experiment results under a corresponding combination of the factor levels. Parameters
can be set easily by allocating variable levels to the individual columns. Thus,
parameter setting is implemented by merely selecting an orthogonal array; this process
is highly convenient (Chen et al, 2007).
Coking wastewater (100 cm3) was placed in a 250 cm
3 triangular flask. The
experiments were conducted at the optimum experimental conditions at different
adsorption times of 10, 20, 30, 40, 60, and 90 min in a water bath shaker at 25°C.
After adsorption, the water samples were centrifuged at 3000 rpm for 10 min. The
supernate was then further analyzed.
Coking wastewater (100 cm3) was poured into a 250 cm
3 triangular flask with
different initial concentrations ranging from 3.040 to 6.840 g/dm3. The experiments
were conducted at the optimum experimental conditions in a water bath shaker with a
temperature of 25 °C. Post adsorption water samples were centrifuged at 3000 rpm for
10 min and the supernate was then further analyzed.
The COD, ammonia, and phenol contents of the wastewater samples were
determined by potassium dichromate oxidation, salicylic acid spectrophotometry, and
4-AAP spectrophotometric method, respectively followed by the relevant standards
(National Environment Bureau Water and Wastewater Monitoring Analysis
Committee, 2002).
Results and discussion
Orthogonal experiment results
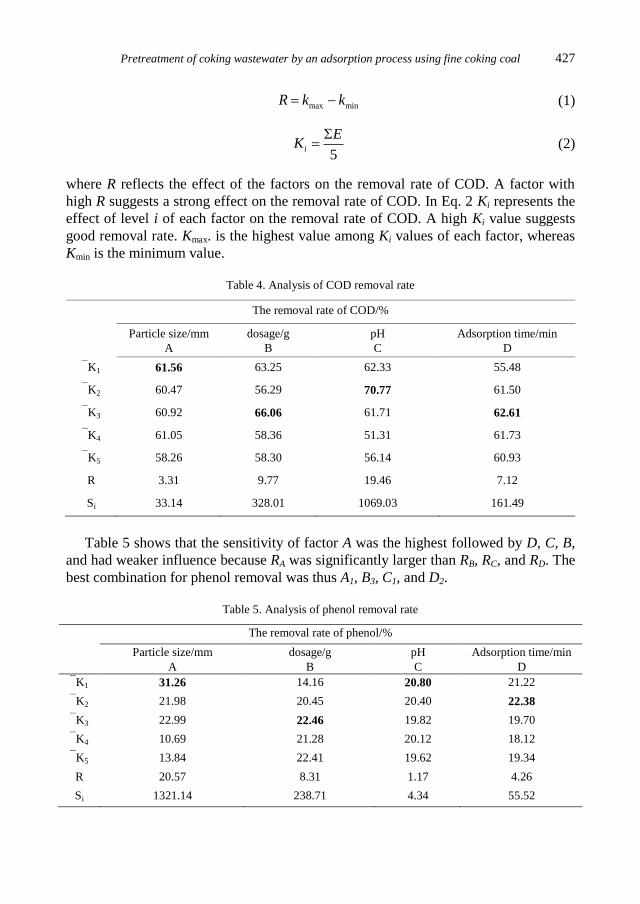
One assumption in the experiments was that any two factors do not interact with each
other. The superiority and the degree of the influence (sensitivity) of each design
factor R (Eq. 1) can easily be determined according to Table 4. The sensitivity of
factor C was highest, and factors A, B, and D had a less significant influence, because
RC was significantly larger than RA, RB, and RD. The best combination of each factor
level for COD removal was when K (Eq. 2) has the largest value, namely, A1, B3, C2,
and D3.
The five ordered degree values, with the E (removal rate of COD) of each factor in
the same level (i), were added. The corresponding average value Ki and range R were
calculated as follows:
Pretreatment of coking wastewater by an adsorption process using fine coking coal 427
max minR k k (1)
5
i
EK
(2)
where R reflects the effect of the factors on the removal rate of COD. A factor with
high R suggests a strong effect on the removal rate of COD. In Eq. 2 Ki represents the
effect of level i of each factor on the removal rate of COD. A high Ki value suggests
good removal rate. Kmax. is the highest value among Ki values of each factor, whereas
Kmin is the minimum value.
Table 4. Analysis of COD removal rate
The removal rate of COD/%
Particle size/mm
A
dosage/g
B
pH
C
Adsorption time/min
D
K1 61.56 63.25 62.33 55.48
K2 60.47 56.29 70.77 61.50
K3 60.92 66.06 61.71 62.61
K4 61.05 58.36 51.31 61.73
K5 58.26 58.30 56.14 60.93
R 3.31 9.77 19.46 7.12
Si 33.14 328.01 1069.03 161.49
Table 5 shows that the sensitivity of factor A was the highest followed by D, C, B,
and had weaker influence because RA was significantly larger than RB, RC, and RD. The
best combination for phenol removal was thus A1, B3, C1, and D2.
Table 5. Analysis of phenol removal rate
The removal rate of phenol/%
Particle size/mm
A
dosage/g
B
pH
C
Adsorption time/min
D
K1 31.26 14.16 20.80 21.22
K2 21.98 20.45 20.40 22.38
K3 22.99 22.46 19.82 19.70
K4 10.69 21.28 20.12 18.12
K5 13.84 22.41 19.62 19.34
R 20.57 8.31 1.17 4.26
Si 1321.14 238.71 4.34 55.52
L. Gao, S. Li, Y. Wang, X. Gui, Hongxiang Xu 428
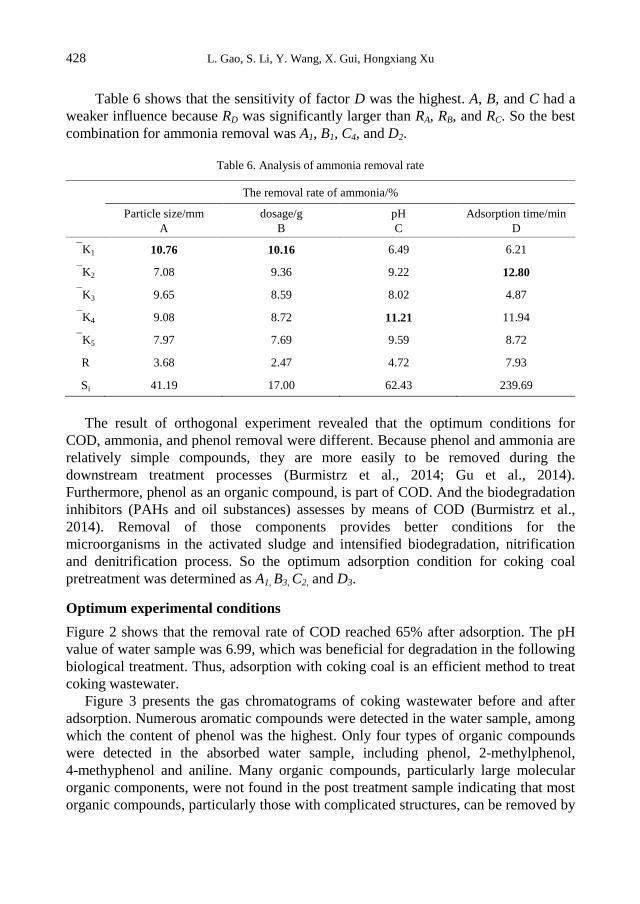
Table 6 shows that the sensitivity of factor D was the highest. A, B, and C had a
weaker influence because RD was significantly larger than RA, RB, and RC. So the best
combination for ammonia removal was A1, B1, C4, and D2.
Table 6. Analysis of ammonia removal rate
The removal rate of ammonia/%
Particle size/mm
A
dosage/g
B
pH
C
Adsorption time/min
D
K1 10.76 10.16 6.49 6.21
K2 7.08 9.36 9.22 12.80
K3 9.65 8.59 8.02 4.87
K4 9.08 8.72 11.21 11.94
K5 7.97 7.69 9.59 8.72
R 3.68 2.47 4.72 7.93
Si 41.19 17.00 62.43 239.69
The result of orthogonal experiment revealed that the optimum conditions for
COD, ammonia, and phenol removal were different. Because phenol and ammonia are
relatively simple compounds, they are more easily to be removed during the
downstream treatment processes (Burmistrz et al., 2014; Gu et al., 2014).
Furthermore, phenol as an organic compound, is part of COD. And the biodegradation
inhibitors (PAHs and oil substances) assesses by means of COD (Burmistrz et al.,
2014). Removal of those components provides better conditions for the
microorganisms in the activated sludge and intensified biodegradation, nitrification
and denitrification process. So the optimum adsorption condition for coking coal
pretreatment was determined as A1, B3, C2, and D3.
Optimum experimental conditions
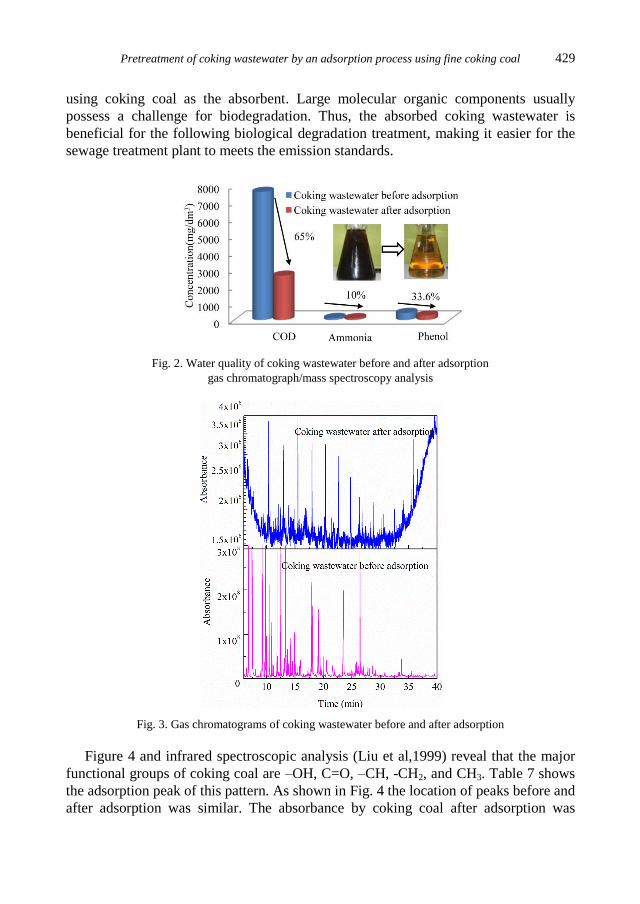
Figure 2 shows that the removal rate of COD reached 65% after adsorption. The pH
value of water sample was 6.99, which was beneficial for degradation in the following
biological treatment. Thus, adsorption with coking coal is an efficient method to treat
coking wastewater.
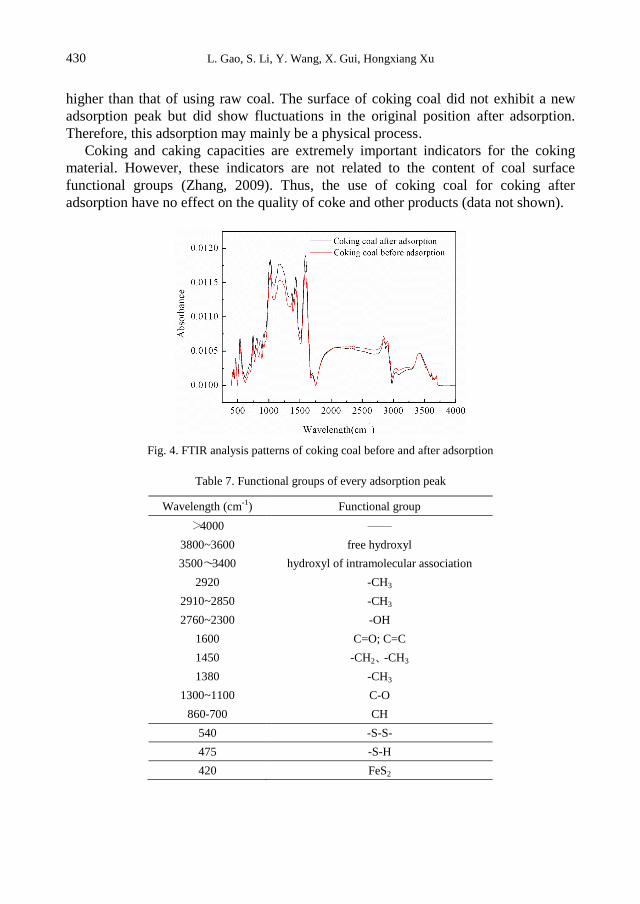
Figure 3 presents the gas chromatograms of coking wastewater before and after
adsorption. Numerous aromatic compounds were detected in the water sample, among
which the content of phenol was the highest. Only four types of organic compounds
were detected in the absorbed water sample, including phenol, 2-methylphenol,
4-methyphenol and aniline. Many organic compounds, particularly large molecular
organic components, were not found in the post treatment sample indicating that most
organic compounds, particularly those with complicated structures, can be removed by
Pretreatment of coking wastewater by an adsorption process using fine coking coal 429
using coking coal as the absorbent. Large molecular organic components usually
possess a challenge for biodegradation. Thus, the absorbed coking wastewater is
beneficial for the following biological degradation treatment, making it easier for the
sewage treatment plant to meets the emission standards.
Fig. 2. Water quality of coking wastewater before and after adsorption
gas chromatograph/mass spectroscopy analysis
Fig. 3. Gas chromatograms of coking wastewater before and after adsorption
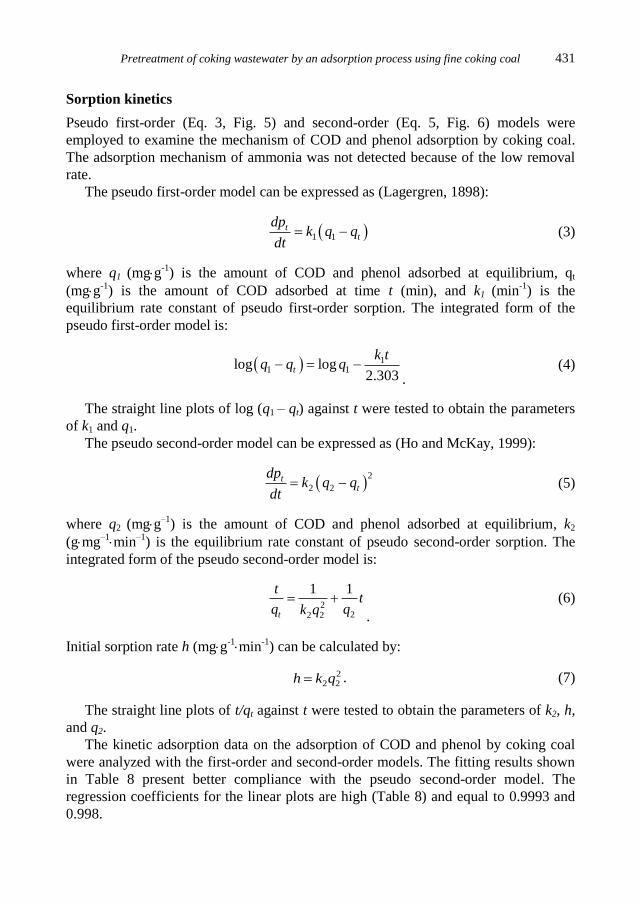
Figure 4 and infrared spectroscopic analysis (Liu et al,1999) reveal that the major
functional groups of coking coal are –OH, C=O, –CH, -CH2, and CH3. Table 7 shows
the adsorption peak of this pattern. As shown in Fig. 4 the location of peaks before and
after adsorption was similar. The absorbance by coking coal after adsorption was
L. Gao, S. Li, Y. Wang, X. Gui, Hongxiang Xu 430
higher than that of using raw coal. The surface of coking coal did not exhibit a new
adsorption peak but did show fluctuations in the original position after adsorption.
Therefore, this adsorption may mainly be a physical process.
Coking and caking capacities are extremely important indicators for the coking
material. However, these indicators are not related to the content of coal surface
functional groups (Zhang, 2009). Thus, the use of coking coal for coking after
adsorption have no effect on the quality of coke and other products (data not shown).
Fig. 4. FTIR analysis patterns of coking coal before and after adsorption
Table 7. Functional groups of every adsorption peak
Wavelength (cm-1) Functional group
>4000 ——
3800~3600 free hydroxyl
3500~3400 hydroxyl of intramolecular association
2920 -CH3
2910~2850 -CH3
2760~2300 -OH
1600 C=O; C=C
1450 -CH2、-CH3
1380 -CH3
1300~1100 C-O
860-700 CH
540 -S-S-
475 -S-H
420 FeS2
Pretreatment of coking wastewater by an adsorption process using fine coking coal 431
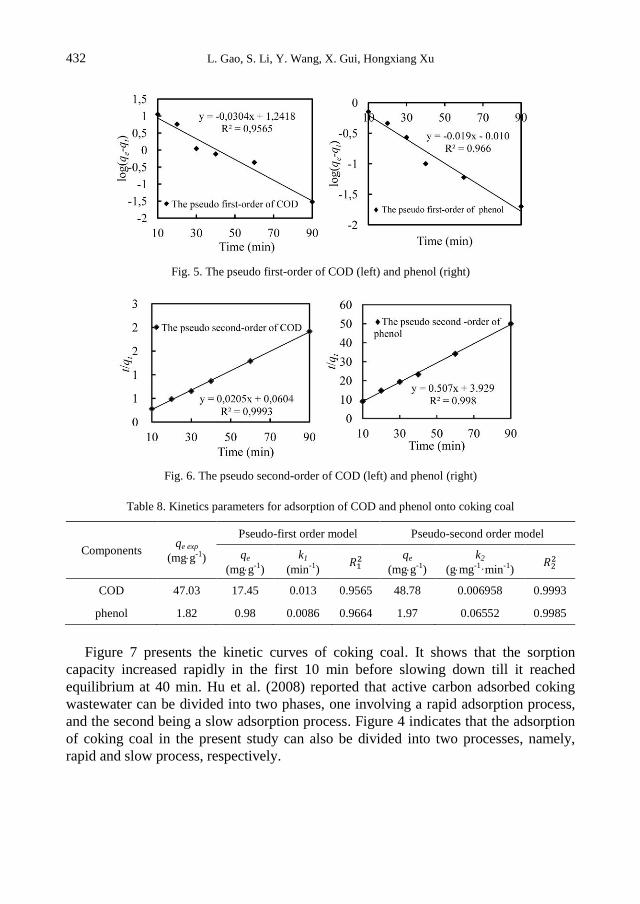
Sorption kinetics
Pseudo first-order (Eq. 3, Fig. 5) and second-order (Eq. 5, Fig. 6) models were
employed to examine the mechanism of COD and phenol adsorption by coking coal.
The adsorption mechanism of ammonia was not detected because of the low removal
rate.
The pseudo first-order model can be expressed as (Lagergren, 1898):
1 1t
t
dpk q q
dt (3)
where q1 (mgg-1
) is the amount of COD and phenol adsorbed at equilibrium, qt
(mgg-1
) is the amount of COD adsorbed at time t (min), and k1 (min-1
) is the
equilibrium rate constant of pseudo first-order sorption. The integrated form of the
pseudo first-order model is:
11 1log log
2.303t
k tq q q
. (4)
The straight line plots of log (q1 – qt) against t were tested to obtain the parameters
of k1 and q1.
The pseudo second-order model can be expressed as (Ho and McKay, 1999):
2
2 2t
t
dpk q q
dt (5)
where q2 (mgg–1
) is the amount of COD and phenol adsorbed at equilibrium, k2
(gmg–1min
–1) is the equilibrium rate constant of pseudo second-order sorption. The
integrated form of the pseudo second-order model is:
2
22 2
1 1
t
tt
q qk q
.
(6)
Initial sorption rate h (mgg-1min
-1) can be calculated by:
22 2h k q . (7)
The straight line plots of t/qt against t were tested to obtain the parameters of k2, h,
and q2.
The kinetic adsorption data on the adsorption of COD and phenol by coking coal
were analyzed with the first-order and second-order models. The fitting results shown
in Table 8 present better compliance with the pseudo second-order model. The
regression coefficients for the linear plots are high (Table 8) and equal to 0.9993 and
0.998.
L. Gao, S. Li, Y. Wang, X. Gui, Hongxiang Xu 432
Fig. 5. The pseudo first-order of COD (left) and phenol (right)
Fig. 6. The pseudo second-order of COD (left) and phenol (right)
Table 8. Kinetics parameters for adsorption of COD and phenol onto coking coal
Components qe exp
(mgg-1)
Pseudo-first order model Pseudo-second order model
qe
(mgg-1)
k1
(min-1) 𝑅12
qe
(mgg-1)
k2
(gmg-1·min-1) 𝑅22
COD 47.03 17.45 0.013 0.9565 48.78 0.006958 0.9993
phenol 1.82 0.98 0.0086 0.9664 1.97 0.06552 0.9985
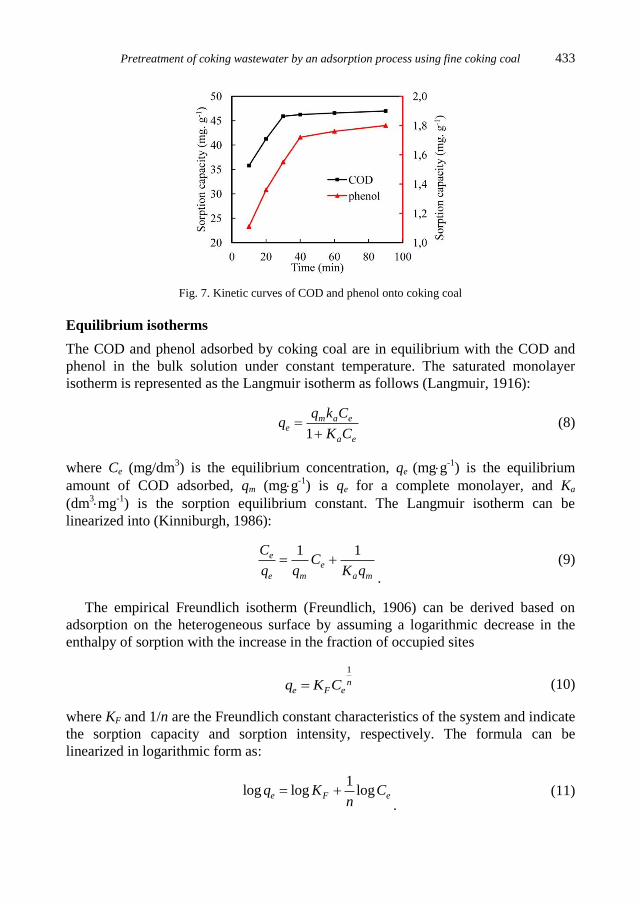
Figure 7 presents the kinetic curves of coking coal. It shows that the sorption
capacity increased rapidly in the first 10 min before slowing down till it reached
equilibrium at 40 min. Hu et al. (2008) reported that active carbon adsorbed coking
wastewater can be divided into two phases, one involving a rapid adsorption process,
and the second being a slow adsorption process. Figure 4 indicates that the adsorption
of coking coal in the present study can also be divided into two processes, namely,
rapid and slow process, respectively.
Pretreatment of coking wastewater by an adsorption process using fine coking coal 433
Fig. 7. Kinetic curves of COD and phenol onto coking coal
Equilibrium isotherms
The COD and phenol adsorbed by coking coal are in equilibrium with the COD and
phenol in the bulk solution under constant temperature. The saturated monolayer
isotherm is represented as the Langmuir isotherm as follows (Langmuir, 1916):
1
m a ee
a e
q k Cq
K C
(8)
where Ce (mg/dm3) is the equilibrium concentration, qe (mgg
-1) is the equilibrium
amount of COD adsorbed, qm (mgg-1
) is qe for a complete monolayer, and Ka
(dm3mg
-1) is the sorption equilibrium constant. The Langmuir isotherm can be
linearized into (Kinniburgh, 1986):
1 1e
e
e m a m
CC
q q K q
.
(9)
The empirical Freundlich isotherm (Freundlich, 1906) can be derived based on
adsorption on the heterogeneous surface by assuming a logarithmic decrease in the
enthalpy of sorption with the increase in the fraction of occupied sites
1
ne F eq K C (10)
where KF and 1/n are the Freundlich constant characteristics of the system and indicate
the sorption capacity and sorption intensity, respectively. The formula can be
linearized in logarithmic form as:
1
log log loge F eq K Cn
. (11)
L. Gao, S. Li, Y. Wang, X. Gui, Hongxiang Xu 434
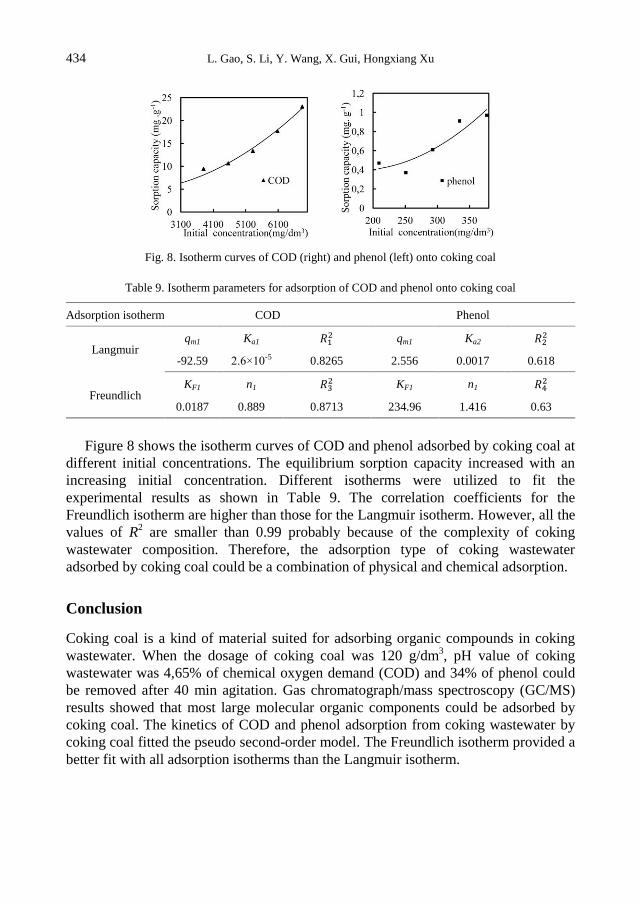
Fig. 8. Isotherm curves of COD (right) and phenol (left) onto coking coal
Table 9. Isotherm parameters for adsorption of COD and phenol onto coking coal
Adsorption isotherm COD Phenol
Langmuir qm1 Ka1 𝑅1
2 qm1 Ka2 𝑅2
2
-92.59 2.6×10⁻⁵ 0.8265 2.556 0.0017 0.618
Freundlich KF1 n1 𝑅3
2 KF1 n1 𝑅4
2
0.0187 0.889 0.8713 234.96 1.416 0.63
Figure 8 shows the isotherm curves of COD and phenol adsorbed by coking coal at
different initial concentrations. The equilibrium sorption capacity increased with an
increasing initial concentration. Different isotherms were utilized to fit the
experimental results as shown in Table 9. The correlation coefficients for the
Freundlich isotherm are higher than those for the Langmuir isotherm. However, all the
values of R2 are smaller than 0.99 probably because of the complexity of coking
wastewater composition. Therefore, the adsorption type of coking wastewater
adsorbed by coking coal could be a combination of physical and chemical adsorption.
Conclusion
Coking coal is a kind of material suited for adsorbing organic compounds in coking
wastewater. When the dosage of coking coal was 120 g/dm3, pH value of coking
wastewater was 4,65% of chemical oxygen demand (COD) and 34% of phenol could
be removed after 40 min agitation. Gas chromatograph/mass spectroscopy (GC/MS)
results showed that most large molecular organic components could be adsorbed by
coking coal. The kinetics of COD and phenol adsorption from coking wastewater by
coking coal fitted the pseudo second-order model. The Freundlich isotherm provided a
better fit with all adsorption isotherms than the Langmuir isotherm.
Pretreatment of coking wastewater by an adsorption process using fine coking coal 435
Acknowledgements
This research was supported by China National Fundamental Research Funds for the Central Universities
under Grant No. 2014XT05.
References
BURMISTRZ P., ROZWADOWSKI A., BURMISTRZ M., KARCZ A., 2014, Coke dust enhance coke
plant wastewater treatment, Chemosphere, 117, 278-284
BURMISTRZ P., BURMISTRZ M., 2013, Distribution of polycyclic aromatic hydrocarbons in coke
plant wastewater. Water Sci. Technol., 68, 2414-2420.
CHEN Y., ZHANG J., YANG C., 2007, The workspace mapping with deficient-DOF space for the
PUMA 560 robot and its exoskeleton arm by using orthogonal experiment design method, Robotics
and Computer-Integrated Manufacturing, 23, 478- 487
FREUNDLICH H., 1906, Uber die adsorption in losungen, Zeitschriftfur Physikalische Chemie
(Leipzig), 57A, 385-470.
GU Q., SUN T., WU G., LI M., QIU W., 2014, Influence of carrier filling ratio on the performance of
moving bed biofilm reactor in treating coking wastewater, Bioresource Technology, 166, 72-78
HO Y., MCKAY G., 1999, Pseudo-second order model for sorption processes, Process Biochem., 34,
451-465.
HU J., XIAO J., REN Y., 2008, Adsorption Process of Organic Contaminant in Untreated Coking
Wastewater by Powdered Activated Carbon, Environmental Science, 6, 1567-1571.
KINNIBURGH D., 1986, General purpose adsorption isotherms, Environ. Sci. Technol., 20, 895-904.
LAI P., ZHAO H., 2012, Study on Advanced Treatment of Coking Wastewater by Fenton Oxidation
Process, Conteporary Chemical Industry, 41(1), 11-14.
LIU G., QIU G., HU Y., 1999, Study on infrared spedtra of coals, Journal of Central South University,
30(4), 371-373.
LAGERGREN S., 1898, Zur theorie der sogenannten adsorption geloster stoffe, Kungliga Svenska
Vetenskapsakademiens, Handlingar, 24, 1-39.
LANGMUIR I., 1916, The constitution and fundamental properties of solids and liquids, J. Am. Chem.
Soc., 38, 2221-2295.
MARANON E., VAZQUEZ I., RODRIGUEZ J., CASTRILLON L., FEMANDEZ Y., LOPEZ H., 2008,
Treatment of coke wastewater in sequential batch reactor(SBR) at pilot plant scale, Bioresource
Technology, 99, 4192-4198.
NATIONAL ENVIRONMENT BUREAU WATER AND WASTEWATER MONITORING ANALYSIS
COMMITTEE, 2002, Water and Wastewater Monitoring Analysis Method, fourth ed, Beijing
:Chinese Environment Science Publisher.
OULEGO P., COLLADO S., GARRIDO L., LACA A., RENDUELES M., DIAZ M., 2014, Wet
oxidation of real coke wastewater containing high thiocyanate Concentration, Journal of
Environmental Management, 132, 16-23.
PI K., LUO Y., GONG W., 2009, A Case study of A/O Coupled with Flocculation for Phenol and
Cyanide Wastewater Treatment, Journal of Hubei University of Technology, 1 (24), 17-19.
STAIB C., LANT P., 2006, Thiocyanate degradation during activated sludge treatment of coke-ovens
wastewater, Biochemical Engineering Journal, 34, 122-130.
SUN W., QU Y., YU Q., 2008, Adsorption of organic pollutants from coking and papermaking
wastewaters by bottom ash, Journal of Hazardous Materials, 15 VAZQUEZ I., RODRIGUEZ-
L. Gao, S. Li, Y. Wang, X. Gui, Hongxiang Xu 436
IGLESIAS J., MARANON E., CASTRILLON L., ALVAREZ M., 2007, Removal of residual phenols
from coke wastewater by adsorption, Journal of Hazardous Materials,147, 395-400.
WANG Y., LIU L., ZHANG M., TONG J., ZHOU J., ZHANG H., GAO L., 2014, A Process of coking
wastewater treatment, Chinese patent,10101496.7.4, 595-601.
WU Z., ZHU L., 2012, Removal of polycyclic aromatic hydrocarbons and phenols from coking
wastewater by simultaneously synthesized organobentonite in a one-step process, Journal of
Environmental Sciences. 24 (2), 248-253.
ZHOU M., 2010, The screening and degradation characteristics study on predominant bacterias to hard-
biodegradable organics in Coking wastewater, Ph.D. dissertation,Wuhan: Wuhan University of
Science and Technology.
ZHAO W., HUANG X., LEE D., 2009, Enhanced treatment of coke plant wastewater using an
anaerobic-anoxic-oxic membrance bioreactor system, Separation and Purification Technology, 66,
279-286.
ZHU X., 2012, Studies on Characteristics Mechanism and Effluent Biotoxicity for Enhanced Treatment of
Coking Wastewater, Ph.D. dissertation, Beijing:Tsinghua University.
ZHANG S., 2009, Coal Chemistry, Xuzhou: The China University of Mining and Technology press.