Embed Size (px)
Citation preview
2018
Wastewater Department
Pretreatment& PollutionPrevention
Report
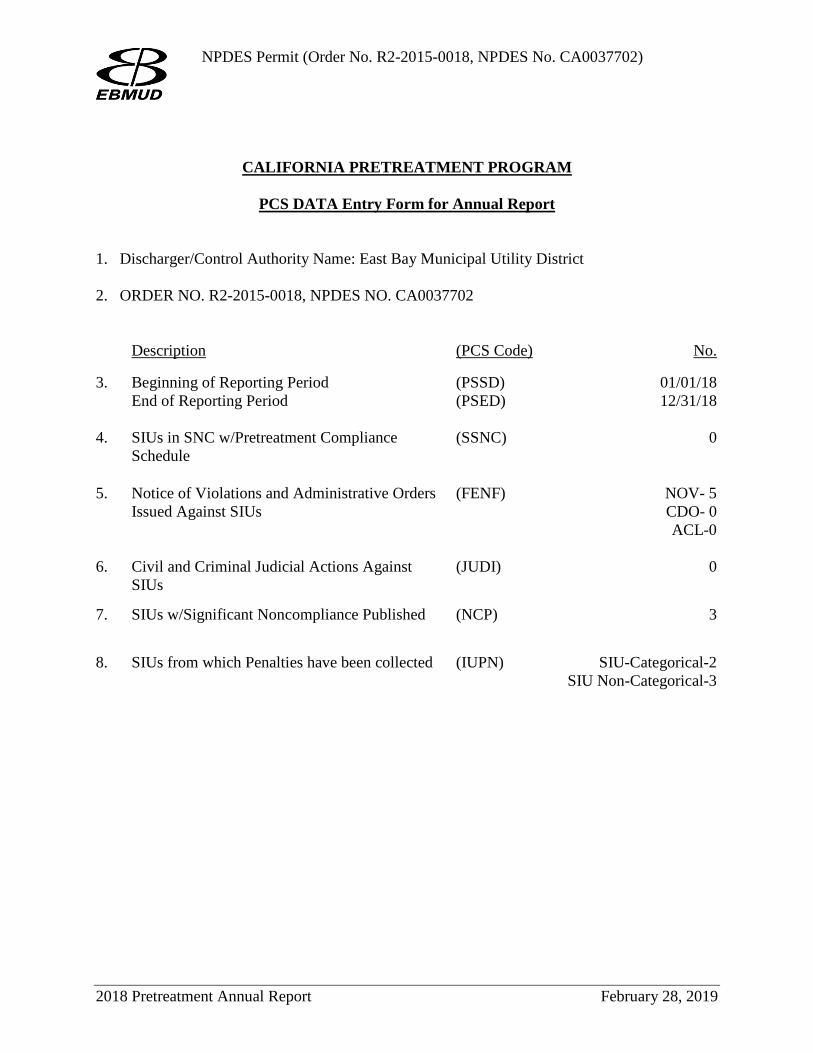
NPDES Permit (Order No. R2-2015-0018, NPDES No. CA0037702)
CALIFORNIA PRETREATMENT PROGRAM
PCS DATA Entry Form for Annual Report
1. Discharger/Control Authority Name: East Bay Municipal Utility District 2. ORDER NO. R2-2015-0018, NPDES NO. CA0037702
Description (PCS Code) No.
3. Beginning of Reporting Period (PSSD) 01/01/18 End of Reporting Period (PSED) 12/31/18
4. SIUs in SNC w/Pretreatment Compliance
Schedule (SSNC) 0
5. Notice of Violations and Administrative Orders Issued Against SIUs
(FENF) NOV- 5 CDO- 0 ACL-0
6. Civil and Criminal Judicial Actions Against
SIUs (JUDI) 0
7. SIUs w/Significant Noncompliance Published (NCP) 3
8. SIUs from which Penalties have been collected (IUPN) SIU-Categorical-2 SIU Non-Categorical-3
2018 Pretreatment Annual Report February 28, 2019
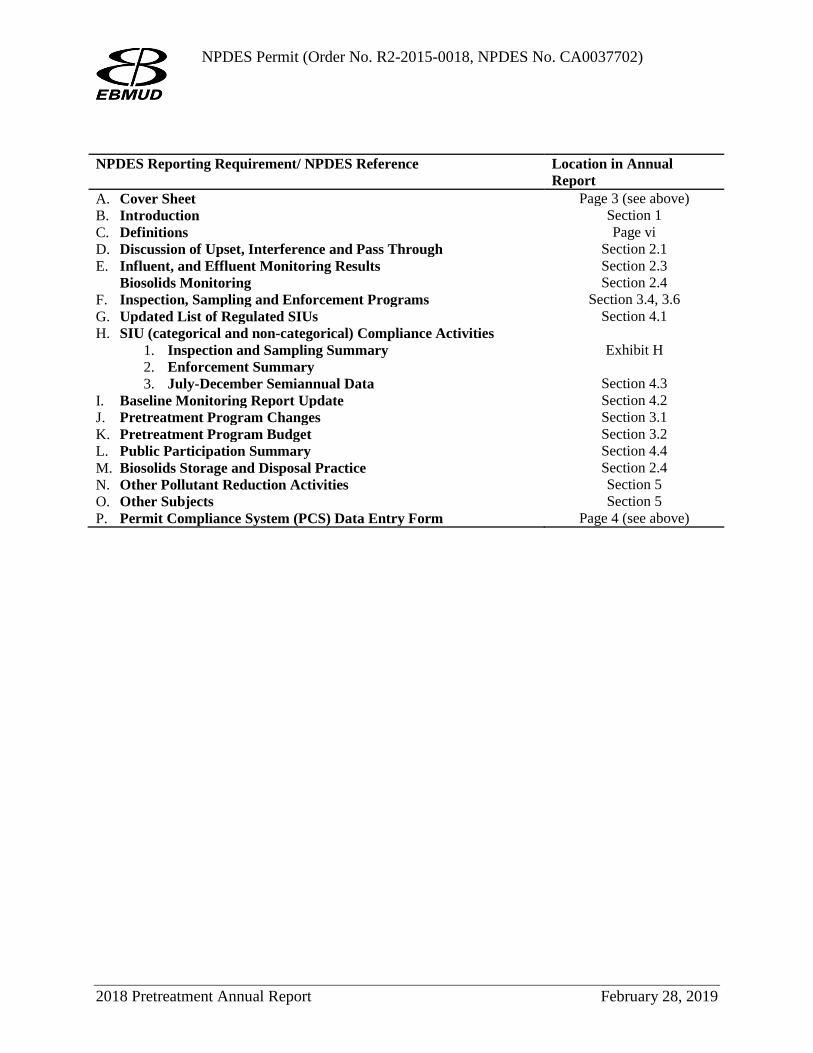
NPDES Permit (Order No. R2-2015-0018, NPDES No. CA0037702)
NPDES Reporting Requirement/ NPDES Reference Location in Annual Report
A. Cover Sheet Page 3 (see above) B. Introduction Section 1 C. Definitions Page vi D. Discussion of Upset, Interference and Pass Through Section 2.1 E. Influent, and Effluent Monitoring Results Section 2.3
Biosolids Monitoring Section 2.4 F. Inspection, Sampling and Enforcement Programs Section 3.4, 3.6 G. Updated List of Regulated SIUs Section 4.1 H. SIU (categorical and non-categorical) Compliance Activities
1. Inspection and Sampling Summary 2. Enforcement Summary 3. July-December Semiannual Data
Exhibit H
Section 4.3
I. Baseline Monitoring Report Update Section 4.2 J. Pretreatment Program Changes Section 3.1 K. Pretreatment Program Budget Section 3.2 L. Public Participation Summary Section 4.4 M. Biosolids Storage and Disposal Practice Section 2.4 N. Other Pollutant Reduction Activities Section 5 O. Other Subjects Section 5 P. Permit Compliance System (PCS) Data Entry Form Page 4 (see above)
2018 Pretreatment Annual Report February 28, 2019
NPDES Permit (Order No. R2-2015-0018, NPDES No. CA0037702)
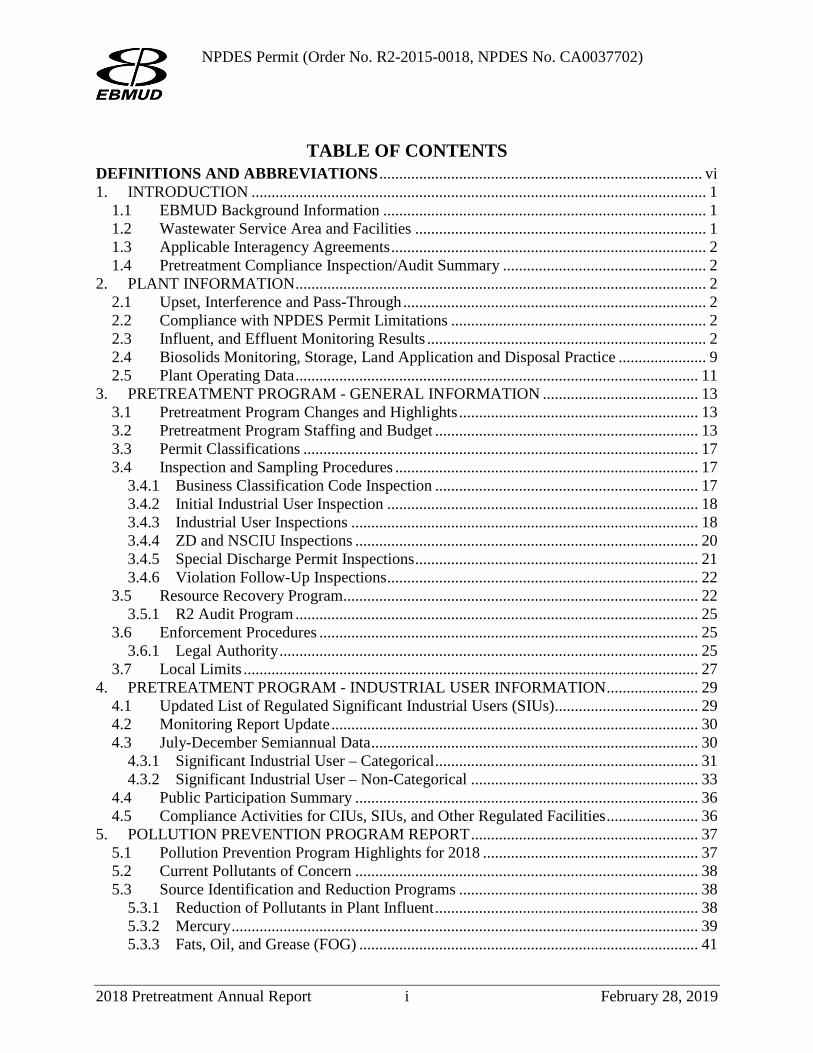
TABLE OF CONTENTS DEFINITIONS AND ABBREVIATIONS ................................................................................. vi 1. INTRODUCTION .................................................................................................................. 1
1.1 EBMUD Background Information ................................................................................. 1 1.2 Wastewater Service Area and Facilities ......................................................................... 1 1.3 Applicable Interagency Agreements ............................................................................... 2 1.4 Pretreatment Compliance Inspection/Audit Summary ................................................... 2
2. PLANT INFORMATION ....................................................................................................... 2 2.1 Upset, Interference and Pass-Through ............................................................................ 2 2.2 Compliance with NPDES Permit Limitations ................................................................ 2 2.3 Influent, and Effluent Monitoring Results ...................................................................... 2 2.4 Biosolids Monitoring, Storage, Land Application and Disposal Practice ...................... 9 2.5 Plant Operating Data ..................................................................................................... 11
3. PRETREATMENT PROGRAM - GENERAL INFORMATION ....................................... 13 3.1 Pretreatment Program Changes and Highlights ............................................................ 13 3.2 Pretreatment Program Staffing and Budget .................................................................. 13 3.3 Permit Classifications ................................................................................................... 17 3.4 Inspection and Sampling Procedures ............................................................................ 17
3.4.1 Business Classification Code Inspection .................................................................. 17 3.4.2 Initial Industrial User Inspection .............................................................................. 18 3.4.3 Industrial User Inspections ....................................................................................... 18 3.4.4 ZD and NSCIU Inspections ...................................................................................... 20 3.4.5 Special Discharge Permit Inspections ....................................................................... 21 3.4.6 Violation Follow-Up Inspections .............................................................................. 22
3.5 Resource Recovery Program ......................................................................................... 22 3.5.1 R2 Audit Program ..................................................................................................... 25
3.6 Enforcement Procedures ............................................................................................... 25 3.6.1 Legal Authority ......................................................................................................... 25
3.7 Local Limits .................................................................................................................. 27 4. PRETREATMENT PROGRAM - INDUSTRIAL USER INFORMATION ....................... 29
4.1 Updated List of Regulated Significant Industrial Users (SIUs) .................................... 29 4.2 Monitoring Report Update ............................................................................................ 30 4.3 July-December Semiannual Data .................................................................................. 30
4.3.1 Significant Industrial User – Categorical .................................................................. 31 4.3.2 Significant Industrial User – Non-Categorical ......................................................... 33
4.4 Public Participation Summary ...................................................................................... 36 4.5 Compliance Activities for CIUs, SIUs, and Other Regulated Facilities ....................... 36
5. POLLUTION PREVENTION PROGRAM REPORT ......................................................... 37 5.1 Pollution Prevention Program Highlights for 2018 ...................................................... 37 5.2 Current Pollutants of Concern ...................................................................................... 38 5.3 Source Identification and Reduction Programs ............................................................ 38
5.3.1 Reduction of Pollutants in Plant Influent .................................................................. 38 5.3.2 Mercury ..................................................................................................................... 39 5.3.3 Fats, Oil, and Grease (FOG) ..................................................................................... 41
2018 Pretreatment Annual Report i February 28, 2019
NPDES Permit (Order No. R2-2015-0018, NPDES No. CA0037702)
5.3.4 Copper ....................................................................................................................... 45 5.3.5 Cyanide ..................................................................................................................... 49 5.3.6 Polychlorinated Biphenyls (PCBs) ........................................................................... 51 5.3.7 Pharmaceutical Disposal ........................................................................................... 52 5.3.8 Pesticides................................................................................................................... 52
5.4 San Francisco Bay Stewardship .................................................................................... 53 5.5 Outreach to EBMUD Employees .................................................................................. 53
5.5.1 Employee Events & Activities .................................................................................. 53 5.5.2 Employee Electronic Communications..................................................................... 54
5.6 Public Outreach Programs ............................................................................................ 55 5.6.1 Outreach to Industrial/Commercial Facilities and Government Agencies ............... 55 5.6.2 Outreach to Non-governmental Organizations (NGOs) and Government Agencies 55 5.6.3 MWWTP Tours Program .......................................................................................... 56 5.6.4 Outreach to Schools .................................................................................................. 56 5.6.5 Outreach to Residential Community ......................................................................... 56
5.7 Criteria used to Measure the Programs’ and Tasks’ Effectiveness............................... 62
2018 Pretreatment Annual Report ii February 28, 2019
NPDES Permit (Order No. R2-2015-0018, NPDES No. CA0037702)
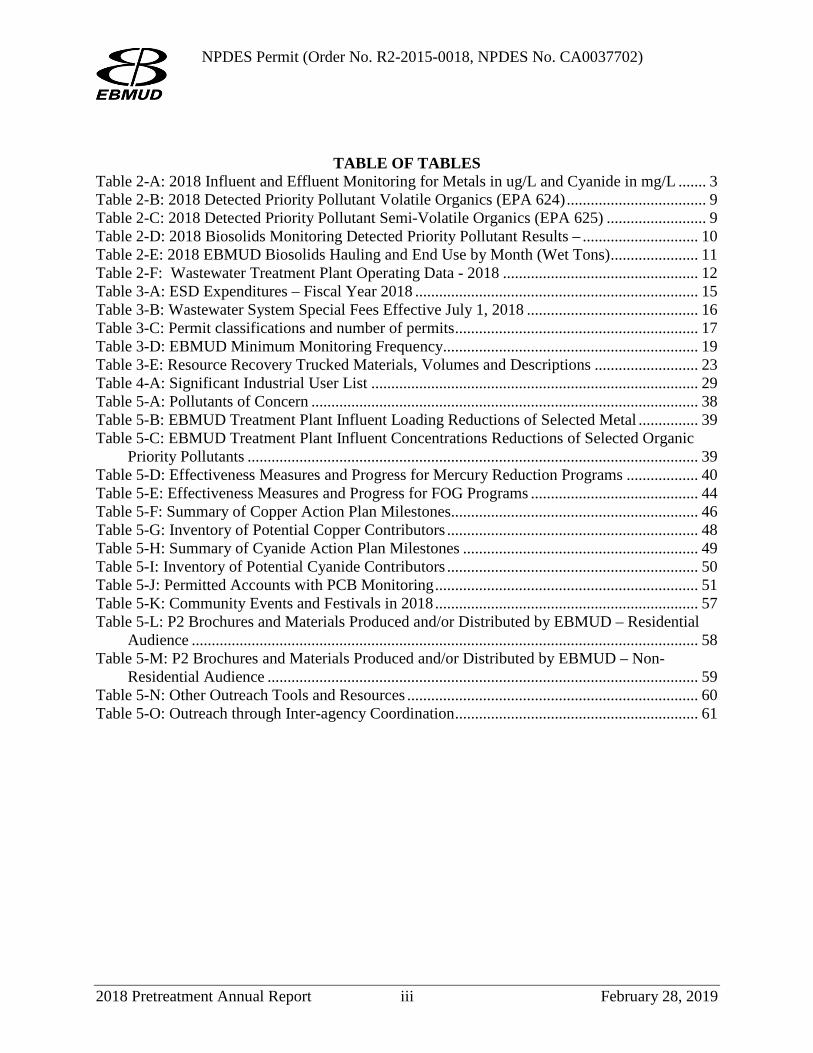
TABLE OF TABLES Table 2-A: 2018 Influent and Effluent Monitoring for Metals in ug/L and Cyanide in mg/L ....... 3 Table 2-B: 2018 Detected Priority Pollutant Volatile Organics (EPA 624) ................................... 9 Table 2-C: 2018 Detected Priority Pollutant Semi-Volatile Organics (EPA 625) ......................... 9 Table 2-D: 2018 Biosolids Monitoring Detected Priority Pollutant Results – ............................. 10 Table 2-E: 2018 EBMUD Biosolids Hauling and End Use by Month (Wet Tons) ...................... 11 Table 2-F: Wastewater Treatment Plant Operating Data - 2018 ................................................. 12 Table 3-A: ESD Expenditures – Fiscal Year 2018 ....................................................................... 15 Table 3-B: Wastewater System Special Fees Effective July 1, 2018 ........................................... 16 Table 3-C: Permit classifications and number of permits ............................................................. 17 Table 3-D: EBMUD Minimum Monitoring Frequency................................................................ 19 Table 3-E: Resource Recovery Trucked Materials, Volumes and Descriptions .......................... 23 Table 4-A: Significant Industrial User List .................................................................................. 29 Table 5-A: Pollutants of Concern ................................................................................................. 38 Table 5-B: EBMUD Treatment Plant Influent Loading Reductions of Selected Metal ............... 39 Table 5-C: EBMUD Treatment Plant Influent Concentrations Reductions of Selected Organic
Priority Pollutants ................................................................................................................. 39 Table 5-D: Effectiveness Measures and Progress for Mercury Reduction Programs .................. 40 Table 5-E: Effectiveness Measures and Progress for FOG Programs .......................................... 44 Table 5-F: Summary of Copper Action Plan Milestones.............................................................. 46 Table 5-G: Inventory of Potential Copper Contributors ............................................................... 48 Table 5-H: Summary of Cyanide Action Plan Milestones ........................................................... 49 Table 5-I: Inventory of Potential Cyanide Contributors ............................................................... 50 Table 5-J: Permitted Accounts with PCB Monitoring .................................................................. 51 Table 5-K: Community Events and Festivals in 2018 .................................................................. 57 Table 5-L: P2 Brochures and Materials Produced and/or Distributed by EBMUD – Residential
Audience ............................................................................................................................... 58 Table 5-M: P2 Brochures and Materials Produced and/or Distributed by EBMUD – Non-
Residential Audience ............................................................................................................ 59 Table 5-N: Other Outreach Tools and Resources ......................................................................... 60 Table 5-O: Outreach through Inter-agency Coordination ............................................................. 61
2018 Pretreatment Annual Report iii February 28, 2019
NPDES Permit (Order No. R2-2015-0018, NPDES No. CA0037702)
TABLE OF FIGURES
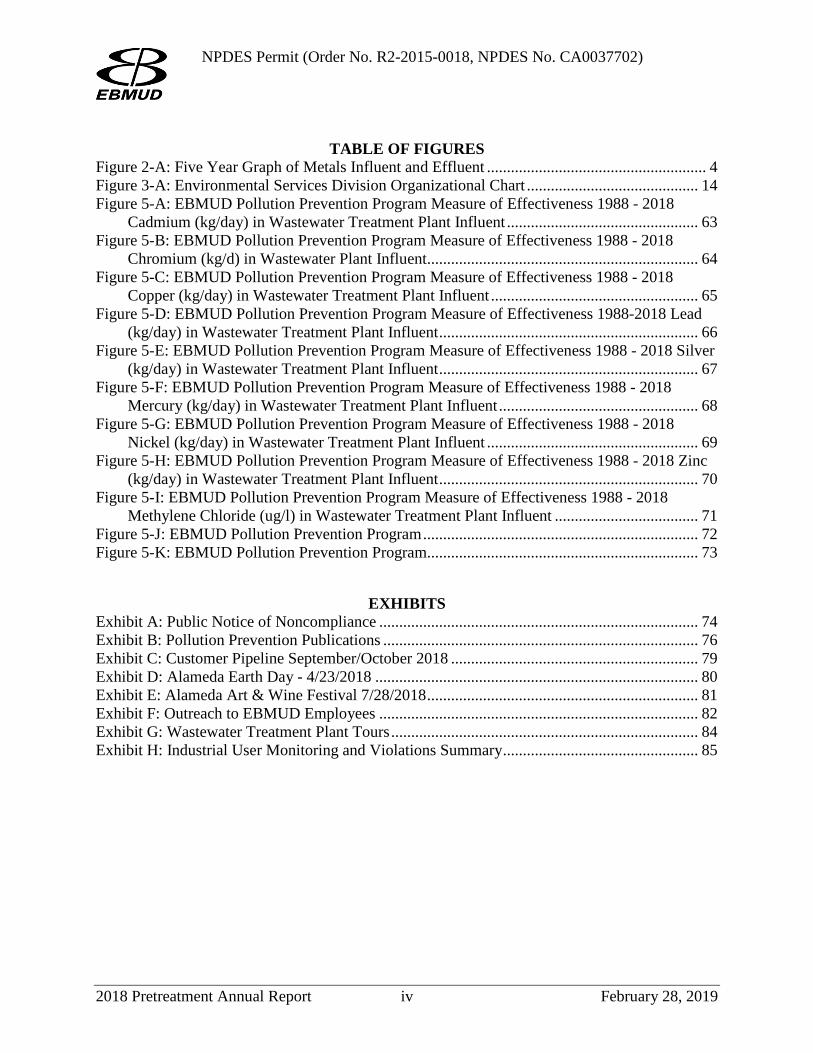
Figure 2-A: Five Year Graph of Metals Influent and Effluent ....................................................... 4 Figure 3-A: Environmental Services Division Organizational Chart ........................................... 14 Figure 5-A: EBMUD Pollution Prevention Program Measure of Effectiveness 1988 - 2018
Cadmium (kg/day) in Wastewater Treatment Plant Influent ................................................ 63 Figure 5-B: EBMUD Pollution Prevention Program Measure of Effectiveness 1988 - 2018
Chromium (kg/d) in Wastewater Plant Influent .................................................................... 64 Figure 5-C: EBMUD Pollution Prevention Program Measure of Effectiveness 1988 - 2018
Copper (kg/day) in Wastewater Treatment Plant Influent .................................................... 65 Figure 5-D: EBMUD Pollution Prevention Program Measure of Effectiveness 1988-2018 Lead
(kg/day) in Wastewater Treatment Plant Influent ................................................................. 66 Figure 5-E: EBMUD Pollution Prevention Program Measure of Effectiveness 1988 - 2018 Silver
(kg/day) in Wastewater Treatment Plant Influent ................................................................. 67 Figure 5-F: EBMUD Pollution Prevention Program Measure of Effectiveness 1988 - 2018
Mercury (kg/day) in Wastewater Treatment Plant Influent .................................................. 68 Figure 5-G: EBMUD Pollution Prevention Program Measure of Effectiveness 1988 - 2018
Nickel (kg/day) in Wastewater Treatment Plant Influent ..................................................... 69 Figure 5-H: EBMUD Pollution Prevention Program Measure of Effectiveness 1988 - 2018 Zinc
(kg/day) in Wastewater Treatment Plant Influent ................................................................. 70 Figure 5-I: EBMUD Pollution Prevention Program Measure of Effectiveness 1988 - 2018
Methylene Chloride (ug/l) in Wastewater Treatment Plant Influent .................................... 71 Figure 5-J: EBMUD Pollution Prevention Program ..................................................................... 72 Figure 5-K: EBMUD Pollution Prevention Program.................................................................... 73
EXHIBITS Exhibit A: Public Notice of Noncompliance ................................................................................ 74 Exhibit B: Pollution Prevention Publications ............................................................................... 76 Exhibit C: Customer Pipeline September/October 2018 .............................................................. 79 Exhibit D: Alameda Earth Day - 4/23/2018 ................................................................................. 80 Exhibit E: Alameda Art & Wine Festival 7/28/2018 .................................................................... 81 Exhibit F: Outreach to EBMUD Employees ................................................................................ 82 Exhibit G: Wastewater Treatment Plant Tours ............................................................................. 84 Exhibit H: Industrial User Monitoring and Violations Summary ................................................. 85
2018 Pretreatment Annual Report iv February 28, 2019
NPDES Permit (Order No. R2-2015-0018, NPDES No. CA0037702) DEFINITIONS AND ABBREVIATIONS Definitions Baseline Monitoring Report (BMR): The report required by the Control Authority from industrial users subject to Categorical Pretreatment Standards. The BMR due dates and contents are cited in 40 CFR403.6 and 403.12. Best Management Practices (BMPs): Schedules of activities, prohibitions of practices, maintenance procedures, and other management practices to implement the prohibitions listed in EBMUD Wastewater Control Ordinance, Title II, Section 2. BMPs also include treatment requirements, operating procedures, and practices to control plant site runoff, spillage or leaks, sludge or waste disposal, or drainage from raw materials storage. Biosolids: The solid organic matter made from the anaerobic digestion of sewage sludge. Business Classification Code (BCC): A classification of dischargers based on the 1987 Standard Industrial Classification Manual, Office of Management and Budget of the United States of America. Bypass: The intentional diversion of waste streams from any portion of a treatment facility. Categorical Industry: An industry that must comply with National Categorical Pretreatment Standards as published by EPA. Categorical Industrial User (CIU): A discharger subject to a categorical pretreatment standard. Categorical Pretreatment Standards: Any regulation containing pollutant discharge limits promulgated by the EPA in accordance with Section 307(b) and (c) of the Clean Water Act, which applies to Industrial Users. Includes prohibitive discharge limits established pursuant to 40 Code of Federal Regulations, 403.5. [Ref. 40 Code of Federal Regulations, 403.3(j)]. Cease and Desist Order (CDO): An order issued by the Director of Wastewater directing a discharger to achieve compliance with permit requirements and/or EBMUD Wastewater Control Ordinance. Chemical Oxygen Demand (COD) - filtered: The amount of Chemical Oxygen Demand passing through a glass filter as measured in conformance with EBMUD's approved method. Chemical oxygen demand is the measure of the oxygen equivalent of the organic matter of a sample that is susceptible to oxidation by a strong chemical oxidant. Closed (CL) Facility: A facility that no longer operates within the EBMUD SD-1 service area. Compliance Schedule: Action(s) required of an industrial discharger to comply with pretreatment regulations. A compliance schedule may be included as a condition of the industrial discharger's wastewater discharge permit, or by an Administrative or Judicial Order. Compliance Status: Determined through review of monitoring data and other information to assess an industrial discharger's compliance with schedules, reporting requirements, and applicable pretreatment standards. An industrial discharger's compliance status is reported quarterly as consistent compliance, inconsistent compliance, significant non-compliance, or unknown.
2018 Pretreatment Annual Report vi February 28, 2019
NPDES Permit (Order No. R2-2015-0018, NPDES No. CA0037702) Consistent Compliance (C): The compliance status assigned to an industrial discharger having no violation during the last reporting quarter and no unresolved significant non-compliance issues from the previous reporting quarter. Delist: The removal of an industrial user from EBMUD’s Significant Industrial Users list. Director: Director of the Wastewater Department of the EBMUD or his/her designated representative. Discharge Minimization Permit: Mandatory permit that includes monitoring and/or reporting requirements. East Bay Municipal Utility District (EBMUD): A municipal utility district formed under Division 6 of the Public Utilities Code of the State of California, also known as the Municipal Utility District Act (MUD Act), which provides water and wastewater service to East Bay communities. [Ref. MUD Act, Division 6, Chapter 1, Article 1, Section 11503] EBMUD Wastewater Control Ordinance: The Ordinance enacted by the EBMUD Board of Directors establishing regulations for: 1) the interception, treatment, and disposal of wastewater and industrial wastes, 2) control of wastewater, including discharger classification and issuance of permits, 3) charges, and 4) penalties for violations of the Ordinance, revision effective August 22, 2013. EBMUD Special District No. 1 (SD-1): The special district for sewage disposal created under Division 6 of the Public Utilities Code of the State of California, also known as the Municipal Utility District Act (MUD Act), to provide treatment of wastewater from East Bay communities. [Ref. MUD Act, Division 6, Chapter 8, Article 1, Section 13451]. Estimation Permit: Optional permit issued to dischargers who request an estimation of wastewater flow or whose discharge is less than the normal range of wastewater strength for the BCC to which it is assigned. Federal Categorical: See Categorical Industry. Food Service Establishment (FSE): Any facility preparing and/or serving food for commercial use or sale. This includes restaurants, cafes, lunch counters, cafeterias, hotels, hospitals, convalescent homes, factory or school kitchens, catering kitchens, bakeries, grocery stores with food preparation and packaging, and meat cutting and preparation (excluding grocery stores with only food warming operations), meat packing facilities and other FSEs not listed above where cooking fats, oils and grease may be introduced into the community sewer system. General Pretreatment Regulations: Any regulations promulgated by the EPA in accordance with Sections 307(b) and (c) and 402(b)(8) of the Act (33 U.S.C. 1347) for the implementation, administration and enforcement of pretreatment standards. Groundwater Permit: Discharge minimization permit issued to dischargers of groundwater that serves as a waiver to the prohibition of groundwater discharges found in EBMUD Wastewater Control Ordinance, Title I, Section 5. Inconsistent Compliance (IC): The compliance status assigned to an industrial discharger having one or more violations during a reporting quarter, which did not result in significant non-compliance, and no long-term pattern of violations.
2018 Pretreatment Annual Report vii February 28, 2019
NPDES Permit (Order No. R2-2015-0018, NPDES No. CA0037702) Indirect Discharge: The introduction of pollutants into a publicly owned treatment works from any non-domestic source regulated under section 307(b), (c) or (d) of the Clean Water Act. [Ref. 40 Code of Federal Regulations, 403.3(g)]. Industrial User (IU): A source of indirect discharge. [Ref. 40 Code of Federal Regulations, 403.3(h)]. Interceptor: All transmission systems, including all pipes, force mains, gravity sewer lines, lift stations, and pump stations that are owned and operated by EBMUD. Interference: A discharge, which, alone or in conjunction with a discharge or discharges from other sources, both: (1) Inhibits or disrupts the Publically Owned Treatment Works (POTW), its treatment processes or
operations, or its sludge processes, use or disposal; and (2) Therefore is a cause of a violation of any requirement of the POTW's NPDES permit (including an
increase in the magnitude or duration of a violation) or of the prevention of sewage sludge use or disposal in compliance with the following statutory provisions and regulations or permits issued thereunder (or more stringent State or local regulations): Section 405 of the Clean Water Act, the Solid Waste Disposal Act (SWDA) (including Title II, more commonly referred to as the Resource Conservation and Recovery Act (RCRA)), and including State regulations contained in any State sludge management plan prepared pursuant to subtitle D of the SWDA), the Clean Air Act, the Toxic Substances Control Act, and the Marine Protection, Research and Sanctuaries Act. [Ref. 40 Code of Federal Regulations, 403.3(h)]
Mandatory Permit: A permit that must be obtained by dischargers who are in the categories cited in the EBMUD Wastewater Control Ordinance, Title IV, Section 1.a. National Pollutant Discharge Elimination System (NPDES): The national program established under the Clean Water Act to regulate discharges to the navigable waters of the United States. [Ref. Clean Water Act, Title IV, Section 402]. New Permit: A Minimization, Estimation, Special Discharge or Pollution Prevention Permit that was not in effect during the previous reporting year. New Source: (1) Any building, structure, facility, or installation from which there is or may be a discharge of pollutants, the construction of which commenced after the publication of proposed pretreatment standards which will be applicable to such source if such standards are thereafter promulgated, provided that:
(i) The building, structure, facility or installation is constructed at a site at which no other source is located; or
(ii) The building, structure, facility or installation totally replaces the process or production equipment that causes the discharge of pollutants at an existing source; or
(iii) The production or wastewater generating processes of the building, structure, facility or installation are substantially independent of an existing source at the same site. In determining whether these are substantially independent, factors such as the extent to which the new facility is integrated with the existing plant, and the extent to which the new facility is engaged in the same general type of activity as the existing source should be considered.
(2) Construction on a site at which an existing source is located results in a modification rather than a New Source if the construction does not create a new building, structure, facility or installation meeting the criteria of paragraphs (1)(ii) or (1)(iii) of this section, but otherwise alters, replaces, or adds to existing process or production equipment.
2018 Pretreatment Annual Report viii February 28, 2019
NPDES Permit (Order No. R2-2015-0018, NPDES No. CA0037702) (3) Construction of a new source as defined under this paragraph has commenced if the owner or operator has:
(i) Begun, or caused to begin as part of a continuous onsite construction program: a. Any placement, assembly, or installation of facilities or equipment; or b. Significant site preparation work including clearing, excavation, or removal of
existing buildings, structures, or facilities which is necessary for the placement, assembly, or installation of new source facilities or equipment; or
(ii) Entered into a binding contractual obligation for the purchase of facilities or equipment, which are intended to be used in its operation within a reasonable time. Options to purchase or contracts which can be terminated or modified without substantial loss, and contracts for feasibility, engineering, and design studies do not constitute a contractual obligation under this paragraph.
Non-Categorical Industry: An industry that is exempt from the Categorical Pretreatment Standards. Non-Significant Categorical Industrial User A categorical industrial user that meets the following criteria: Never discharges more than 100 gallons per day of total categorical wastewater and (1) Has consistently complied with all applicable categorical pretreatment standards and requirements (2) Annually submits the certification statement required in 40 CFR 403.12(q) (3) Never discharges any untreated concentrated wastewater. NPDES Permit: The regulatory agency document issued either by a federal or state agency which is designed to control all discharges of pollutants into navigable waters from all point sources of pollution, including industries and publicly owned treatment works. Optional Permit: A permit that may be issued to dischargers who apply for such permit as cited in the EBMUD Wastewater Control Ordinance, Title IV, Section 1.b. Pass-Through: Discharge which exits a publicly owned treatment works (POTW) into waters of the United States in quantities or concentrations which, alone or in conjunction with a discharge or discharges from other sources, is a cause of violation of any requirement of the POTW's NPDES permit (including an increase in the magnitude or duration of a violation). [Ref. 40 Code of Federal Regulations, 403.3(n)] Pollution Prevention (P2): An activity that eliminates or reduces the amount of any pollutant from entering the waste stream or the environment. Pollution Prevention (P2) Permit: Mandatory permits for certain BCCs that contain best management practices to reduce or eliminate pollutants discharged to the sanitary sewer. Publicly Owned Treatment Works (POTW): A treatment works as defined by Section 212 of the Clean Water Act, which is owned by the District. This definition includes any District-owned devices and systems used in the storage, treatment, recycling and reclamation of municipal sewage or industrial wastes of a liquid nature. It also includes District-owned sewers, pipes and other conveyances that convey wastewater to that portion of the POTW which is designed to provide treatment (including recycling and reclamation) of municipal sewage and industrial waste. Pretreatment: The reduction of the amount of pollutants, the elimination of pollutants or the alteration of the nature of pollutant properties in wastewater through physical, chemical or biological processes or process changes prior to or in lieu of discharging these pollutants into a POTW. [Ref. 40 Code of Federal Regulations, 403.3(q)]
2018 Pretreatment Annual Report ix February 28, 2019
NPDES Permit (Order No. R2-2015-0018, NPDES No. CA0037702) Reclassified (RC): An IU regulated under a Minimization (federal categorical or local), Estimation or Pollution Prevention Permit that becomes regulated under a different one of these permits. Recycling: Reuse of materials that would otherwise be considered waste. Recycled Water: Wastewater that has been treated to reduce contaminants to low enough levels to enable the water to be used again safely for certain beneficial uses or controlled uses that would not otherwise occur. Reissued (RI): Existing P2 Permits that are renewed. Resource Recovery Permit: A mandatory permit that regulates the trucked materials arriving at the SD-1 Wastewater Treatment Plant for treatment. Satellite: Seven East Bay wastewater collection system agencies which consists of; City of Alameda, City of Albany, City of Berkeley, City of Emeryville, City of Oakland, City of Piedmont, and Stege Sanitary District. Significant Industrial User (SIU): (1) A user subject to Categorical Pretreatment Standards; or (2) A user that:
(i) Discharges an average of twenty-five thousand (25,000) gallons per day or more of process wastewater to the POTW (excluding sanitary, noncontact cooling, and boiler blowdown wastewater);
(ii) Contributes a process wastestream which makes up five (5) percent or more of the average
dry weather hydraulic or organic capacity of the POTW treatment plant; or
(iii) Is designated as such by EBMUD on the basis that it has a reasonable potential for
adversely affecting the POTW's operation or for violating any pretreatment standard or requirement.
(3) Upon a finding that a user meeting the criteria in Subsection (2.) above has no reasonable potential
for adversely affecting the POTW's operation or for violating any pretreatment standard or requirement, EBMUD may at any time, on its own initiative or in response to a petition received from a user, determine that such user should not be considered a significant industrial user.
Significant Noncompliance: A significant industrial user (or any IU which violates paragraphs 3, 4, or 8 below) is in significant noncompliance with applicable pretreatment requirements if any violation meets one or more of the following criteria: (1) Chronic violations of wastewater discharge limits, defined as those in which sixty-six percent or more
of all of the measurements taken during a six-month period exceed (by any magnitude) a numeric pretreatment standard or requirement, including instantaneous limits, as defined by 40 CFR 403.3(l).
(2) Technical Review Criteria (TRC) violations, defined as those in which thirty-three percent or more of all of the measurements for each pollutant parameter taken during a six-month period are equal or exceed the product of the numeric pretreatment standard or requirement including instantaneous limits, as defined by 40 CFR 403.3(l) multiplied by the applicable TRC.
TRC = 1.4 for Biological Oxygen Demand, Total Suspended Solids, fats, oil and grease.
2018 Pretreatment Annual Report x February 28, 2019
NPDES Permit (Order No. R2-2015-0018, NPDES No. CA0037702)
TRC = 1.2 for all other pollutants (except pH). (3) Any other violation of a pretreatment standard or requirement as defined by 40 CFR 403.3(l) (daily
maximum or longer-term average, instantaneous limit, or narrative standard) that EBMUD determines has caused, alone or in combination with other discharges, interference or pass through (including endangering the health of POTW personnel or the general public).
(4) Any discharge of a pollutant that has caused imminent endangerment to human health, welfare or to the environment or has resulted in the POTW's exercise of its emergency authority to halt or prevent such a discharge.
(5) Failure to meet, within 90 days after the due date, a compliance schedule milestone contained in a local control mechanism or enforcement order for starting construction, completing construction, or attaining final compliance.
(6) Failure to provide, within 45 days after the due date, required reports such as baseline monitoring reports, 90-day compliance reports, periodic self-monitoring reports, and reports on compliance with compliance schedules.
(7) Failure to accurately report noncompliance. (8) Any other violation or group of violations which EBMUD determines, will adversely affect the
operation or implementation of the local pretreatment program. Slug Discharge or Loading: Any discharge at a flow rate or concentration, which could cause a violation of the prohibited discharge standards the EBMUD Wastewater Control Ordinance, Section 2.2. A slug discharge is any discharge of a non-routine, episodic nature, including but not limited to an accidental spill or non-customary batch discharge which has a reasonable potential to cause interference or pass through, or in any other way violate EBMUD’s regulations, local limits or permit conditions. Source Control: Any activity that prevents the generation of hazardous waste through a change in raw materials or product reformulation (material substitution), or operational or process improvements (process modification). Special Discharge Permit: Mandatory permit for unique or intermittent discharges that do not require a Discharge Minimization Permit. May include reporting and monitoring requirements. Terminated (T): A Minimization, Estimation or Pollution Prevention Permit that ceases to be in effect due to reasons such as business closure, business name change or regulated process change. In exceptional cases, the Director may terminate a permit for violation of the permit terms and conditions or the EBMUD Wastewater Control Ordinance provisions. A discharger who has a permit terminated by the Director is required to apply for a new permit within 30 days of notice of termination. Total Identifiable Chlorinated Hydrocarbons (TICH): The sum of the concentrations of all quantifiable values equal to or greater than the detection limit for all chlorinated hydrocarbons identified by EPA Method 624. Total Suspended Solids (TSS): The concentration of nonfilterable residue dried at 103° to 105°C on a filter in conformance with EBMUD's approved method. Upset: An exceptional incident in which there is unintentional and temporary non-compliance with an IU’s discharge limitations because of factors beyond the reasonable control of the IU. Violation Follow-Up Inspection: An inspection specifically conducted to continue investigation of a past violation and assess the industry's compliance status. Wastewater Control Ordinance: See EBMUD Wastewater Control Ordinance.
2018 Pretreatment Annual Report xi February 28, 2019
NPDES Permit (Order No. R2-2015-0018, NPDES No. CA0037702) Wastewater Discharge Permit: This permit type establishes general and site-specific compliance and reporting requirements, applicable discharge limitations self-monitoring requirements and billing conditions for unique wastewater strengths and flow as applicable. Waste Minimization: See Pollution Prevention. Main Wastewater Treatment Plant (MWWTP): EBMUD’s Main Wastewater Treatment Plant located at 2020 Wake Avenue, Oakland, California. Wet Weather Facility: A remote wastewater facility designed to provide treatment of additional wet weather flows. EBMUD’s Wet Weather Facilities were built to provide additional wet weather flow capacity and reduce overflows of untreated wastewater during peak storm events. Zero Discharge Categorical Industrial User (Zero Discharger): a categorical industrial user that never discharges process wastewater.
Abbreviations BAPPG: Bay Area Pollution Prevention Group BCC: Business Classification Code BMPs: Best Management Practices BMR: Baseline Monitoring Report C: Consistent Compliance CDO: Cease and Desist Order CL: Closed CODF: Chemical Oxygen Demand (filtered) EBMUD: East Bay Municipal Utility District EPA: United States Environmental Protection Agency FOG: Fats, Oils, and Grease FY: Fiscal Year GCD: Grease Control Device IC: Inconsistent Compliance IU: Industrial User MGD: Million gallons per day
2018 Pretreatment Annual Report xii February 28, 2019
NPDES Permit (Order No. R2-2015-0018, NPDES No. CA0037702) MWWTP: Main Wastewater Treatment Plant NOV: Notice of Violation (Violation Notice) NPDES: National Pollutant Discharge Elimination System POTW: Publicly Owned Treatment Works RC: Reclassified RCRA: Resource Conservation and Recovery Act RI: Reissued RMP: Regional Monitoring Program RWQCB: The San Francisco Bay Regional Water Quality Control Board SD-1: EBMUD Special District No. 1 SIU: Significant Industrial User SNC: Significant Non-compliance SWDA: Solid Waste Disposal Act T: Terminated TTO: Total Toxic Organics TRC: Technical Review Criteria TSS: Total Suspended Solids WWF: Wet Weather Facility
2018 Pretreatment Annual Report xiii February 28, 2019
THIS PAGE INTENTIONALLY LEFT BLANK
NPDES Permit (Order No. R2-2015-0018, NPDES No. CA0037702) 1. INTRODUCTION This 2018 report includes the Pretreatment Annual Report and the Pollution Prevention Annual Report. The Pollution Prevention (P2) Report is fully contained in Chapter 5.
1.1 EBMUD Background Information The East Bay Municipal Utility District (EBMUD) is a publicly owned utility formed under the Municipal Utility District (MUD) Act that was passed by the California state legislature in 1921. In accordance with the MUD Act’s provisions, voters in the East San Francisco Bay Area created EBMUD in 1923 to provide water service. The MUD Act was amended in 1941 to enable formation of special districts. In 1944, voters in six East Bay cities elected to form EBMUD’s Special District No. 1 (SD-1) to provide treatment of wastewater discharged to the San Francisco Bay. In 1971, the Stege Sanitary District was annexed to SD-1.
1.2 Wastewater Service Area and Facilities EBMUD formed the Wastewater Department following approval of SD-1. The Wastewater Department is responsible for treatment and disposal of domestic, commercial and industrial wastewater from the cities of Alameda, Albany, Berkeley, Emeryville, Oakland, Piedmont and the Stege Sanitary District, which includes the City of El Cerrito, the Richmond Annex and unincorporated Kensington. The individual communities own and maintain their collection systems (sewers and pumping stations) and discharge to one of five EBMUD interceptors. The Wastewater Department owns and operates the interceptors, the Main Wastewater Treatment Plant (MWWTP), a deep-water outfall into San Francisco Bay, and three wet weather facilities (WWFs). Detailed information about EBMUD’s service area and wastewater facilities is provided below. • EBMUD's wastewater service area is 88 square miles, which includes approximately 1,600
miles of community-owned and maintained sanitary sewers. • EBMUD’s Wastewater Department serves a population of approximately 685,000, which
includes approximately 177,000 accounts, of which over 18,000 are commercial, industrial, and institutional users.
• EBMUD owns and maintains 29 miles of gravity sewer interceptors, 15 pumping stations, and 9 miles of sewer force mains.
• The MWWTP provides secondary treatment for a design capacity of 168 million gallons per day (MGD). Primary treatment is provided for up to 320 MGD. The maximum wet weather capacity including storage is 415 MGD. The 2018 average dry weather influent flow rate was 54 MGD.
• The Oakport, Point Isabel, and San Antonio Creek WWFs provide additional wet weather capacity of 158 MGD, 100 MGD and 51 MGD, respectively. The flow to all the WWFs undergoes screening, chlorination, and dechlorination.
2018 Pretreatment Annual Report 1 February 28, 2019
NPDES Permit (Order No. R2-2015-0018, NPDES No. CA0037702) 1.3 Applicable Interagency Agreements EBMUD approved its original wastewater control ordinance in 1973, which established wastewater quality standards for all wastewater discharges into community sewers discharging to the EBMUD interceptor system. The wastewater control ordinance has been updated and revised several times over the years and the current version (revised in 2013) is available on EBMUD’s website.
1.4 Pretreatment Compliance Inspection/Audit Summary A Pretreatment Compliance Inspection (PCI) was conducted on January 25-26, 2017, by contractor Tetra Tech, acting on behalf of the Regional Water Quality Control Board (Regional Board) and the Environmental Protection Agency (EPA). The 2017 PCI Summary Report was received by EBMUD on February 23, 2018. As detailed in letters submitted to the Regional Board on April 23, 2018 and December 31, 2018, EBMUD has implemented the requirements and recommendations in the PCI Summary Report. A Pretreatment Compliance Audit (PCA) was conducted for EBMUD on January 28 and 29. EBMUD is waiting to receive a copy of the report from the PCA. There were no Cleanup and Abatement Orders (CAO) or other enforcement related actions required by the Regional Water Quality Control Board or the EPA.
2. PLANT INFORMATION
2.1 Upset, Interference and Pass-Through In 2018, there were no upsets, interference, or pass-through discharges at the MWWTP.
2.2 Compliance with NPDES Permit Limitations The MWWTP NPDES permit CA0037702 was adopted in 2015. Order number R2-2015-0018 became effective on July 1, 2015 and expires on June 30, 2020. No violations of any effluent limitations for the MWWTP were recorded in 2018, and the MWWTP performed as expected.
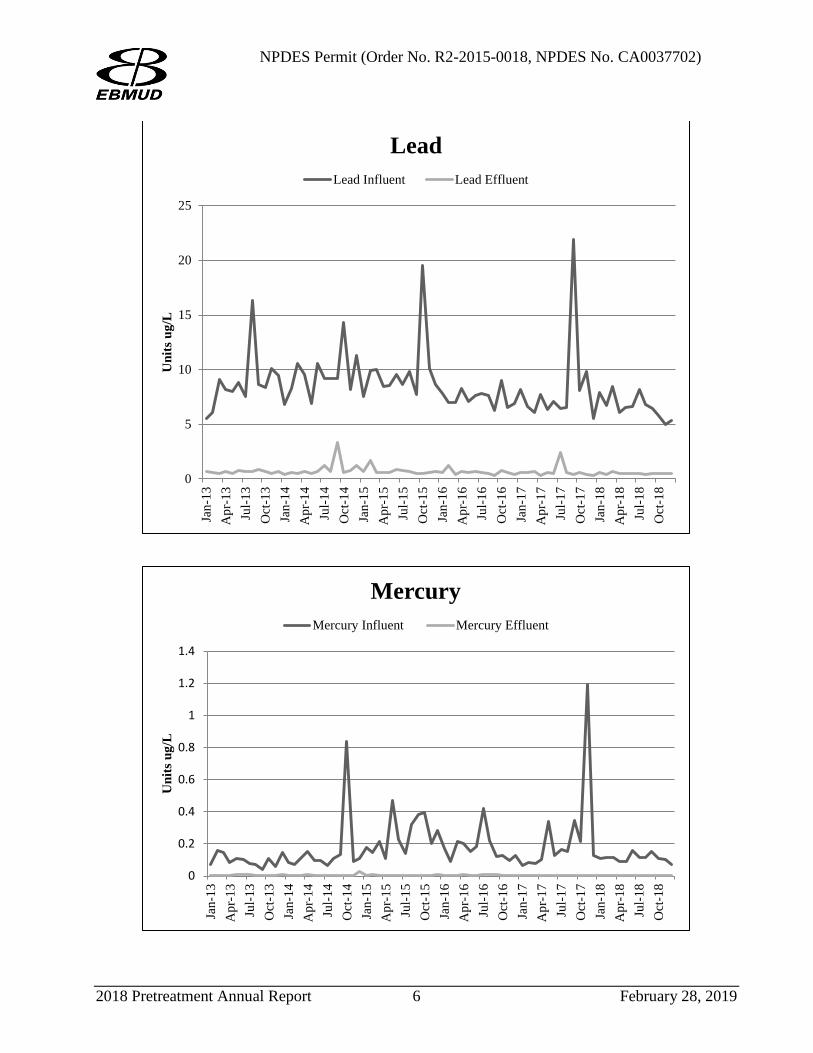
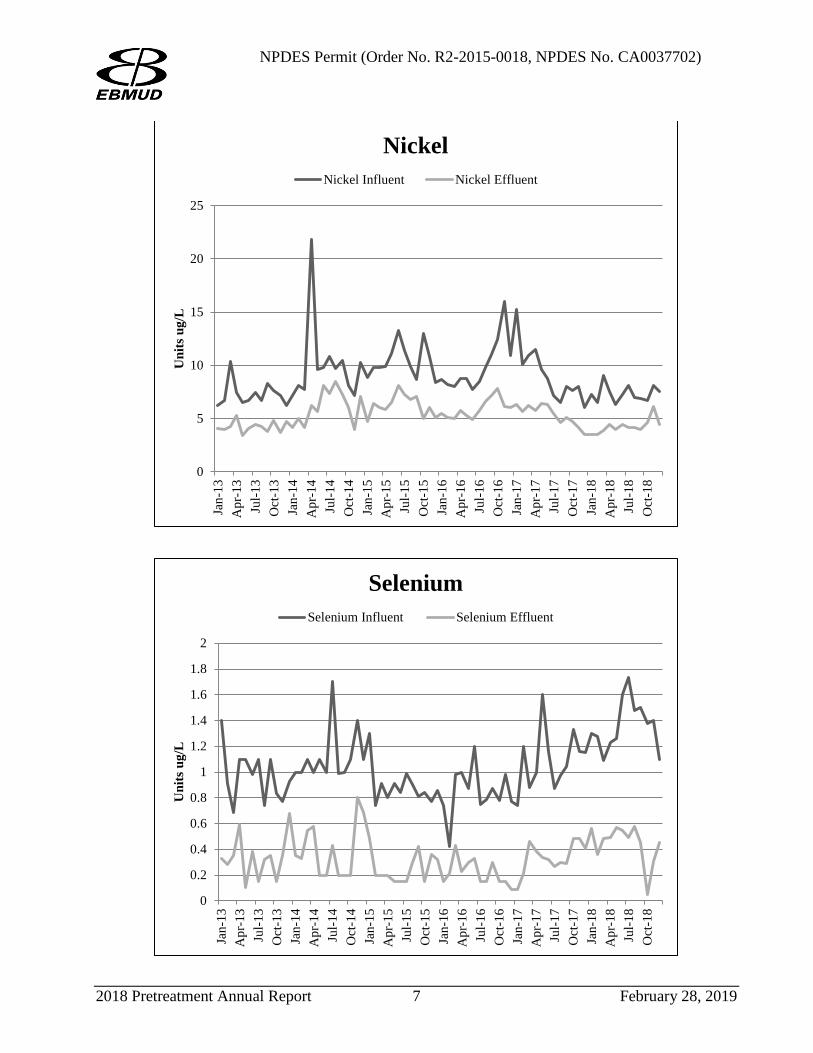
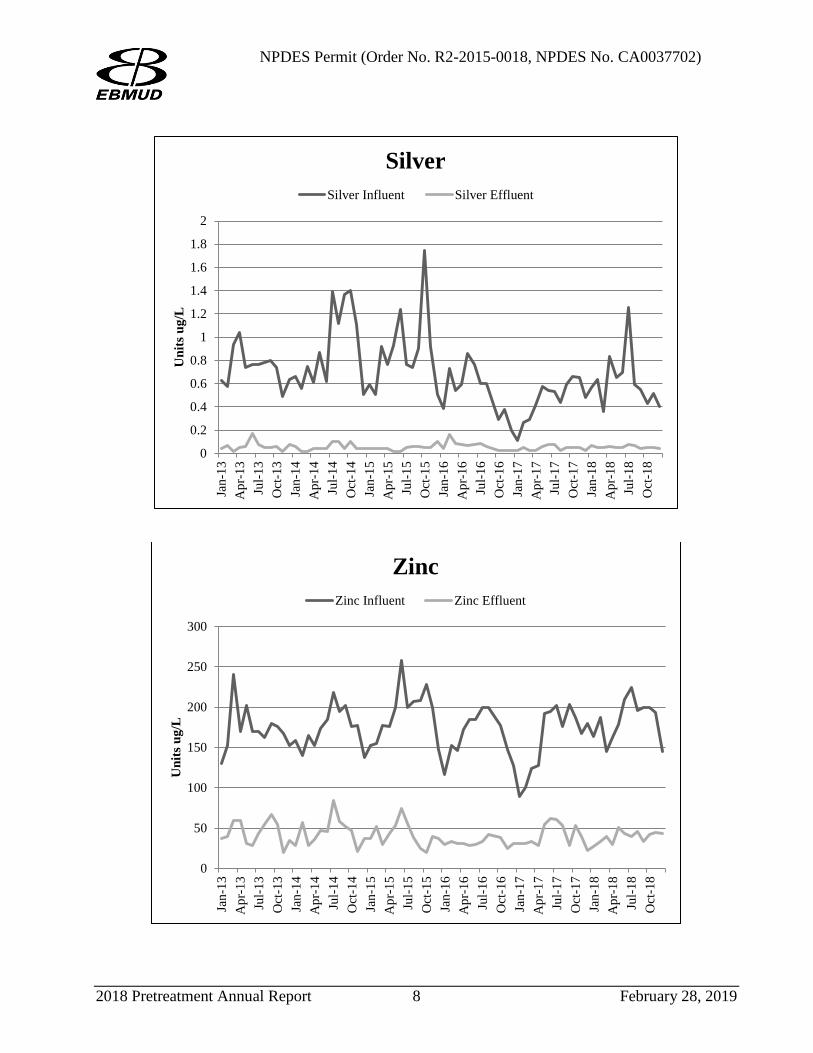
2.3 Influent, and Effluent Monitoring Results Table 2-A summarizes the analytical results for 2018 influent and effluent metals and cyanide. Generally, metals values seem consistent with those observed in previous years but, as shown in the graphs in Figure 2A below, a periodic increase can be observed in certain metals and an increasing trend in selenium values in the influent during 2018. EBMUD staff has not identified any definitive sources, but suspects that the increases may be associated with interceptor cleaning projects causing sediments with high metals to be flushed downstream. EBMUD has been conducting weekly influent sampling for metals and will continue to monitor metals concentrations in the influent in order to help identify trends and potential sources. The effluent metals concentrations remain low.
2018 Pretreatment Annual Report 2 February 28, 2019
NPDES Permit (Order No. R2-2015-0018, NPDES No. CA0037702)
Table 2-A: 2018 Influent and Effluent Monitoring for Metals in ug/L and Cyanide in mg/L Parameter Location Method January February March April May June July August September October November December
Arsenic
Influent EPA 200.8 3.64 3.23 3.35 2.85 2.88 3.33 3.43 3.34 3.48 3.46 5.2 5.25
Effluent EPA 200.8 2.9 2.3 3.1 2.5 2.7 2.9 2.8 3.1 2.4 2.4 2.9 3.5
Cadmium
Influent EPA 200.8 0.26 0.33 0.36 0.27 0.32 0.33 0.37 0.31 0.3 0.31 0.27 0.23
Effluent EPA 200.8 0.01 0.01 0.19 0.04 0.05 0.06 0.09 0.05 0.17 0.09 0.12 0.05
Chromium
Influent EPA 200.8 4.88 4.35 4.88 5.08 4.18 5.35 6.88 4.76 4.83 3.74 5.33 4.03
Effluent EPA 200.8 0.59 0.92 0.74 0.89 0.71 0.73 0.98 1.5 0.91 0.69 0.65 0.64
Copper
Influent EPA 200.8 65.6 77.5 55 62.75 70 81 92.25 77.8 80.25 74.2 71.25 60.5
Effluent EPA 200.8 9.23 6.4 6.4 5.2 5.6 6.3 5.6 6.1 5.2 6.3 4.7 7.3
Cyanide
Influent SM4500-CN C, E 0.0013 0.0013 0.0013 0.0039 0.0026 0.0032 0.001 0.001 0.0042 0.0026 0.0025 0.0018
Effluent 10-204-00-1X 0.0013 0.0013 0.0013 0.0013 0.003 0.0064 0.0028 0.0031 0.003 0.0012 0.0017 0.0028
Lead
Influent EPA 200.8 7.94 6.73 8.48 6.1 6.54 6.6 8.15 6.78 6.45 5.82 6.48 5.35
Effluent EPA 200.8 0.55 0.42 0.68 0.49 0.51 0.48 0.5 0.38 0.47 0.45 0.48 0.5
Mercury
Influent EPA 245.1 0.1078 0.1145 0.1175 0.0905 0.0906 0.156 0.1168 0.1164 0.151 0.106 0.102 0.0698
Effluent EPA 1631 0.0057 0.0038 0.0048 0.0039 0.0035 0.0045 0.0056 0.0034 0.0039 0.004 0.0021 0.0042
Nickel
Influent EPA 200.8 7.3 6.53 9 7.5 6.34 7.28 8.13 6.98 6.9 6.68 8.53 7.58
Effluent EPA 200.8 3.5 3.5 3.9 4.4 4 4.4 4.2 4.2 4 4.6 6.1 4.4
Selenium
Influent EPA 200.8 1.3 1.28 1.09 1.23 1.26 1.6 1.73 1.48 1.5 1.38 1.38 1.1
Effluent EPA 200.8 0.56 0.36 0.48 0.49 0.57 0.55 0.49 0.58 0.45 0.05 0.31 0.45
Silver
Influent EPA 200.8 0.57 0.64 0.36 0.83 0.65 0.7 1.26 0.59 0.55 0.43 0.48 0.4
Effluent EPA 200.8 0.07 0.05 0.05 0.06 0.05 0.05 0.08 0.07 0.04 0.05 0.05 0.04
Zinc
Influent EPA 200.8 164 187.5 145 162.5 178 210 225 196 200 200 190 145
Effluent EPA 200.8 27 33 39 30 51 43 40 46 34 42 45 43 Note: Influent results are averaged over each month.
2018 Pretreatment Annual Report 3 February 28, 2019
NPDES Permit (Order No. R2-2015-0018, NPDES No. CA0037702) Figure 2-A illustrates influent and effluent metals monitoring results for the past five years. Additional information on heavy metals loading and organics concentrations can be found in Chapter 5.
Figure 2-A: Five Year Graph of Metals Influent and Effluent
0
1
2
3
4
5
6
7
8
Jan-
13A
pr-1
3Ju
l-13
Oct
-13
Jan-
14A
pr-1
4Ju
l-14
Oct
-14
Jan-
15A
pr-1
5Ju
l-15
Oct
-15
Jan-
16A
pr-1
6Ju
l-16
Oct
-16
Jan-
17A
pr-1
7Ju
l-17
Oct
-17
Jan-
18A
pr-1
8Ju
l-18
Oct
-18
Uni
ts u
g/L
Arsenic Arsenic Influent Arsenic Effluent
0
0.1
0.2
0.3
0.4
0.5
0.6
Jan-
13A
pr-1
3Ju
l-13
Oct
-13
Jan-
14A
pr-1
4Ju
l-14
Oct
-14
Jan-
15A
pr-1
5Ju
l-15
Oct
-15
Jan-
16A
pr-1
6Ju
l-16
Oct
-16
Jan-
17A
pr-1
7Ju
l-17
Oct
-17
Jan-
18A
pr-1
8Ju
l-18
Oct
-18
Uni
ts u
g/L
Cadmium Cadmium Influent Cadmium Effluent
2018 Pretreatment Annual Report 4 February 28, 2019
NPDES Permit (Order No. R2-2015-0018, NPDES No. CA0037702)
0
2
4
6
8
10
12
14
16Ja
n-13
Apr
-13
Jul-1
3O
ct-1
3Ja
n-14
Apr
-14
Jul-1
4O
ct-1
4Ja
n-15
Apr
-15
Jul-1
5O
ct-1
5Ja
n-16
Apr
-16
Jul-1
6O
ct-1
6Ja
n-17
Apr
-17
Jul-1
7O
ct-1
7Ja
n-18
Apr
-18
Jul-1
8O
ct-1
8
Uni
ts u
g/L
Chromium
Chromium Influent Chromium Effluent
0
20
40
60
80
100
120
140
Jan-
13A
pr-1
3Ju
l-13
Oct
-13
Jan-
14A
pr-1
4Ju
l-14
Oct
-14
Jan-
15A
pr-1
5Ju
l-15
Oct
-15
Jan-
16A
pr-1
6Ju
l-16
Oct
-16
Jan-
17A
pr-1
7Ju
l-17
Oct
-17
Jan-
18A
pr-1
8Ju
l-18
Oct
-18
Uni
ts u
g/L
Copper Copper Influent Copper Effluent
2018 Pretreatment Annual Report 5 February 28, 2019
NPDES Permit (Order No. R2-2015-0018, NPDES No. CA0037702)
0
5
10
15
20
25Ja
n-13
Apr
-13
Jul-1
3O
ct-1
3Ja
n-14
Apr
-14
Jul-1
4O
ct-1
4Ja
n-15
Apr
-15
Jul-1
5O
ct-1
5Ja
n-16
Apr
-16
Jul-1
6O
ct-1
6Ja
n-17
Apr
-17
Jul-1
7O
ct-1
7Ja
n-18
Apr
-18
Jul-1
8O
ct-1
8
Uni
ts u
g/L
Lead
Lead Influent Lead Effluent
0
0.2
0.4
0.6
0.8
1
1.2
1.4
Jan-
13A
pr-1
3Ju
l-13
Oct
-13
Jan-
14A
pr-1
4Ju
l-14
Oct
-14
Jan-
15A
pr-1
5Ju
l-15
Oct
-15
Jan-
16A
pr-1
6Ju
l-16
Oct
-16
Jan-
17A
pr-1
7Ju
l-17
Oct
-17
Jan-
18A
pr-1
8Ju
l-18
Oct
-18
Uni
ts u
g/L
Mercury Mercury Influent Mercury Effluent
2018 Pretreatment Annual Report 6 February 28, 2019
NPDES Permit (Order No. R2-2015-0018, NPDES No. CA0037702)
0
5
10
15
20
25Ja
n-13
Apr
-13
Jul-1
3O
ct-1
3Ja
n-14
Apr
-14
Jul-1
4O
ct-1
4Ja
n-15
Apr
-15
Jul-1
5O
ct-1
5Ja
n-16
Apr
-16
Jul-1
6O
ct-1
6Ja
n-17
Apr
-17
Jul-1
7O
ct-1
7Ja
n-18
Apr
-18
Jul-1
8O
ct-1
8
Uni
ts u
g/L
Nickel Nickel Influent Nickel Effluent
0
0.2
0.4
0.6
0.8
1
1.2
1.4
1.6
1.8
2
Jan-
13A
pr-1
3Ju
l-13
Oct
-13
Jan-
14A
pr-1
4Ju
l-14
Oct
-14
Jan-
15A
pr-1
5Ju
l-15
Oct
-15
Jan-
16A
pr-1
6Ju
l-16
Oct
-16
Jan-
17A
pr-1
7Ju
l-17
Oct
-17
Jan-
18A
pr-1
8Ju
l-18
Oct
-18
Uni
ts u
g/L
Selenium Selenium Influent Selenium Effluent
2018 Pretreatment Annual Report 7 February 28, 2019
NPDES Permit (Order No. R2-2015-0018, NPDES No. CA0037702)
0
0.2
0.4
0.6
0.8
1
1.2
1.4
1.6
1.8
2Ja
n-13
Apr
-13
Jul-1
3O
ct-1
3Ja
n-14
Apr
-14
Jul-1
4O
ct-1
4Ja
n-15
Apr
-15
Jul-1
5O
ct-1
5Ja
n-16
Apr
-16
Jul-1
6O
ct-1
6Ja
n-17
Apr
-17
Jul-1
7O
ct-1
7Ja
n-18
Apr
-18
Jul-1
8O
ct-1
8
Uni
ts u
g/L
Silver
Silver Influent Silver Effluent
0
50
100
150
200
250
300
Jan-
13A
pr-1
3Ju
l-13
Oct
-13
Jan-
14A
pr-1
4Ju
l-14
Oct
-14
Jan-
15A
pr-1
5Ju
l-15
Oct
-15
Jan-
16A
pr-1
6Ju
l-16
Oct
-16
Jan-
17A
pr-1
7Ju
l-17
Oct
-17
Jan-
18A
pr-1
8Ju
l-18
Oct
-18
Uni
ts u
g/L
Zinc Zinc Influent Zinc Effluent
2018 Pretreatment Annual Report 8 February 28, 2019
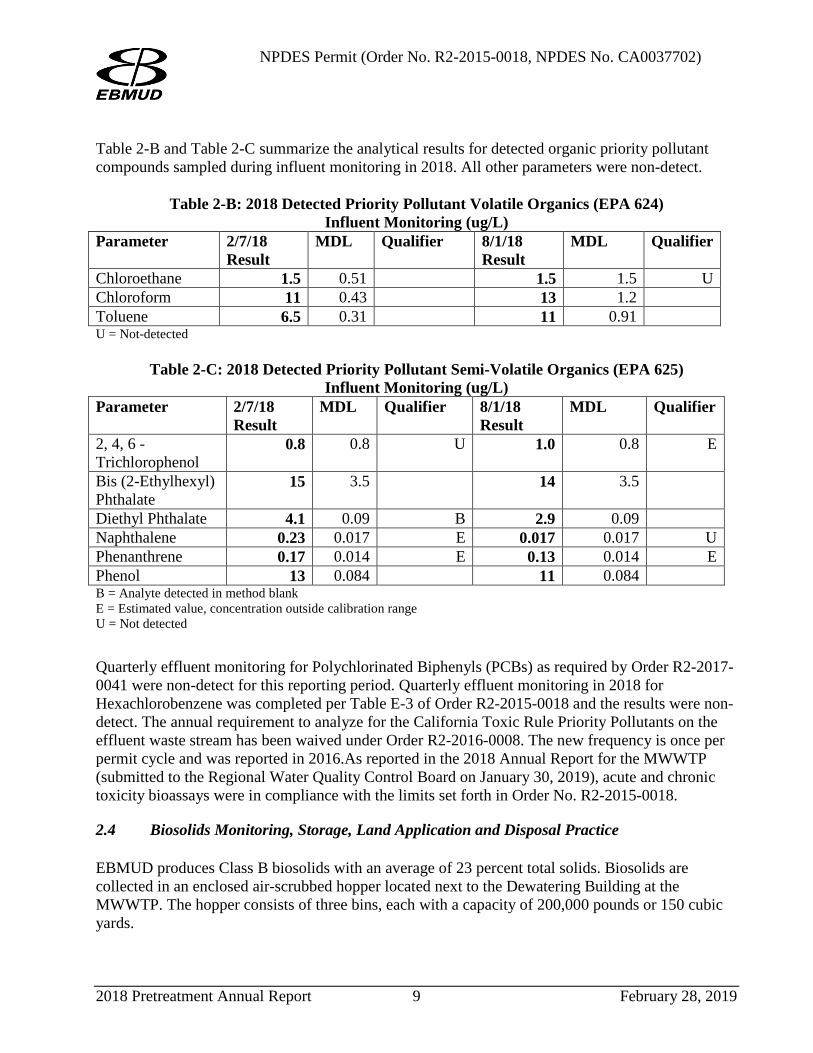
NPDES Permit (Order No. R2-2015-0018, NPDES No. CA0037702) Table 2-B and Table 2-C summarize the analytical results for detected organic priority pollutant compounds sampled during influent monitoring in 2018. All other parameters were non-detect.
Table 2-B: 2018 Detected Priority Pollutant Volatile Organics (EPA 624) Influent Monitoring (ug/L)
Parameter 2/7/18 Result
MDL Qualifier 8/1/18 Result
MDL Qualifier
Chloroethane 1.5 0.51 1.5 1.5 U Chloroform 11 0.43 13 1.2 Toluene 6.5 0.31 11 0.91 U = Not-detected
Table 2-C: 2018 Detected Priority Pollutant Semi-Volatile Organics (EPA 625) Influent Monitoring (ug/L)
Parameter 2/7/18 Result
MDL Qualifier 8/1/18 Result
MDL Qualifier
2, 4, 6 - Trichlorophenol
0.8 0.8 U 1.0 0.8 E
Bis (2-Ethylhexyl) Phthalate
15 3.5 14 3.5
Diethyl Phthalate 4.1 0.09 B 2.9 0.09 Naphthalene 0.23 0.017 E 0.017 0.017 U Phenanthrene 0.17 0.014 E 0.13 0.014 E Phenol 13 0.084 11 0.084 B = Analyte detected in method blank E = Estimated value, concentration outside calibration range U = Not detected Quarterly effluent monitoring for Polychlorinated Biphenyls (PCBs) as required by Order R2-2017-0041 were non-detect for this reporting period. Quarterly effluent monitoring in 2018 for Hexachlorobenzene was completed per Table E-3 of Order R2-2015-0018 and the results were non-detect. The annual requirement to analyze for the California Toxic Rule Priority Pollutants on the effluent waste stream has been waived under Order R2-2016-0008. The new frequency is once per permit cycle and was reported in 2016.As reported in the 2018 Annual Report for the MWWTP (submitted to the Regional Water Quality Control Board on January 30, 2019), acute and chronic toxicity bioassays were in compliance with the limits set forth in Order No. R2-2015-0018.
2.4 Biosolids Monitoring, Storage, Land Application and Disposal Practice EBMUD produces Class B biosolids with an average of 23 percent total solids. Biosolids are collected in an enclosed air-scrubbed hopper located next to the Dewatering Building at the MWWTP. The hopper consists of three bins, each with a capacity of 200,000 pounds or 150 cubic yards.
2018 Pretreatment Annual Report 9 February 28, 2019
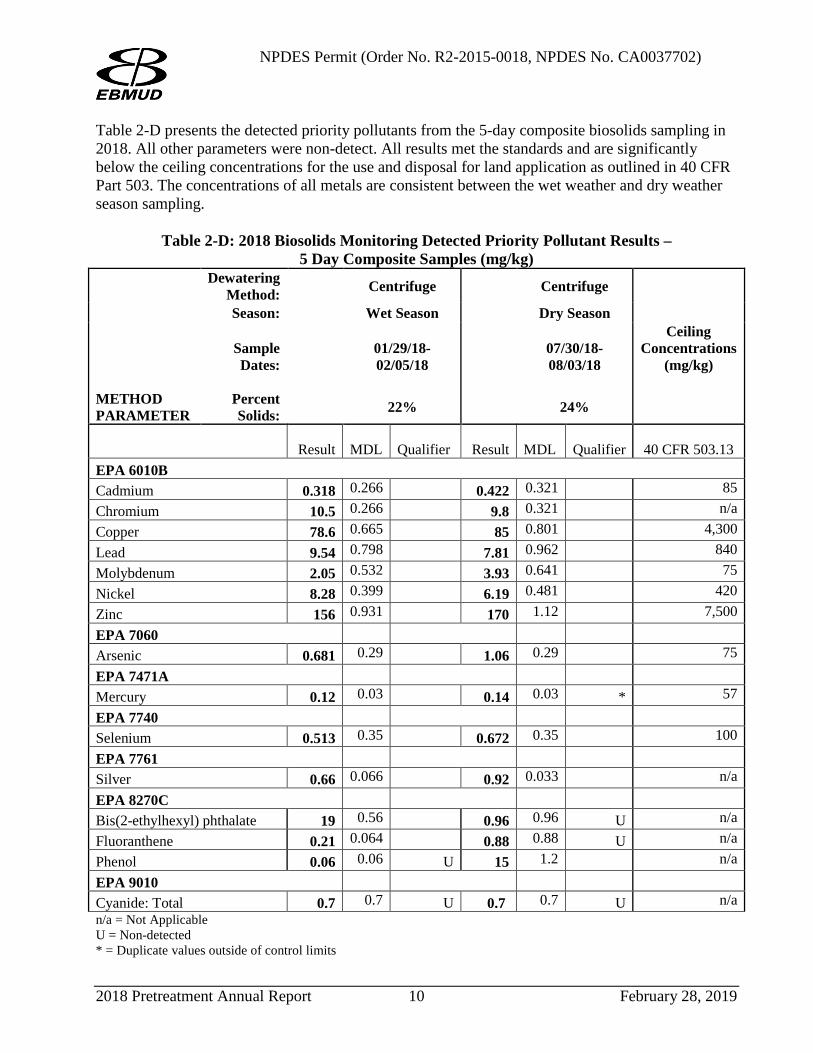
NPDES Permit (Order No. R2-2015-0018, NPDES No. CA0037702) Table 2-D presents the detected priority pollutants from the 5-day composite biosolids sampling in 2018. All other parameters were non-detect. All results met the standards and are significantly below the ceiling concentrations for the use and disposal for land application as outlined in 40 CFR Part 503. The concentrations of all metals are consistent between the wet weather and dry weather season sampling.
Table 2-D: 2018 Biosolids Monitoring Detected Priority Pollutant Results – 5 Day Composite Samples (mg/kg)
METHOD PARAMETER
Dewatering Method:
Centrifuge Centrifuge
Season: Wet Season Dry Season
Sample Dates:
01/29/18-02/05/18
07/30/18-08/03/18
Ceiling Concentrations
(mg/kg)
Percent Solids:
22% 24%
Result MDL Qualifier Result MDL Qualifier 40 CFR 503.13 EPA 6010B Cadmium 0.318 0.266
0.422 0.321
85
Chromium 10.5 0.266 9.8 0.321 n/a Copper 78.6 0.665
85 0.801
4,300
Lead 9.54 0.798 7.81 0.962 840 Molybdenum 2.05 0.532
3.93 0.641
75
Nickel 8.28 0.399
6.19 0.481
420 Zinc 156 0.931
170 1.12
7,500
EPA 7060 Arsenic 0.681 0.29
1.06 0.29 75
EPA 7471A
Mercury 0.12 0.03 0.14 0.03 * 57 EPA 7740
Selenium 0.513 0.35
0.672 0.35
100 EPA 7761
Silver 0.66 0.066 0.92 0.033 n/a EPA 8270C Bis(2-ethylhexyl) phthalate 19 0.56 0.96 0.96 U n/a Fluoranthene 0.21 0.064 0.88 0.88 U n/a Phenol 0.06 0.06 U 15 1.2 n/a EPA 9010
Cyanide: Total 0.7 0.7 U 0.7 0.7 U n/a n/a = Not Applicable U = Non-detected * = Duplicate values outside of control limits
2018 Pretreatment Annual Report 10 February 28, 2019
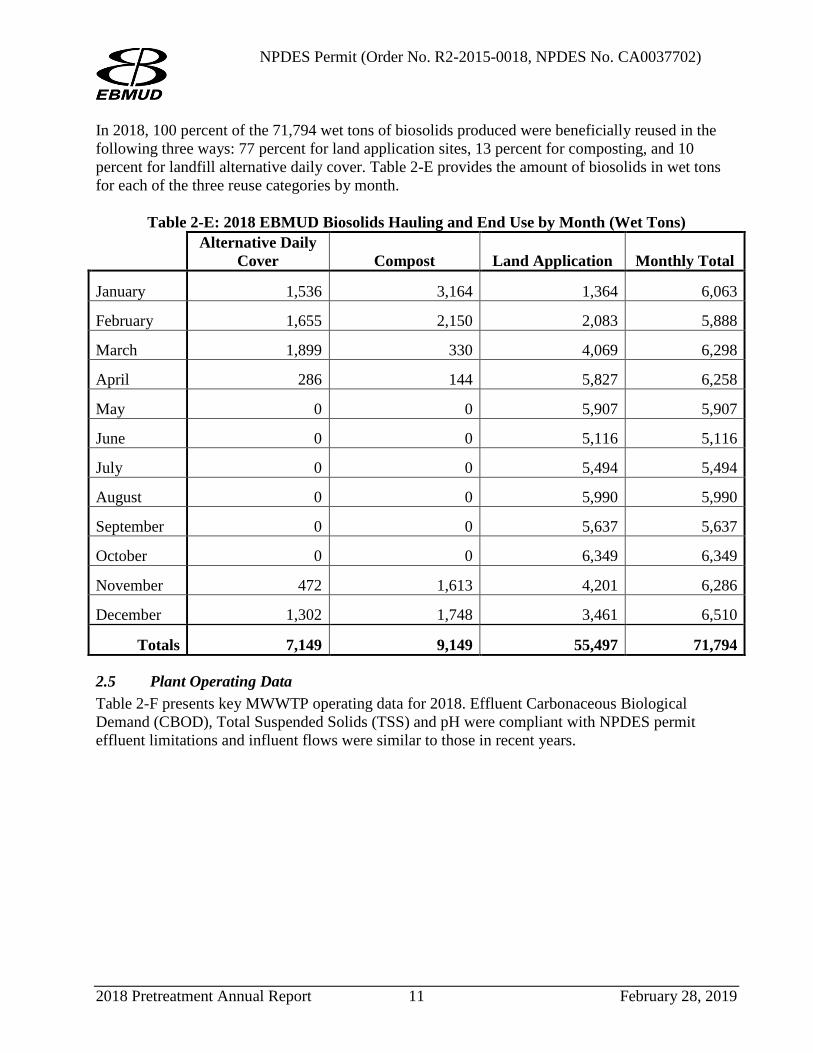
NPDES Permit (Order No. R2-2015-0018, NPDES No. CA0037702) In 2018, 100 percent of the 71,794 wet tons of biosolids produced were beneficially reused in the following three ways: 77 percent for land application sites, 13 percent for composting, and 10 percent for landfill alternative daily cover. Table 2-E provides the amount of biosolids in wet tons for each of the three reuse categories by month.
Table 2-E: 2018 EBMUD Biosolids Hauling and End Use by Month (Wet Tons)
Alternative Daily Cover Compost Land Application Monthly Total
January 1,536 3,164 1,364 6,063
February 1,655 2,150 2,083 5,888
March 1,899 330 4,069 6,298
April 286 144 5,827 6,258
May 0 0 5,907 5,907
June 0 0 5,116 5,116
July 0 0 5,494 5,494
August 0 0 5,990 5,990
September 0 0 5,637 5,637
October 0 0 6,349 6,349
November 472 1,613 4,201 6,286
December 1,302 1,748 3,461 6,510
Totals 7,149 9,149 55,497 71,794
2.5 Plant Operating Data Table 2-F presents key MWWTP operating data for 2018. Effluent Carbonaceous Biological Demand (CBOD), Total Suspended Solids (TSS) and pH were compliant with NPDES permit effluent limitations and influent flows were similar to those in recent years.
2018 Pretreatment Annual Report 11 February 28, 2019
NPDES Permit (Order No. R2-2015-0018, NPDES No. CA0037702)
Table 2-F: Wastewater Treatment Plant Operating Data - 2018
Units Jan Feb Mar April May Jun Jul Aug Sept Oct Nov Dec Total Avg. Min. Max.
GENERAL PLANT DATA
FLOW DATA Daily Average MG 62 49 72 67 49 46 45 45 45 44 52 54 53 44 72 Minimum Day MG 44 45 51 49 44 41 39 40 42 42 42 45 44 39 51
Maximum Day MG 189 53 124 227 52 50 48 48 50 48 116 103 92 48 227 Monthly Total MG 1,929 1,375 2,246 2,013 1,506 1,383 1,382 1,398 1,359 1,379 1,551 1,677 19,197 1,600 1,359 2,246
INFLUENT QUALITY CBOD (avg.) mg/l 268 356 271 254 308 343 331 326 312 366 326 266 311 254 366
TSS (avg.) mg/l 349 388 330 351 364 458 426 432 414 441 439 383 398 330 458 pH (avg.) pH 6.9 6.8 6.9 6.9 6.9 6.8 6.8 6.9 6.9 6.8 6.9 6.9 6.9 6.8 6.9
EFFLUENT QUALITY
CBOD (avg.)1 mg/l 9 9 11 7 9 10 9 8 8 9 9 13 9 7 13 TSS (avg.)2 mg/l 11 12 10 12 11 14 11 11 15 11 10 12 12 10 15
pH (avg.)3 pH 6.7 6.6 6.6 6.7 6.7 6.7 6.7 6.7 6.7 6.7 6.7 6.8 6.7 6.6 6.8
OVERALL REMOVAL EFFICIENCY CBOD4 % 96 97 96 97 97 97 97 97 97 97 97 95 97 95 97
TSS4 % 97 97 97 97 97 97 97 97 96 97 98 97 97 96 98 1. Effluent limitations for CBOD = 25 mg/L average monthly, 40 mg/L average weekly 2. Effluent limitations for TSS = 30 mg/L average monthly, 45 mg/L average weekly 3. Effluent limitations for pH = instantaneous minimum: 6.0, instantaneous maximum 9.0 4. The average monthly percent removal of CBOD and TSS) shall not be less than 85 percent.
2018 Pretreatment Annual Report 12 February 28, 2019
NPDES Permit (Order No. R2-2015-0018, NPDES No. CA0037702)
3. PRETREATMENT PROGRAM - GENERAL INFORMATION Through its Pretreatment Program, EBMUD regulates process wastewater discharges from identified industrial users (IUs) that handle pollutants of concern. Pollutant control mechanisms include the issuance of wastewater discharge permits with general provisions and site-specific requirements. The different permit types are detailed below under section 3.3.
3.1 Pretreatment Program Changes and Highlights In 2018, there were no significant changes or planned modifications to EBMUD’s Pretreatment Program. Detailed information on the permitted accounts and monitoring is provided in Chapter 4. Descriptions of EBMUD’s permit categories are provided in Section 3.3.
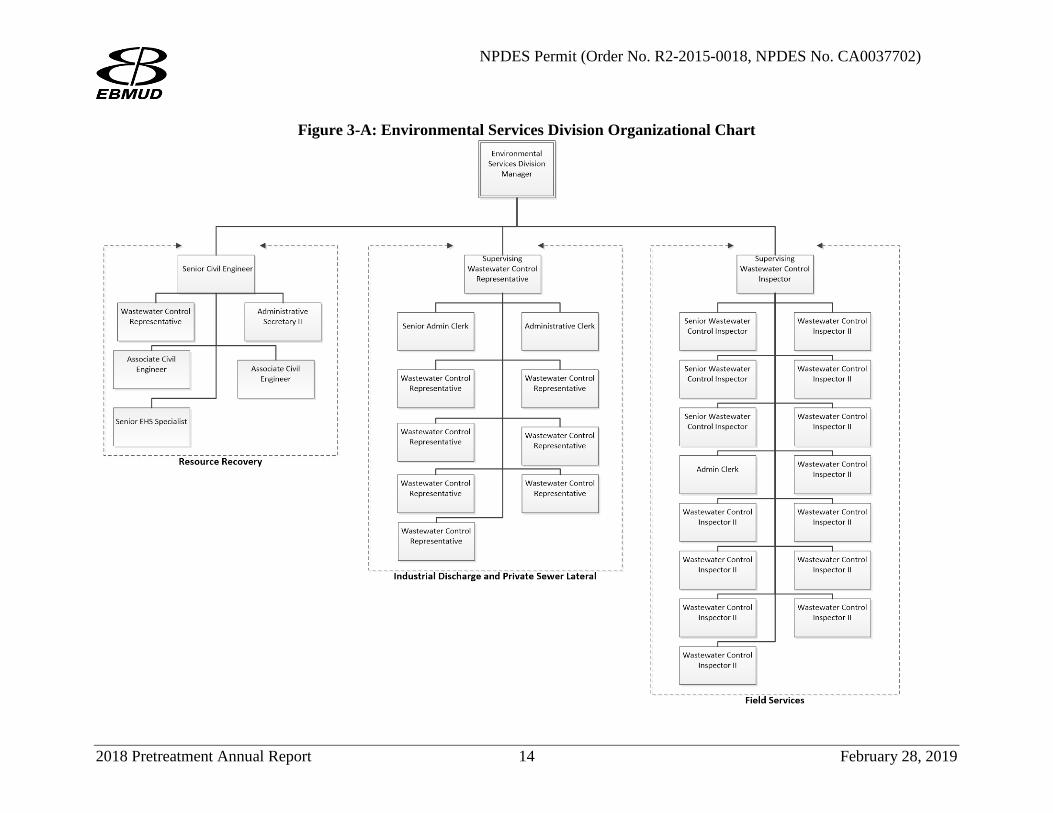
3.2 Pretreatment Program Staffing and Budget The EBMUD Wastewater Department is organized into four Divisions: Wastewater Treatment, Wastewater Engineering, Laboratory Services, and Environmental Services. As shown in the organization chart below (Figure 3-A), the Environmental Services Division (ESD) includes the following three sections:
• Industrial Discharge: works with industries, commercial businesses and residences to reduce the discharge of pollutants to the community sewer and ultimately the Bay. Also manages the implementation of the Regional Private Sewer Lateral Program, which mandates maintenance of private sewer laterals to reduce inflow and infiltration into the collection systems. In 2018, Supervising Wastewater Control Representative Gabriel Dib retired and Phoebe Grow was hired to replace him. Additionally, two Wastewater Control Representatives retired in 2018 and EBMUD is currently conducting a recruitment process to backfill these positions.
• Field Services: supports the Industrial Discharge, R2, and I/I Programs by performing site inspections and sampling. In 2018, three Wastewater Control Inspectors were hired to backfill positions that had either been vacant or were made available due to a retirement.
• Resource Recovery (R2): uses excess wastewater treatment capacity to provide an environmentally-friendly and economical disposal alternative for customers, and to increase the MWWTP's production of biogas that is used for power generation. An Associate Civil engineer was promoted out of the section and that position was subsequently backfilled.
In 2018, one work group that had been part of ESD was moved to report directly to the Department Director:
• Inflow/Infiltration (I/I): works to reduce wet weather flows, which can overwhelm wastewater treatment facilities and lead to the release of partially treated wastewater into the Bay, by preventing the inflow and infiltration of rainwater into collection systems.
2018 Pretreatment Annual Report 13 February 28, 2019
NPDES Permit (Order No. R2-2015-0018, NPDES No. CA0037702)
Figure 3-A: Environmental Services Division Organizational Chart
2018 Pretreatment Annual Report 14 February 28, 2019
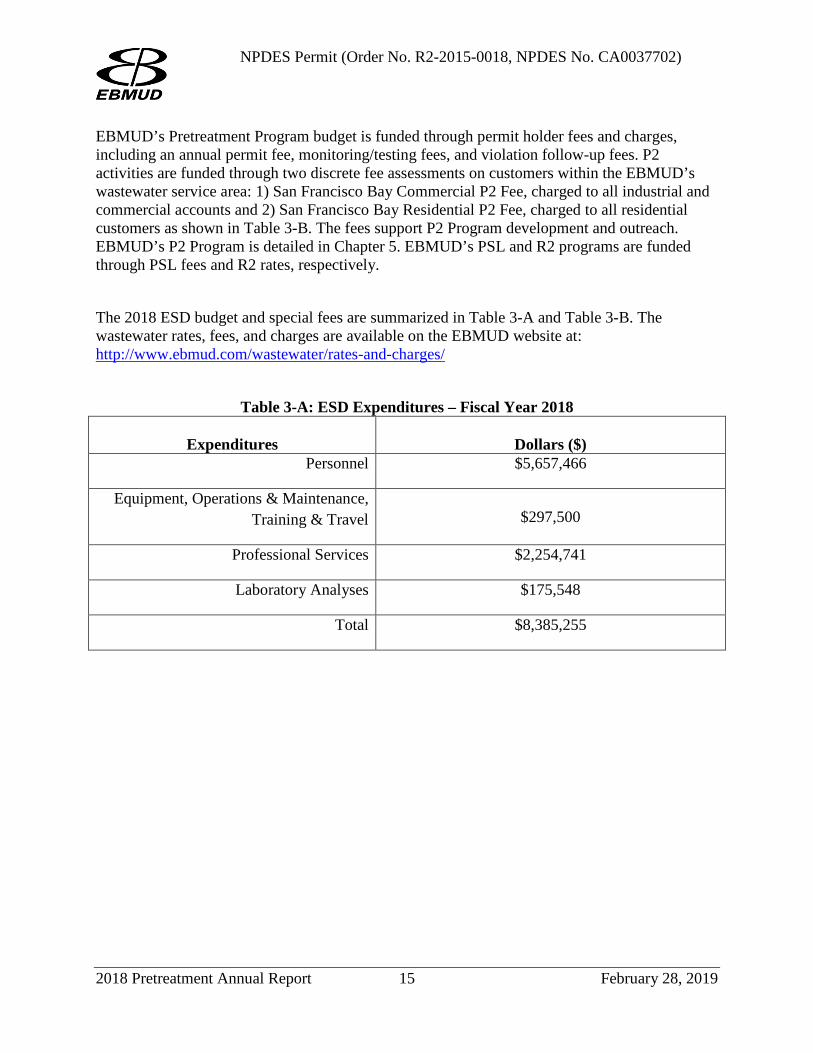
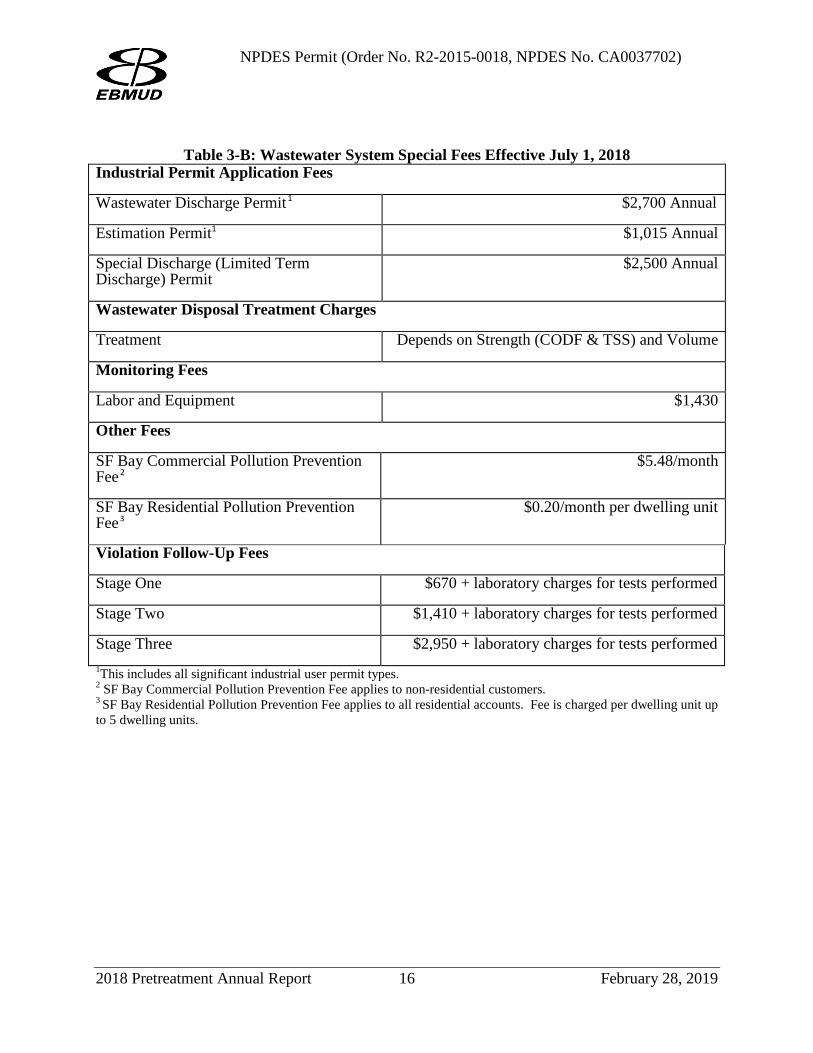
NPDES Permit (Order No. R2-2015-0018, NPDES No. CA0037702) EBMUD’s Pretreatment Program budget is funded through permit holder fees and charges, including an annual permit fee, monitoring/testing fees, and violation follow-up fees. P2 activities are funded through two discrete fee assessments on customers within the EBMUD’s wastewater service area: 1) San Francisco Bay Commercial P2 Fee, charged to all industrial and commercial accounts and 2) San Francisco Bay Residential P2 Fee, charged to all residential customers as shown in Table 3-B. The fees support P2 Program development and outreach. EBMUD’s P2 Program is detailed in Chapter 5. EBMUD’s PSL and R2 programs are funded through PSL fees and R2 rates, respectively. The 2018 ESD budget and special fees are summarized in Table 3-A and Table 3-B. The wastewater rates, fees, and charges are available on the EBMUD website at: http://www.ebmud.com/wastewater/rates-and-charges/
Table 3-A: ESD Expenditures – Fiscal Year 2018
Expenditures
Dollars ($) Personnel $5,657,466
Equipment, Operations & Maintenance, Training & Travel $297,500
Professional Services $2,254,741
Laboratory Analyses $175,548
Total $8,385,255
2018 Pretreatment Annual Report 15 February 28, 2019
NPDES Permit (Order No. R2-2015-0018, NPDES No. CA0037702)
Table 3-B: Wastewater System Special Fees Effective July 1, 2018
Industrial Permit Application Fees
Wastewater Discharge Permit 0F0F
1 $2,700 Annual 1F1F
Estimation Permit1 $1,015 Annual
Special Discharge (Limited Term Discharge) Permit
$2,500 Annual
Wastewater Disposal Treatment Charges
Treatment Depends on Strength (CODF & TSS) and Volume
Monitoring Fees
Labor and Equipment $1,430
Other Fees
SF Bay Commercial Pollution Prevention Fee3 F3F
2 $5.48/month
SF Bay Residential Pollution Prevention Fee4 F4F
3 $0.20/month per dwelling unit
Violation Follow-Up Fees
Stage One $670 + laboratory charges for tests performed
Stage Two $1,410 + laboratory charges for tests performed
Stage Three $2,950 + laboratory charges for tests performed 1This includes all significant industrial user permit types. 2 SF Bay Commercial Pollution Prevention Fee applies to non-residential customers. 3 SF Bay Residential Pollution Prevention Fee applies to all residential accounts. Fee is charged per dwelling unit up to 5 dwelling units.
2018 Pretreatment Annual Report 16 February 28, 2019
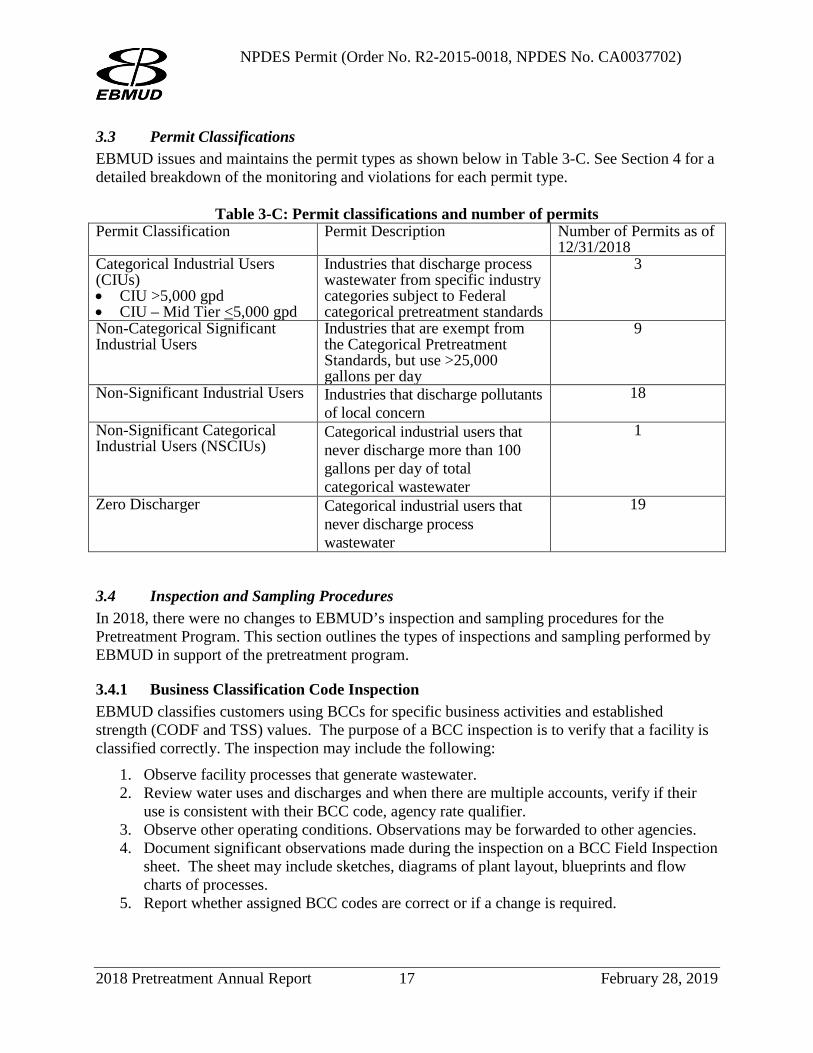
NPDES Permit (Order No. R2-2015-0018, NPDES No. CA0037702) 3.3 Permit Classifications EBMUD issues and maintains the permit types as shown below in Table 3-C. See Section 4 for a detailed breakdown of the monitoring and violations for each permit type.
Table 3-C: Permit classifications and number of permits Permit Classification Permit Description Number of Permits as of
12/31/2018 Categorical Industrial Users (CIUs) • CIU >5,000 gpd • CIU – Mid Tier <5,000 gpd
Industries that discharge process wastewater from specific industry categories subject to Federal categorical pretreatment standards
3
Non-Categorical Significant Industrial Users
Industries that are exempt from the Categorical Pretreatment Standards, but use >25,000 gallons per day
9
Non-Significant Industrial Users Industries that discharge pollutants of local concern
18
Non-Significant Categorical Industrial Users (NSCIUs)
Categorical industrial users that never discharge more than 100 gallons per day of total categorical wastewater
1
Zero Discharger Categorical industrial users that never discharge process wastewater
19
3.4 Inspection and Sampling Procedures In 2018, there were no changes to EBMUD’s inspection and sampling procedures for the Pretreatment Program. This section outlines the types of inspections and sampling performed by EBMUD in support of the pretreatment program.
Business Classification Code Inspection 3.4.1EBMUD classifies customers using BCCs for specific business activities and established strength (CODF and TSS) values. The purpose of a BCC inspection is to verify that a facility is classified correctly. The inspection may include the following:
1. Observe facility processes that generate wastewater. 2. Review water uses and discharges and when there are multiple accounts, verify if their
use is consistent with their BCC code, agency rate qualifier. 3. Observe other operating conditions. Observations may be forwarded to other agencies. 4. Document significant observations made during the inspection on a BCC Field Inspection
sheet. The sheet may include sketches, diagrams of plant layout, blueprints and flow charts of processes.
5. Report whether assigned BCC codes are correct or if a change is required.
2018 Pretreatment Annual Report 17 February 28, 2019
NPDES Permit (Order No. R2-2015-0018, NPDES No. CA0037702)
Initial Industrial User Inspection 3.4.2The initial Industrial User (IU) inspection includes a comprehensive review of the types of processes, wastes generated and method(s) of waste disposal. The primary concerns are water use, process wastewater discharge, identification of a representative sample location(s), and potential of hazardous materials entering the sanitary sewer. Pollution prevention opportunities may be discussed in addition to identifying environmental cross-media issues. The inspections may include the following: Pre-Inspection
1. Collect historical information including water consumption history. Inspection
1. Interview facility contact 2. Inspect the facility thoroughly with emphasis on:
• processes contributing to the waste stream • materials entering the waste stream • process flow • pretreatment processes • sampling location(s) • waste and product storage areas • Material Safety Data Sheets for hazardous chemicals used in process • Existing Pretreatment systems and the potential to bypass
Post-Inspection
1. Complete a Special District 1 Wastewater System Inspection Report (SD-124 form) with accompanying sketches of the plant, process flow diagrams and facility schematics, as appropriate.
2. Review inspection results with a Wastewater Control Representative to determine if sampling or a Wastewater Discharge Permit is required.
Industrial User Inspections 3.4.3Monitoring frequencies may depend on compliance history of the discharger, relative consistency of pollutant concentrations in the discharge, discharge volume, and the nature of the pollutants discharged. Table 3-D describes the industrial user types and the respective minimum monitoring frequencies. The minimum monitoring frequency for SIUs is determined by the federal regulations. The monitoring frequency for SIUs is equal to or greater than the minimum required through the federal categorical regulations. The monitoring frequency for non-SIUs may be based on strength concerns for billing purposes and local limits. These permits may also be focused on the implementation of specific BMPs rather than monitoring the discharge.
2018 Pretreatment Annual Report 18 February 28, 2019
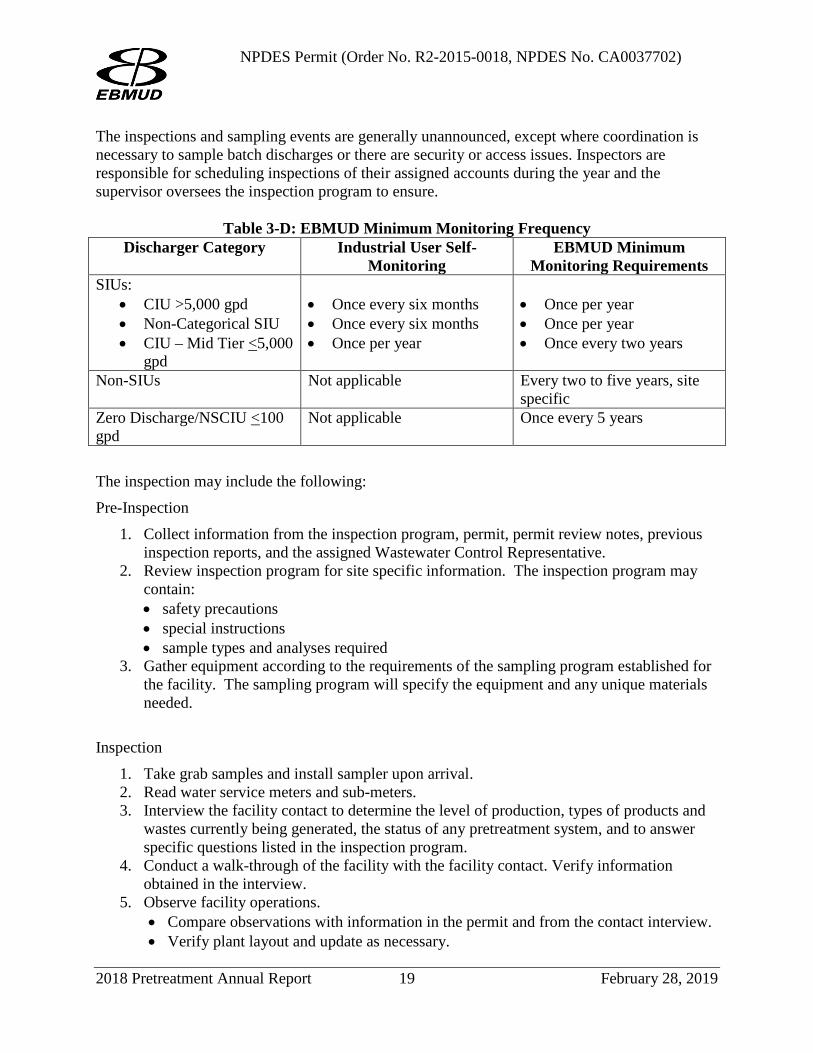
NPDES Permit (Order No. R2-2015-0018, NPDES No. CA0037702) The inspections and sampling events are generally unannounced, except where coordination is necessary to sample batch discharges or there are security or access issues. Inspectors are responsible for scheduling inspections of their assigned accounts during the year and the supervisor oversees the inspection program to ensure.
Table 3-D: EBMUD Minimum Monitoring Frequency Discharger Category Industrial User Self-
Monitoring EBMUD Minimum
Monitoring Requirements SIUs:
• CIU >5,000 gpd • Non-Categorical SIU • CIU – Mid Tier <5,000
gpd
• Once every six months • Once every six months • Once per year
• Once per year • Once per year • Once every two years
Non-SIUs Not applicable Every two to five years, site specific
Zero Discharge/NSCIU <100 gpd
Not applicable Once every 5 years
The inspection may include the following: Pre-Inspection
1. Collect information from the inspection program, permit, permit review notes, previous inspection reports, and the assigned Wastewater Control Representative.
2. Review inspection program for site specific information. The inspection program may contain: • safety precautions • special instructions • sample types and analyses required
3. Gather equipment according to the requirements of the sampling program established for the facility. The sampling program will specify the equipment and any unique materials needed.
Inspection
1. Take grab samples and install sampler upon arrival. 2. Read water service meters and sub-meters. 3. Interview the facility contact to determine the level of production, types of products and
wastes currently being generated, the status of any pretreatment system, and to answer specific questions listed in the inspection program.
4. Conduct a walk-through of the facility with the facility contact. Verify information obtained in the interview.
5. Observe facility operations. • Compare observations with information in the permit and from the contact interview. • Verify plant layout and update as necessary.
2018 Pretreatment Annual Report 19 February 28, 2019
NPDES Permit (Order No. R2-2015-0018, NPDES No. CA0037702)
• Observe wastewater flow and make visual assessment of discharge quality. • Evaluate the potential for accidental spills to wastewater stream. Every two years,
conduct Slug Control Plan Evaluation to determine if the facility needs a Slug Control Plan.
• Document secondary water uses such as boilers, air scrubbers, cooling water and clean up.
• Review private meter calibration records. • Locate areas where rainwater or groundwater might collect and flow into the sanitary
sewer. • Observe other operating conditions. Observations may be forwarded to other
agencies. 6. Inspect Pretreatment System. Determine if:
• system is functioning • necessary chemicals are in inventory • routine preventive maintenance procedures are being performed and by whom • a contingency plan is in place in case of a treatment system failure • operating records are up to date
7. Review self-monitoring procedures including sampling frequency, sampling methods, sampling location, and chain-of-custody annually with responsible personnel.
Post-Inspection
1. Complete a sample description form and deliver samples to the laboratory for analysis with the chain-of-custody record.
2. Complete an inspection report detailing the inspection results. 3. Inform the assigned Wastewater Control Representative of any unusual conditions or
observations, including the need for a Slug Control Plan.
ZD and NSCIU Inspections 3.4.4Categorical ZD facilities are inspected to verify that there is no discharge of regulated process wastewater to the sanitary sewer. The methods of recycling and/or off-hauling of process wastewater are reviewed during the inspection. Sampling is performed only when discharge violations are suspected or as follow-up to a permit violation. NSCIUs discharging no more than 100 gallons per day of regulated wastewater and ZDs are monitored at the same frequency. These IUs are required to submit an annual discharge prevention compliance report for EBMUD’s evaluation of their discharge status. In addition, EBMUD conducts facility inspections at each NSCIU and ZD at least once every five years. To qualify for this reduced monitoring frequency, the discharger must have complied with all applicable categorical pretreatment standards and requirements, submitted the certification statement required in 40 CFR 403.12 (q), and must not have discharged any federally-regulated process wastewater.
2018 Pretreatment Annual Report 20 February 28, 2019
NPDES Permit (Order No. R2-2015-0018, NPDES No. CA0037702) ZD and NSCIU inspections may include the following:
Pre-Inspection
1. Collect information from the Inspection Program, permit, previous inspection reports and the assigned Wastewater Control Representative.
2. Review water consumption history from Customer Information System to determine water usage and compare with facility’s stated water uses such as sanitary, non-contact cooling water, and boiler blow-down wastewater.
Inspection
1. Interview the facility contact to determine if there is discharge of regulated process wastewater or wastewater of local toxic concern to the sanitary sewer.
2. Ask about the level of production, types of products and wastes being generated, status of pretreatment system and the method of wastewater disposal.
3. Conduct a walk-through of the facility with the facility contact. 4. Observe other operating conditions. Observations may be forwarded to other agencies. 5. Determine if appropriate safeguards are in place to ensure process wastewater is not
discharged to the sanitary sewer. Safeguard examples include permanent sealing of the sanitary sewer and floor drains, installation of berms, and capping or removal of process wastewater discharge pipes.
6. Inspect facility for presence of containers, hoses, or other conveyances which may be used for the temporary discharge of process wastewater to the sanitary sewer.
7. Determine if there have been any changes to the premises or operations which may result in discharge of process wastewater.
Post-Inspection
1. Complete the Inspection Report detailing the inspection results. 2. Inform the assigned Wastewater Control Representative of any unusual conditions or
observations.
Special Discharge Permit Inspections 3.4.5A Special Discharge Permit term ranges from 90 days to five years, and the discharge volume varies depending on the type of discharge. Inspections are scheduled as needed and may include sampling. The sampling depends on the source and volume of discharge. Inspectors verify that the facility is utilizing its pretreatment unit and/or implementing its best management practices. Inspectors determine if the process diagram, the pretreatment system, and the discharge location correspond to information submitted as part of the Special Discharge Permit application.
2018 Pretreatment Annual Report 21 February 28, 2019
NPDES Permit (Order No. R2-2015-0018, NPDES No. CA0037702) Special Discharge inspections may include the following:
Pre-Inspection
1. Collect information from the Inspection Program, permit, and the assigned Wastewater Control Representative.
2. Review the Inspection Program for site-specific information. The Inspection Program may contain: • safety precautions • special instructions • sample types and analyses required
3. Contact the facility to determine time and day of discharge. Inspection
1. Interview the facility contact to obtain answers to specific questions appearing on the inspection program.
2. Conduct a walk-through of the facility with the facility contact. Verify information obtained in the interview.
Post-Inspection
1. Deliver any samples to the EBMUD's laboratory for analysis accompanied by the chain-of-custody and EBMUD Laboratory Services Special Discharge Program Field Services Sampling Request Form.
2. Complete Special Discharge inspection report. 3. Inform the assigned Wastewater Control Representative of any conditions or
observations that suggest non-compliance with the permit.
Violation Follow-Up Inspections 3.4.6A Violation Follow-Up Inspection is performed after a discharge violation is found during an inspection, a self-monitoring event, or an EBMUD sampling event. The Violation Follow-Up Inspection focuses on specific areas associated with the cause of the violation. In addition, the Violation Follow-Up Inspection verifies the corrective actions reported by the facility, as well as adherence to any compliance time schedules or incremental remedial measures. The account is charged a Violation Follow-up Inspection Fee plus analytical charges.
3.5 Resource Recovery Program EBMUD’s Resource Recovery (R2) Program manages the disposal of permitted trucked materials to the EBMUD’s MWWTP. Since its inception, the R2 Program has established 523 customer accounts; currently 255 accounts are active, holding 444 active waste disposal permits. The R2 Program uses available excess capacity at the MWWTP. It provides for a cost-effective, economically-sound disposal alternative for customers, and increases the MWWTP's production
2018 Pretreatment Annual Report 22 February 28, 2019
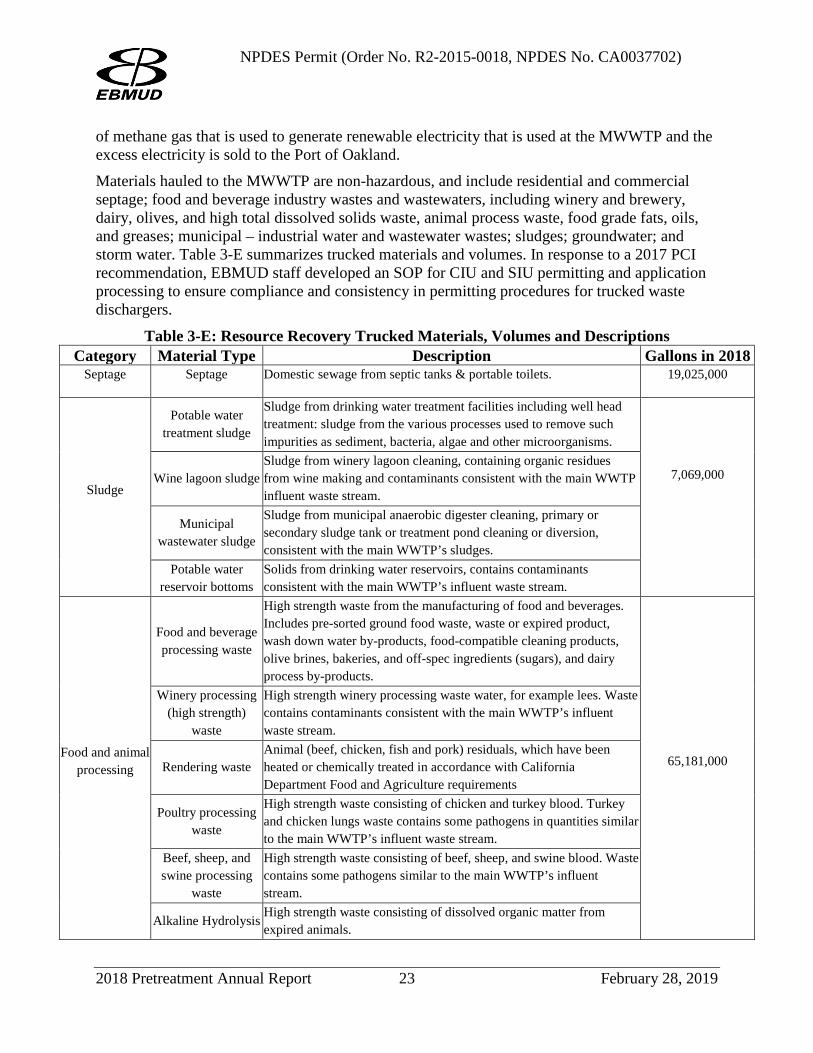
NPDES Permit (Order No. R2-2015-0018, NPDES No. CA0037702) of methane gas that is used to generate renewable electricity that is used at the MWWTP and the excess electricity is sold to the Port of Oakland. Materials hauled to the MWWTP are non-hazardous, and include residential and commercial septage; food and beverage industry wastes and wastewaters, including winery and brewery, dairy, olives, and high total dissolved solids waste, animal process waste, food grade fats, oils, and greases; municipal – industrial water and wastewater wastes; sludges; groundwater; and storm water. Table 3-E summarizes trucked materials and volumes. In response to a 2017 PCI recommendation, EBMUD staff developed an SOP for CIU and SIU permitting and application processing to ensure compliance and consistency in permitting procedures for trucked waste dischargers.
Table 3-E: Resource Recovery Trucked Materials, Volumes and Descriptions
3B3BCategory 2B2BMaterial Type 0B0BDescription 1B1BGallons in 2018 Septage Septage Domestic sewage from septic tanks & portable toilets. 19,025,000
Sludge
Potable water treatment sludge
Sludge from drinking water treatment facilities including well head treatment: sludge from the various processes used to remove such impurities as sediment, bacteria, algae and other microorganisms.
7,069,000
Wine lagoon sludge Sludge from winery lagoon cleaning, containing organic residues from wine making and contaminants consistent with the main WWTP influent waste stream.
Municipal wastewater sludge
Sludge from municipal anaerobic digester cleaning, primary or secondary sludge tank or treatment pond cleaning or diversion, consistent with the main WWTP’s sludges.
Potable water reservoir bottoms
Solids from drinking water reservoirs, contains contaminants consistent with the main WWTP’s influent waste stream.
Food and animal processing
Food and beverage processing waste
High strength waste from the manufacturing of food and beverages. Includes pre-sorted ground food waste, waste or expired product, wash down water by-products, food-compatible cleaning products, olive brines, bakeries, and off-spec ingredients (sugars), and dairy process by-products.
65,181,000
Winery processing (high strength)
waste
High strength winery processing waste water, for example lees. Waste contains contaminants consistent with the main WWTP’s influent waste stream.
Rendering waste Animal (beef, chicken, fish and pork) residuals, which have been heated or chemically treated in accordance with California Department Food and Agriculture requirements
Poultry processing waste
High strength waste consisting of chicken and turkey blood. Turkey and chicken lungs waste contains some pathogens in quantities similar to the main WWTP’s influent waste stream.
Beef, sheep, and swine processing
waste
High strength waste consisting of beef, sheep, and swine blood. Waste contains some pathogens similar to the main WWTP’s influent stream.
Alkaline Hydrolysis High strength waste consisting of dissolved organic matter from expired animals.
2018 Pretreatment Annual Report 23 February 28, 2019
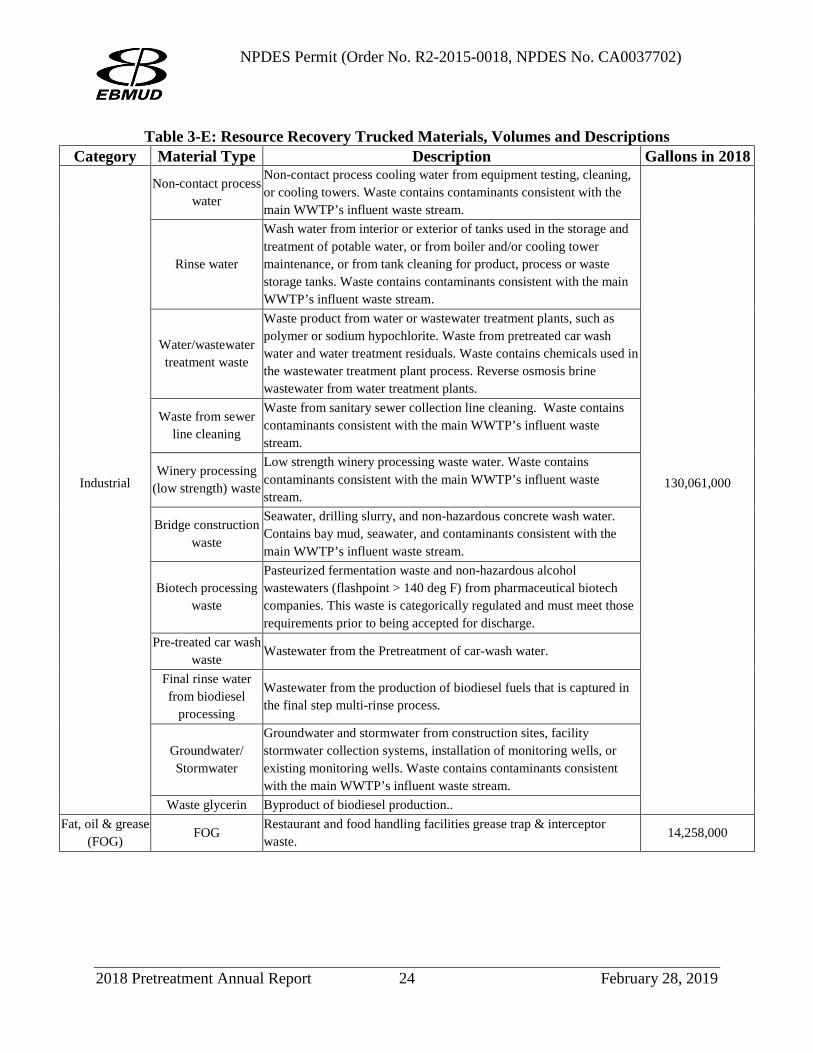
NPDES Permit (Order No. R2-2015-0018, NPDES No. CA0037702)
Table 3-E: Resource Recovery Trucked Materials, Volumes and Descriptions
3B3BCategory 2B2BMaterial Type 0B0BDescription 1B1BGallons in 2018
Industrial
Non-contact process water
Non-contact process cooling water from equipment testing, cleaning, or cooling towers. Waste contains contaminants consistent with the main WWTP’s influent waste stream.
130,061,000
Rinse water
Wash water from interior or exterior of tanks used in the storage and treatment of potable water, or from boiler and/or cooling tower maintenance, or from tank cleaning for product, process or waste storage tanks. Waste contains contaminants consistent with the main WWTP’s influent waste stream.
Water/wastewater treatment waste
Waste product from water or wastewater treatment plants, such as polymer or sodium hypochlorite. Waste from pretreated car wash water and water treatment residuals. Waste contains chemicals used in the wastewater treatment plant process. Reverse osmosis brine wastewater from water treatment plants.
Waste from sewer line cleaning
Waste from sanitary sewer collection line cleaning. Waste contains contaminants consistent with the main WWTP’s influent waste stream.
Winery processing (low strength) waste
Low strength winery processing waste water. Waste contains contaminants consistent with the main WWTP’s influent waste stream.
Bridge construction waste
Seawater, drilling slurry, and non-hazardous concrete wash water. Contains bay mud, seawater, and contaminants consistent with the main WWTP’s influent waste stream.
Biotech processing waste
Pasteurized fermentation waste and non-hazardous alcohol wastewaters (flashpoint > 140 deg F) from pharmaceutical biotech companies. This waste is categorically regulated and must meet those requirements prior to being accepted for discharge.
Pre-treated car wash waste
Wastewater from the Pretreatment of car-wash water.
Final rinse water from biodiesel
processing
Wastewater from the production of biodiesel fuels that is captured in the final step multi-rinse process.
Groundwater/ Stormwater
Groundwater and stormwater from construction sites, facility stormwater collection systems, installation of monitoring wells, or existing monitoring wells. Waste contains contaminants consistent with the main WWTP’s influent waste stream.
Waste glycerin Byproduct of biodiesel production.. Fat, oil & grease
(FOG) FOG
Restaurant and food handling facilities grease trap & interceptor waste.
14,258,000
2018 Pretreatment Annual Report 24 February 28, 2019
NPDES Permit (Order No. R2-2015-0018, NPDES No. CA0037702)
R2 Audit Program 3.5.1Trucked materials must meet a rigorous review process prior to acceptance to ensure compliance with multiple criteria including: workplace health and safety issues, plant process impact, NPDES permit, air permits, recycled water quality, and biosolids regulations. The materials acceptance and control process includes material profiling, site inspections, sampling and analysis, comparison with waste acceptance criteria, permitting, first load confirmation sampling, and an on-going audit program. As part of EBMUD’s R2 program, several field audit inspection programs are conducted annually to test consistency with permit conditions. The audit program supplements routine compliance efforts that include required sampling of first deliveries to R2 receiving facilities (referred to as a “T-first” sample) and new driver site orientations. The site orientations include an introduction to plant hazards, rules of conduct, and specific discharge instructions for each disposal location. Audits are conducted by wastewater staff and typically include review of a truck driver’s paper work (permit number, hauling company name, waste generator name, volume of tanker, and description of waste characterization), physical inspection of waste, and sampling. In addition to random audits, specific permitted wastes, drivers, or companies are audited more frequently to ensure compliance.
3.6 Enforcement Procedures
Legal Authority 3.6.1In 2018, there were no changes to EBMUD’s enforcement procedures for the Pretreatment Program. EBMUD implements and enforces its approved Pretreatment Program in accordance with 40 CFR 403, RWQCB Order No. R2-2015-0018, and EBMUD’s Wastewater Control Ordinance. The Ordinance establishes regulations for the control, interception, treatment, and disposal of wastewater. In addition, it provides for enforcement and penalties for violations of the established regulations. The Ordinance was last amended effective August 22, 2013 to include enhancements to Title VI – Enforcement and Penalties, for more effective enforcement actions consistent with EPA regulations and California State law. Minor updates were made throughout the document to remove outdated language and ensure consistent use of defined terms. Title VIII – Regulation of Private Sewer Laterals, was removed and adopted as a stand-alone document titled, Regional Private Sewer Lateral Ordinance. The Ordinance is available on EBMUD’s website (www.ebmud.com). EBMUD’s established Enforcement Response Plan (ERP) remains in effect. The ERP, which provides guidance for enforcement of Federal regulations and Ordinance provisions, was last amended in December 2015. EBMUD updated its ERP to include the August 2013 adopted enforcement enhancements to the Ordinance. Table 3-F summarizes EBMUD’s current enforcement response procedures.
2018 Pretreatment Annual Report 25 February 28, 2019
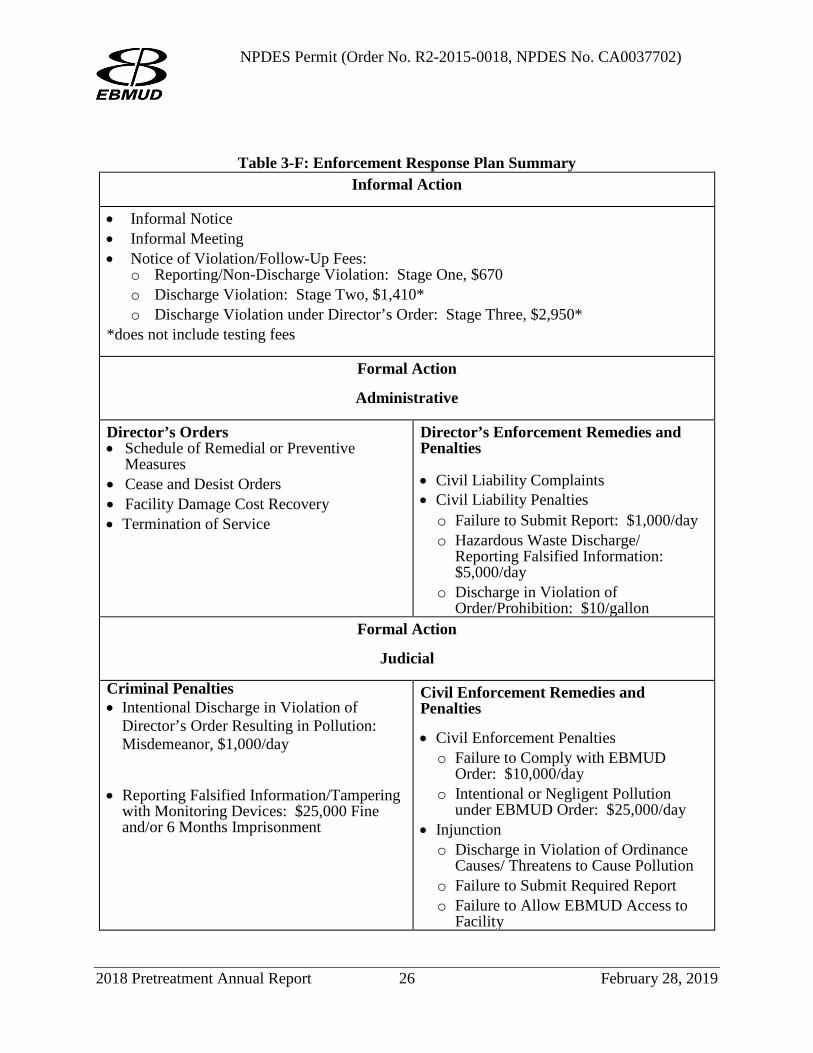
NPDES Permit (Order No. R2-2015-0018, NPDES No. CA0037702)
Table 3-F: Enforcement Response Plan Summary Informal Action
• Informal Notice • Informal Meeting • Notice of Violation/Follow-Up Fees:
o Reporting/Non-Discharge Violation: Stage One, $670 o Discharge Violation: Stage Two, $1,410* o Discharge Violation under Director’s Order: Stage Three, $2,950*
*does not include testing fees
Formal Action
Administrative
Director’s Orders • Schedule of Remedial or Preventive
Measures • Cease and Desist Orders • Facility Damage Cost Recovery • Termination of Service
Director’s Enforcement Remedies and Penalties
• Civil Liability Complaints • Civil Liability Penalties o Failure to Submit Report: $1,000/day o Hazardous Waste Discharge/
Reporting Falsified Information: $5,000/day
o Discharge in Violation of Order/Prohibition: $10/gallon
Formal Action
Judicial
Criminal Penalties • Intentional Discharge in Violation of
Director’s Order Resulting in Pollution: Misdemeanor, $1,000/day
• Reporting Falsified Information/Tampering with Monitoring Devices: $25,000 Fine and/or 6 Months Imprisonment
Civil Enforcement Remedies and Penalties
• Civil Enforcement Penalties o Failure to Comply with EBMUD
Order: $10,000/day o Intentional or Negligent Pollution
under EBMUD Order: $25,000/day • Injunction o Discharge in Violation of Ordinance
Causes/ Threatens to Cause Pollution o Failure to Submit Required Report o Failure to Allow EBMUD Access to
Facility
2018 Pretreatment Annual Report 26 February 28, 2019
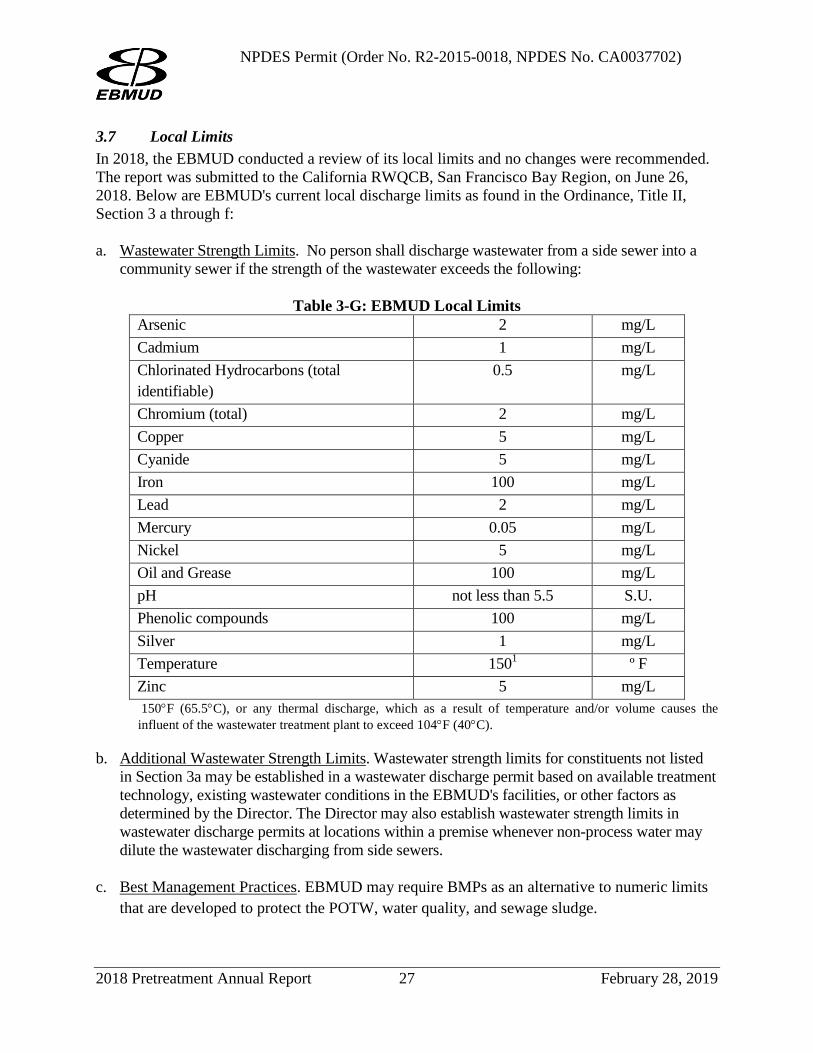
NPDES Permit (Order No. R2-2015-0018, NPDES No. CA0037702) 3.7 Local Limits In 2018, the EBMUD conducted a review of its local limits and no changes were recommended. The report was submitted to the California RWQCB, San Francisco Bay Region, on June 26, 2018. Below are EBMUD's current local discharge limits as found in the Ordinance, Title II, Section 3 a through f: a. Wastewater Strength Limits. No person shall discharge wastewater from a side sewer into a
community sewer if the strength of the wastewater exceeds the following:
Table 3-G: EBMUD Local Limits Arsenic 2 mg/L Cadmium 1 mg/L Chlorinated Hydrocarbons (total identifiable)
0.5 mg/L
Chromium (total) 2 mg/L Copper 5 mg/L Cyanide 5 mg/L Iron 100 mg/L Lead 2 mg/L Mercury 0.05 mg/L Nickel 5 mg/L Oil and Grease 100 mg/L pH not less than 5.5 S.U. Phenolic compounds 100 mg/L Silver 1 mg/L Temperature 1501 º F Zinc 5 mg/L 150°F (65.5°C), or any thermal discharge, which as a result of temperature and/or volume causes the influent of the wastewater treatment plant to exceed 104°F (40°C).
b. Additional Wastewater Strength Limits. Wastewater strength limits for constituents not listed in Section 3a may be established in a wastewater discharge permit based on available treatment technology, existing wastewater conditions in the EBMUD's facilities, or other factors as determined by the Director. The Director may also establish wastewater strength limits in wastewater discharge permits at locations within a premise whenever non-process water may dilute the wastewater discharging from side sewers.
c. Best Management Practices. EBMUD may require BMPs as an alternative to numeric limits
that are developed to protect the POTW, water quality, and sewage sludge.
2018 Pretreatment Annual Report 27 February 28, 2019
NPDES Permit (Order No. R2-2015-0018, NPDES No. CA0037702) d. Quantity and Rate of Flow Limits. No person shall discharge wastewater into a community
sewer in quantities or at rates of flow which may have an adverse or harmful effect on or overload EBMUD facilities or cause excessive or additional EBMUD treatment costs. The Director may establish mass discharge limits in Wastewater Discharge Permits to control the quantity and rate of flow of wastewater discharges.
e. Radioactive Limits. No person shall discharge or cause to be discharged any radioactive
wastewater into a community sewer except when the person is authorized to use radioactive material by the Nuclear Regulatory Commission or other governmental agency empowered to regulate the use of radioactive materials. In these cases, wastewater must be discharged in strict conformity with current Nuclear Regulatory Commission regulations and recommendations for safe disposal and in compliance with all rules and regulations of State and local regulatory agencies.
f. Deny or Condition New or Increased Contributions. The Director may deny or condition new or increased contributions of pollutants, or changes in the nature of pollutants, to EBMUD’s wastewater treatment facility by Industrial Users where such contributions do not meet applicable Pretreatment Standards and Requirements or where such contributions would cause EBMUD to violate its NPDES permit.
2018 Pretreatment Annual Report 28 February 28, 2019
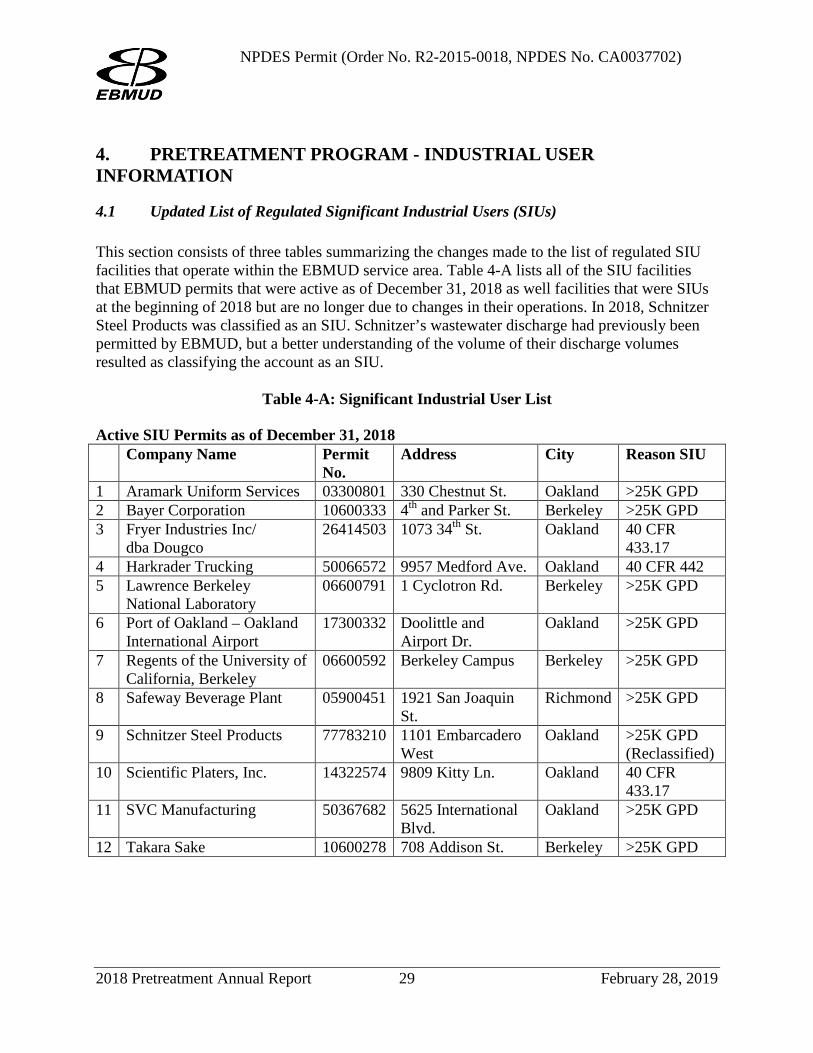
NPDES Permit (Order No. R2-2015-0018, NPDES No. CA0037702)
4. PRETREATMENT PROGRAM - INDUSTRIAL USER INFORMATION
4.1 Updated List of Regulated Significant Industrial Users (SIUs) This section consists of three tables summarizing the changes made to the list of regulated SIU facilities that operate within the EBMUD service area. Table 4-A lists all of the SIU facilities that EBMUD permits that were active as of December 31, 2018 as well facilities that were SIUs at the beginning of 2018 but are no longer due to changes in their operations. In 2018, Schnitzer Steel Products was classified as an SIU. Schnitzer’s wastewater discharge had previously been permitted by EBMUD, but a better understanding of the volume of their discharge volumes resulted as classifying the account as an SIU.
Table 4-A: Significant Industrial User List Active SIU Permits as of December 31, 2018 Company Name Permit
No. Address City Reason SIU
1 Aramark Uniform Services 03300801 330 Chestnut St. Oakland >25K GPD 2 Bayer Corporation 10600333 4th and Parker St. Berkeley >25K GPD 3 Fryer Industries Inc/
dba Dougco 26414503 1073 34th St. Oakland 40 CFR
433.17 4 Harkrader Trucking 50066572 9957 Medford Ave. Oakland 40 CFR 442 5 Lawrence Berkeley
National Laboratory 06600791 1 Cyclotron Rd. Berkeley >25K GPD
6 Port of Oakland – Oakland International Airport
17300332 Doolittle and Airport Dr.
Oakland >25K GPD
7 Regents of the University of California, Berkeley
06600592 Berkeley Campus Berkeley >25K GPD
8 Safeway Beverage Plant 05900451 1921 San Joaquin St.
Richmond >25K GPD
9 Schnitzer Steel Products 77783210 1101 Embarcadero West
Oakland >25K GPD (Reclassified)
10 Scientific Platers, Inc. 14322574 9809 Kitty Ln. Oakland 40 CFR 433.17
11 SVC Manufacturing 50367682 5625 International Blvd.
Oakland >25K GPD
12 Takara Sake 10600278 708 Addison St. Berkeley >25K GPD
2018 Pretreatment Annual Report 29 February 28, 2019
NPDES Permit (Order No. R2-2015-0018, NPDES No. CA0037702) SIUs Permits Active in 2018, Delisted as of December 31, 2018 Company Name Permit No. Address City Reason SIU 1 AC Transit -
Emeryville 04391161 1177 47th St. Emeryville Delisted –
maintained consistent permit compliance and no longer discharges >25K GPD
2 AC Transit - International
19526191 10626 International Blvd
Oakland Delisted – maintained consistent permit compliance and no longer discharges >25K GPD
3 AC Transit - Seminary
14300671 1100 Seminary Ave.
Oakland Delisted – maintained consistent permit compliance and no longer discharges >25K GPD
4 Longview Fibre Company
17300112 8511 Blaine St. Oakland Facility Closure
5 Metalco, Inc. 07390021 1475 67th St. Emeryville Facility Closure 6 Union Pacific
Railroad Company 02300371 1851 B 5th St. Oakland Delisted –
maintained consistent permit compliance and no longer discharges >25K GPD
4.2 Monitoring Report Update No new SIUs were added to the Pretreatment Program in 2018; therefore there is no Baseline Monitoring Report update.
4.3 July-December Semiannual Data The Semiannual Pretreatment Data for the period of July 2018 through December 2018 was prepared in accordance with Order No. R2-2015-0018, NPDES Permit No. CA0037702 and is presented below.
2018 Pretreatment Annual Report 30 February 28, 2019
NPDES Permit (Order No. R2-2015-0018, NPDES No. CA0037702)
Significant Industrial User – Categorical 4.3.1 The following facilities had a violation during the July- December 2018 semi-annual reporting period.
Significant Industrial User - Categorical 40 CFR 433.17
Facility Name, Permit Number
and Address
Semi-Annual Compliance Status
Date of Violation
Sample By POTW/IU/
OTHER Parameter Result(s)
(mg/L)
Discharge Limit
(mg/L) Current Previous Q4 Q3 Q2 Q1
2018 2018 2018 2018
Fryer Industries Inc./dba Dougco
SNC C C C 12/12/2018 POTW Cr/Ni Cr = 2.86 Ni = 5.00
Cr = 2.77 Ni = 3.98
1073 34th St. Oakland, CA 94608
Comments on Follow up, Corrective, or Enforcement Action Taken
On December 12, 2018, Fryer Industries Inc./dba Dougco violated the federal discharge limitations for chromium and nickel. EBMUD issued a Notice of Violation dated December 28, 2018 regarding non-compliance and assessed a $1,410 violation follow-up fee. Since this was the only sample collected within the six month period, Fryer Industries Inc./dba Dougco was in significant non-compliance and thus reported in the newspaper on January 25, 2019. Fryer Industries Inc./dba Dougco noted higher than normal processing of stainless steel products during the month of December which they cited as a likely contributor to the sample excursions. Fryer Industries Inc./dba Dougco is working on addressing this issue. Follow-up samples were collected by EBMUD inspectors on January 17, 2019 and the results for chromium (0.24 mg/L) and nickel (0.14 mg/L) were in compliance with discharge limitations.
C = Consistent compliance SNC = Significant Non-compliance POTW = Publically Owned Treatment Works IU = Industrial User Cr = Chromium; Ni = Nickel 2018 Pretreatment Annual Report 31 February 28, 2019
NPDES Permit (Order No. R2-2015-0018, NPDES No. CA0037702) Significant Industrial User – Categorical 413.64
Facility Name, Permit Number
and Address
Semi-Annual Compliance Status
Date of Violation
Sample By POTW/IU/
OTHER
Parameter Result(s) (mg/L) Discharge
Limit (mg/L) Current Previous
Q4 Q3 Q2 Q1 2018 2018 2018 2018
Metalco, Inc.
SNC SNC C C 9/15/2018 OTHER N/A N/A N/A
1475 67th St. Emeryville, CA 94608
Comments on Follow up, Corrective, or Enforcement Action Taken
Metalco was in SNC for failure to submit a Self-Monitoring Report within 45 days after the July 31, 2018 due date. Metalco, Inc. sent a letter to EBMUD dated August 8, 2018 which confirmed that Metalco Inc. will cease operations on August 10, 2018 and the facility was slated to close no later than August 31, 2018. EBMUD conducted a site inspection on September 7, 2018 to confirm that the facility had closed. EBMUD terminated Metalco’s wastewater discharge permit on January 28, 2019. EBMUD staff followed the Pretreatment Program’s Emergency Response Plan procedures and issued a Notice of Violation dated September 24, 2018 and assessed a violation fee of $670. The violation was reported in the local newspaper on January 25, 2019.
SNC = Significant Non-compliance C = Consistent compliance POTW = Publically Owned Treatment Works IU = Industrial User N/A = Not applicable
2018 Pretreatment Annual Report 32 February 28, 2019
NPDES Permit (Order No. R2-2015-0018, NPDES No. CA0037702)
Significant Industrial User – Non-Categorical 4.3.2 The following facilities had changes in status since the previous Semiannual Pretreatment Report and Inconsistent Compliance during the July – December 2018 reporting period. Significant Industrial User – Non-categorical (Local)
Facility Name, Permit Number
and Address
Semi-Annual Compliance Status
Date of Violation
Sample By POTW/IU/
OTHER Parameter Result(s)
(mg/L)
Discharge Limit
(mg/L) Current Previous Q4 Q3 Q2 Q1
2018 2018 2018 2018
Takara Sake
IC C C C 12/18/2018 POTW pH 4.25 and 4.67 Not less than 5.5
708 Addison St. Berkeley, CA 94710
Comments on Follow up, Corrective, or Enforcement Action Taken
On December 18, 2018, discharge from Takara’s side sewer #2 violated the local pH limit. EBMUD issued a Notice of Violation dated December 21, 2018 regarding the non-compliance and assessed a $1,410 violation follow-up fee. Takara’s response, dated December 28, 2018, indicated Takara is currently working to identify a new contractor to design, install and implement an effective treatment system. A follow-up pH sample was collected on January 16, 2019 and measured 7.26, above EBMUD’s lower limit of 5.5.
POTW = Publically Owned Treatment Works IU = Industrial User IC = Inconsistent compliance C = Consistent compliance
2018 Pretreatment Annual Report 33 February 28, 2019
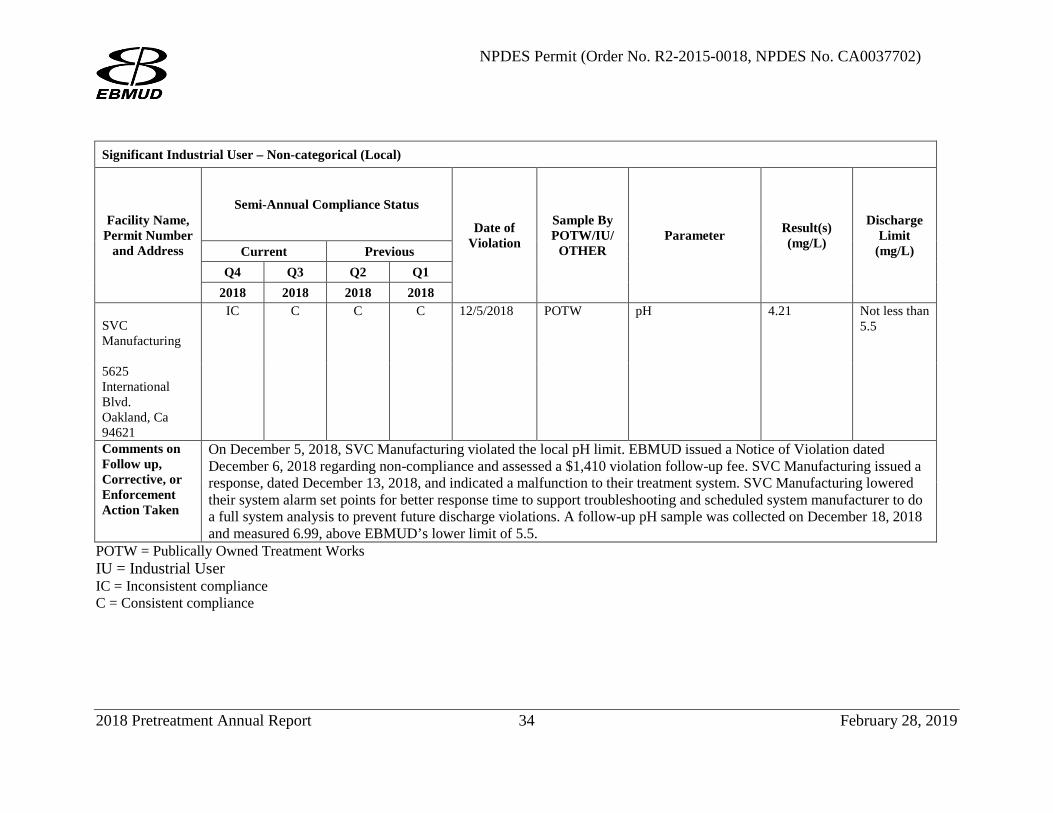
NPDES Permit (Order No. R2-2015-0018, NPDES No. CA0037702) Significant Industrial User – Non-categorical (Local)
Facility Name, Permit Number
and Address
Semi-Annual Compliance Status
Date of Violation
Sample By POTW/IU/
OTHER Parameter Result(s)
(mg/L)
Discharge Limit
(mg/L) Current Previous Q4 Q3 Q2 Q1
2018 2018 2018 2018
SVC Manufacturing
IC C C C 12/5/2018 POTW pH
4.21 Not less than 5.5
5625 International Blvd. Oakland, Ca 94621 Comments on Follow up, Corrective, or Enforcement Action Taken
On December 5, 2018, SVC Manufacturing violated the local pH limit. EBMUD issued a Notice of Violation dated December 6, 2018 regarding non-compliance and assessed a $1,410 violation follow-up fee. SVC Manufacturing issued a response, dated December 13, 2018, and indicated a malfunction to their treatment system. SVC Manufacturing lowered their system alarm set points for better response time to support troubleshooting and scheduled system manufacturer to do a full system analysis to prevent future discharge violations. A follow-up pH sample was collected on December 18, 2018 and measured 6.99, above EBMUD’s lower limit of 5.5.
POTW = Publically Owned Treatment Works IU = Industrial User IC = Inconsistent compliance C = Consistent compliance
2018 Pretreatment Annual Report 34 February 28, 2019
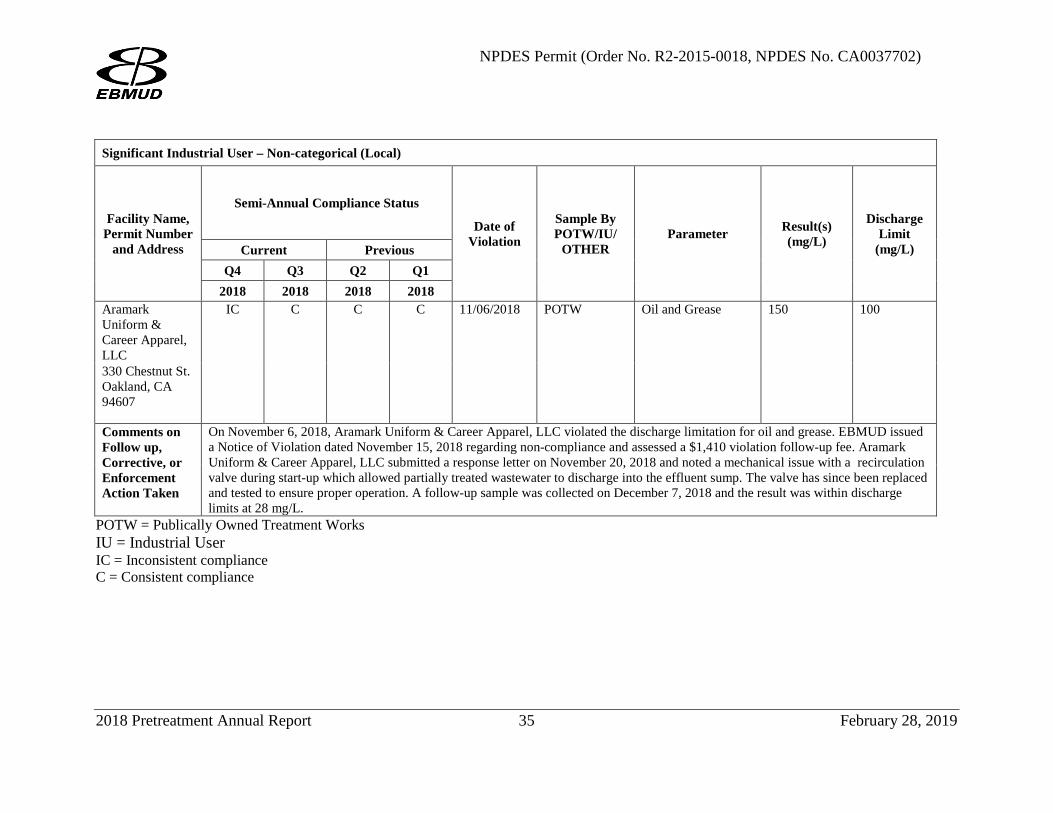
NPDES Permit (Order No. R2-2015-0018, NPDES No. CA0037702) Significant Industrial User – Non-categorical (Local)
Facility Name, Permit Number
and Address
Semi-Annual Compliance Status
Date of Violation
Sample By POTW/IU/
OTHER Parameter Result(s)
(mg/L)
Discharge Limit
(mg/L) Current Previous Q4 Q3 Q2 Q1
2018 2018 2018 2018 Aramark Uniform & Career Apparel, LLC
IC C C C 11/06/2018 POTW Oil and Grease 150 100
330 Chestnut St. Oakland, CA 94607
Comments on Follow up, Corrective, or Enforcement Action Taken
On November 6, 2018, Aramark Uniform & Career Apparel, LLC violated the discharge limitation for oil and grease. EBMUD issued a Notice of Violation dated November 15, 2018 regarding non-compliance and assessed a $1,410 violation follow-up fee. Aramark Uniform & Career Apparel, LLC submitted a response letter on November 20, 2018 and noted a mechanical issue with a recirculation valve during start-up which allowed partially treated wastewater to discharge into the effluent sump. The valve has since been replaced and tested to ensure proper operation. A follow-up sample was collected on December 7, 2018 and the result was within discharge limits at 28 mg/L.
POTW = Publically Owned Treatment Works IU = Industrial User IC = Inconsistent compliance C = Consistent compliance
2018 Pretreatment Annual Report 35 February 28, 2019
NPDES Permit (Order No. R2-2015-0018, NPDES No. CA0037702
4.4 Public Participation Summary As required by 40 CFR 403.8(f)(2)(viii), EBMUD publishes in the appropriate local newspaper, a list of industrial users which at any time during the reporting year were in Significant Noncompliance with applicable Pretreatment requirements. Exhibit A includes a copy of the public notice that was published in the Oakland Tribune and West County Times on January 25, 2019.
4.5 Compliance Activities for CIUs, SIUs, and Other Regulated Facilities
See Exhibit H for a summary of the compliance activities for IUs.
2018 Pretreatment Annual Report 36 February 28, 2019
NPDES Permit (Order No. R2-2015-0018, NPDES No. CA0037702)
5. POLLUTION PREVENTION PROGRAM REPORT This chapter includes EBMUD’s annual Pollution Prevention (P2) Report for the January 1, 2018 through December 31, 2018 reporting period. The report was prepared in accordance with EBMUD’s NPDES Permit No. CA0037702, Order No. R2-2015-0018, adopted on May 13, 2015.
5.1 Pollution Prevention Program Highlights for 2018 EBMUD continued P2 activities for its commercial and residential customers. Highlights for 2018 are noted below. General
• Continued promotion of the Wastewater Treatment Plant Tour Program for the general public and school tours. See Exhibit G.
• Continued participation at various community events utilizing outreach tools (e.g., spin wheel) designed to attract and engage visitors with Pollution Prevention (P2) information and thought-provoking questions to enhance an active, hands-on learning experience. Local outreach events included the annual Solano Stroll, Alameda Earth Day, and the Alameda Art and Wine Festival events. See Exhibit D and Exhibit E.
FOG
• Continued to provide assistance to EBMUD’s seven satellite collection system agencies with their fats, oil, and grease (FOG) program requirements.
• Conducted hotspot response to 45 FOG-related SSOs and blockages reported by EBMUD’s satellite agencies. Hotspot investigations have resulted in issuing numerous grease control device (GCD) installation and maintenance requirement letters. GCD installations and improved grease interceptor pump out and maintenance at food service establishments (FSEs) have occurred following inspections and investigations.
• Completed the 2018 Regional FOG Program Annual Report and quarterly hotspot summary reports for satellite use.
• Integrated FOG program database with GIS to increase program effectiveness. • Continued to make available residential FOG drop-off locations. • Provided FOG outreach materials for satellite agencies to distribute to FSEs and residents
in the field. • Conducted annual holiday FOG partnership with BayKeeper. • Continued residential FOG/trash outreach, mailing letters and outreach materials to
residential hotspot areas. • Maintained and updated various EBMUD web pages relating to residential FOG which
included www.ebmud/cleanbay and the EBMUD-FOG residential disposal web page, https://www.ebmud.com/environment/pollution-prevention/residential-cooking-oil-and-grease-drop-program, with an added link on resources page to www.baywise.org website for regional FOG disposal information.
2018 Pretreatment Annual Report 37 February 28, 2019
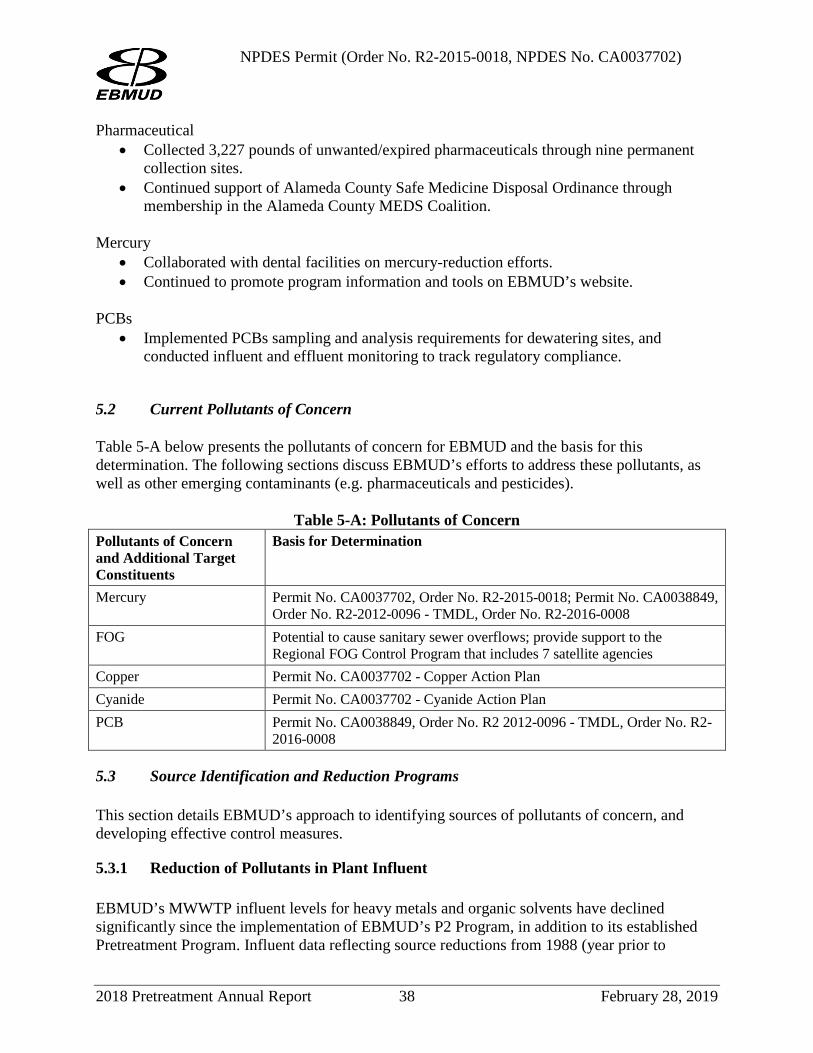
NPDES Permit (Order No. R2-2015-0018, NPDES No. CA0037702) Pharmaceutical
• Collected 3,227 pounds of unwanted/expired pharmaceuticals through nine permanent collection sites.
• Continued support of Alameda County Safe Medicine Disposal Ordinance through membership in the Alameda County MEDS Coalition.
Mercury
• Collaborated with dental facilities on mercury-reduction efforts. • Continued to promote program information and tools on EBMUD’s website.
PCBs
• Implemented PCBs sampling and analysis requirements for dewatering sites, and conducted influent and effluent monitoring to track regulatory compliance.
5.2 Current Pollutants of Concern Table 5-A below presents the pollutants of concern for EBMUD and the basis for this determination. The following sections discuss EBMUD’s efforts to address these pollutants, as well as other emerging contaminants (e.g. pharmaceuticals and pesticides).
Table 5-A: Pollutants of Concern Pollutants of Concern and Additional Target Constituents
Basis for Determination
Mercury Permit No. CA0037702, Order No. R2-2015-0018; Permit No. CA0038849, Order No. R2-2012-0096 - TMDL, Order No. R2-2016-0008
FOG Potential to cause sanitary sewer overflows; provide support to the Regional FOG Control Program that includes 7 satellite agencies
Copper Permit No. CA0037702 - Copper Action Plan Cyanide Permit No. CA0037702 - Cyanide Action Plan PCB Permit No. CA0038849, Order No. R2 2012-0096 - TMDL, Order No. R2-
2016-0008
5.3 Source Identification and Reduction Programs This section details EBMUD’s approach to identifying sources of pollutants of concern, and developing effective control measures.
Reduction of Pollutants in Plant Influent 5.3.1 EBMUD’s MWWTP influent levels for heavy metals and organic solvents have declined significantly since the implementation of EBMUD’s P2 Program, in addition to its established Pretreatment Program. Influent data reflecting source reductions from 1988 (year prior to
2018 Pretreatment Annual Report 38 February 28, 2019
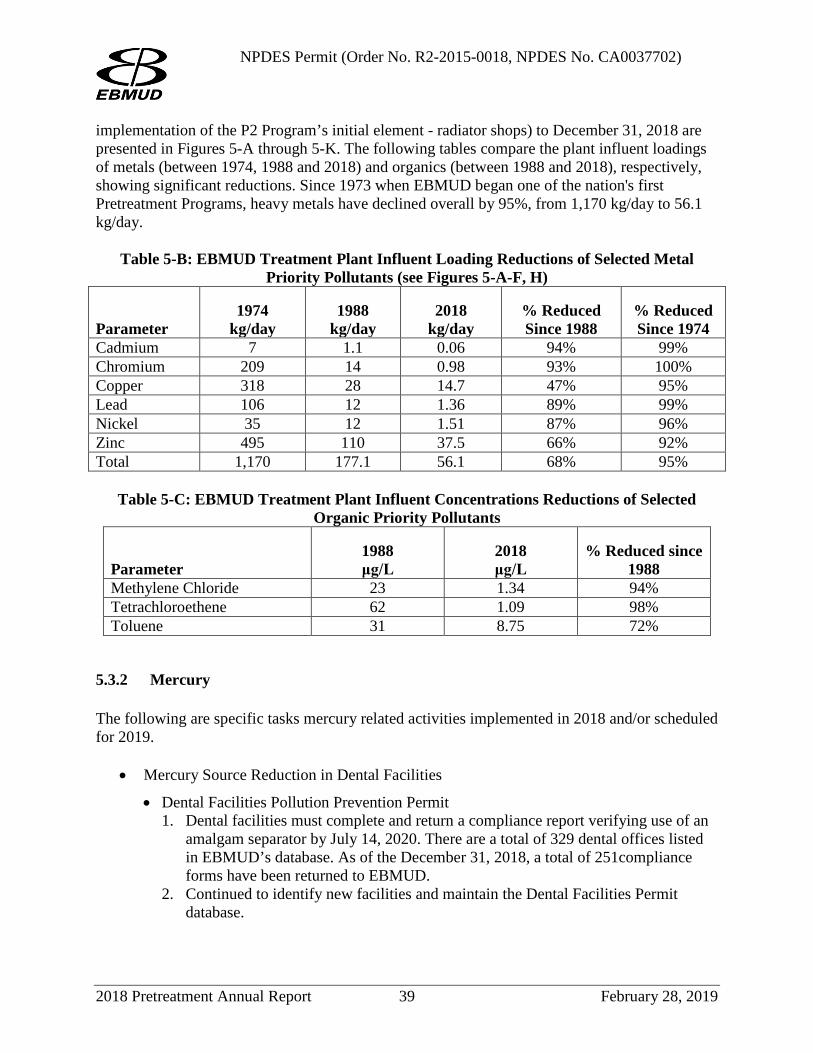
NPDES Permit (Order No. R2-2015-0018, NPDES No. CA0037702) implementation of the P2 Program’s initial element - radiator shops) to December 31, 2018 are presented in Figures 5-A through 5-K. The following tables compare the plant influent loadings of metals (between 1974, 1988 and 2018) and organics (between 1988 and 2018), respectively, showing significant reductions. Since 1973 when EBMUD began one of the nation's first Pretreatment Programs, heavy metals have declined overall by 95%, from 1,170 kg/day to 56.1 kg/day.
Table 5-B: EBMUD Treatment Plant Influent Loading Reductions of Selected Metal Priority Pollutants (see Figures 5-A-F, H)
Parameter 1974
kg/day 1988
kg/day 2018
kg/day % Reduced Since 1988
% Reduced Since 1974
Cadmium 7 1.1 0.06 94% 99% Chromium 209 14 0.98 93% 100% Copper 318 28 14.7 47% 95% Lead 106 12 1.36 89% 99% Nickel 35 12 1.51 87% 96% Zinc 495 110 37.5 66% 92% Total 1,170 177.1 56.1 68% 95%
Table 5-C: EBMUD Treatment Plant Influent Concentrations Reductions of Selected
Organic Priority Pollutants
Parameter 1988 μg/L
2018 μg/L
% Reduced since 1988
Methylene Chloride 23 1.34 94% Tetrachloroethene 62 1.09 98% Toluene 31 8.75 72%
Mercury 5.3.2 The following are specific tasks mercury related activities implemented in 2018 and/or scheduled for 2019.
• Mercury Source Reduction in Dental Facilities
• Dental Facilities Pollution Prevention Permit 1. Dental facilities must complete and return a compliance report verifying use of an
amalgam separator by July 14, 2020. There are a total of 329 dental offices listed in EBMUD’s database. As of the December 31, 2018, a total of 251compliance forms have been returned to EBMUD.
2. Continued to identify new facilities and maintain the Dental Facilities Permit database.
2018 Pretreatment Annual Report 39 February 28, 2019
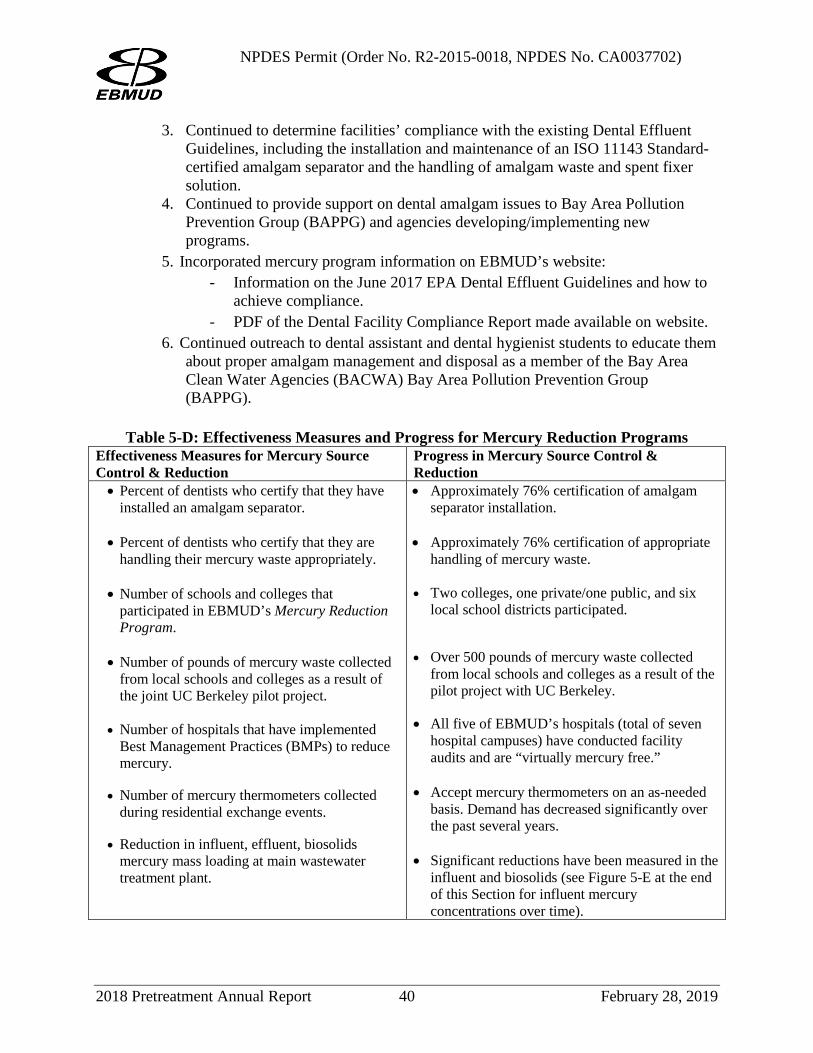
NPDES Permit (Order No. R2-2015-0018, NPDES No. CA0037702)
3. Continued to determine facilities’ compliance with the existing Dental Effluent Guidelines, including the installation and maintenance of an ISO 11143 Standard-certified amalgam separator and the handling of amalgam waste and spent fixer solution.
4. Continued to provide support on dental amalgam issues to Bay Area Pollution Prevention Group (BAPPG) and agencies developing/implementing new programs.
5. Incorporated mercury program information on EBMUD’s website: - Information on the June 2017 EPA Dental Effluent Guidelines and how to
achieve compliance. - PDF of the Dental Facility Compliance Report made available on website.
6. Continued outreach to dental assistant and dental hygienist students to educate them about proper amalgam management and disposal as a member of the Bay Area Clean Water Agencies (BACWA) Bay Area Pollution Prevention Group (BAPPG).
Table 5-D: Effectiveness Measures and Progress for Mercury Reduction Programs
Effectiveness Measures for Mercury Source Control & Reduction
Progress in Mercury Source Control & Reduction
• Percent of dentists who certify that they have installed an amalgam separator.
• Percent of dentists who certify that they are handling their mercury waste appropriately.
• Number of schools and colleges that participated in EBMUD’s Mercury Reduction Program.
• Number of pounds of mercury waste collected from local schools and colleges as a result of the joint UC Berkeley pilot project.
• Number of hospitals that have implemented Best Management Practices (BMPs) to reduce mercury.
• Number of mercury thermometers collected during residential exchange events.
• Reduction in influent, effluent, biosolids
mercury mass loading at main wastewater treatment plant.
• Approximately 76% certification of amalgam separator installation.
• Approximately 76% certification of appropriate handling of mercury waste.
• Two colleges, one private/one public, and six
local school districts participated. • Over 500 pounds of mercury waste collected
from local schools and colleges as a result of the pilot project with UC Berkeley.
• All five of EBMUD’s hospitals (total of seven hospital campuses) have conducted facility audits and are “virtually mercury free.”
• Accept mercury thermometers on an as-needed basis. Demand has decreased significantly over the past several years.
• Significant reductions have been measured in the
influent and biosolids (see Figure 5-E at the end of this Section for influent mercury concentrations over time).
2018 Pretreatment Annual Report 40 February 28, 2019
NPDES Permit (Order No. R2-2015-0018, NPDES No. CA0037702)
Fats, Oil, and Grease (FOG) 5.3.3 The Regional FOG Control Program includes residential and commercial components to address FOG-related sanitary sewer overflows (SSOs) and blockages in the sanitary sewer collection systems. These FOG-related SSOs and blockages are commonly referred to as “hotspots.” Collection system agencies within EBMUD’s wastewater service area report hotspots to EBMUD for follow-up and outreach. EBMUD staff determines whether the blockages are in a commercial or residential drainage basin. For commercial hotspot areas, EBMUD conducts field investigations, which may include FSE inspections, camera investigations, and/or gravity grease interceptor inspections. Those FSEs that generate grease and are found to cause or contribute to a blockage or SSO are required to install a grease control device (GCD). FSEs with grease interceptors (GIs) are required to increase the pumping frequencies of their GIs as needed by a licensed grease hauler. As part of the Regional FOG Control Program, EBMUD performs GI inspections in non-hotspot areas when requested, provides enforcement support for agencies, reports all work activities and progress in quarterly hotspot reports, provides routine database management with annual updates to remove old or outdated data and updates the database with new and current FSE information, and conducts commercial and residential FOG outreach.
EBMUD identifies priority areas for targeted residential outreach, distributes outreach materials in identified areas, and reports investigation results to agencies. Over the last fifteen years, EBMUD has conducted outreach to businesses, universities and residents, both throughout the year and during holidays. EBMUD continues to implement multi-lingual targeted outreach in residential “hotspot” areas. In addition, EBMUD provides support to BAPPG’s FOG holiday outreach efforts and partners with BayKeeper to educate residents about preventing sewage backups caused by FOG. During 2018, EBMUD conducted the tasks summarized below.
• Commercial FOG Program
• Continued hotspot investigation procedures for grease-related SSOs and blockages reported by EBMUD’s wastewater service area agencies. There were a total of 45 reports submitted to EBMUD by each service area agency. Out of the 45 reports, there were 5 grease blockage reports, 37 SSO reports, and 3 increased maintenance reports submitted, with 20 being identified as being caused by or contributed to by FSEs.
• Continued implementation of a Grease Generating Capability Checklist to record findings during FSE inspections and support the decision-making process pertaining to GCD requirements.
2018 Pretreatment Annual Report 41 February 28, 2019
NPDES Permit (Order No. R2-2015-0018, NPDES No. CA0037702)
• Provided enforcement support to agencies for the installation of GCDs and grease interceptor pumping at facilities shown to cause or contribute to FOG-related SSOs or blockages.
• Continued field inspections at FSEs with gravity grease interceptors to document compliance monitoring and ensure sufficient cleaning and maintenance of grease interceptors.
• Continued quarterly hotspot progress reports to individual collection system agencies.
• Continued the Annual Regional FOG Program Report to collection system agencies in EBMUD service area to document all of the efforts and progress over the course of the year.
• Continued maintenance of a FOG control database with enhancements to integrate GIS capabilities and continuous improvements to add new functions and features that improve the user experience.
• Completed 2018 annual FOG database update. • Participated in Bay Area-wide collaboration efforts on FOG issues. Examples of
FOG-related outreach documents developed in collaboration with BAPPG and other stakeholders are available at www.bappg.org.
• Updated the EBMUD commercial FOG web page: http://www.ebmud.com/wastewater/bay-friendly-waste-disposal/fats-oils-and-grease/.
• Residential FOG Program
• Continued the Residential Used Cooking Oil Collection Program for residents in EBMUD’s service area. During 2018, a total of 4,830 gallons of used cooking oil and grease was collected from EBMUD’s MWWTP, El Cerrito Recycling Center and the Oakland Whole Foods residential cooking oil drop-off locations. All three facilities recycle the collected cooking oil into a biofuel.
• Promoted Alameda County’s household hazardous waste facility, Richmond’s West County Resource Recovery facility, and Central Contra Costa Sanitary District’s household hazardous waste facility through outreach about their acceptance of residential FOG.
• Conducted annual holiday outreach campaign in collaboration with San Francisco BayKeeper. Distributed outreach material to 24 local independent retailers of turkey fryers and oil jugs.
• Distributed FOG scrapers via the EBMUD on-line store and the EBMUD phone hotline.
• Performed outreach utilizing the “Think Before You Flush” brochure to address “disposable” wipes and consumer products, which often come in tandem with FOG and cause chronic problems, including blockages, SSOs, and expensive repair and maintenance issues, in the sanitary sewer systems. In 2018, mailed 572 personalized FOG and “wipes/trash” related letters and “Think Before You Flush” brochures (in addition to residential FOG brochures) to residents in identified hotspot areas.
2018 Pretreatment Annual Report 42 February 28, 2019
NPDES Permit (Order No. R2-2015-0018, NPDES No. CA0037702)
• Continued collaborative outreach efforts with satellite agencies by providing FOG outreach materials for distribution to community members at their local events. Outreach material was also provided for agencies’ sewer maintenance crews to distribute to FSEs and residents when working in the field.
• Distributed residential FOG outreach materials at community events, including Solano Stroll, the Alameda Art and Wine Festival, and Alameda Earth Day. See Exhibit D and Exhibit E.
• Updated EBMUD residential FOG information on our P2 web page: www.ebmud.com/cleanbay as well as our EBMUD-FOG residential disposal web page, http://www.ebmud.com/wastewater/residential_pollution_prevention/. Added link on the resources page for www.baywise.org, provides regional FOG disposal information.
2018 Pretreatment Annual Report 43 February 28, 2019
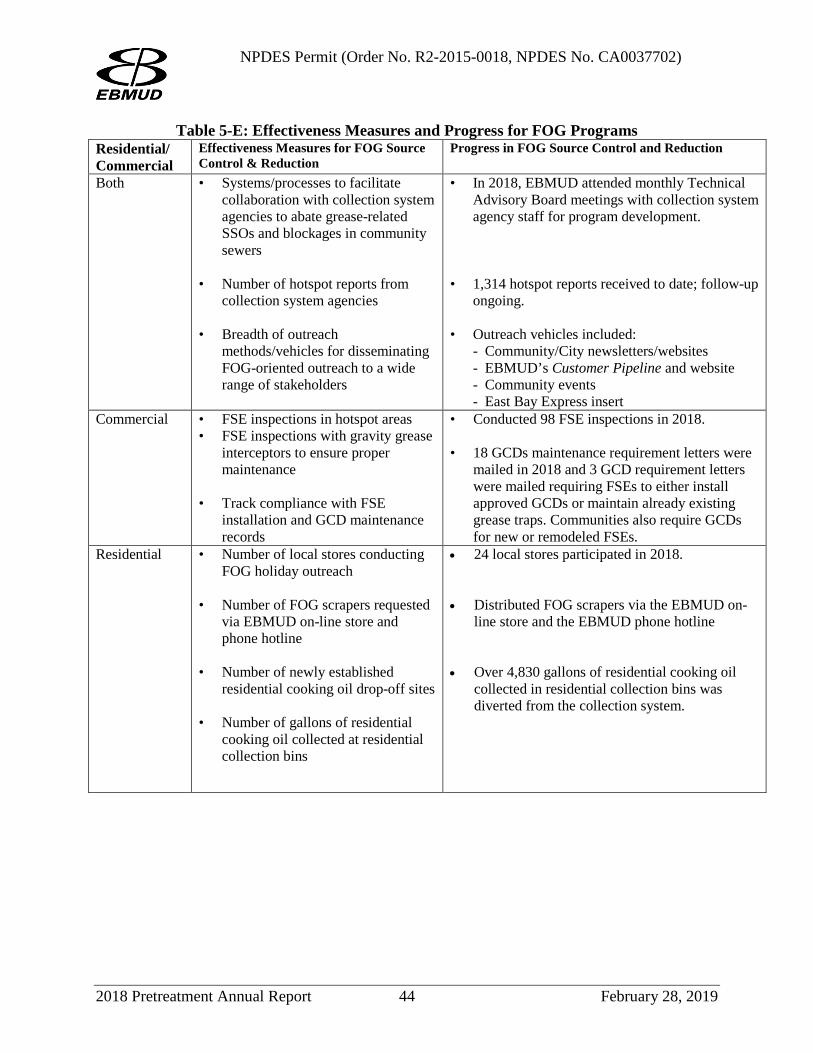
NPDES Permit (Order No. R2-2015-0018, NPDES No. CA0037702)
Table 5-E: Effectiveness Measures and Progress for FOG Programs Residential/ Commercial
Effectiveness Measures for FOG Source Control & Reduction
Progress in FOG Source Control and Reduction
Both • Systems/processes to facilitate collaboration with collection system agencies to abate grease-related SSOs and blockages in community sewers
• Number of hotspot reports from collection system agencies
• Breadth of outreach methods/vehicles for disseminating FOG-oriented outreach to a wide range of stakeholders
• In 2018, EBMUD attended monthly Technical Advisory Board meetings with collection system agency staff for program development.
• 1,314 hotspot reports received to date; follow-up ongoing.
• Outreach vehicles included: - Community/City newsletters/websites - EBMUD’s Customer Pipeline and website - Community events - East Bay Express insert
Commercial • FSE inspections in hotspot areas • FSE inspections with gravity grease
interceptors to ensure proper maintenance
• Track compliance with FSE
installation and GCD maintenance records
• Conducted 98 FSE inspections in 2018. • 18 GCDs maintenance requirement letters were
mailed in 2018 and 3 GCD requirement letters were mailed requiring FSEs to either install approved GCDs or maintain already existing grease traps. Communities also require GCDs for new or remodeled FSEs.
Residential • Number of local stores conducting FOG holiday outreach
• Number of FOG scrapers requested via EBMUD on-line store and phone hotline
• Number of newly established residential cooking oil drop-off sites
• Number of gallons of residential
cooking oil collected at residential collection bins
• 24 local stores participated in 2018. • Distributed FOG scrapers via the EBMUD on-
line store and the EBMUD phone hotline
• Over 4,830 gallons of residential cooking oil collected in residential collection bins was diverted from the collection system.
2018 Pretreatment Annual Report 44 February 28, 2019
NPDES Permit (Order No. R2-2015-0018, NPDES No. CA0037702)
Copper 5.3.4 Copper is found in tap water from corrosion. Other identified commercial and industrial sources of copper include vehicle repair shops, printing shops, radiator shops, electroplating/metal finishing facilities, transportation equipment cleaning and boatyards. EBMUD issues permits and conducts inspections, as needed, to ensure ongoing implementation of pretreatment requirements for facilities in the electroplating, metal finishing, and transportation equipment cleaning categories. EBMUD also issues P2 permits requiring implementation of permit-specific Best Management Practices (BMPs) for facilities in the vehicle repair, printing, radiator, and boatyard business types. Copper loading to the EBMUD MWWTP initially decreased with the issuance of permits to the various industries listed above. Recent loading has remained consistent, as shown in Figure 5-C (see graphs at the end of this section). The total average copper loading to EBMUD’s WWTP during 2017 was 17.1 kg/day. EBMUD continued implementation of a Copper Action Plan, described below, to address overall copper contributions and control. The Regional Monitoring Program for Water Quality in San Francisco Bay (RMP) is the only comprehensive environmental monitoring program to measure pollutants and trends in the Bay. EBMUD, through BACWA, contributes to the base RMP program costs assigned to POTWs (44%). This support is essential for the RMP to conduct regional monitoring and assess the cumulative impact of multiple sources of pollutants to the Bay relative to the Copper Action Plan. In March 2016, the Regional Water Board adopted the Alternative Monitoring Requirements (AMR), Order No. R2-2016-0008, for the purpose of adding support to the RMP. This Order allows POTWs to reduce monitoring frequencies for specific pollutants in exchange for increased funding to the RMP. EBMUD opted into the AMR.
2018 Pretreatment Annual Report 45 February 28, 2019
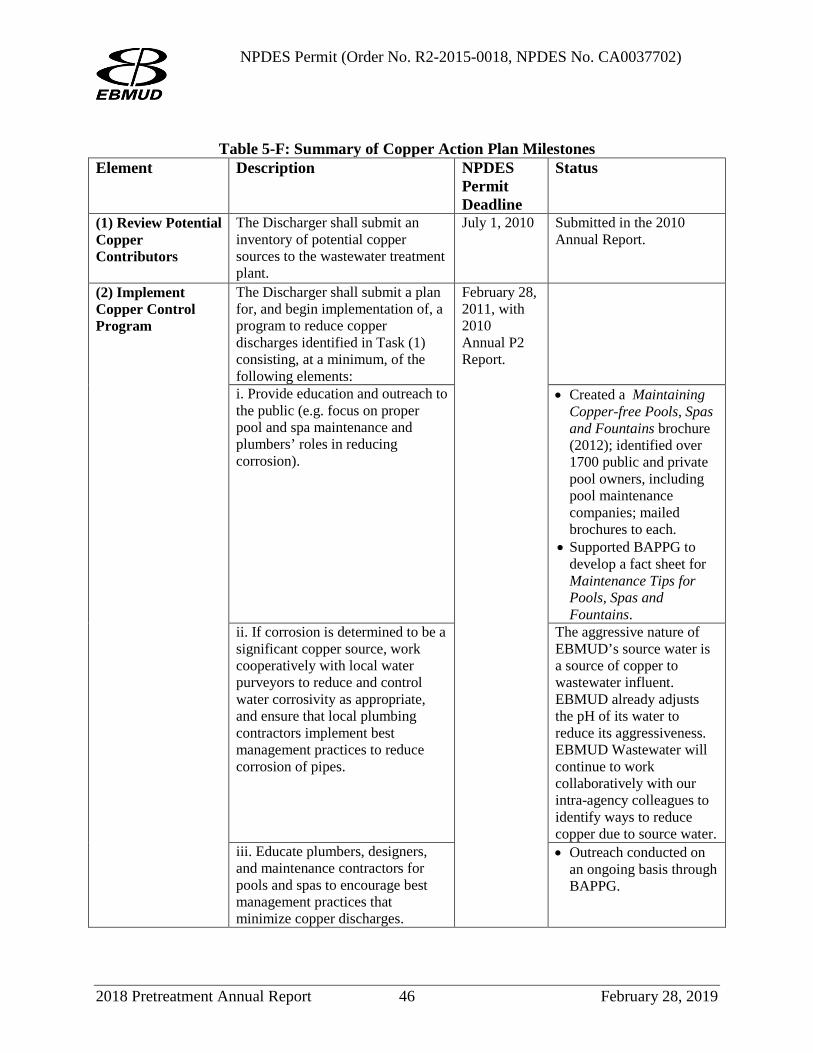
NPDES Permit (Order No. R2-2015-0018, NPDES No. CA0037702)
Table 5-F: Summary of Copper Action Plan Milestones
Element Description NPDES Permit Deadline
Status
(1) Review Potential Copper Contributors
The Discharger shall submit an inventory of potential copper sources to the wastewater treatment plant.
July 1, 2010 Submitted in the 2010 Annual Report.
(2) Implement Copper Control Program
The Discharger shall submit a plan for, and begin implementation of, a program to reduce copper discharges identified in Task (1) consisting, at a minimum, of the following elements:
February 28, 2011, with 2010 Annual P2 Report.
i. Provide education and outreach to the public (e.g. focus on proper pool and spa maintenance and plumbers’ roles in reducing corrosion).
• Created a Maintaining Copper-free Pools, Spas and Fountains brochure (2012); identified over 1700 public and private pool owners, including pool maintenance companies; mailed brochures to each.
• Supported BAPPG to develop a fact sheet for Maintenance Tips for Pools, Spas and Fountains.
ii. If corrosion is determined to be a significant copper source, work cooperatively with local water purveyors to reduce and control water corrosivity as appropriate, and ensure that local plumbing contractors implement best management practices to reduce corrosion of pipes.
The aggressive nature of EBMUD’s source water is a source of copper to wastewater influent. EBMUD already adjusts the pH of its water to reduce its aggressiveness. EBMUD Wastewater will continue to work collaboratively with our intra-agency colleagues to identify ways to reduce copper due to source water.
iii. Educate plumbers, designers, and maintenance contractors for pools and spas to encourage best management practices that minimize copper discharges.
• Outreach conducted on an ongoing basis through BAPPG.
2018 Pretreatment Annual Report 46 February 28, 2019
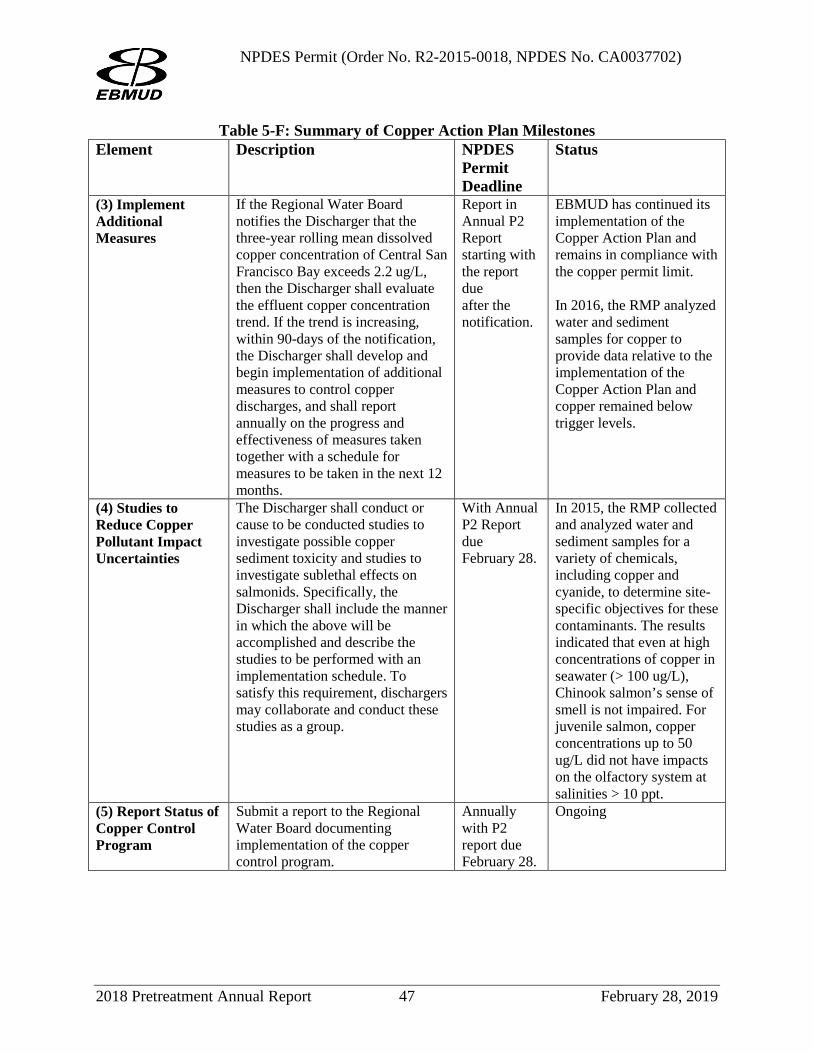
NPDES Permit (Order No. R2-2015-0018, NPDES No. CA0037702)
Table 5-F: Summary of Copper Action Plan Milestones Element Description NPDES
Permit Deadline
Status
(3) Implement Additional Measures
If the Regional Water Board notifies the Discharger that the three-year rolling mean dissolved copper concentration of Central San Francisco Bay exceeds 2.2 ug/L, then the Discharger shall evaluate the effluent copper concentration trend. If the trend is increasing, within 90-days of the notification, the Discharger shall develop and begin implementation of additional measures to control copper discharges, and shall report annually on the progress and effectiveness of measures taken together with a schedule for measures to be taken in the next 12 months.
Report in Annual P2 Report starting with the report due after the notification.
EBMUD has continued its implementation of the Copper Action Plan and remains in compliance with the copper permit limit. In 2016, the RMP analyzed water and sediment samples for copper to provide data relative to the implementation of the Copper Action Plan and copper remained below trigger levels.
(4) Studies to Reduce Copper Pollutant Impact Uncertainties
The Discharger shall conduct or cause to be conducted studies to investigate possible copper sediment toxicity and studies to investigate sublethal effects on salmonids. Specifically, the Discharger shall include the manner in which the above will be accomplished and describe the studies to be performed with an implementation schedule. To satisfy this requirement, dischargers may collaborate and conduct these studies as a group.
With Annual P2 Report due February 28.
In 2015, the RMP collected and analyzed water and sediment samples for a variety of chemicals, including copper and cyanide, to determine site-specific objectives for these contaminants. The results indicated that even at high concentrations of copper in seawater (> 100 ug/L), Chinook salmon’s sense of smell is not impaired. For juvenile salmon, copper concentrations up to 50 ug/L did not have impacts on the olfactory system at salinities > 10 ppt.
(5) Report Status of Copper Control Program
Submit a report to the Regional Water Board documenting implementation of the copper control program.
Annually with P2 report due February 28.
Ongoing
2018 Pretreatment Annual Report 47 February 28, 2019
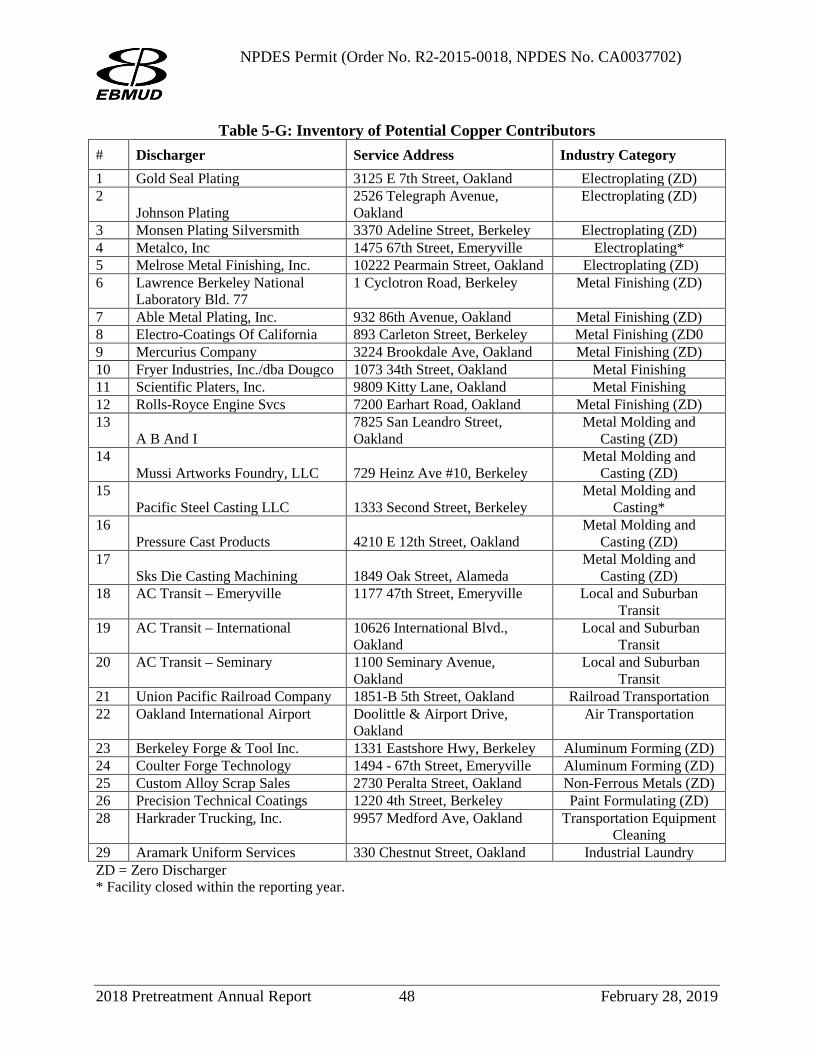
NPDES Permit (Order No. R2-2015-0018, NPDES No. CA0037702)
Table 5-G: Inventory of Potential Copper Contributors # Discharger Service Address Industry Category 1 Gold Seal Plating 3125 E 7th Street, Oakland Electroplating (ZD) 2
Johnson Plating 2526 Telegraph Avenue, Oakland
Electroplating (ZD)
3 Monsen Plating Silversmith 3370 Adeline Street, Berkeley Electroplating (ZD) 4 Metalco, Inc 1475 67th Street, Emeryville Electroplating* 5 Melrose Metal Finishing, Inc. 10222 Pearmain Street, Oakland Electroplating (ZD) 6 Lawrence Berkeley National
Laboratory Bld. 77 1 Cyclotron Road, Berkeley Metal Finishing (ZD)
7 Able Metal Plating, Inc. 932 86th Avenue, Oakland Metal Finishing (ZD) 8 Electro-Coatings Of California 893 Carleton Street, Berkeley Metal Finishing (ZD0 9 Mercurius Company 3224 Brookdale Ave, Oakland Metal Finishing (ZD) 10 Fryer Industries, Inc./dba Dougco 1073 34th Street, Oakland Metal Finishing 11 Scientific Platers, Inc. 9809 Kitty Lane, Oakland Metal Finishing 12 Rolls-Royce Engine Svcs 7200 Earhart Road, Oakland Metal Finishing (ZD) 13
A B And I 7825 San Leandro Street, Oakland
Metal Molding and Casting (ZD)
14 Mussi Artworks Foundry, LLC 729 Heinz Ave #10, Berkeley
Metal Molding and Casting (ZD)
15 Pacific Steel Casting LLC 1333 Second Street, Berkeley
Metal Molding and Casting*
16 Pressure Cast Products 4210 E 12th Street, Oakland
Metal Molding and Casting (ZD)
17 Sks Die Casting Machining 1849 Oak Street, Alameda
Metal Molding and Casting (ZD)
18 AC Transit – Emeryville 1177 47th Street, Emeryville Local and Suburban Transit
19 AC Transit – International 10626 International Blvd., Oakland
Local and Suburban Transit
20 AC Transit – Seminary 1100 Seminary Avenue, Oakland
Local and Suburban Transit
21 Union Pacific Railroad Company 1851-B 5th Street, Oakland Railroad Transportation 22 Oakland International Airport Doolittle & Airport Drive,
Oakland Air Transportation
23 Berkeley Forge & Tool Inc. 1331 Eastshore Hwy, Berkeley Aluminum Forming (ZD) 24 Coulter Forge Technology 1494 - 67th Street, Emeryville Aluminum Forming (ZD) 25 Custom Alloy Scrap Sales 2730 Peralta Street, Oakland Non-Ferrous Metals (ZD) 26 Precision Technical Coatings 1220 4th Street, Berkeley Paint Formulating (ZD) 28 Harkrader Trucking, Inc. 9957 Medford Ave, Oakland Transportation Equipment
Cleaning 29 Aramark Uniform Services 330 Chestnut Street, Oakland Industrial Laundry ZD = Zero Discharger * Facility closed within the reporting year.
2018 Pretreatment Annual Report 48 February 28, 2019
NPDES Permit (Order No. R2-2015-0018, NPDES No. CA0037702)
Cyanide 5.3.5 EBMUD has taken the following measures in response to the regional Cyanide Action Plan, required through Permit No.CA0037702. EBMUD does not have any cyanide contributors because all potential sources either do not use cyanide or are zero dischargers.
Table 5-H: Summary of Cyanide Action Plan Milestones Cyanide Action Plan
Element Description NPDES Permit Deadline
Status
(1) Review Potential Cyanide Contributors
The Discharger shall submit an inventory of potential contributors of cyanide to the wastewater treatment plant (e.g., metal plating operations, hazardous waste recycling, etc.). If no contributors of cyanide are identified, Tasks 2 and 3 are not required, unless the Discharger receives a request to discharge detectable levels of cyanide to the sanitary sewer. If so, the Discharger shall notify the Executive Officer and implement Tasks 2 and 3.
July 1, 2010 Complete
(2) Implement Cyanide Control Program
The Discharger shall submit a plan for, and begin implementation of a program to minimize cyanide discharges to the sanitary sewer system consisting, at a minimum, of the following elements:
February 28, 2010 - 2011 Annual P2 Report.
i. Inspect each potential contributor to assess the need to include that contributing source in the control program.
Complete, see the Inventory of Cyanide Contributors table below.
ii. Inspect contributing sources included in the control program annually.
Not required (no contributors of cyanide)
iii. Develop and distribute educational materials to contributing sources and potential contributing sources regarding the need to prevent cyanide discharges.
Not required (no contributors of cyanide)
iv. Prepare an emergency monitoring and response plan to be implemented if a significant cyanide discharge occurs.
Not required (no contributors of cyanide)
(3) Implement Additional Measures
If the Discharger is notified by the Regional Water Board that ambient monitoring shows cyanide concentrations of 1.0 μg/L or higher in the main body of San Francisco Bay, then within 90 days of the notification, the Discharger shall begin taking actions to identify and abate cyanide sources responsible for the elevated ambient concentrations and report annually on these actions.
Include in Annual P2 Report starting with the report due after notification.
RMP ambient water quality data show that the cyanide concentration trigger was not exceeded, so no further actions are required at this time.
(4) Report Status of Cyanide Control Program
Submit a report to the Regional Water Board documenting implementation of the cyanide control program.
Annually with P2 Reports due February 28.
Ongoing
2018 Pretreatment Annual Report 49 February 28, 2019
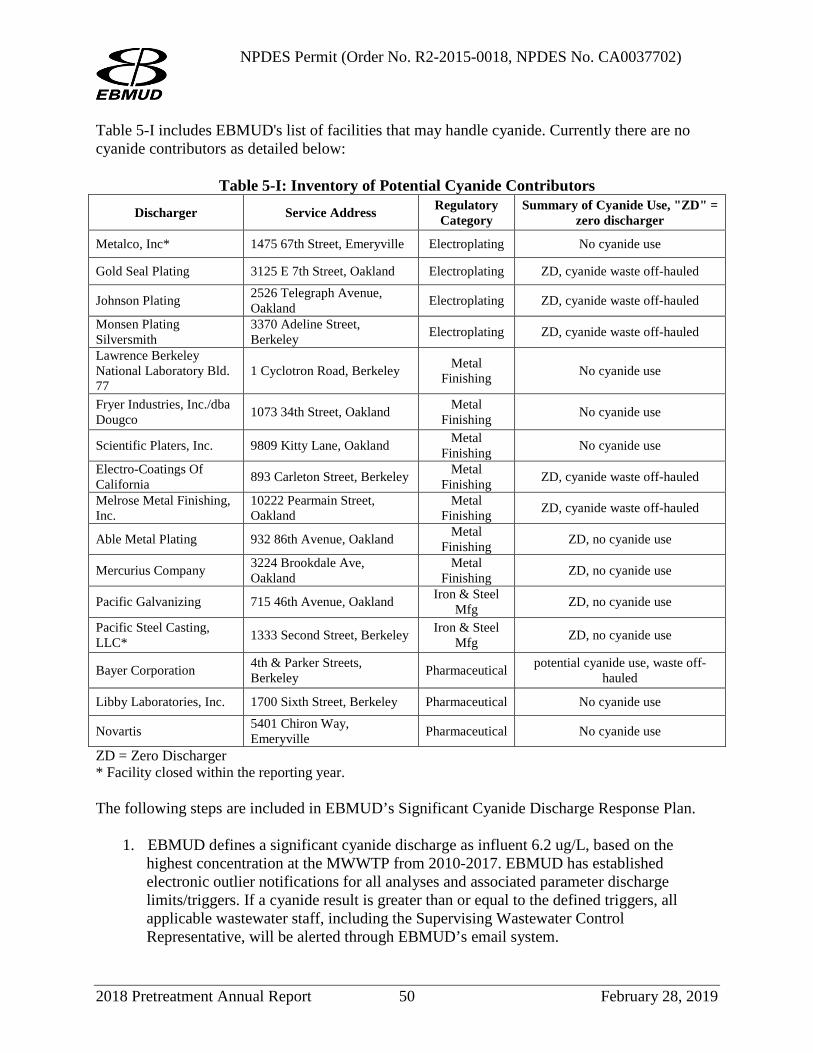
NPDES Permit (Order No. R2-2015-0018, NPDES No. CA0037702) Table 5-I includes EBMUD's list of facilities that may handle cyanide. Currently there are no cyanide contributors as detailed below:
Table 5-I: Inventory of Potential Cyanide Contributors Discharger Service Address Regulatory
Category Summary of Cyanide Use, "ZD" =
zero discharger
Metalco, Inc* 1475 67th Street, Emeryville Electroplating No cyanide use
Gold Seal Plating 3125 E 7th Street, Oakland Electroplating ZD, cyanide waste off-hauled
Johnson Plating 2526 Telegraph Avenue, Oakland Electroplating ZD, cyanide waste off-hauled
Monsen Plating Silversmith
3370 Adeline Street, Berkeley Electroplating ZD, cyanide waste off-hauled
Lawrence Berkeley National Laboratory Bld. 77
1 Cyclotron Road, Berkeley Metal Finishing No cyanide use
Fryer Industries, Inc./dba Dougco 1073 34th Street, Oakland Metal
Finishing No cyanide use
Scientific Platers, Inc. 9809 Kitty Lane, Oakland Metal Finishing No cyanide use
Electro-Coatings Of California 893 Carleton Street, Berkeley Metal
Finishing ZD, cyanide waste off-hauled
Melrose Metal Finishing, Inc.
10222 Pearmain Street, Oakland
Metal Finishing ZD, cyanide waste off-hauled
Able Metal Plating 932 86th Avenue, Oakland Metal Finishing ZD, no cyanide use
Mercurius Company 3224 Brookdale Ave, Oakland
Metal Finishing ZD, no cyanide use
Pacific Galvanizing 715 46th Avenue, Oakland Iron & Steel Mfg ZD, no cyanide use
Pacific Steel Casting, LLC* 1333 Second Street, Berkeley Iron & Steel
Mfg ZD, no cyanide use
Bayer Corporation 4th & Parker Streets, Berkeley Pharmaceutical potential cyanide use, waste off-
hauled
Libby Laboratories, Inc. 1700 Sixth Street, Berkeley Pharmaceutical No cyanide use
Novartis 5401 Chiron Way, Emeryville Pharmaceutical No cyanide use
ZD = Zero Discharger * Facility closed within the reporting year. The following steps are included in EBMUD’s Significant Cyanide Discharge Response Plan.
1. EBMUD defines a significant cyanide discharge as influent 6.2 ug/L, based on the
highest concentration at the MWWTP from 2010-2017. EBMUD has established electronic outlier notifications for all analyses and associated parameter discharge limits/triggers. If a cyanide result is greater than or equal to the defined triggers, all applicable wastewater staff, including the Supervising Wastewater Control Representative, will be alerted through EBMUD’s email system.
2018 Pretreatment Annual Report 50 February 28, 2019
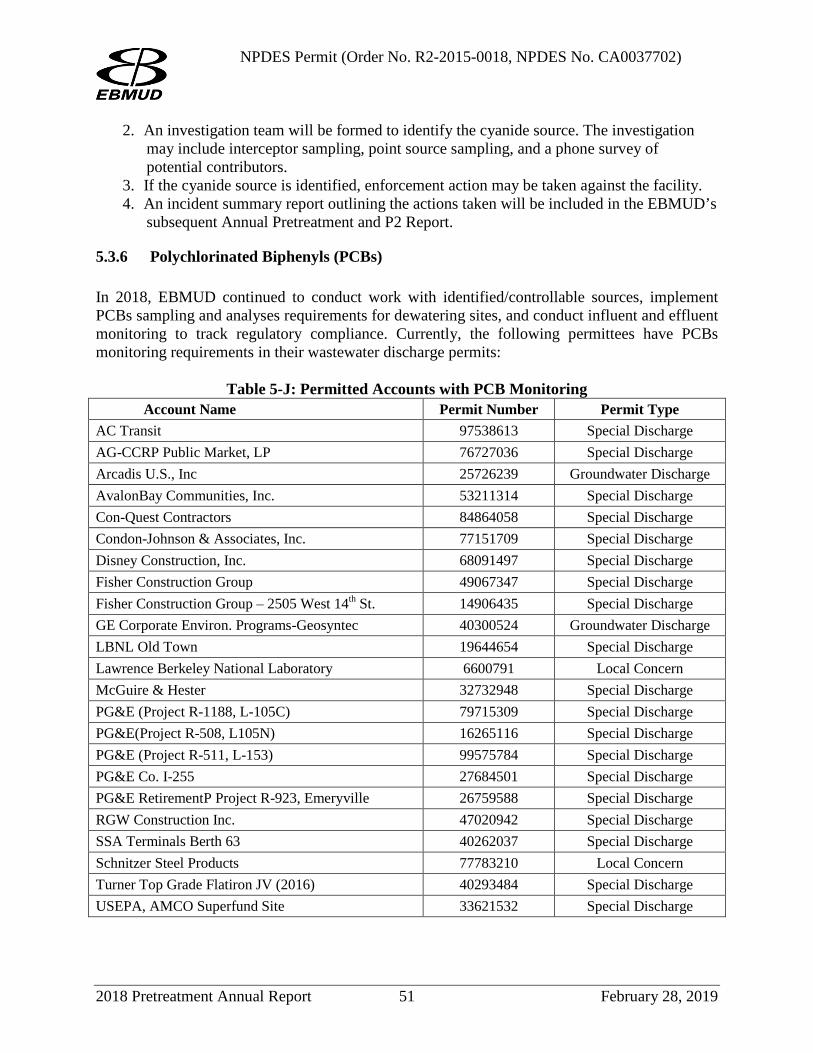
NPDES Permit (Order No. R2-2015-0018, NPDES No. CA0037702)
2. An investigation team will be formed to identify the cyanide source. The investigation may include interceptor sampling, point source sampling, and a phone survey of potential contributors.
3. If the cyanide source is identified, enforcement action may be taken against the facility. 4. An incident summary report outlining the actions taken will be included in the EBMUD’s
subsequent Annual Pretreatment and P2 Report.
Polychlorinated Biphenyls (PCBs) 5.3.6 In 2018, EBMUD continued to conduct work with identified/controllable sources, implement PCBs sampling and analyses requirements for dewatering sites, and conduct influent and effluent monitoring to track regulatory compliance. Currently, the following permittees have PCBs monitoring requirements in their wastewater discharge permits:
Table 5-J: Permitted Accounts with PCB Monitoring Account Name Permit Number Permit Type
AC Transit 97538613 Special Discharge AG-CCRP Public Market, LP 76727036 Special Discharge Arcadis U.S., Inc 25726239 Groundwater Discharge AvalonBay Communities, Inc. 53211314 Special Discharge Con-Quest Contractors 84864058 Special Discharge Condon-Johnson & Associates, Inc. 77151709 Special Discharge Disney Construction, Inc. 68091497 Special Discharge Fisher Construction Group 49067347 Special Discharge Fisher Construction Group – 2505 West 14th St. 14906435 Special Discharge GE Corporate Environ. Programs-Geosyntec 40300524 Groundwater Discharge LBNL Old Town 19644654 Special Discharge Lawrence Berkeley National Laboratory 6600791 Local Concern McGuire & Hester 32732948 Special Discharge PG&E (Project R-1188, L-105C) 79715309 Special Discharge PG&E(Project R-508, L105N) 16265116 Special Discharge PG&E (Project R-511, L-153) 99575784 Special Discharge PG&E Co. I-255 27684501 Special Discharge PG&E RetirementP Project R-923, Emeryville 26759588 Special Discharge RGW Construction Inc. 47020942 Special Discharge SSA Terminals Berth 63 40262037 Special Discharge Schnitzer Steel Products 77783210 Local Concern Turner Top Grade Flatiron JV (2016) 40293484 Special Discharge USEPA, AMCO Superfund Site 33621532 Special Discharge
2018 Pretreatment Annual Report 51 February 28, 2019
NPDES Permit (Order No. R2-2015-0018, NPDES No. CA0037702)
Pharmaceutical Disposal 5.3.7 EBMUD sponsors ten pharmaceutical collection sites within our wastewater service area. In October 2017, U.C. Berkeley Tang Center Pharmacy became a DEA-registered site for accepting controlled substances. The Pharmaceutical Take-back Program has collected over 29,276 pounds of expired/unwanted pharmaceuticals since the program’s inception in 2009. In 2017, EBMUD collected over 4,560 pounds of unwanted/expired medication. EBMUD also continued to support the Product Stewardship Institute in their efforts to move Congressional legislation forward to reduce barriers for establishing pharmaceutical collection programs. EBMUD continued to support the Alameda County Safe Medicine Disposal Ordinance through membership in the Alameda County MEDS Coalition. Pharmaceuticals – EBMUD staff continues to collaborate with the Product Stewardship Institute on pharmaceutical disposal and provided support for the San Francisco pharmaceutical product stewardship ordinance.
Pesticides 5.3.8As a member of BAPPG, EBMUD continues to participate in ongoing regulatory tracking and communications related to pesticide sources in wastewater influent at the federal and state level. Activities included:
• Supported the preparation of comment letters to EPA regarding pyrethroids, imidacloprid, indoxacarb, swimming pool chemicals, diquat dibromide, dichlobenil and EPA Pesticides regulatory reform work.
• Supported the technical work provided to NACWA and Regional Water Quality Control Board on several items which included continued mitigation to lessen environmental impact and to bring consumer awareness to product effects.
EBMUD supports the Our Water, Our World (OWOW) program through BAPPG. The program’s website offers alternatives to manage residential/garden pests, while protecting the environment. In addition, BAPPG/OWOW conducted various outreach activities including working with pesticide manufacturers to set up eco-friendly displays of less-toxic pesticide in Home Depot, Orchard Supply Hardware (OSH), and Ace Hardware National. EBMUD continues to sell its award-winning Plants and Landscapes for Summer Dry Climates book. EBMUD distributes “Grow It!” guides by request/at public events, which provide information on less-toxic pesticide alternatives. The booklet is also available for access on the EBMUD Clean Bay website. EBMUD continues to contract with certified pest control companies for its facilities and uses only non-restricted pesticides in its watershed in accordance with EBMUD’s Sustainability Policy (Policy 7.05).
2018 Pretreatment Annual Report 52 February 28, 2019
NPDES Permit (Order No. R2-2015-0018, NPDES No. CA0037702) 5.4 San Francisco Bay Stewardship As one of the largest wastewater dischargers into the San Francisco Bay, EBMUD is committed to water quality and environmental protection on numerous fronts, including:
• Nutrient management – actively participating in the NACWA Award Winning regional collaborative efforts to ensure that future nutrient discharge limits will be based on sound science. Among other strategies, EBMUD is investigating a watershed-based nutrient trading program for the Bay, compared to a “command-and-control” approach;
• Microplastics – ongoing collaboration with research partners to fill essential data gaps, determine the scope of the problem and role of fibers, and pursue education, communication and policy partnership opportunities; and
• Private sewer laterals – continuing progress in issuing compliance certificates (4,725 in FY18), with a compliance rate of 94 percent.
• Green Business – • EBMUD’s Purchasing Division implemented its “Sustainable Best
Practices Guide for Projects, Procedures, and Procurements” to help meet the Green Business criterion of having a sustainability purchasing policy.
• EBMUD’s Environmental Compliance office is pursuing a Green Business Certification for a number of EBMUD facilities.
EBMUD has summarized these activities and many others in its annual Sustainability Report. The EBMUD Sustainability Report for Financial Year 2018 is available on the EBMUD website (www.ebmud.com).
5.5 Outreach to EBMUD Employees In 2018, EBMUD continued employee outreach to reduce the pollutants to the environment, as outlined below.
Employee Events & Activities 5.5.1
• EBMUD Earth Day Event for EBMUD Personnel – The 18th Annual Earth Day Event was held on April 18, 2018. This well-attended event included exhibitors from various EBMUD workgroups and local agencies, environmental organizations and green vendors with the purpose of educating employees and visitors about sustainable practices and assisting them in expanding their Reduction, Recycling, Reuse, and Reclamation efforts. E-waste, reading glasses, clothing, and squeeze balls (for cerebral palsy patients) were collected for proper disposal, recycling and/or re-use.
2018 Pretreatment Annual Report 53 February 28, 2019
NPDES Permit (Order No. R2-2015-0018, NPDES No. CA0037702)
• Ice Cream Social – On May 30th EBMUD wastewater department held an ice cream social which included carnival games highlighting various pollution prevention topics. See Exhibit F:
• Coastal Cleanup Day – On Saturday, September 15th EBMUD employees with their friends and family participated in the 2018 Coastal Cleanup Day. EBMUD joined East Bay Regional Park District staff and volunteers to pick up litter and recyclables from the Martin Luther King Jr. Regional Shoreline Park.
• Sustainability and Recycling – EBMUD Facilities is in the process of replacing fluorescent bulbs with energy efficient LED lights in the downtown Oakland administrative building. EBMUD continues to improve energy efficiency in our water and wastewater operations by evaluating new work methods and materials to reduce impacts to the environment and the communities we work in.
• E-Waste – EBMUD has an ongoing collection program for employee e-waste and spent batteries as part of its established Universal Waste Program.
• Green Business – EBMUD’s Fleet Maintenance Center, North Area Service Center, and Construction and Maintenance Services (CMS) are certified Green Businesses. Green Business requirements were included with the EBMUD Water Treatment Plant Infrastructure Renewal Plan. EBMUD’s janitorial staff received training on Green Business certification criteria for green cleaning products and on the health and safety advantages. EBMUD staff is pursuing Green Business certifications for other EBMUD facilities.
Employee Electronic Communications 5.5.2
EBMUD Industrial Discharge Section staff maintains a P2 website for employees that: • Includes information on Household Hazardous Waste Facilities; links to the
residential P2 webpage on Bay-friendly car washing and household cleaning; and includes information on the proper disposal of residential FOG, household mercury-containing devices, and unwanted/expired medicine;
• Encourages use of the public EBMUD website for industrial, commercial, and residential pretreatment and P2 information; and
• Reports on the EBMUD’s efforts to minimize waste and conserve energy/natural resources.
The Sustainability Committee continued employee communication by publishing four articles on sustainability in EBMUD’s employee and retiree newsletter, Splashes, a number of articles in the Regulatory Compliance Office (RCO) Newsletter, and coordinated four sustainability related presentations at the EBMUD’s Engineers Forum which reached more than 2,000 employees and retirees. Articles included:
• Ongoing information regarding the composting and recycling programs • Bike to Work activities • 2018 Earth Day Fair and activities • Bring your own Plate and Cutlery to EBMUD Events
2018 Pretreatment Annual Report 54 February 28, 2019
NPDES Permit (Order No. R2-2015-0018, NPDES No. CA0037702)
5.6 Public Outreach Programs EBMUD’s outreach efforts to industrial/commercial facilities, government agencies, non-governmental organizations, schools, and residential communities are detailed below and summarized in the following tables.
Outreach to Industrial/Commercial Facilities and Government Agencies 5.6.1 EBMUD provides relevant outreach material to its permitted industrial and commercial facilities. In addition, EBMUD provides P2 information to other business categories to educate on specific pollutants of concern. Questions from non-permitted facilities regarding the handling of various wastes are frequently received through the Wastewater Environmental Services Division Hotline (details are provided in Section 5.7.4). EBMUD provides interagency coordination of Pretreatment and P2 activities, including:
• Interagency referrals (i.e. the California Department of Toxic Substances Control; stormwater agencies) regarding Pretreatment or P2 issues at facilities within EBMUD’s wastewater service area
• Active participation in the California Water Environment Association (CWEA) Pretreatment, P2, and Stormwater Committees to focus on Pretreatment and P2 education and training
• Active participation in the BAPPG
Outreach to Non-governmental Organizations (NGOs) and Government Agencies 5.6.2 EBMUD continued its partnerships with NGOs and government agencies, including the following activities:
• Continued partnership with BayKeeper to address residential FOG • Collaborated with the Product Stewardship Institute on reducing federal barriers to
pharmaceutical disposal • Engaged various NGOs to participate in annual Employee Earth Day event • Contributed funding to support San Francisco Estuary Institute (SFEI)’s study of
microplastics in the Bay • Partnered with BayKeeper, Save the Bay, SFEI, California Coastal Commission, City
of Oakland, and San Francisco Bay Regional Water Quality Control Board, along with local creek and watershed groups, on East Bay Express editorial
2018 Pretreatment Annual Report 55 February 28, 2019
NPDES Permit (Order No. R2-2015-0018, NPDES No. CA0037702)
MWWTP Tours Program 5.6.3 In 2018, EBMUD launched its Wastewater Treatment Plant tour program for local schools and the public. The program offers tours to convey key messages about wastewater treatment, pollution prevention, and renewable resources. Public tours are offered on the first and third Saturday of the month, and school tours occur on the first Wednesday and last Thursday of the month. Over 250 middle and high school students and close to 186 local residents have attended the tour. Other professional groups and interested parties add to the total of over 961 wastewater treatment plant visitors in 2018.
Outreach to Schools 5.6.4 EBMUD provides teachers with P2 curricula upon request and actively seeks opportunities to enhance student learning and engagement in understanding how various programs within EBMUD play a vital role in pollution prevention and environmental sustainability. EBMUD offers tours of the wastewater treatment plant to school field trips as described above.
Outreach to Residential Community 5.6.5 EBMUD provides ongoing outreach to residents through its website and hotline number. The hotline number is referenced on the website and included in all outreach materials. It serves as a means for contacting EBMUD staff directly to ask general questions or request informational material such as brochures, grease scrapers, and “how-to” guides to help with their P2 needs. EBMUD also communicates P2 information through its Pipeline publication bill insert and the East Bay Express insert published in September 2018. See Exhibit B and Exhibit C. P2 materials are mailed to customers upon request. See Table 5-K: Community Events and Festivals in 2018Table 5-K through Table 5-O for detailed information related to community outreach events and activities that EBMUD participated in during the year and the type of P2 information disseminated to various stakeholders and community members.
2018 Pretreatment Annual Report 56 February 28, 2019
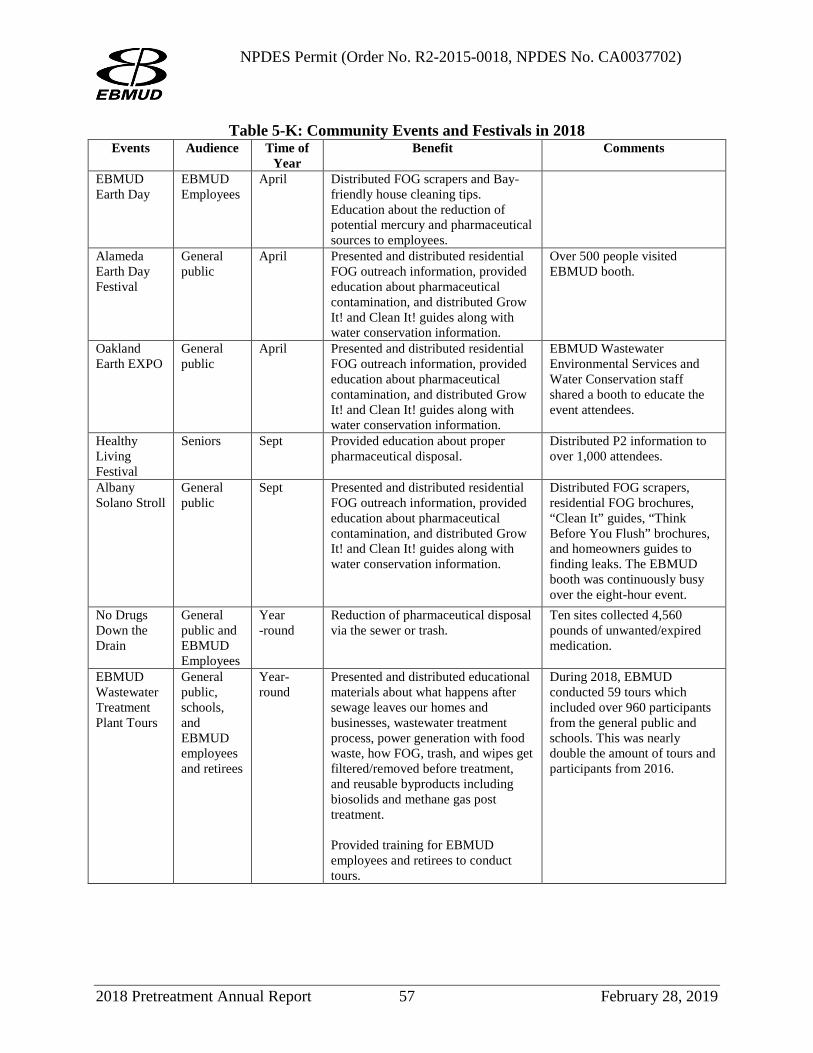
NPDES Permit (Order No. R2-2015-0018, NPDES No. CA0037702)
Table 5-K: Community Events and Festivals in 2018 Events Audience Time of
Year Benefit Comments
EBMUD Earth Day
EBMUD Employees
April Distributed FOG scrapers and Bay-friendly house cleaning tips. Education about the reduction of potential mercury and pharmaceutical sources to employees.
Alameda Earth Day Festival
General public
April Presented and distributed residential FOG outreach information, provided education about pharmaceutical contamination, and distributed Grow It! and Clean It! guides along with water conservation information.
Over 500 people visited EBMUD booth.
Oakland Earth EXPO
General public
April Presented and distributed residential FOG outreach information, provided education about pharmaceutical contamination, and distributed Grow It! and Clean It! guides along with water conservation information.
EBMUD Wastewater Environmental Services and Water Conservation staff shared a booth to educate the event attendees.
Healthy Living Festival
Seniors Sept Provided education about proper pharmaceutical disposal.
Distributed P2 information to over 1,000 attendees.
Albany Solano Stroll
General public
Sept Presented and distributed residential FOG outreach information, provided education about pharmaceutical contamination, and distributed Grow It! and Clean It! guides along with water conservation information.
Distributed FOG scrapers, residential FOG brochures, “Clean It” guides, “Think Before You Flush” brochures, and homeowners guides to finding leaks. The EBMUD booth was continuously busy over the eight-hour event.
No Drugs Down the Drain
General public and EBMUD Employees
Year -round
Reduction of pharmaceutical disposal via the sewer or trash.
Ten sites collected 4,560 pounds of unwanted/expired medication.
EBMUD Wastewater Treatment Plant Tours
General public, schools, and EBMUD employees and retirees
Year-round
Presented and distributed educational materials about what happens after sewage leaves our homes and businesses, wastewater treatment process, power generation with food waste, how FOG, trash, and wipes get filtered/removed before treatment, and reusable byproducts including biosolids and methane gas post treatment. Provided training for EBMUD employees and retirees to conduct tours.
During 2018, EBMUD conducted 59 tours which included over 960 participants from the general public and schools. This was nearly double the amount of tours and participants from 2016.
2018 Pretreatment Annual Report 57 February 28, 2019
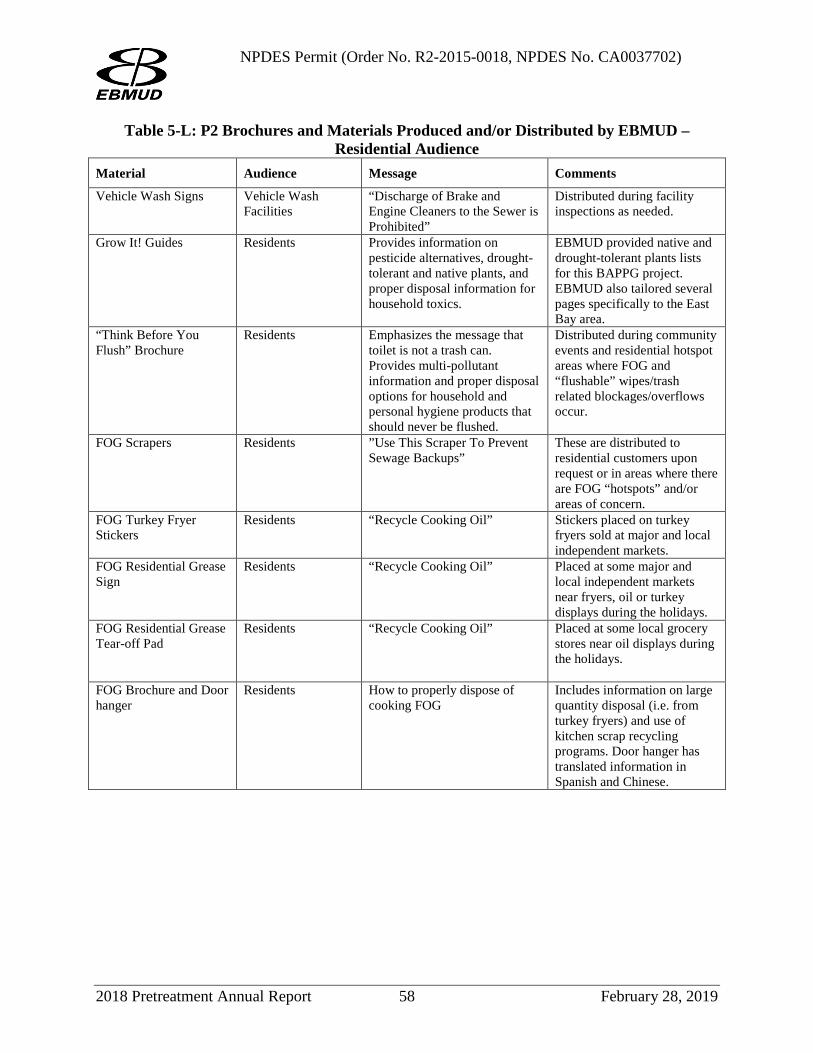
NPDES Permit (Order No. R2-2015-0018, NPDES No. CA0037702)
Table 5-L: P2 Brochures and Materials Produced and/or Distributed by EBMUD – Residential Audience
Material Audience Message Comments
Vehicle Wash Signs Vehicle Wash Facilities
“Discharge of Brake and Engine Cleaners to the Sewer is Prohibited”
Distributed during facility inspections as needed.
Grow It! Guides Residents Provides information on pesticide alternatives, drought-tolerant and native plants, and proper disposal information for household toxics.
EBMUD provided native and drought-tolerant plants lists for this BAPPG project. EBMUD also tailored several pages specifically to the East Bay area.
“Think Before You Flush” Brochure
Residents Emphasizes the message that toilet is not a trash can. Provides multi-pollutant information and proper disposal options for household and personal hygiene products that should never be flushed.
Distributed during community events and residential hotspot areas where FOG and “flushable” wipes/trash related blockages/overflows occur.
FOG Scrapers Residents ”Use This Scraper To Prevent Sewage Backups”
These are distributed to residential customers upon request or in areas where there are FOG “hotspots” and/or areas of concern.
FOG Turkey Fryer Stickers
Residents “Recycle Cooking Oil” Stickers placed on turkey fryers sold at major and local independent markets.
FOG Residential Grease Sign
Residents “Recycle Cooking Oil” Placed at some major and local independent markets near fryers, oil or turkey displays during the holidays.
FOG Residential Grease Tear-off Pad
Residents “Recycle Cooking Oil” Placed at some local grocery stores near oil displays during the holidays.
FOG Brochure and Door hanger
Residents How to properly dispose of cooking FOG
Includes information on large quantity disposal (i.e. from turkey fryers) and use of kitchen scrap recycling programs. Door hanger has translated information in Spanish and Chinese.
2018 Pretreatment Annual Report 58 February 28, 2019
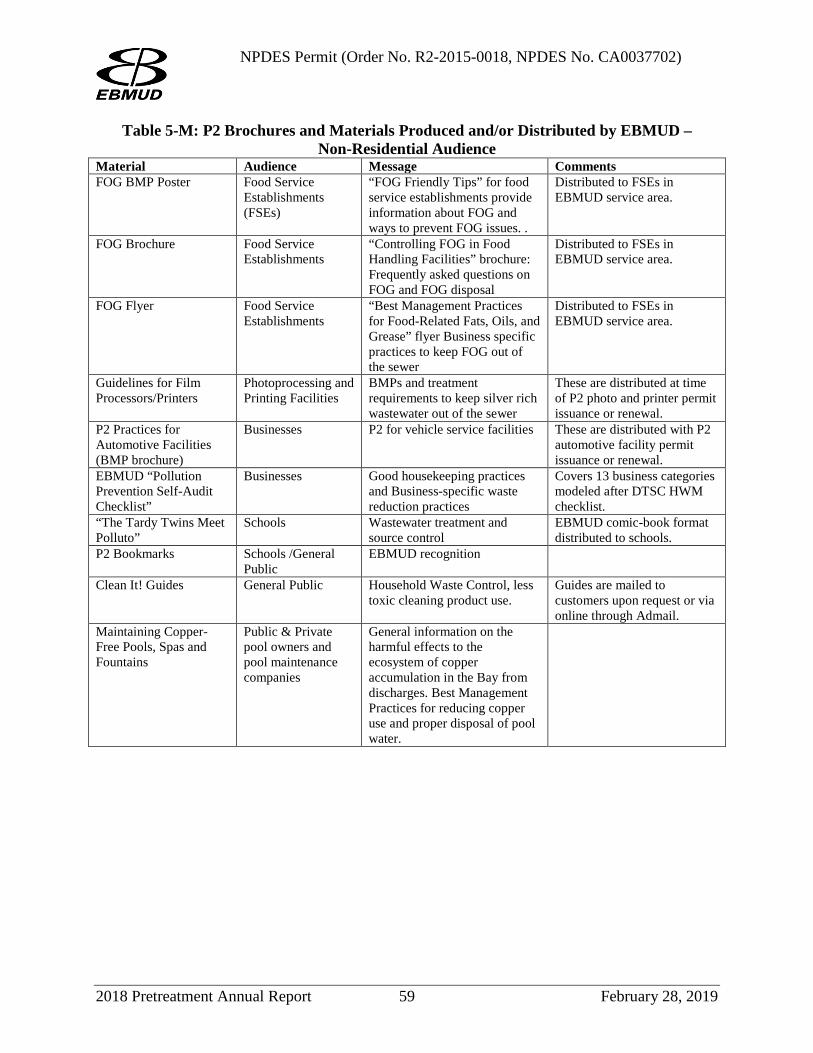
NPDES Permit (Order No. R2-2015-0018, NPDES No. CA0037702)
Table 5-M: P2 Brochures and Materials Produced and/or Distributed by EBMUD – Non-Residential Audience
Material Audience Message Comments FOG BMP Poster Food Service
Establishments (FSEs)
“FOG Friendly Tips” for food service establishments provide information about FOG and ways to prevent FOG issues. .
Distributed to FSEs in EBMUD service area.
FOG Brochure Food Service Establishments
“Controlling FOG in Food Handling Facilities” brochure: Frequently asked questions on FOG and FOG disposal
Distributed to FSEs in EBMUD service area.
FOG Flyer Food Service Establishments
“Best Management Practices for Food-Related Fats, Oils, and Grease” flyer Business specific practices to keep FOG out of the sewer
Distributed to FSEs in EBMUD service area.
Guidelines for Film Processors/Printers
Photoprocessing and Printing Facilities
BMPs and treatment requirements to keep silver rich wastewater out of the sewer
These are distributed at time of P2 photo and printer permit issuance or renewal.
P2 Practices for Automotive Facilities (BMP brochure)
Businesses P2 for vehicle service facilities These are distributed with P2 automotive facility permit issuance or renewal.
EBMUD “Pollution Prevention Self-Audit Checklist”
Businesses Good housekeeping practices and Business-specific waste reduction practices
Covers 13 business categories modeled after DTSC HWM checklist.
“The Tardy Twins Meet Polluto”
Schools Wastewater treatment and source control
EBMUD comic-book format distributed to schools.
P2 Bookmarks Schools /General Public
EBMUD recognition
Clean It! Guides General Public Household Waste Control, less toxic cleaning product use.
Guides are mailed to customers upon request or via online through Admail.
Maintaining Copper-Free Pools, Spas and Fountains
Public & Private pool owners and pool maintenance companies
General information on the harmful effects to the ecosystem of copper accumulation in the Bay from discharges. Best Management Practices for reducing copper use and proper disposal of pool water.
2018 Pretreatment Annual Report 59 February 28, 2019
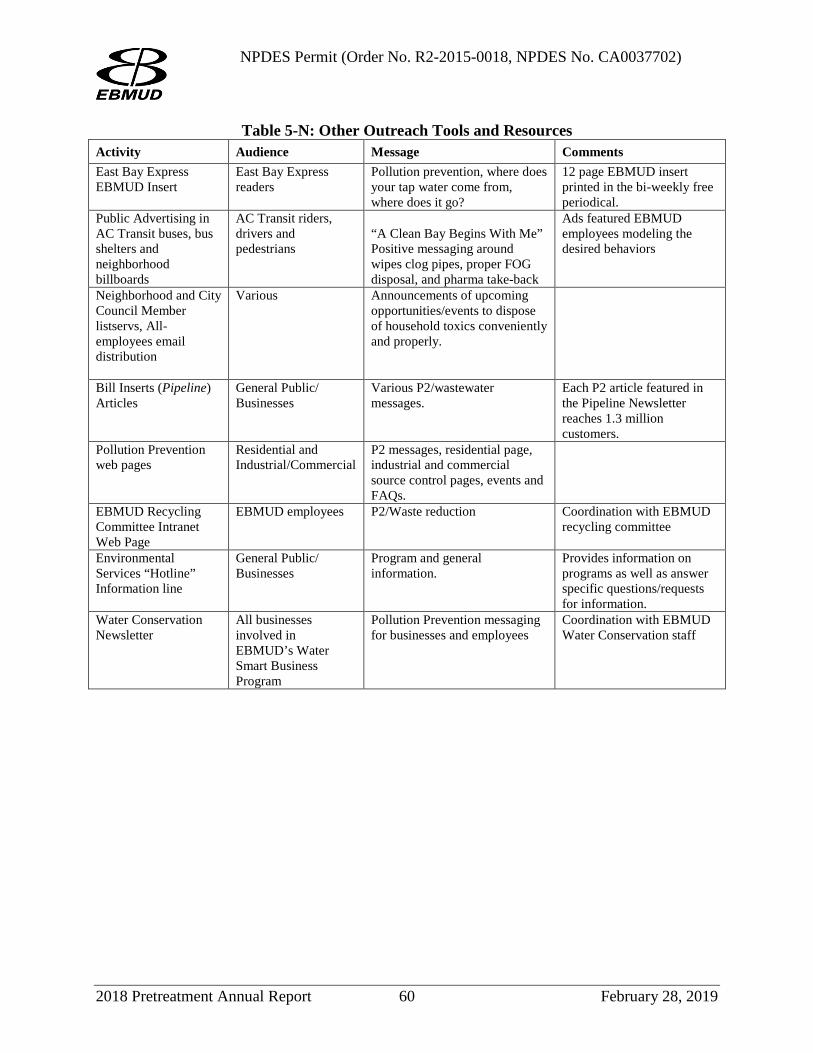
NPDES Permit (Order No. R2-2015-0018, NPDES No. CA0037702)
Table 5-N: Other Outreach Tools and Resources Activity Audience Message Comments East Bay Express EBMUD Insert
East Bay Express readers
Pollution prevention, where does your tap water come from, where does it go?
12 page EBMUD insert printed in the bi-weekly free periodical.
Public Advertising in AC Transit buses, bus shelters and neighborhood billboards
AC Transit riders, drivers and pedestrians
“A Clean Bay Begins With Me” Positive messaging around wipes clog pipes, proper FOG disposal, and pharma take-back
Ads featured EBMUD employees modeling the desired behaviors
Neighborhood and City Council Member listservs, All-employees email distribution
Various Announcements of upcoming opportunities/events to dispose of household toxics conveniently and properly.
Bill Inserts (Pipeline) Articles
General Public/ Businesses
Various P2/wastewater messages.
Each P2 article featured in the Pipeline Newsletter reaches 1.3 million customers.
Pollution Prevention web pages
Residential and Industrial/Commercial
P2 messages, residential page, industrial and commercial source control pages, events and FAQs.
EBMUD Recycling Committee Intranet Web Page
EBMUD employees P2/Waste reduction Coordination with EBMUD recycling committee
Environmental Services “Hotline” Information line
General Public/ Businesses
Program and general information.
Provides information on programs as well as answer specific questions/requests for information.
Water Conservation Newsletter
All businesses involved in EBMUD’s Water Smart Business Program
Pollution Prevention messaging for businesses and employees
Coordination with EBMUD Water Conservation staff
2018 Pretreatment Annual Report 60 February 28, 2019
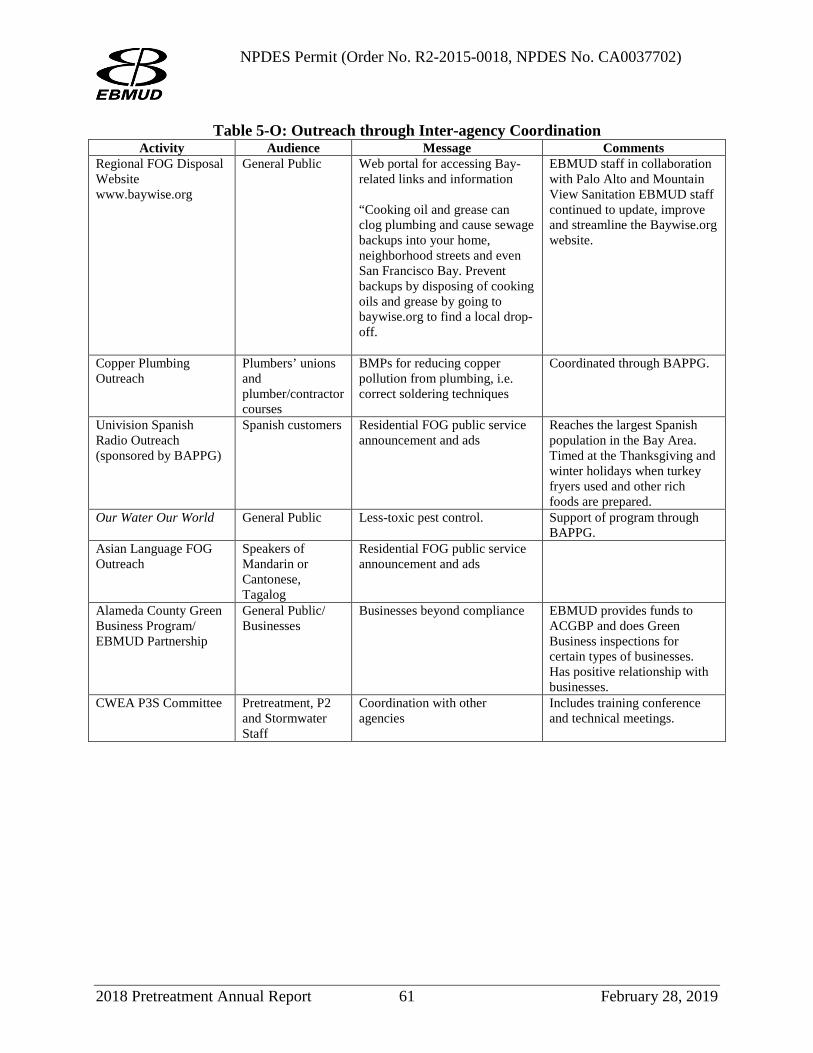
NPDES Permit (Order No. R2-2015-0018, NPDES No. CA0037702)
Table 5-O: Outreach through Inter-agency Coordination Activity Audience Message Comments
Regional FOG Disposal Website www.baywise.org
General Public
Web portal for accessing Bay-related links and information “Cooking oil and grease can clog plumbing and cause sewage backups into your home, neighborhood streets and even San Francisco Bay. Prevent backups by disposing of cooking oils and grease by going to baywise.org to find a local drop-off.
EBMUD staff in collaboration with Palo Alto and Mountain View Sanitation EBMUD staff continued to update, improve and streamline the Baywise.org website.
Copper Plumbing Outreach
Plumbers’ unions and plumber/contractor courses
BMPs for reducing copper pollution from plumbing, i.e. correct soldering techniques
Coordinated through BAPPG.
Univision Spanish Radio Outreach (sponsored by BAPPG)
Spanish customers Residential FOG public service announcement and ads
Reaches the largest Spanish population in the Bay Area. Timed at the Thanksgiving and winter holidays when turkey fryers used and other rich foods are prepared.
Our Water Our World General Public Less-toxic pest control. Support of program through BAPPG.
Asian Language FOG Outreach
Speakers of Mandarin or Cantonese, Tagalog
Residential FOG public service announcement and ads
Alameda County Green Business Program/ EBMUD Partnership
General Public/ Businesses
Businesses beyond compliance EBMUD provides funds to ACGBP and does Green Business inspections for certain types of businesses. Has positive relationship with businesses.
CWEA P3S Committee Pretreatment, P2 and Stormwater Staff
Coordination with other agencies
Includes training conference and technical meetings.
2018 Pretreatment Annual Report 61 February 28, 2019
NPDES Permit (Order No. R2-2015-0018, NPDES No. CA0037702) 5.7 Criteria used to Measure the Programs’ and Tasks’ Effectiveness EBMUD uses the following criteria to measure the effectiveness of its established P2 Program:
• Changes in pollutant concentration levels in the EBMUD’s MWWTP influent (See Figures 5-A through 5-L at the end of this section.)
• Number of gallons of residential cooking oil collected (See Section 5.4.3.2 Effectiveness Measures and Progress for FOG Programs above.)
• Number of pounds of unwanted/expired pharmaceuticals collected (See Section 5.4.7 Pharmaceutical Disposal above.)
2018 Pretreatment Annual Report 62 February 28, 2019
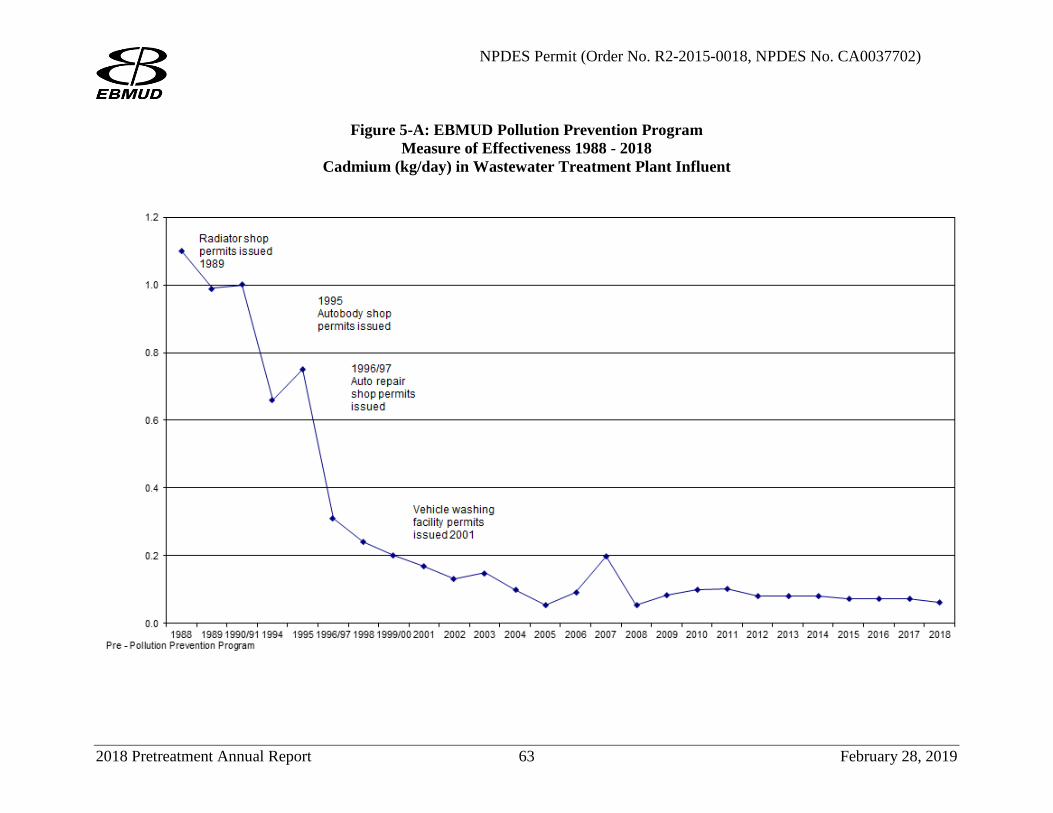
NPDES Permit (Order No. R2-2015-0018, NPDES No. CA0037702)
Figure 5-A: EBMUD Pollution Prevention Program
Measure of Effectiveness 1988 - 2018 Cadmium (kg/day) in Wastewater Treatment Plant Influent
2018 Pretreatment Annual Report 63 February 28, 2019
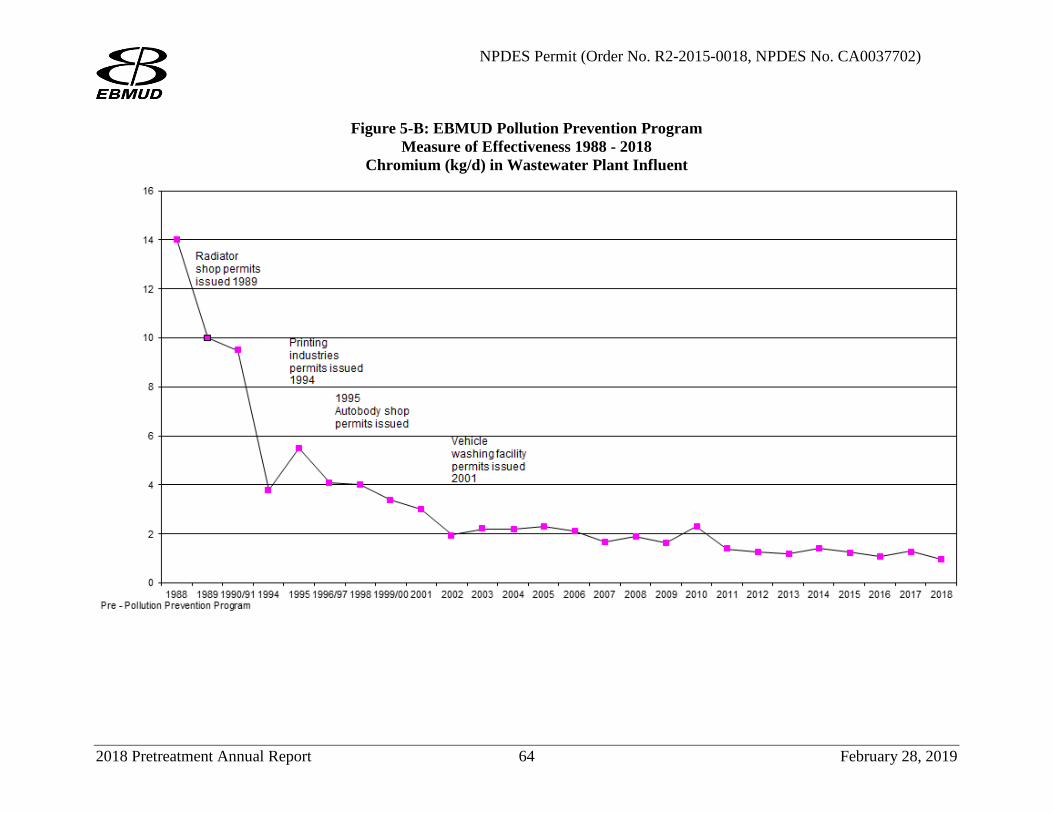
NPDES Permit (Order No. R2-2015-0018, NPDES No. CA0037702)
Figure 5-B: EBMUD Pollution Prevention Program Measure of Effectiveness 1988 - 2018
Chromium (kg/d) in Wastewater Plant Influent
2018 Pretreatment Annual Report 64 February 28, 2019
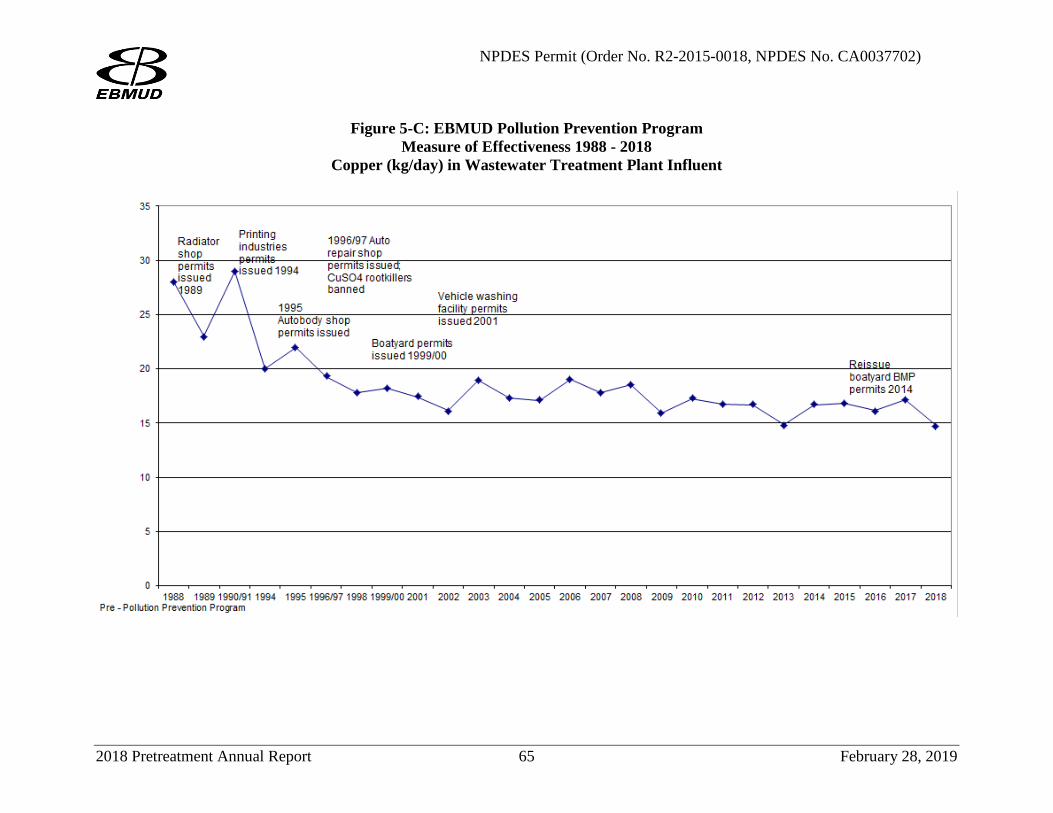
NPDES Permit (Order No. R2-2015-0018, NPDES No. CA0037702)
Figure 5-C: EBMUD Pollution Prevention Program Measure of Effectiveness 1988 - 2018
Copper (kg/day) in Wastewater Treatment Plant Influent
2018 Pretreatment Annual Report 65 February 28, 2019
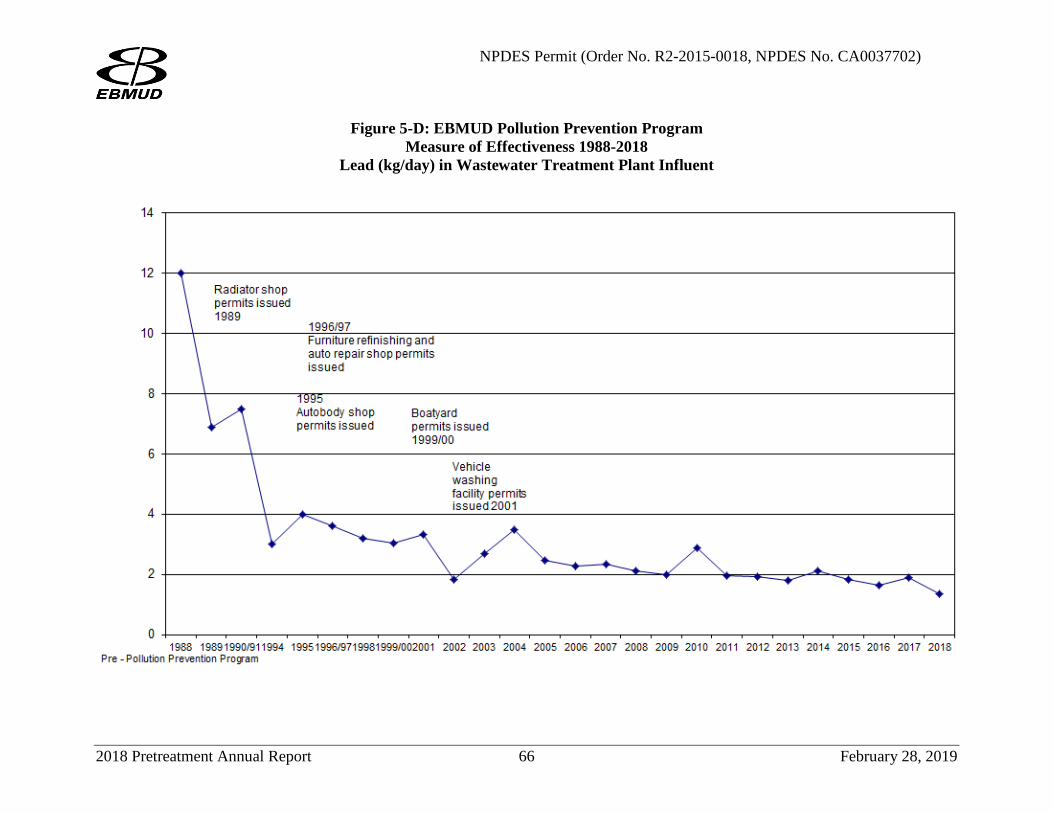
NPDES Permit (Order No. R2-2015-0018, NPDES No. CA0037702)
Figure 5-D: EBMUD Pollution Prevention Program Measure of Effectiveness 1988-2018
Lead (kg/day) in Wastewater Treatment Plant Influent
2018 Pretreatment Annual Report 66 February 28, 2019
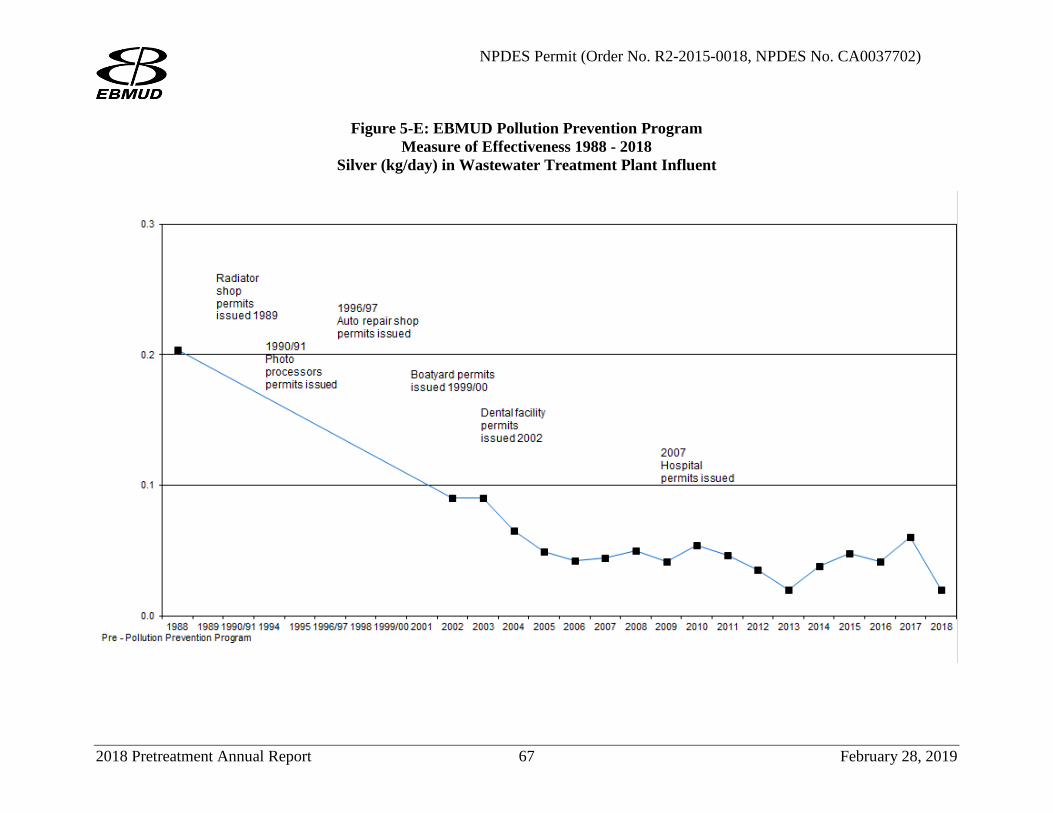
NPDES Permit (Order No. R2-2015-0018, NPDES No. CA0037702)
Figure 5-E: EBMUD Pollution Prevention Program Measure of Effectiveness 1988 - 2018
Silver (kg/day) in Wastewater Treatment Plant Influent
2018 Pretreatment Annual Report 67 February 28, 2019
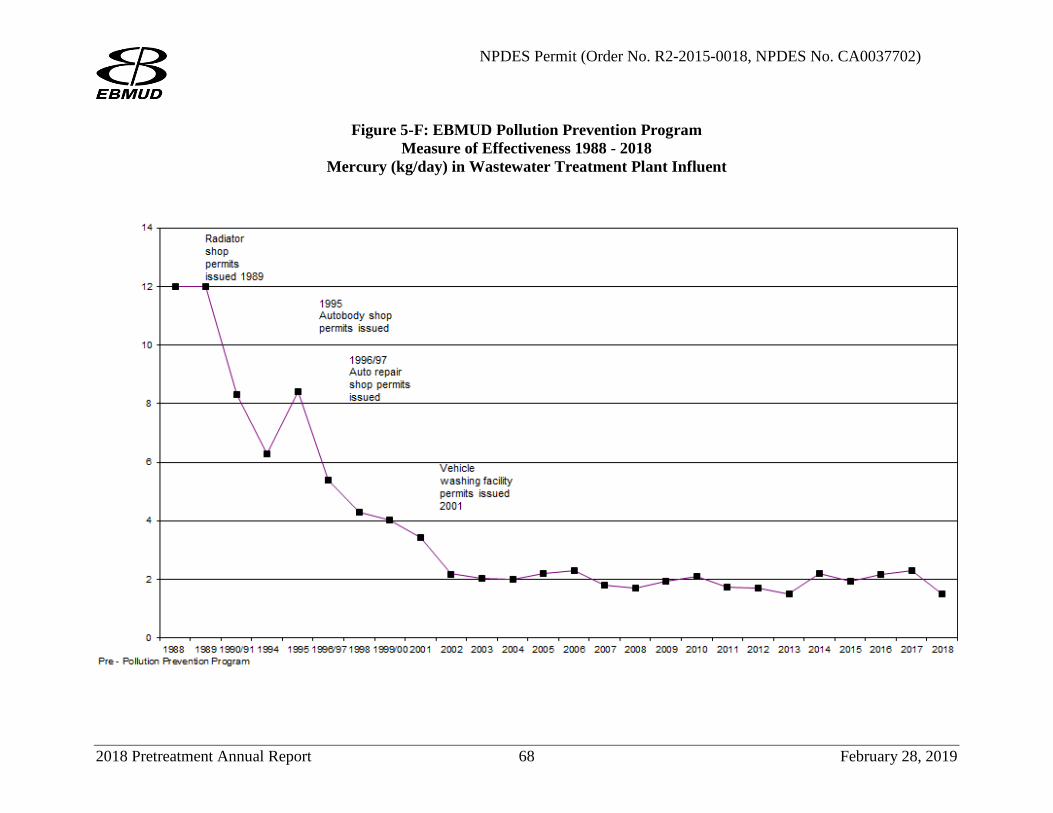
NPDES Permit (Order No. R2-2015-0018, NPDES No. CA0037702)
Figure 5-F: EBMUD Pollution Prevention Program
Measure of Effectiveness 1988 - 2018 Mercury (kg/day) in Wastewater Treatment Plant Influent
2018 Pretreatment Annual Report 68 February 28, 2019
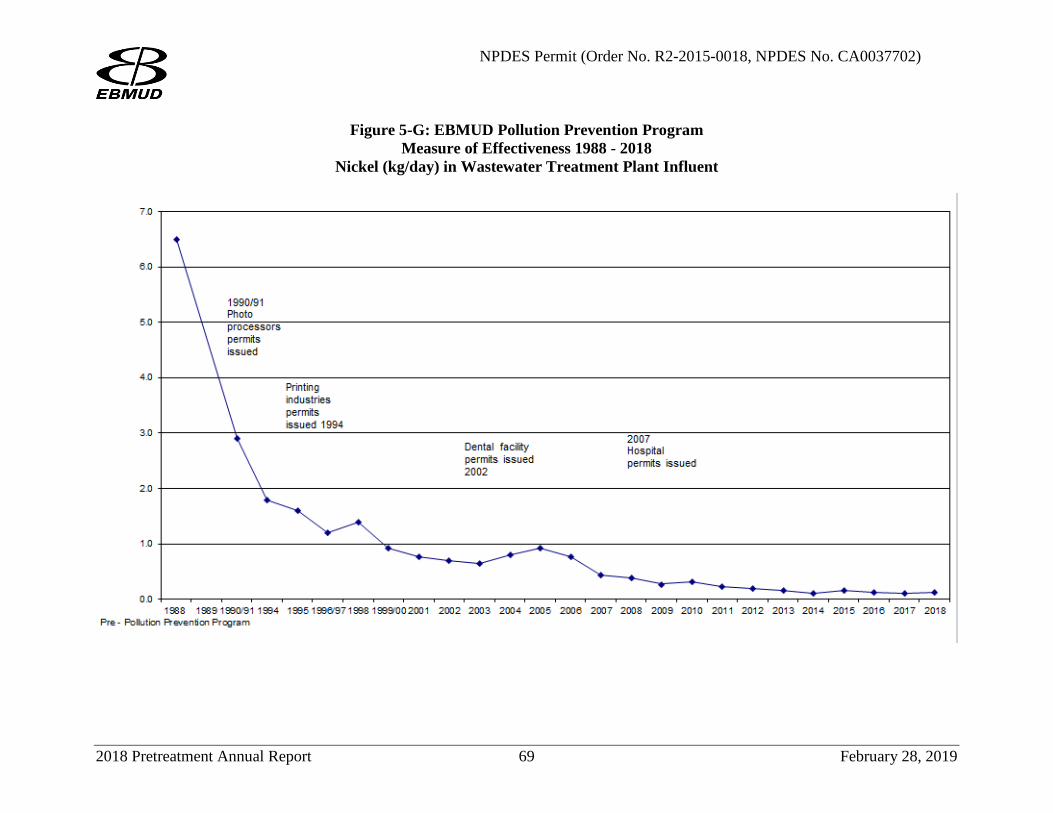
NPDES Permit (Order No. R2-2015-0018, NPDES No. CA0037702)
Figure 5-G: EBMUD Pollution Prevention Program
Measure of Effectiveness 1988 - 2018 Nickel (kg/day) in Wastewater Treatment Plant Influent
2018 Pretreatment Annual Report 69 February 28, 2019
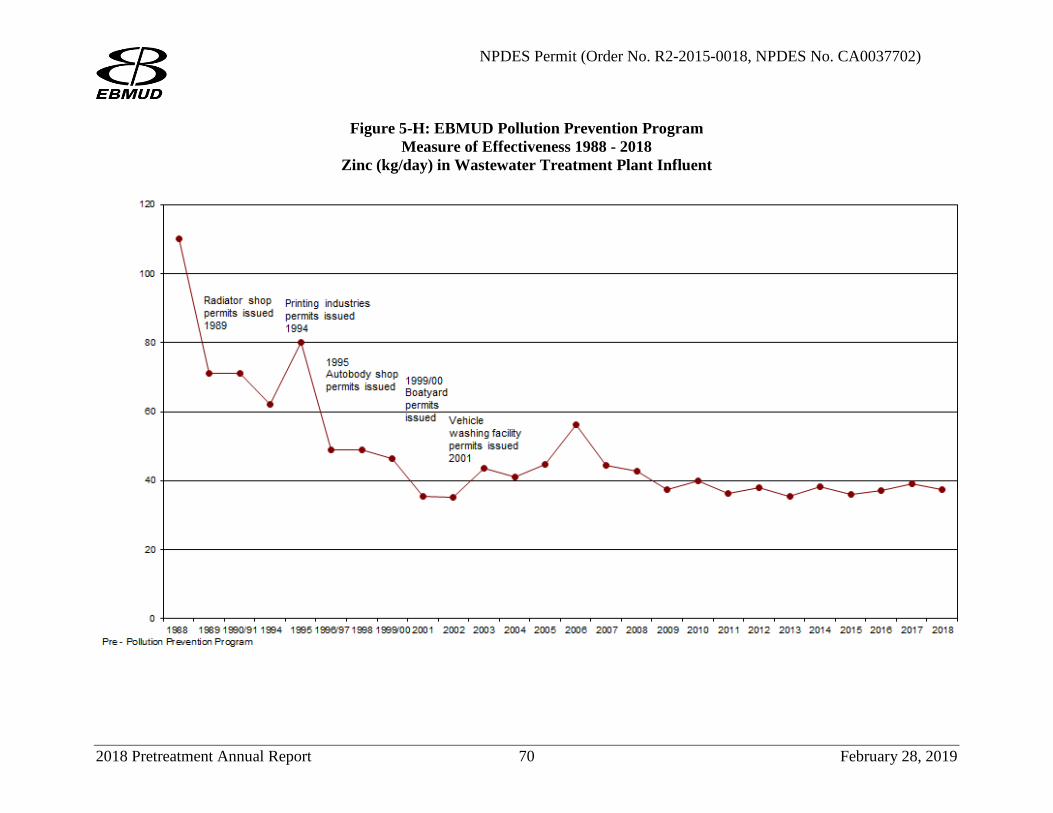
NPDES Permit (Order No. R2-2015-0018, NPDES No. CA0037702)
Figure 5-H: EBMUD Pollution Prevention Program Measure of Effectiveness 1988 - 2018
Zinc (kg/day) in Wastewater Treatment Plant Influent
2018 Pretreatment Annual Report 70 February 28, 2019
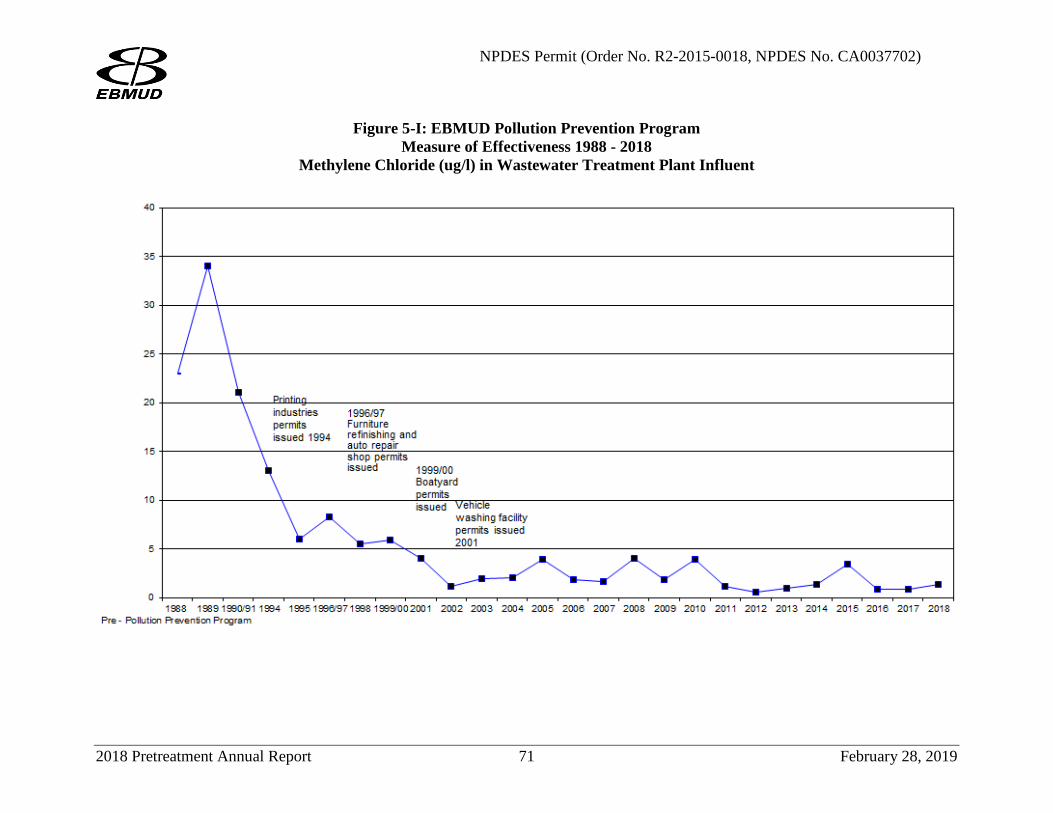
NPDES Permit (Order No. R2-2015-0018, NPDES No. CA0037702)
Figure 5-I: EBMUD Pollution Prevention Program Measure of Effectiveness 1988 - 2018
Methylene Chloride (ug/l) in Wastewater Treatment Plant Influent
2018 Pretreatment Annual Report 71 February 28, 2019
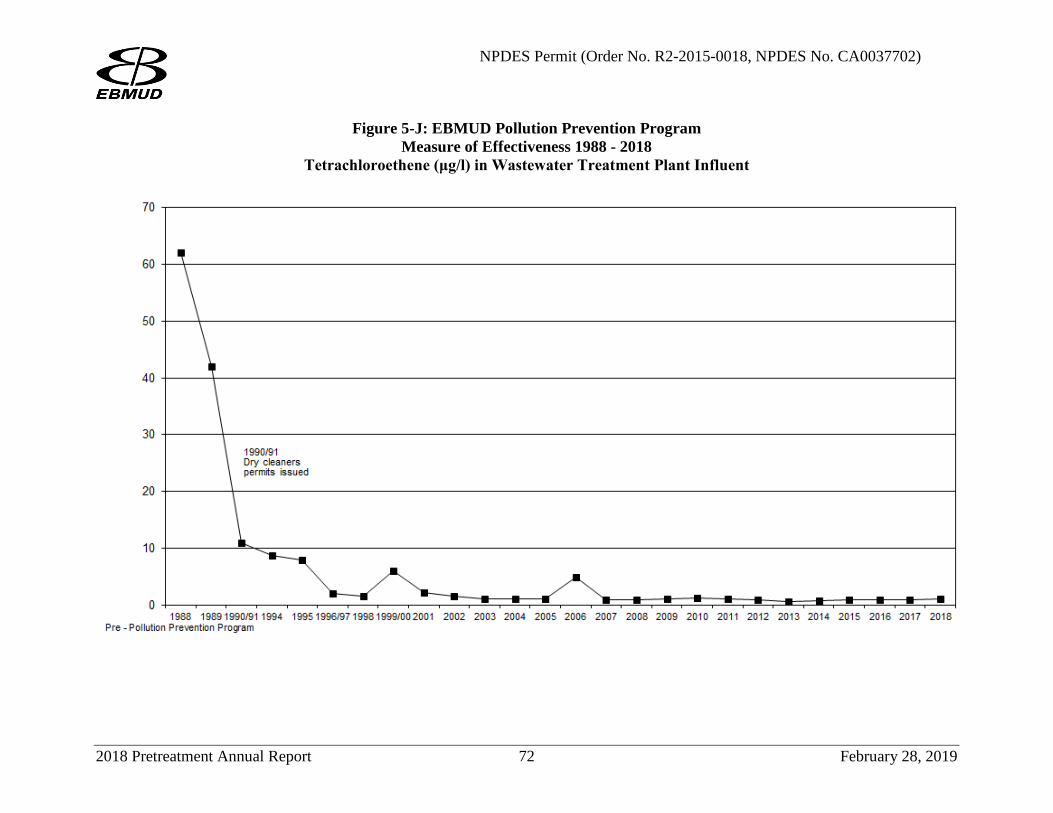
NPDES Permit (Order No. R2-2015-0018, NPDES No. CA0037702)
Figure 5-J: EBMUD Pollution Prevention Program Measure of Effectiveness 1988 - 2018
Tetrachloroethene (μg/l) in Wastewater Treatment Plant Influent
2018 Pretreatment Annual Report 72 February 28, 2019
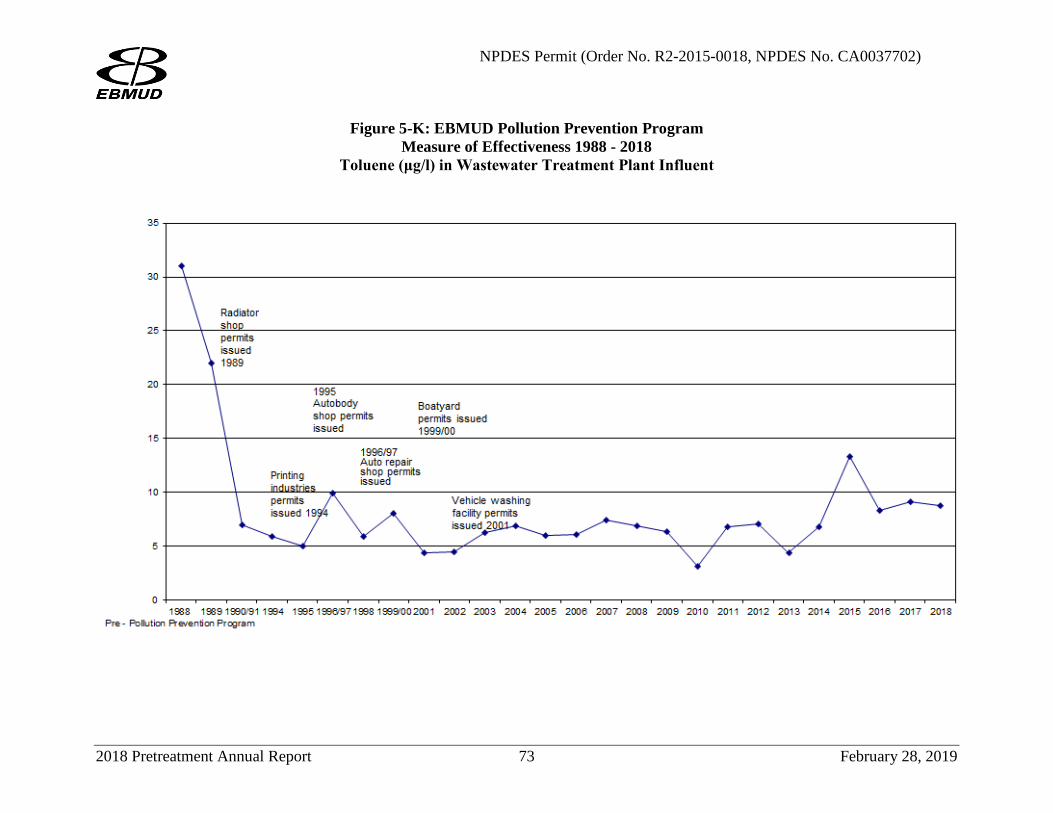
NPDES Permit (Order No. R2-2015-0018, NPDES No. CA0037702)
Figure 5-K: EBMUD Pollution Prevention Program Measure of Effectiveness 1988 - 2018
Toluene (μg/l) in Wastewater Treatment Plant Influent
2018 Pretreatment Annual Report 73 February 28, 2019
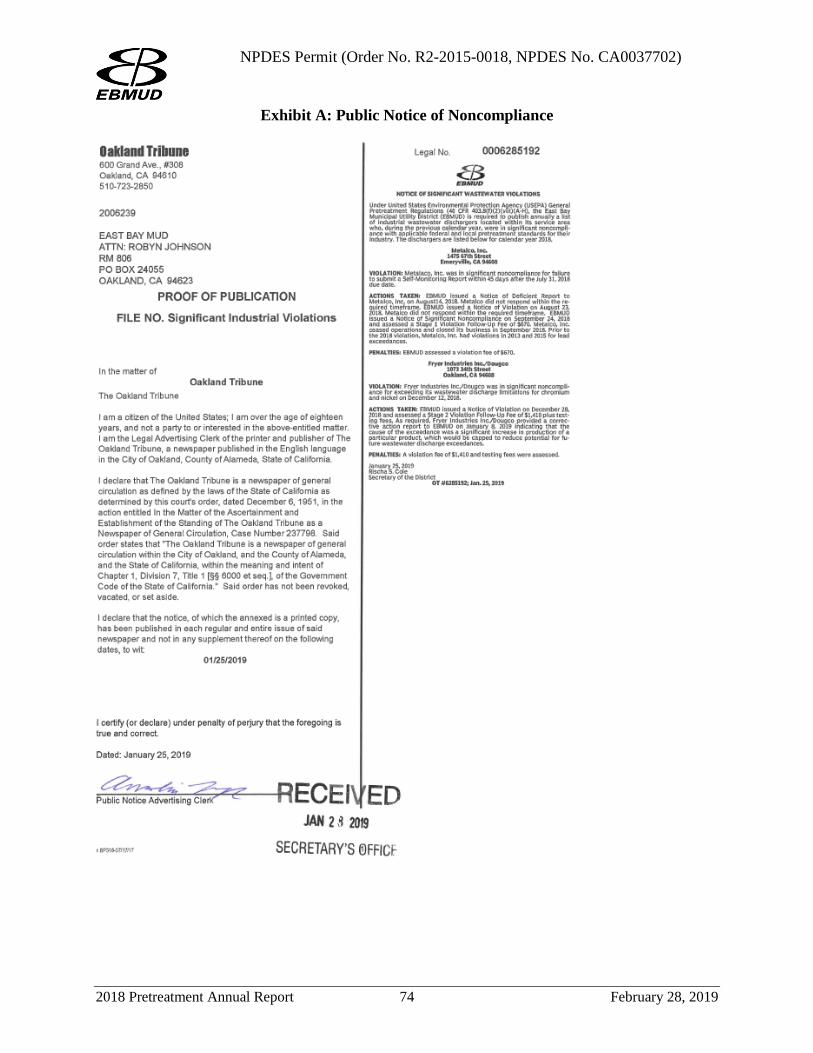
NPDES Permit (Order No. R2-2015-0018, NPDES No. CA0037702)
Exhibit A: Public Notice of Noncompliance
2018 Pretreatment Annual Report 74 February 28, 2019
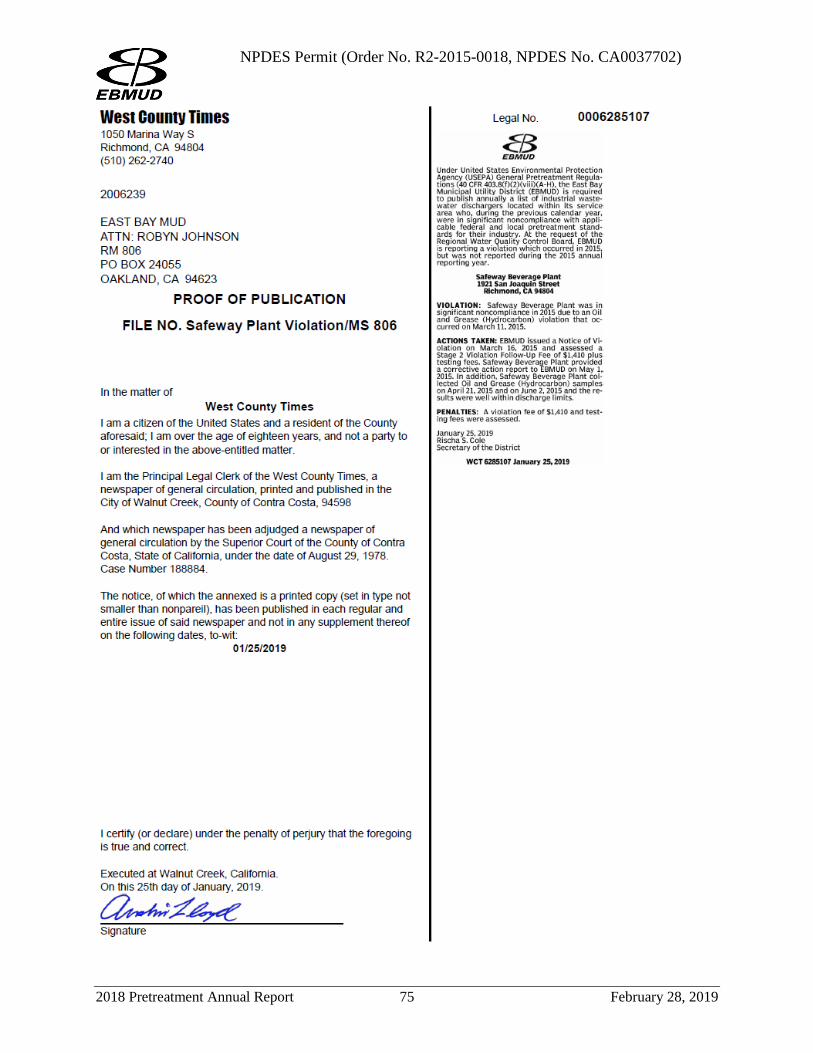
NPDES Permit (Order No. R2-2015-0018, NPDES No. CA0037702)
2018 Pretreatment Annual Report 75 February 28, 2019
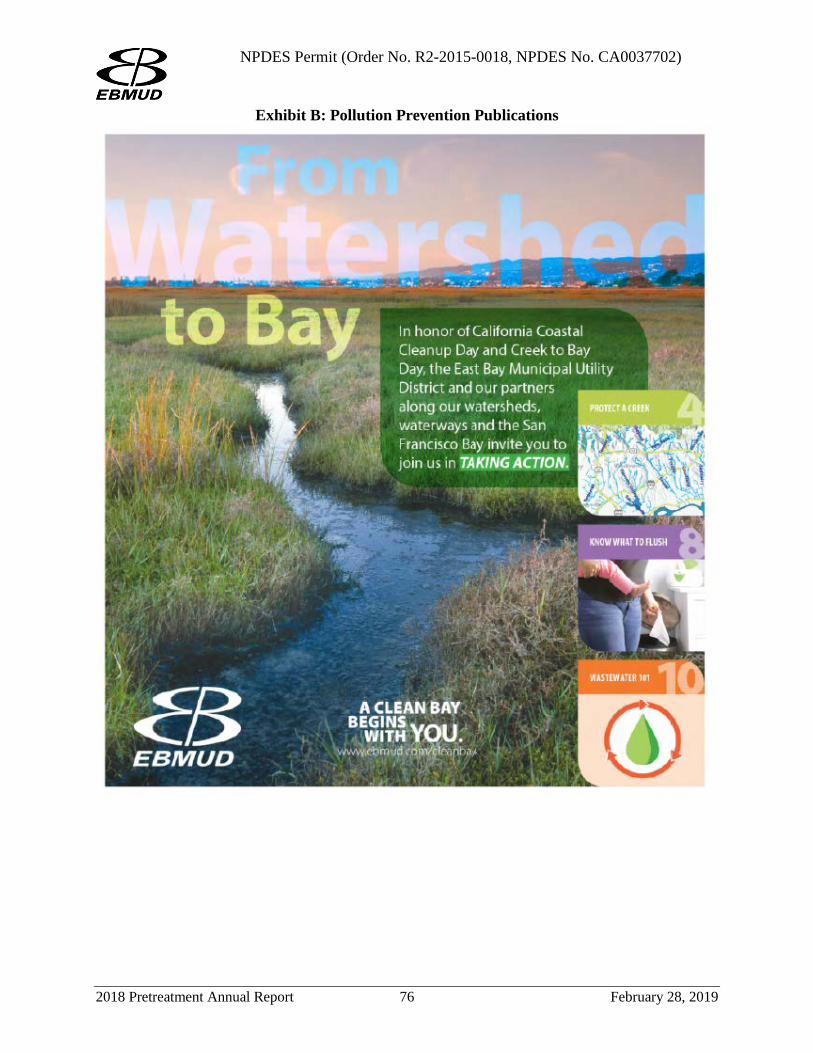
NPDES Permit (Order No. R2-2015-0018, NPDES No. CA0037702)
Exhibit B: Pollution Prevention Publications
2018 Pretreatment Annual Report 76 February 28, 2019
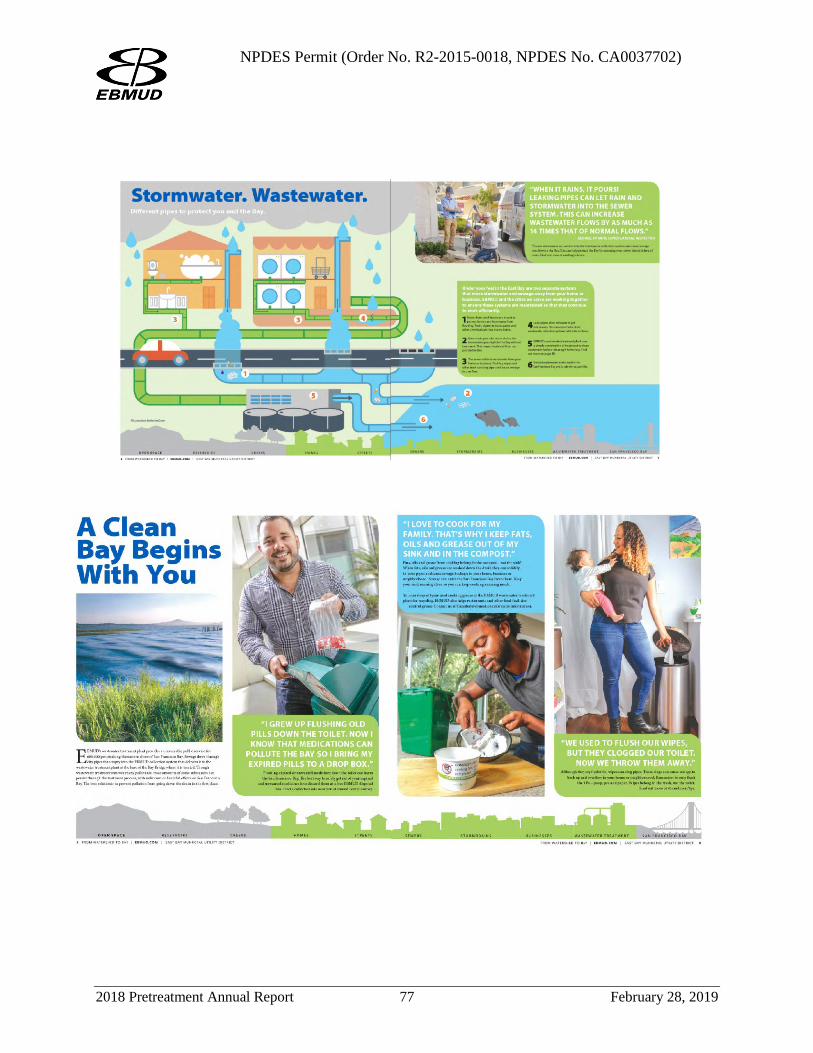
NPDES Permit (Order No. R2-2015-0018, NPDES No. CA0037702)
2018 Pretreatment Annual Report 77 February 28, 2019
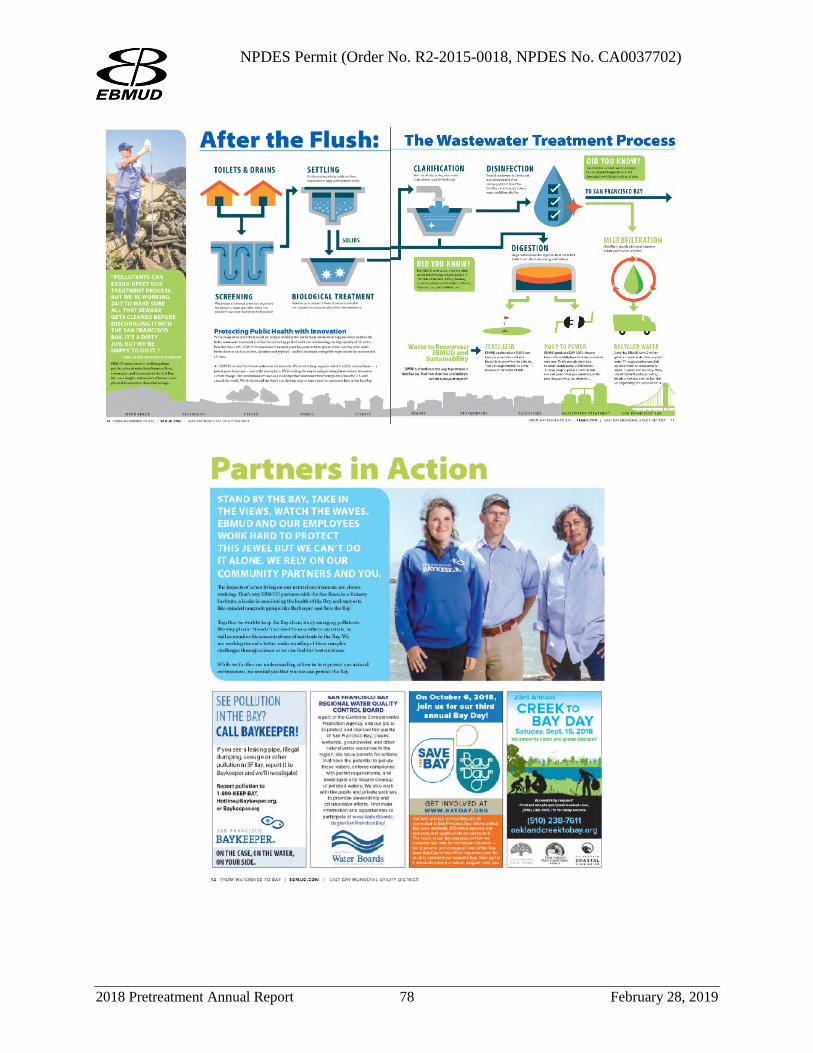
NPDES Permit (Order No. R2-2015-0018, NPDES No. CA0037702)
2018 Pretreatment Annual Report 78 February 28, 2019
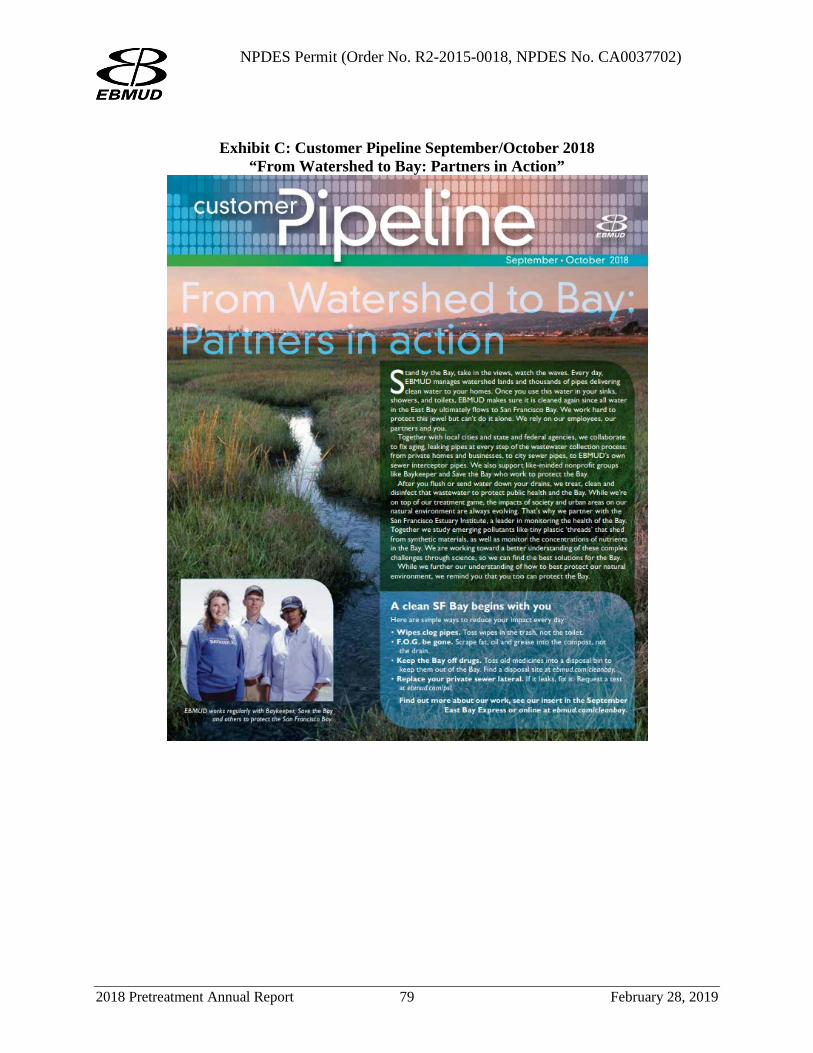
NPDES Permit (Order No. R2-2015-0018, NPDES No. CA0037702)
Exhibit C: Customer Pipeline September/October 2018 “From Watershed to Bay: Partners in Action”
2018 Pretreatment Annual Report 79 February 28, 2019
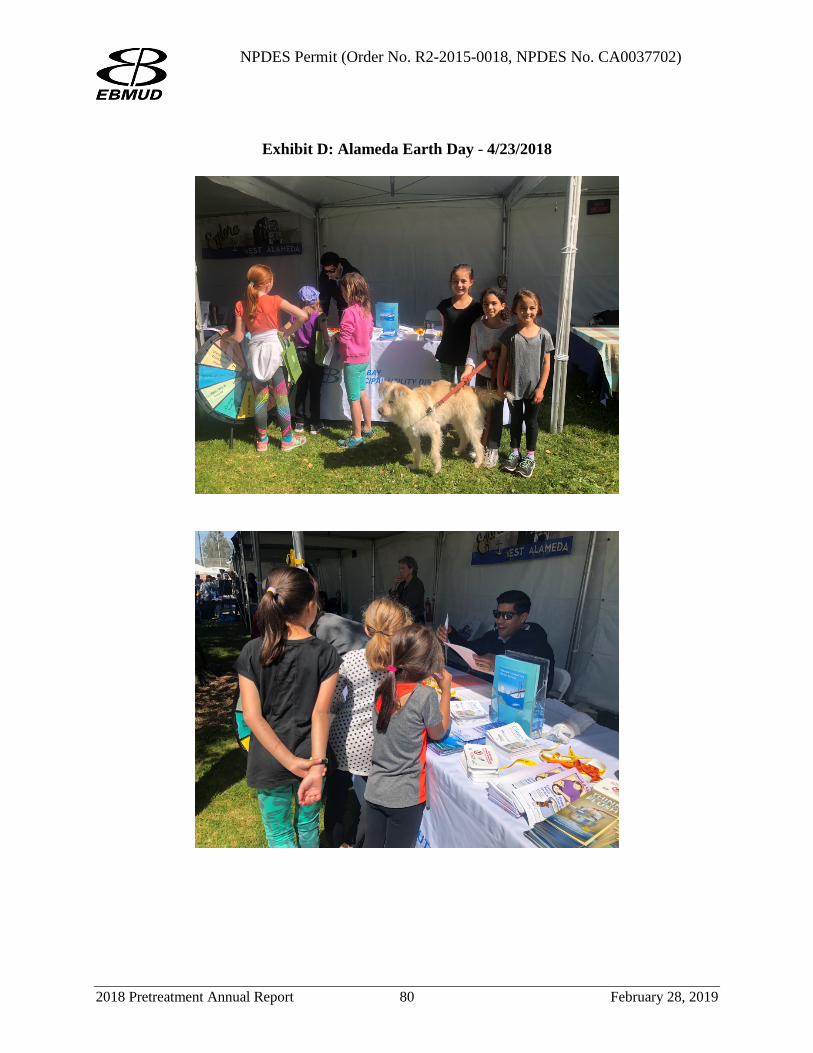
NPDES Permit (Order No. R2-2015-0018, NPDES No. CA0037702)
Exhibit D: Alameda Earth Day - 4/23/2018
2018 Pretreatment Annual Report 80 February 28, 2019
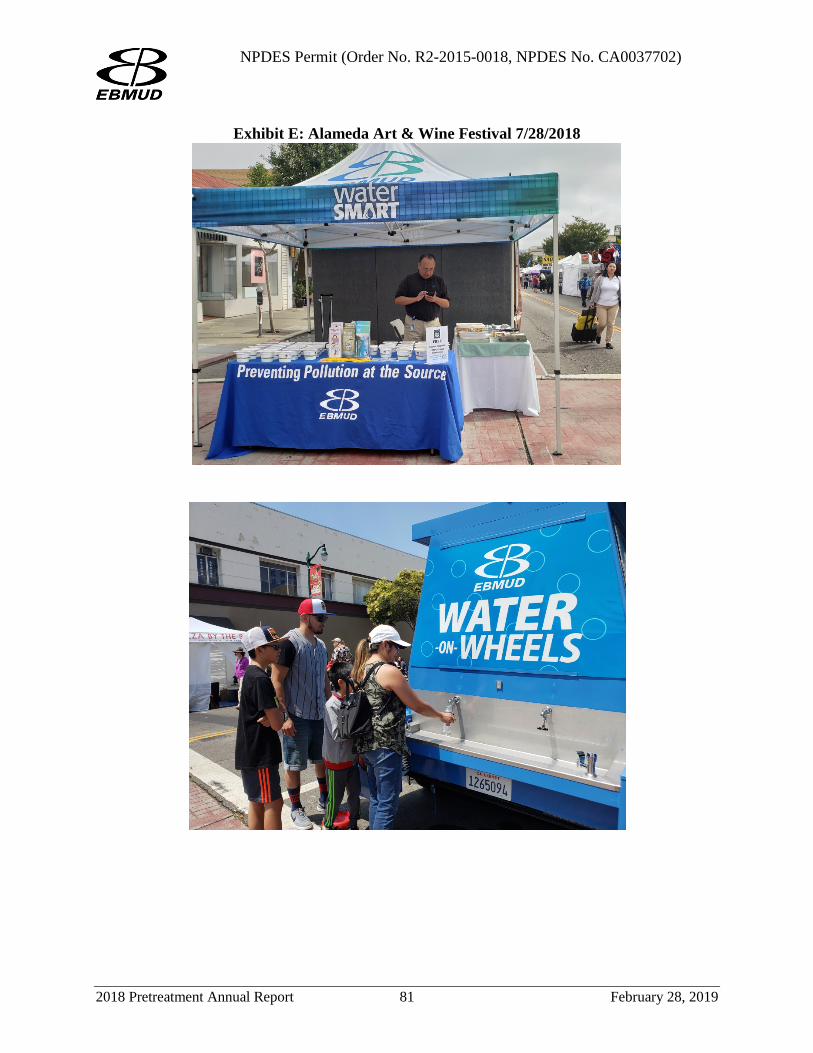
NPDES Permit (Order No. R2-2015-0018, NPDES No. CA0037702)
Exhibit E: Alameda Art & Wine Festival 7/28/2018
2018 Pretreatment Annual Report 81 February 28, 2019
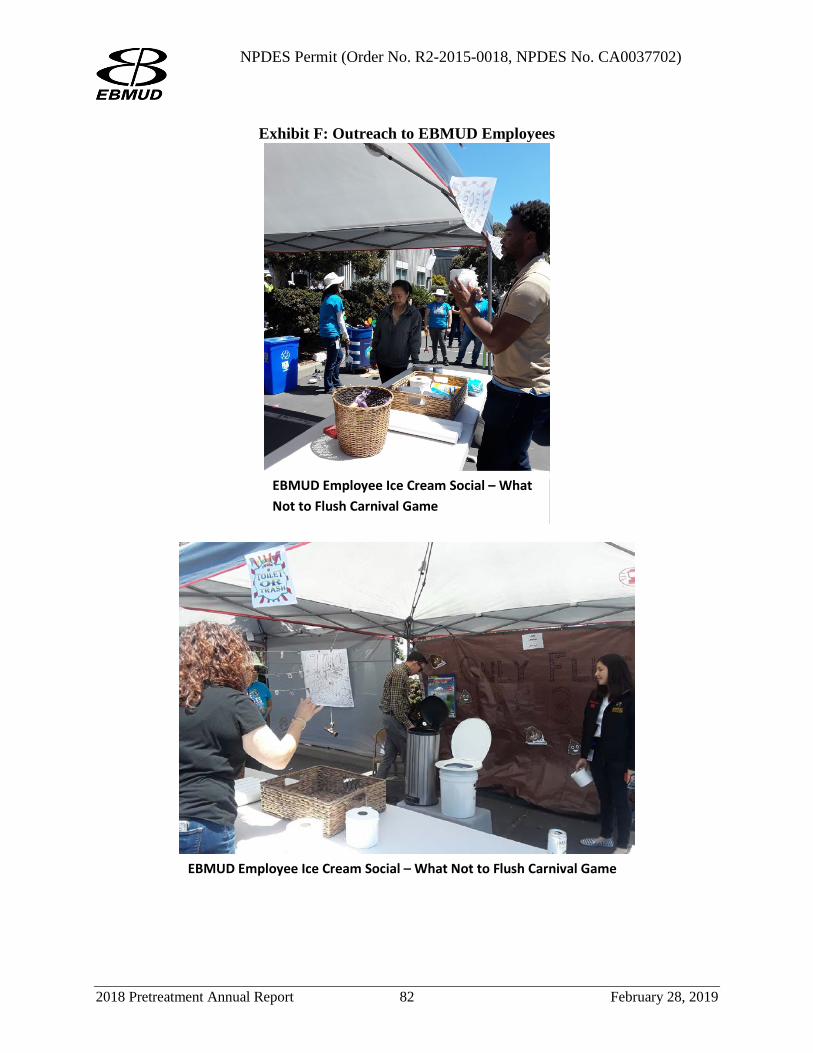
NPDES Permit (Order No. R2-2015-0018, NPDES No. CA0037702)
Exhibit F: Outreach to EBMUD Employees
EBMUD Employee Ice Cream Social – What Not to Flush Carnival Game
EBMUD Employee Ice Cream Social – What Not to Flush Carnival Game
2018 Pretreatment Annual Report 82 February 28, 2019
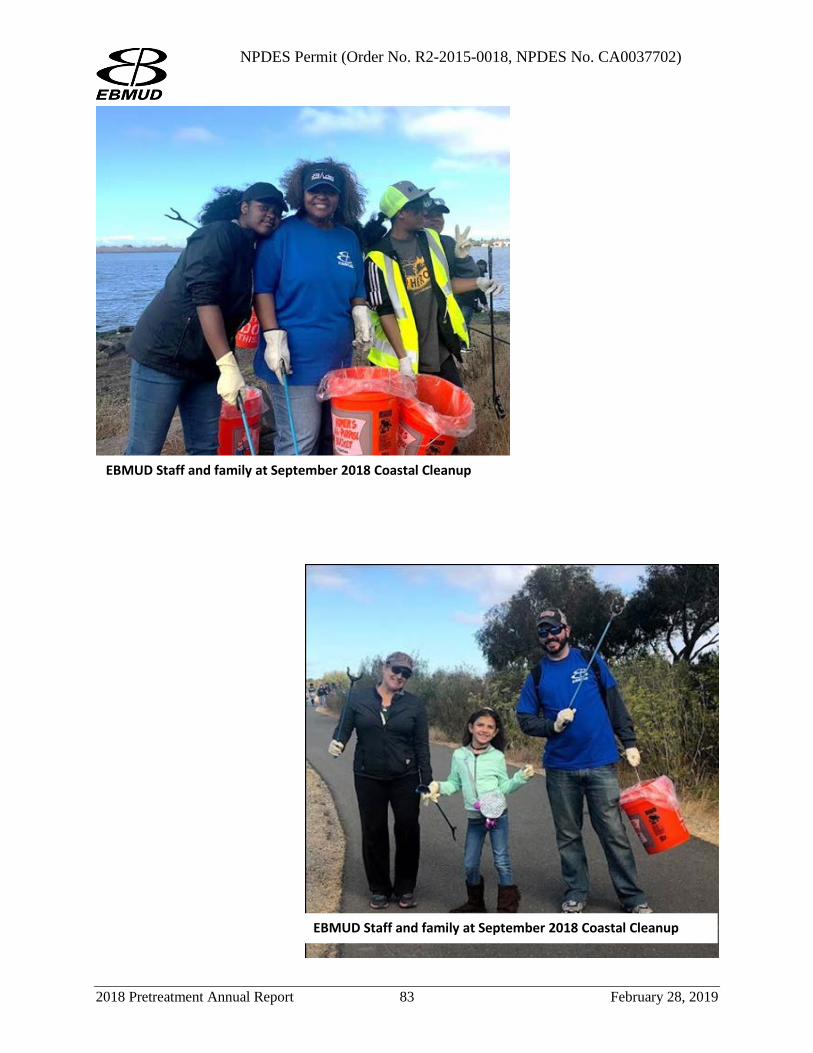
NPDES Permit (Order No. R2-2015-0018, NPDES No. CA0037702)
EBMUD Staff and family at September 2018 Coastal Cleanup
EBMUD Staff and family at September 2018 Coastal Cleanup
2018 Pretreatment Annual Report 83 February 28, 2019
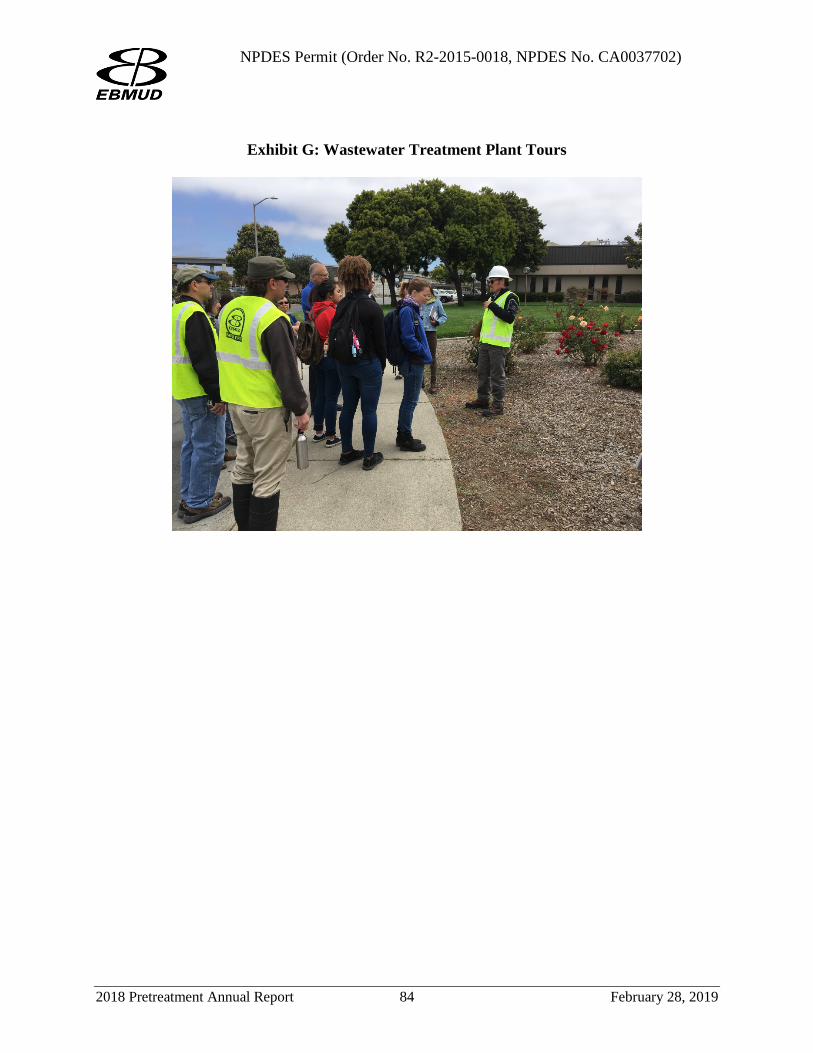
NPDES Permit (Order No. R2-2015-0018, NPDES No. CA0037702)
Exhibit G: Wastewater Treatment Plant Tours
2018 Pretreatment Annual Report 84 February 28, 2019
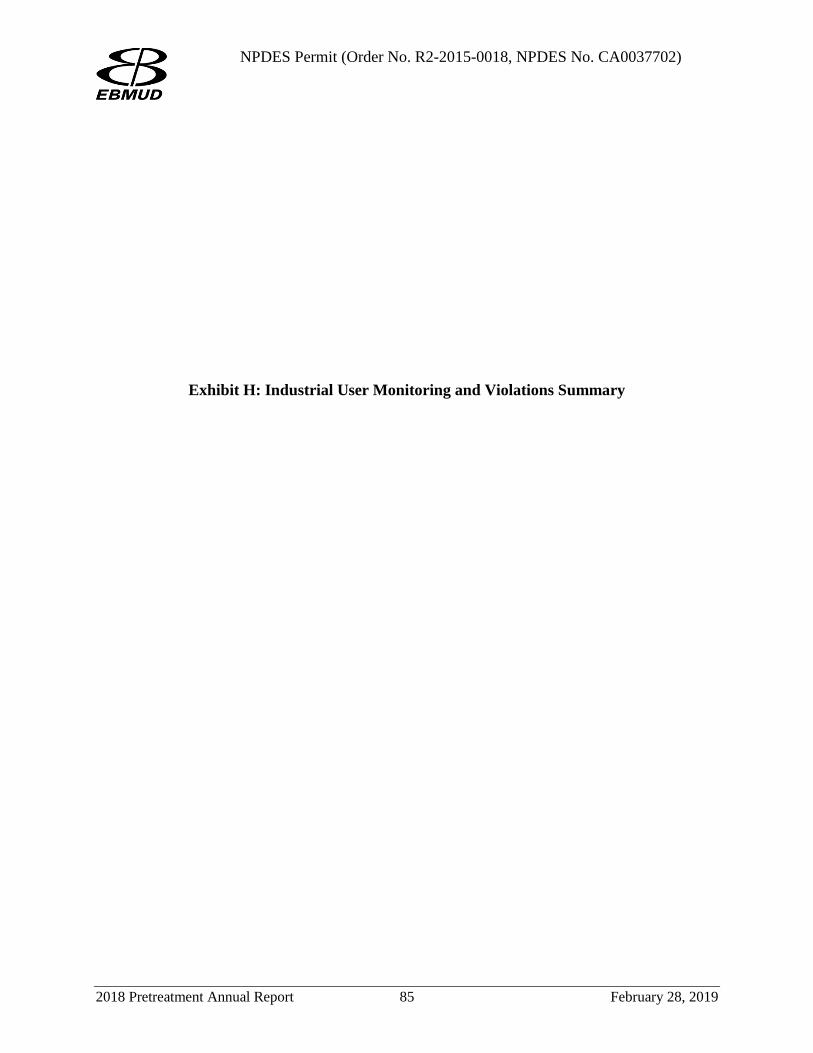
NPDES Permit (Order No. R2-2015-0018, NPDES No. CA0037702)
Exhibit H: Industrial User Monitoring and Violations Summary
2018 Pretreatment Annual Report 85 February 28, 2019
EBMUDINSPECTIONS
40 CFR 413 ELECTROPLATING 0 0 1 3 2 0 2 1 1 $670 0 0 1 040 CFR 433 METAL FINISHING 2 0 0 2 2 2 4 1 1 $1,410 2 0 1 040 CFR 442 TRANSPORTATION EQUIPMENT CLEANING 1 0 0 2 2 0 2 0 0 $0 1 0 0 0
Sub-total for SIU-Categorical 3 0 1 7 6 2 8 2 2 $2,080 3 0 2 0
BCC 2080 BEVERAGE MANUFACTURE 3 0 0 12 10 3 13 3 2 $2,820 1 2 0 0BCC 2830 DRUGS MANUFACTURING 1 0 0 3 6 0 6 0 0 $0 1 0 0 0BCC 3300 PRIMARY METALS MANUFACTURING 1 0 0 1 0 0 0 0 0 $0 1 0 0 0BCC 4500 AIR TRANSPORTATION 1 0 0 4 6 8 14 0 0 $0 1 0 0 0BCC 7218 INDUSTRIAL LAUNDRIES 1 0 0 5 4 7 11 1 1 $1,410 0 1 0 0BCC 7300 LABORATORIES 1 0 0 2 8 4 12 0 0 $0 1 0 0 0BCC 8200 SCHOOLS 1 0 0 5 2 0 2 0 0 $0 1 0 0 0
Sub-Total for SIU-Local 9 0 0 32 36 22 58 4 3 $4,230 6 3 0 0Sub-Total SIU Permits 12 0 1 39 42 24 66 6 5 $6,310 9 3 2 0
BCC 2040 GRAIN MILLS 1 0 0 0 0 0 0 0 0 $0 1 0 0 0BCC 2830 DRUGS MANUFACTURING 2 0 0 0 0 0 0 0 0 $0 2 0 0 0BCC 2891 ADHESIVES AND GELATIN MFG. 2 0 0 3 3 1 4 1 1 $1,410 1 1 0 0BCC 3200 EARTHENWARE, SANITARY ONLY 2 0 0 3 2 0 2 0 0 $0 2 0 0 0BCC 4000 RAILROAD TRANSPORTATION 2 0 0 2 2 4 6 0 0 $0 2 0 0 0BCC 4100 LOCAL AND SUBURBAN TRANSIT 3 0 0 9 4 8 12 0 0 $0 3 0 0 0BCC 4400 WATER TRANSPORTATION 1 0 0 0 0 0 0 0 0 $0 1 0 0 0BCC 4950 SANITARY COLLECTION AND DISPOSAL 2 0 0 0 0 0 0 0 0 $0 2 0 0 0BCC 5093 RECYCLING CENTER 1 0 0 1 0 0 0 0 0 $0 1 0 0 0BCC 6800 OFFICES 1 0 0 0 0 0 0 0 0 $0 1 0 0 0
Sub-Total for Non-SIU-Local 17 0 0 18 11 13 24 1 1 $1,410 16 1 0 0Non-Significant/Zero Discharge Categorical Industrial Users 20 0 1 12 0 0 0 0 0 $0 20 0 0 0Grand Totals 49 0 2 69 53 37 90 7 6 $7,720 45 4 2 0
(1),(2) - All violations are included in NOVs (3) C - Consistent Compliance (4) IC - Inconsistent Compliance (5) SNC - Significant Non-Compliance (6) U - Unknown NA - Not Applicable
NEW - A Minimization, Estimation or Pollution Prevention permit which was NOT IN effect during the previous reporting year.
CLOSED - A facility which no longer operates in the EBMUD SD-1 service area.
RECLASSIFIED - An IU regulated under a SIU, Estimation or Pollution Prevention permit which becomes regulated under a different one of these permits.
REISSUED - Existing Pollution Prevention permits which are renewed.
Non-Significant Industrial Users
TERMINATED - A permit which ceases to be in effect due to reasons such as business closure, business name change or regulated process change. In exceptoinal cases, the Director may terminate a permit for violation of the permit terms and conditions or the EBMUD Ordinance No. 311A-03 provisions. A discharger who has a permit terminated by the Director is required to apply for a new permit within 30 days of notice of termination.
SNC (5) U (5)
SIU PERMITSCategorical Industrial Users
Non-Categorical Significant Industrial Users
IU TOTAL NO. OF VIOS (1)
NO. OF NOVS (2) FEES C (3) IC (4)
Monitoring and Violations Summary2018 PERMIT SUMMARY SAMPLING EVENTS VIOLATIONS COMPLIANCE STATUS
12/31/2018IN EFFECT 12/31/2018 NEW CLOSED/ TERMINATED/
RE-CLASSIFIED EBMUD
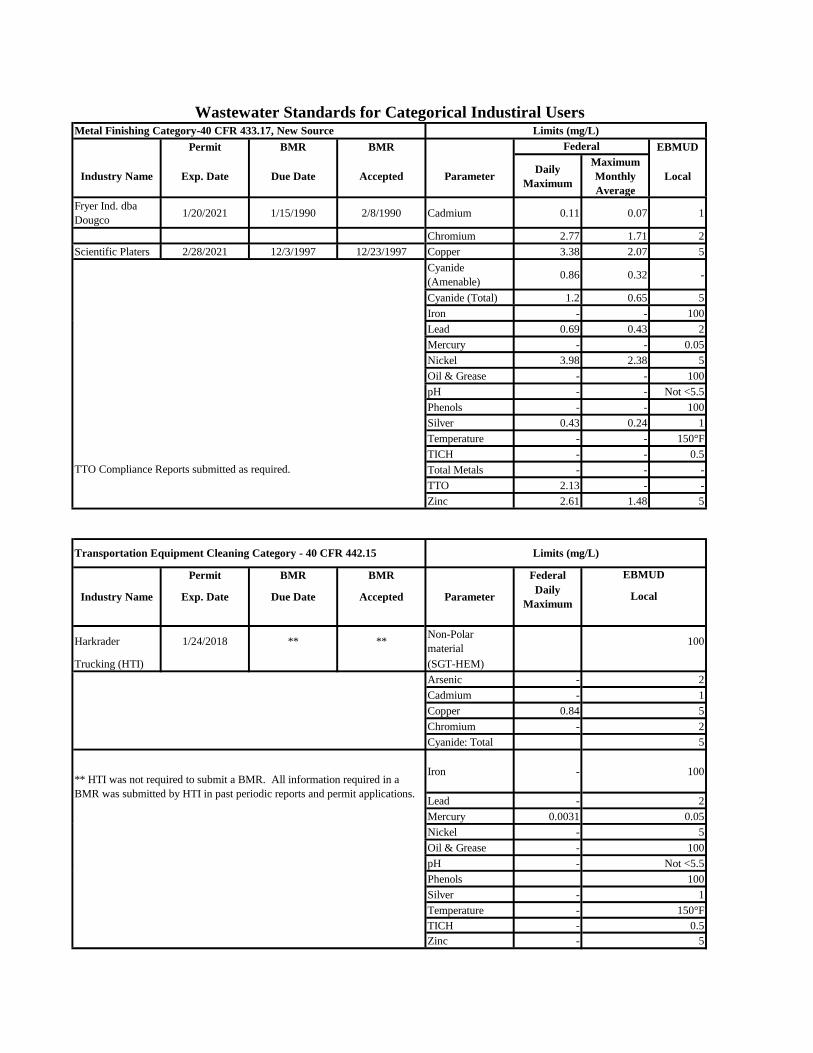
Permit BMR BMR EBMUD
Industry Name Exp. Date Due Date Accepted Parameter Daily Maximum
Maximum Monthly Average
Local
Fryer Ind. dba Dougco 1/20/2021 1/15/1990 2/8/1990 Cadmium 0.11 0.07 1
Chromium 2.77 1.71 2Scientific Platers 2/28/2021 12/3/1997 12/23/1997 Copper 3.38 2.07 5
Cyanide (Amenable) 0.86 0.32 -
Cyanide (Total) 1.2 0.65 5Iron - - 100Lead 0.69 0.43 2Mercury - - 0.05Nickel 3.98 2.38 5Oil & Grease - - 100pH - - Not <5.5Phenols - - 100Silver 0.43 0.24 1Temperature - - 150°FTICH - - 0.5Total Metals - - -TTO 2.13 - -Zinc 2.61 1.48 5
Permit BMR BMR Federal
Industry Name Exp. Date Due Date Accepted Parameter Daily Maximum
Harkrader 1/24/2018 ** ** Non-Polar material 100
Trucking (HTI) (SGT-HEM)Arsenic - 2Cadmium - 1Copper 0.84 5Chromium - 2Cyanide: Total 5
Iron - 100
Lead - 2Mercury 0.0031 0.05Nickel - 5Oil & Grease - 100pH - Not <5.5Phenols 100Silver - 1Temperature - 150°FTICH - 0.5Zinc - 5
** HTI was not required to submit a BMR. All information required in a BMR was submitted by HTI in past periodic reports and permit applications.
TTO Compliance Reports submitted as required.
Limits (mg/L)
EBMUD
Local
Transportation Equipment Cleaning Category - 40 CFR 442.15
Metal Finishing Category-40 CFR 433.17, New SourceWastewater Standards for Categorical Industiral Users
Limits (mg/L)Federal
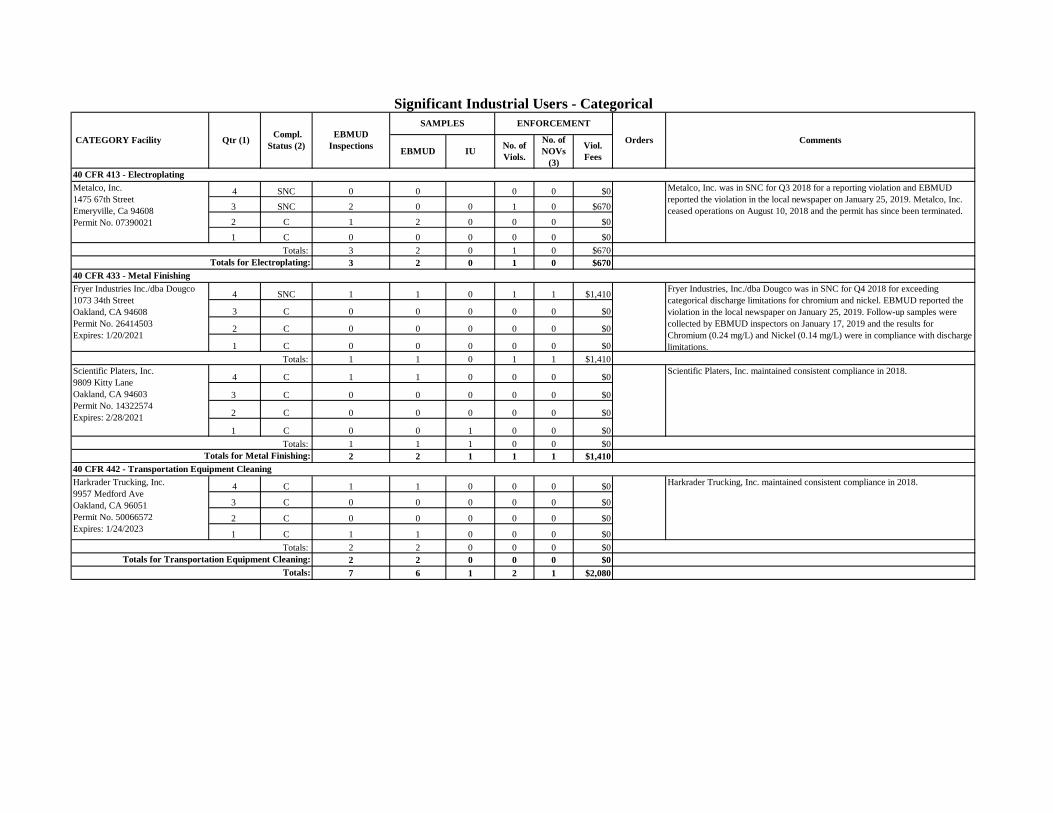
4 SNC 0 0 0 0 $0
3 SNC 2 0 0 1 0 $670
2 C 1 2 0 0 0 $0
1 C 0 0 0 0 0 $0 3 2 0 1 0 $670 3 2 0 1 0 $670
4 SNC 1 1 0 1 1 $1,410
3 C 0 0 0 0 0 $0
2 C 0 0 0 0 0 $0
1 C 0 0 0 0 0 $01 1 0 1 1 $1,410
4 C 1 1 0 0 0 $0
3 C 0 0 0 0 0 $0
2 C 0 0 0 0 0 $0
1 C 0 0 1 0 0 $0 1 1 1 0 0 $0 2 2 1 1 1 $1,410
4 C 1 1 0 0 0 $0
3 C 0 0 0 0 0 $0
2 C 0 0 0 0 0 $0
1 C 1 1 0 0 0 $0 2 2 0 0 0 $0 2 2 0 0 0 $0 7 6 1 2 1 $2,080
Significant Industrial Users - Categorical
Harkrader Trucking, Inc.9957 Medford AveOakland, CA 96051Permit No. 50066572Expires: 1/24/2023
Totals for Metal Finishing:40 CFR 442 - Transportation Equipment Cleaning
Scientific Platers, Inc. maintained consistent compliance in 2018.
Totals:
Metalco, Inc. 1475 67th Street Emeryville, Ca 94608 Permit No. 07390021
CATEGORY Facility Qtr (1) Compl. Status (2)
40 CFR 413 - Electroplating
Totals for Electroplating:
Comments EBMUD IU
No. of NOVs
(3)
Viol. Fees
Totals:
Orders
Scientific Platers, Inc.9809 Kitty LaneOakland, CA 94603Permit No. 14322574Expires: 2/28/2021
40 CFR 433 - Metal FinishingFryer Industries, Inc./dba Dougco was in SNC for Q4 2018 for exceeding categorical discharge limitations for chromium and nickel. EBMUD reported the violation in the local newspaper on January 25, 2019. Follow-up samples were collected by EBMUD inspectors on January 17, 2019 and the results for Chromium (0.24 mg/L) and Nickel (0.14 mg/L) were in compliance with discharge limitations.
Totals:
Fryer Industries Inc./dba Dougco1073 34th StreetOakland, CA 94608Permit No. 26414503Expires: 1/20/2021
Metalco, Inc. was in SNC for Q3 2018 for a reporting violation and EBMUD reported the violation in the local newspaper on January 25, 2019. Metalco, Inc. ceased operations on August 10, 2018 and the permit has since been terminated.
EBMUD Inspections No. of
Viols.
SAMPLES ENFORCEMENT
Totals:
Harkrader Trucking, Inc. maintained consistent compliance in 2018.
Totals: Totals for Transportation Equipment Cleaning:
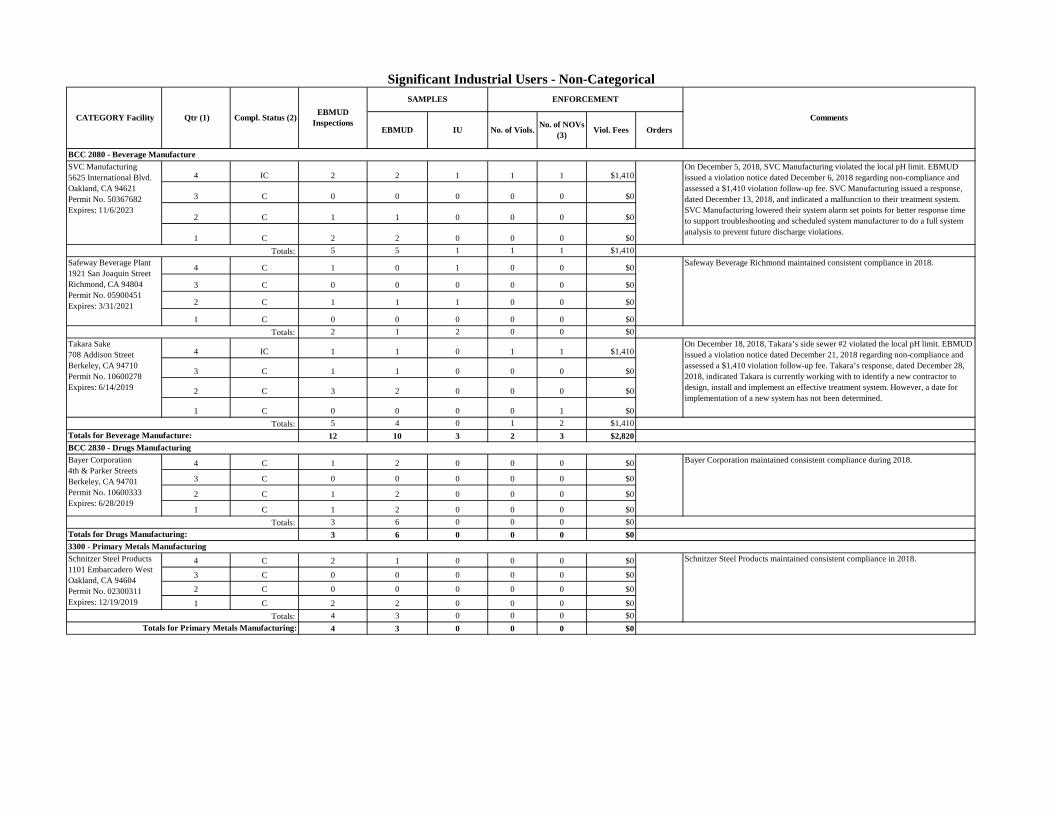
4 IC 2 2 1 1 1 $1,410
3 C 0 0 0 0 0 $0
2 C 1 1 0 0 0 $0
1 C 2 2 0 0 0 $0 5 5 1 1 1 $1,410
4 C 1 0 1 0 0 $0
3 C 0 0 0 0 0 $0
2 C 1 1 1 0 0 $0
1 C 0 0 0 0 0 $0 2 1 2 0 0 $0
4 IC 1 1 0 1 1 $1,410
3 C 1 1 0 0 0 $0
2 C 3 2 0 0 0 $0
1 C 0 0 0 0 1 $0 5 4 0 1 2 $1,410
12 10 3 2 3 $2,820
4 C 1 2 0 0 0 $0
3 C 0 0 0 0 0 $0
2 C 1 2 0 0 0 $0
1 C 1 2 0 0 0 $0 3 6 0 0 0 $0 3 6 0 0 0 $0
4 C 2 1 0 0 0 $0
3 C 0 0 0 0 0 $0
2 C 0 0 0 0 0 $0
1 C 2 2 0 0 0 $0 4 3 0 0 0 $0 4 3 0 0 0 $0
Significant Industrial Users - Non-Categorical
Totals for Drugs Manufacturing:
Totals for Beverage Manufacture:BCC 2830 - Drugs ManufacturingBayer Corporation4th & Parker StreetsBerkeley, CA 94701Permit No. 10600333Expires: 6/28/2019
Bayer Corporation maintained consistent compliance during 2018.
Totals:
Schnitzer Steel Products maintained consistent compliance in 2018.
Totals for Primary Metals Manufacturing:
3300 - Primary Metals ManufacturingSchnitzer Steel Products1101 Embarcadero WestOakland, CA 94604Permit No. 02300311Expires: 12/19/2019
Totals:
On December 5, 2018, SVC Manufacturing violated the local pH limit. EBMUD issued a violation notice dated December 6, 2018 regarding non-compliance and assessed a $1,410 violation follow-up fee. SVC Manufacturing issued a response, dated December 13, 2018, and indicated a malfunction to their treatment system. SVC Manufacturing lowered their system alarm set points for better response time to support troubleshooting and scheduled system manufacturer to do a full system analysis to prevent future discharge violations.
Totals:
SVC Manufacturing5625 International Blvd.Oakland, CA 94621Permit No. 50367682Expires: 11/6/2023
Totals:
Safeway Beverage Richmond maintained consistent compliance in 2018.
Totals: Takara Sake708 Addison StreetBerkeley, CA 94710Permit No. 10600278Expires: 6/14/2019
On December 18, 2018, Takara’s side sewer #2 violated the local pH limit. EBMUD issued a violation notice dated December 21, 2018 regarding non-compliance and assessed a $1,410 violation follow-up fee. Takara’s response, dated December 28, 2018, indicated Takara is currently working with to identify a new contractor to design, install and implement an effective treatment system. However, a date for implementation of a new system has not been determined.
Safeway Beverage Plant1921 San Joaquin StreetRichmond, CA 94804Permit No. 05900451Expires: 3/31/2021
Comments EBMUD IU Orders
BCC 2080 - Beverage Manufacture
CATEGORY Facility Qtr (1) Compl. Status (2) EBMUD Inspections
ENFORCEMENT
No. of Viols. No. of NOVs (3) Viol. Fees
SAMPLES
Significant Industrial Users - Non-Categorical
Comments EBMUD IU Orders
CATEGORY Facility Qtr (1) Compl. Status (2) EBMUD Inspections
ENFORCEMENT
No. of Viols. No. of NOVs (3) Viol. Fees
SAMPLES
4 C 2 2 2 0 0 $0
3 C 1 2 2 0 0 $0
2 C 1 2 2 0 0 $0
1 C 0 0 2 0 0 $0 4 6 8 0 0 $0 4 6 8 0 0 $0
4 IC 2 2 1 1 1 $1,410
3 C 1 2 2 0 0 $0
2 C 1 0 2 0 0 $0
1 C 1 1 2 0 0 $0 5 5 7 1 1 $1,410 5 5 7 1 1 $1,410
4 C 1 4 0 0 0 $0
3 C 0 0 2 0 0 $0
2 C 1 4 0 0 0 $0
1 C 0 0 2 0 0 $0 2 8 4 0 0 $0 2 8 4 0 0 $0
4 C 3 1 0 0 0 $0
3 C 1 0 0 0 0 $0
2 C 1 4 0 0 0 $0
1 C 0 0 0 0 0 $0 5 5 0 0 0 $0 5 5 0 0 0 $0 Totals for Schools:
Regents Of The University Of California, BerkeleyBerkeley CampusBerkeley, CA 94720Permit No. 06600592Expires: 11/16/2023
Regents of the University of California, Berkeley maintained consistent compliance in 2018.
Totals:
Totals for Laboratories:BCC 8200 - Schools
BCC 7300 - LaboratoriesLawrence Berkeley National Laboratory1 Cyclotron RoadBerkeley, CA 94720Permit No. 06600791Expires: 7/7/2022
Lawrence Berkeley National Laboratory maintained consistent compliance in 2018.
Totals:
Totals for Industrial Laundries:
Totals for Air Transportation:BCC 7218 - Industrial LaundriesAramark Uniform Services330 Chestnut StreetOakland, CA 94607Permit No. 03300801Expires: 11/9/2023
On November 6, 2018, Aramark Uniform & Career Apparel, LLC violated the discharge limitation for oil and grease. EBMUD issued a notice of violation dated November 15, 2018 regarding non-compliance and assessed a $1,410 violation follow-up fee. Aramark Uniform & Career Apparel, LLC submitted a response letter on November 20, 2018 and noted a mechanical issue with a recirculation valve during start-up which allowed partially treated wastewater to discharge into the effluent sump. The valve has since been replaced and tested to ensure proper operation. A follow-up sample was collected on December 7, 2018 and the result was within discharge limits at 28 mg/L.
Totals:
Port Of Oakland - Oakland International AirportDoolittle & Airport DriveOakland, CA 94607Permit No. 17300332Expires: 8/25/2022
Oakland International Airport (OIA) Maintained consistent compliance in 2018.
Totals:
BCC 4500 - Air Transportation
4 C 0 0 0 0 0 $0
3 C 0 0 0 0 0 $0
2 C 0 0 0 0 0 $0
1 C 0 0 0 0 0 $0 0 0 0 0 0 $0 0 0 0 0 0 $0
4 C 0 0 0 0 0 $0
3 C 0 0 0 0 0 $0
2 C 0 0 0 0 0 $0
1 C 0 0 0 0 0 $0 0 0 0 0 0 $0
4 C 0 0 0 0 0 $0
3 C 0 0 0 0 0 $0
2 C 0 0 0 0 0 $0
1 C 0 0 0 0 0 $0 0 0 0 0 0 $0 0 0 0 0 0 $0
4 IC 1 2 0 1 1 $1,410
3 C 1 0 0 0 0 $0
2 C 0 0 1 0 0 $0
1 C 0 0 0 0 0 $0 2 2 1 1 1 $1,410
4 C 0 0 0 0 0 $0
3 C 1 1 0 0 0 $0
2 C 0 0 0 0 0 $0
1 C 0 0 0 0 0 $0 1 1 0 0 0 $0
Non-Significant Industrial Users
Totals for Drugs Manufacturing:2891 - Adhesives And Gelatin Mfg.Adhesive Products520 Cleveland AvenueAlbany, CA 94710Permit No. 10600761Expires: N/A
Totals:
Totals: Henkel742 Grayson StreetBerkeley, CA 94710Permit No. 10600742Expires: N/A
Henkel maintained consistent compliance in 2018.
Compl. Status (2)
EBMUD Inspections
ENFORCEMENT
No. of Viols.
No. of NOVs
Viol. Fees
Totals:
SAMPLES
Comments EBMUD IU Orders
CATEGORY Facility Qtr (1)
Grifols Diagnostic Solutions, Inc., maintained consistent compliance in 2018.
Totals:
Grifols Diagnostic Solutions Inc.4560 Horton StreetEmeryville, Ca 94608Permit No. 35000289Expires: N/A
Agenus West LLC901 Heinz AvenueBerkeley, Ca 94710Permit No. 28882804Expires: N/A
Agenus West LLC maintained consistent compliance in 2018.
On October 5, 2018, Adhesive Products violated the discharge limitation for oil and grease. EBMUD issued a notice of violation dated November 5, 2018 regarding non-compliance and assessed a $1,410 violation follow-up fee. Adhesive Products submitted a response letter on November 13, 2018 and noted that staff did not conduct scheduled routine cleaning practices that resulted a build-up of adhesive material in the sewer lateral which likely caused the violation. Adjustments to the cleaning schedule an practices have been addressed to avoid future discharge violations. A follow-up sample was collected on December 4, 2018 and the result was within discharge limits at 16 mg/L.
2040 - Grain MillsCalifornia Cereal Products1267 14th StreetOakland, CA 94607Permit No. 03301042Expires: N/A
California Cereal maintained consistent compliance in 2018.
Totals: Totals for Grain Mills:2830 - Drugs Manufacturing
Non-Significant Industrial Users
Compl. Status (2)
EBMUD Inspections
ENFORCEMENT
No. of Viols.
No. of NOVs
Viol. Fees
SAMPLES
Comments EBMUD IU Orders
CATEGORY Facility Qtr (1)
3 3 1 1 1 $1,410
4 C 0 0 0 0 0 $0 3 C 1 0 0 0 0 $0 2 C 0 0 0 0 0 $0 1 C 0 0 0 0 0 $0
1 0 0 0 0 $0 1 0 0 0 0 $0
4 C 0 0 0 0 0 $0 3 C 0 0 0 0 0 $0 2 C 0 0 0 0 0 $0 1 C 0 0 0 0 0 $0
0 0 0 0 0 $0 0 0 0 0 0 $0
4 C 0 0 1 0 0 $0
3 C 0 0 0 0 0 $0
2 C 1 1 0 0 0 $0
1 C 0 0 1 0 0 $0 1 1 2 0 0 $0
4 C 1 1 1 0 0 $0 3 C 0 0 0 0 0 $0 2 C 1 1 0 0 0 $0 1 C 0 0 1 0 0 $0
2 2 2 0 0 $0 2 2 4 0 0 $0
4 C 0 0 1 0 0 $0
3 C 1 1 0 0 0 $0
2 C 2 0 1 0 0 $0
1 C 0 0 0 0 0 $0 3 1 2 0 0 $0
Totals for Miscellaneous Manufacturing:
Heliotrope Technologies, Inc. 850 Marina Village Parkway Alameda, CA 94501 Permit No. 61415831 Expires: 10/25/2021
Totals:
4000 - Railroad TransportationAMTRAK - National Railroad Passenger Corp1303 - 3rd StreetOakland, CA 94607Permit No. 50534001Expires: N/A
AC Transit – Emeryville maintained consistent compliance in 2018.
Totals:
4100 - Local And Suburban TransitAC Transit – Emeryville1177 47th Street Emeryville, Ca 94603Permit No. 04391161Expires: 10/30/2021
Union Pacific Railroad Company maintained consistent compliance in 2018.
Totals for Railroad Transportation:
Amtrak – National Railroad maintained consistent compliance in 2018.
Totals: Union Pacific Railroad Company1851-B 5th, StreetOakland, Ca 90810Permit No. 02300371Expires: 8/23/2019
Totals:
3900 - Miscellaneous ManufacturingHeliotrope Technologies, Inc. Maintained consistent compliance in 2018.
Totals for Earthenware, Sanitary Only:
Totals for Adhesives And Gelatin Mfg.:3200S - Earthenware, Sanitary OnlyCEMEX Construction Materials Pacific, LLC 333 23rd AvenueOakland, CA 95630Permit No. 13300311Expires: N/A
CEMEX maintained consistent compliance in 2018.
Totals:
Non-Significant Industrial Users
Compl. Status (2)
EBMUD Inspections
ENFORCEMENT
No. of Viols.
No. of NOVs
Viol. Fees
SAMPLES
Comments EBMUD IU Orders
CATEGORY Facility Qtr (1)
4 C 0 0 1 0 0 $0 3 C 1 1 0 0 0 $0 2 C 2 0 1 0 0 $0
1 C 0 0 0 0 0 $0 3 1 2 0 0 $0
4 C 0 0 0 0 0 $0 3 C 2 2 0 0 0 $0 2 C 1 0 0 0 0 $0
1 C 0 0 0 0 0 $0 3 2 0 0 0 $0 9 4 4 0 0 $0
4 C 0 0 0 0 0 $0 3 C 0 0 0 0 0 $0 2 C 0 0 0 0 0 $0 1 C 0 0 0 0 0 $0
0 0 0 0 0 $0 0 0 0 0 0 $0
4 C 0 0 0 0 0 $0
3 C 0 0 0 0 0 $0
2 C 0 0 0 0 0 $0
1 C 0 0 0 0 0 $0 0 0 0 0 0 $0
4 C 0 0 0 0 0 $0 3 C 0 0 0 0 0 $0 2 C 0 0 0 0 0 $0 1 C 0 0 0 0 0 $0
0 0 0 0 0 $0 0 0 0 0 0 $0
AC Transit – Seminary1100 Seminary AvenueOakland, Ca 94603Permit No. 19526191Expires: 10/30/2021
4400 - Water TransportationEBMUD San Pablo Water Treatment Plant-RCO300 Berkeley Park BlvdKensington, CA 94607Permit No. 00690013Expires: N/A
Totals:
AC Transit – Seminary maintained consistent compliance in 2018.
Totals for Local And Suburban Transit:Totals:
EBMUD San Pablo Water Treatment maintained consistent compliance in 2018.
4950 - Sanitary Collection And DisposalTotals for Water Transportation:
EBMUD- East Bayshore Water Recycling Project2020 Wake AvenueOakland, CA 94623Permit No. 50620251Expires: N/A
Totals: Swissport Fueling Inc. Maintained consistent compliance in 2018.
Totals for Sanitary Collection And Disposal:
EBMUD-East Bayshore Water Recycling Project Treatment Facility maintained consistent compliance in 2018.
Swissport Fueling, Inc.1 Edward White WayOakland, CA 94621Permit No. 50652491Expires: N/A
Totals:
AC Transit – International maintained consistent compliance in 2018.AC Transit – International10626 International Blvd.Oakland, Ca 94603Permit No. 04391161Expires: 10/30/2021
Totals:
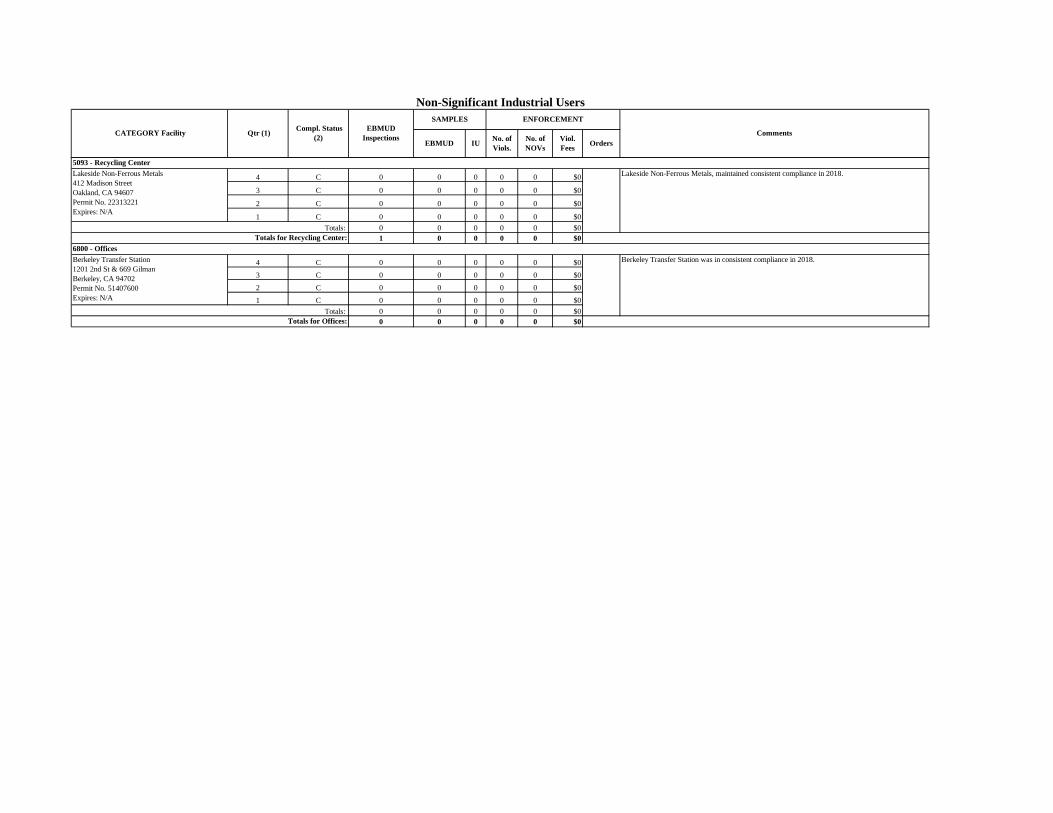
Non-Significant Industrial Users
Compl. Status (2)
EBMUD Inspections
ENFORCEMENT
No. of Viols.
No. of NOVs
Viol. Fees
SAMPLES
Comments EBMUD IU Orders
CATEGORY Facility Qtr (1)
4 C 0 0 0 0 0 $0
3 C 0 0 0 0 0 $0
2 C 0 0 0 0 0 $0
1 C 0 0 0 0 0 $0 0 0 0 0 0 $0 1 0 0 0 0 $0
4 C 0 0 0 0 0 $0 3 C 0 0 0 0 0 $0 2 C 0 0 0 0 0 $0 1 C 0 0 0 0 0 $0
0 0 0 0 0 $0 0 0 0 0 0 $0
Lakeside Non-Ferrous Metals, maintained consistent compliance in 2018.
Totals for Recycling Center:6800 - Offices
5093 - Recycling CenterLakeside Non-Ferrous Metals412 Madison StreetOakland, CA 94607Permit No. 22313221Expires: N/A
Totals:
Totals for Offices:
Berkeley Transfer Station was in consistent compliance in 2018.Berkeley Transfer Station 1201 2nd St & 669 Gilman Berkeley, CA 94702 Permit No. 51407600 Expires: N/A
Totals:
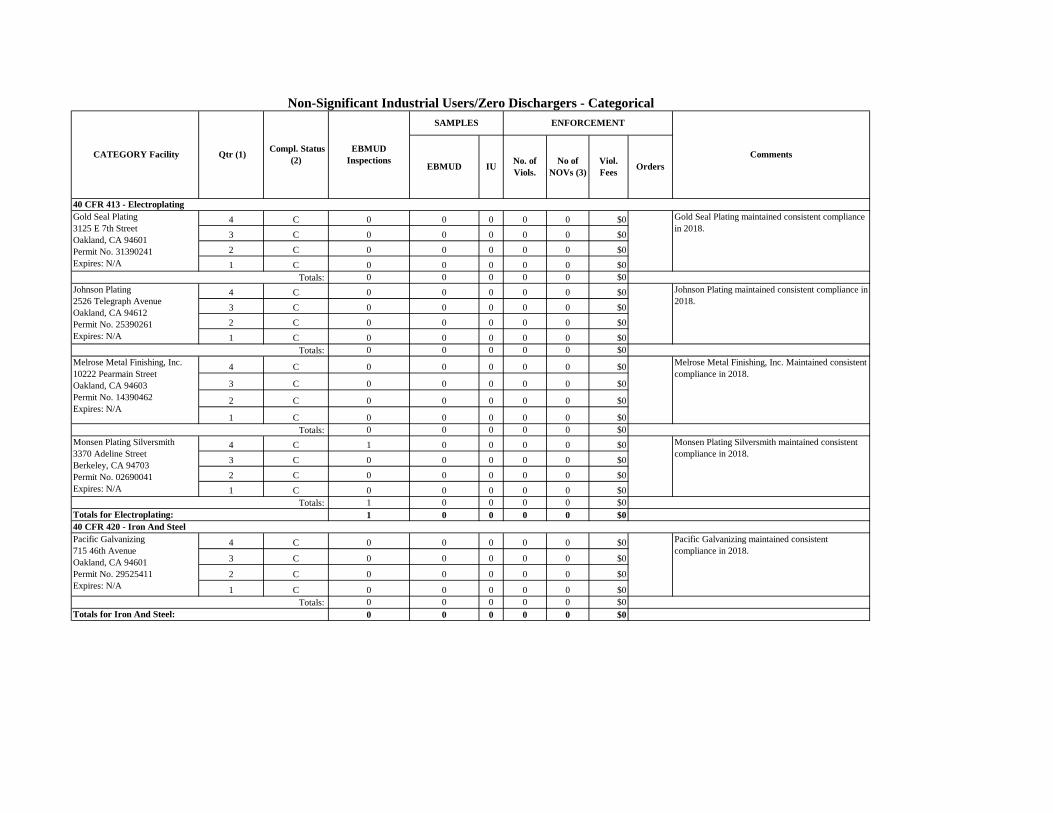
4 C 0 0 0 0 0 $0 3 C 0 0 0 0 0 $0 2 C 0 0 0 0 0 $0 1 C 0 0 0 0 0 $0
0 0 0 0 0 $0 4 C 0 0 0 0 0 $0 3 C 0 0 0 0 0 $0 2 C 0 0 0 0 0 $0 1 C 0 0 0 0 0 $0
0 0 0 0 0 $0
4 C 0 0 0 0 0 $0
3 C 0 0 0 0 0 $0
2 C 0 0 0 0 0 $0
1 C 0 0 0 0 0 $0 0 0 0 0 0 $0
4 C 1 0 0 0 0 $0 3 C 0 0 0 0 0 $0 2 C 0 0 0 0 0 $0 1 C 0 0 0 0 0 $0
1 0 0 0 0 $0 1 0 0 0 0 $0
4 C 0 0 0 0 0 $0
3 C 0 0 0 0 0 $0
2 C 0 0 0 0 0 $0
1 C 0 0 0 0 0 $0 0 0 0 0 0 $0 0 0 0 0 0 $0
No of NOVs (3)
Viol. Fees
ENFORCEMENT
40 CFR 413 - ElectroplatingGold Seal Plating3125 E 7th StreetOakland, CA 94601Permit No. 31390241Expires: N/A
Gold Seal Plating maintained consistent compliance in 2018.
SAMPLES
Comments EBMUD IU Orders
CATEGORY Facility Qtr (1) Compl. Status (2)
EBMUD Inspections No. of
Viols.
Johnson Plating2526 Telegraph AvenueOakland, CA 94612Permit No. 25390261Expires: N/A
Melrose Metal Finishing, Inc.10222 Pearmain StreetOakland, CA 94603Permit No. 14390462Expires: N/A
Monsen Plating Silversmith3370 Adeline StreetBerkeley, CA 94703Permit No. 02690041Expires: N/A
Monsen Plating Silversmith maintained consistent compliance in 2018.
Totals:
Totals:
Melrose Metal Finishing, Inc. Maintained consistent compliance in 2018.
Totals:
Johnson Plating maintained consistent compliance in 2018.
Totals:
Totals for Electroplating:40 CFR 420 - Iron And SteelPacific Galvanizing715 46th AvenueOakland, CA 94601Permit No. 29525411Expires: N/A
Pacific Galvanizing maintained consistent compliance in 2018.
Totals: Totals for Iron And Steel:
Non-Significant Industrial Users/Zero Dischargers - Categorical
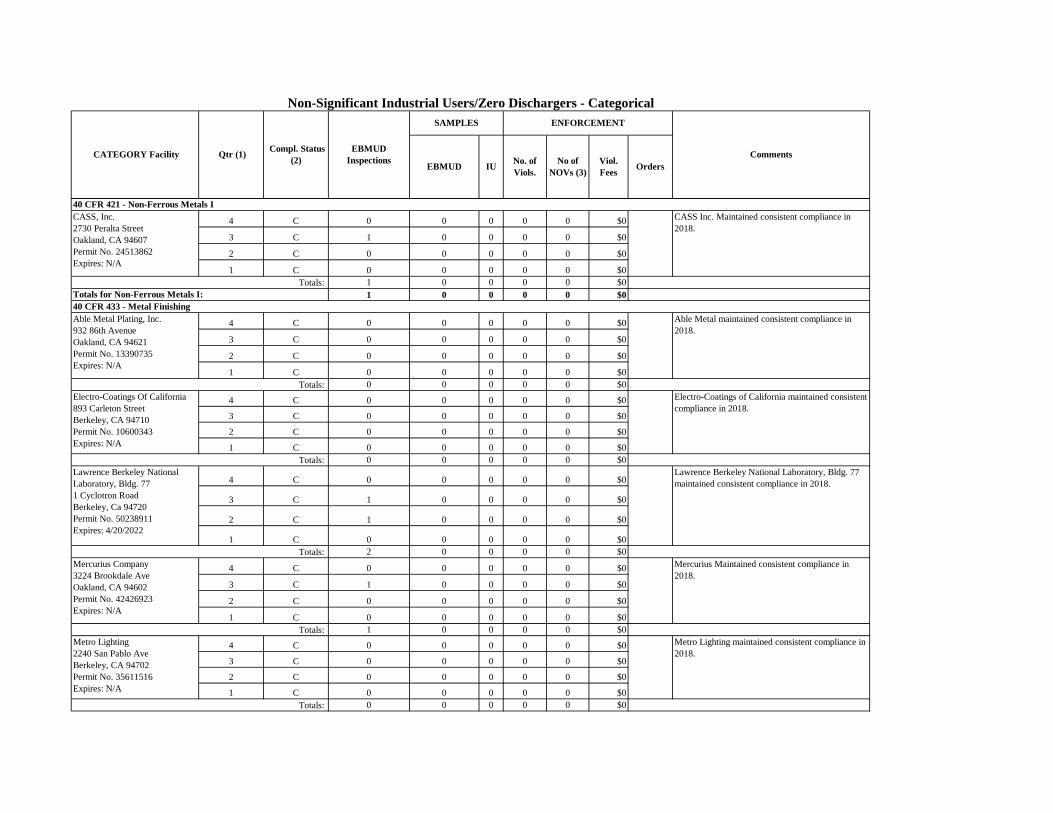
No of NOVs (3)
Viol. Fees
ENFORCEMENT SAMPLES
Comments EBMUD IU Orders
CATEGORY Facility Qtr (1) Compl. Status (2)
EBMUD Inspections No. of
Viols.
Non-Significant Industrial Users/Zero Dischargers - Categorical
4 C 0 0 0 0 0 $0
3 C 1 0 0 0 0 $0
2 C 0 0 0 0 0 $0
1 C 0 0 0 0 0 $0 1 0 0 0 0 $0 1 0 0 0 0 $0
4 C 0 0 0 0 0 $0
3 C 0 0 0 0 0 $0
2 C 0 0 0 0 0 $0
1 C 0 0 0 0 0 $0 0 0 0 0 0 $0
4 C 0 0 0 0 0 $0
3 C 0 0 0 0 0 $0
2 C 0 0 0 0 0 $0
1 C 0 0 0 0 0 $0 0 0 0 0 0 $0
4 C 0 0 0 0 0 $0
3 C 1 0 0 0 0 $0
2 C 1 0 0 0 0 $0
1 C 0 0 0 0 0 $0 2 0 0 0 0 $0
4 C 0 0 0 0 0 $0
3 C 1 0 0 0 0 $0
2 C 0 0 0 0 0 $0
1 C 0 0 0 0 0 $0 1 0 0 0 0 $0
4 C 0 0 0 0 0 $0
3 C 0 0 0 0 0 $0
2 C 0 0 0 0 0 $0
1 C 0 0 0 0 0 $0 0 0 0 0 0 $0
Totals for Non-Ferrous Metals I:40 CFR 433 - Metal Finishing
40 CFR 421 - Non-Ferrous Metals ICASS, Inc.2730 Peralta StreetOakland, CA 94607Permit No. 24513862Expires: N/A
CASS Inc. Maintained consistent compliance in 2018.
Totals:
Totals: Lawrence Berkeley National Laboratory, Bldg. 771 Cyclotron RoadBerkeley, Ca 94720Permit No. 50238911Expires: 4/20/2022
Lawrence Berkeley National Laboratory, Bldg. 77 maintained consistent compliance in 2018.
Totals:
Able Metal maintained consistent compliance in 2018.
Totals:
Able Metal Plating, Inc.932 86th AvenueOakland, CA 94621Permit No. 13390735Expires: N/A
Electro-Coatings Of California893 Carleton StreetBerkeley, CA 94710Permit No. 10600343Expires: N/A
Electro-Coatings of California maintained consistent compliance in 2018.
Mercurius Company3224 Brookdale AveOakland, CA 94602Permit No. 42426923Expires: N/A
Mercurius Maintained consistent compliance in 2018.
Totals: Metro Lighting2240 San Pablo AveBerkeley, CA 94702Permit No. 35611516Expires: N/A
Metro Lighting maintained consistent compliance in 2018.
Totals:
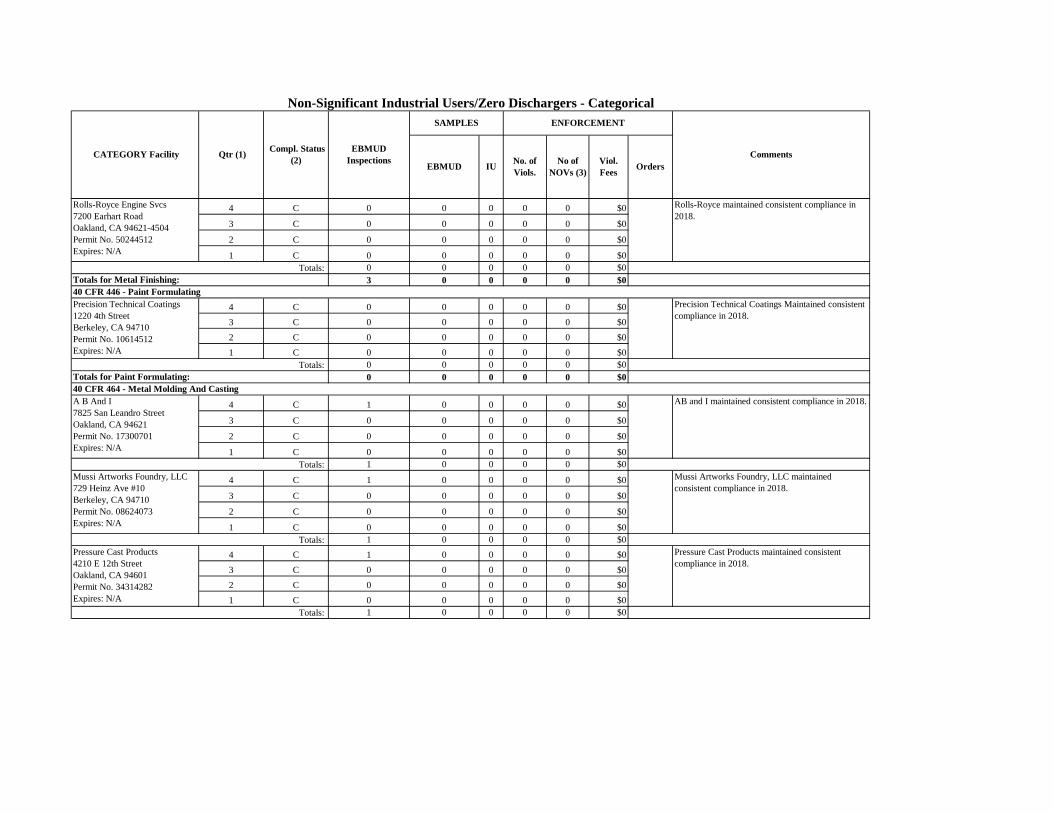
No of NOVs (3)
Viol. Fees
ENFORCEMENT SAMPLES
Comments EBMUD IU Orders
CATEGORY Facility Qtr (1) Compl. Status (2)
EBMUD Inspections No. of
Viols.
Non-Significant Industrial Users/Zero Dischargers - Categorical
4 C 0 0 0 0 0 $0
3 C 0 0 0 0 0 $0
2 C 0 0 0 0 0 $0
1 C 0 0 0 0 0 $0 0 0 0 0 0 $0 3 0 0 0 0 $0
4 C 0 0 0 0 0 $0 3 C 0 0 0 0 0 $0 2 C 0 0 0 0 0 $0 1 C 0 0 0 0 0 $0
0 0 0 0 0 $0 0 0 0 0 0 $0
4 C 1 0 0 0 0 $0
3 C 0 0 0 0 0 $0
2 C 0 0 0 0 0 $0
1 C 0 0 0 0 0 $0 1 0 0 0 0 $0
4 C 1 0 0 0 0 $0
3 C 0 0 0 0 0 $0
2 C 0 0 0 0 0 $0
1 C 0 0 0 0 0 $0 1 0 0 0 0 $0
4 C 1 0 0 0 0 $0 3 C 0 0 0 0 0 $0 2 C 0 0 0 0 0 $0 1 C 0 0 0 0 0 $0
1 0 0 0 0 $0
AB and I maintained consistent compliance in 2018.
Precision Technical Coatings Maintained consistent compliance in 2018.
Totals: Totals for Paint Formulating:40 CFR 464 - Metal Molding And Casting
Mussi Artworks Foundry, LLC maintained consistent compliance in 2018.
Totals: Pressure Cast Products4210 E 12th StreetOakland, CA 94601Permit No. 34314282Expires: N/A
Pressure Cast Products maintained consistent compliance in 2018.
Totals:
A B And I7825 San Leandro StreetOakland, CA 94621Permit No. 17300701Expires: N/A
Rolls-Royce Engine Svcs 7200 Earhart RoadOakland, CA 94621-4504Permit No. 50244512Expires: N/A
Rolls-Royce maintained consistent compliance in 2018.
Totals for Metal Finishing:Totals:
40 CFR 446 - Paint Formulating
Mussi Artworks Foundry, LLC729 Heinz Ave #10Berkeley, CA 94710Permit No. 08624073Expires: N/A
Precision Technical Coatings1220 4th StreetBerkeley, CA 94710Permit No. 10614512Expires: N/A
Totals:
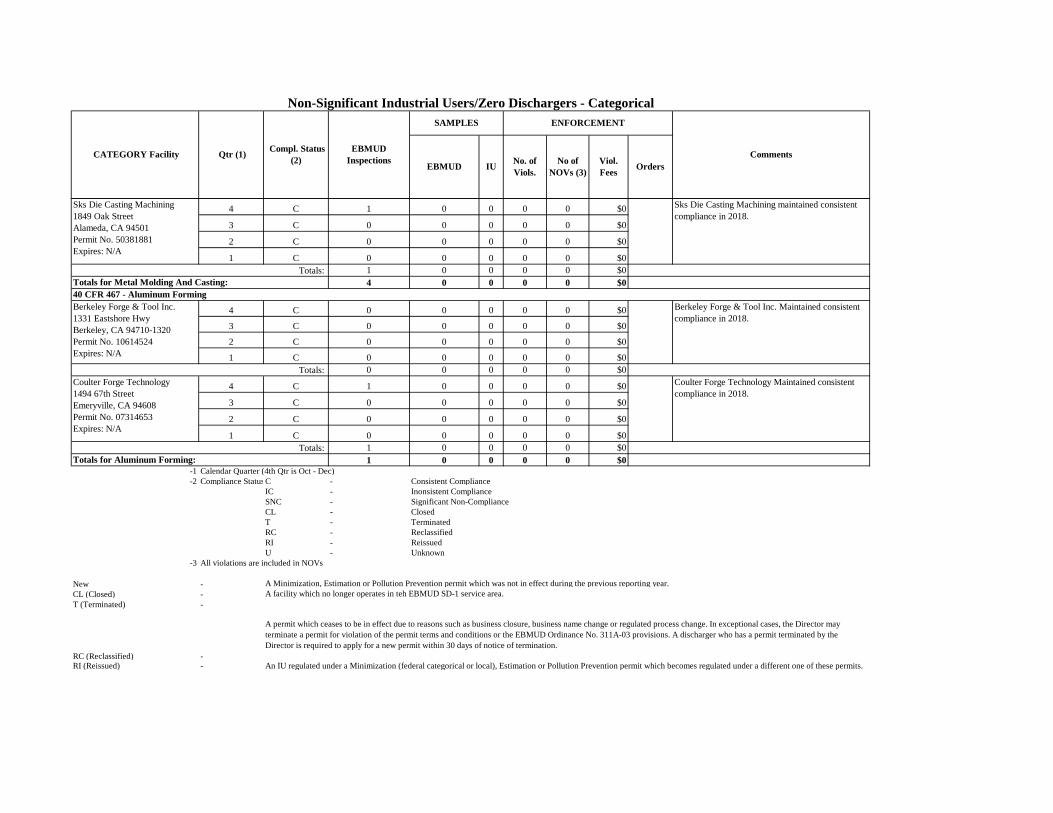
No of NOVs (3)
Viol. Fees
ENFORCEMENT SAMPLES
Comments EBMUD IU Orders
CATEGORY Facility Qtr (1) Compl. Status (2)
EBMUD Inspections No. of
Viols.
Non-Significant Industrial Users/Zero Dischargers - Categorical
4 C 1 0 0 0 0 $0
3 C 0 0 0 0 0 $0
2 C 0 0 0 0 0 $0
1 C 0 0 0 0 0 $0 1 0 0 0 0 $0 4 0 0 0 0 $0
4 C 0 0 0 0 0 $0
3 C 0 0 0 0 0 $0
2 C 0 0 0 0 0 $0
1 C 0 0 0 0 0 $0 0 0 0 0 0 $0
4 C 1 0 0 0 0 $0
3 C 0 0 0 0 0 $0
2 C 0 0 0 0 0 $0
1 C 0 0 0 0 0 $0 1 0 0 0 0 $0 1 0 0 0 0 $0
-1 Calendar Quarter (4th Qtr is Oct - Dec)-2 Compliance Status C - Consistent Compliance
IC - Inonsistent ComplianceSNC - Significant Non-ComplianceCL - ClosedT - TerminatedRC - ReclassifiedRI - ReissuedU - Unknown
-3 All violations are included in NOVs
New - A Minimization, Estimation or Pollution Prevention permit which was not in effect during the previous reporting year.CL (Closed) - A facility which no longer operates in teh EBMUD SD-1 service area.T (Terminated) -
RC (Reclassified) -RI (Reissued) - An IU regulated under a Minimization (federal categorical or local), Estimation or Pollution Prevention permit which becomes regulated under a different one of these permits.
40 CFR 467 - Aluminum Forming
A permit which ceases to be in effect due to reasons such as business closure, business name change or regulated process change. In exceptional cases, the Director may terminate a permit for violation of the permit terms and conditions or the EBMUD Ordinance No. 311A-03 provisions. A discharger who has a permit terminated by the Director is required to apply for a new permit within 30 days of notice of termination.
Totals:
Berkeley Forge & Tool Inc.1331 Eastshore HwyBerkeley, CA 94710-1320Permit No. 10614524Expires: N/A
Coulter Forge Technology1494 67th StreetEmeryville, CA 94608Permit No. 07314653Expires: N/A
Totals for Aluminum Forming:
Coulter Forge Technology Maintained consistent compliance in 2018.
Totals:
Berkeley Forge & Tool Inc. Maintained consistent compliance in 2018.
Sks Die Casting Machining1849 Oak StreetAlameda, CA 94501Permit No. 50381881Expires: N/A
Sks Die Casting Machining maintained consistent compliance in 2018.
Totals: Totals for Metal Molding And Casting:
375 Eleventh Street
Oakland, CA 94607
1-866-40-EBMUD
ebmud.com