Embed Size (px)
Citation preview
Vanguard Research September 2019
Prevailing myths and misconceptions of the active/passive decision in Canada
■ Assets in passive investment strategies have been on the rise for decades now globally and have been gaining momentum within Canada more recently.
■ Yet, despite the growth of passive investing in Canada, widespread myths and misconceptions of the decision to invest in an active or passive strategy remain common. In this research note, we explore seven of the most common myths and misconceptions and provide the empirical truth.
■ This list of common myths and misconceptions is not exhaustive and none of the analyses precludes success with active management for long-term, patient investors who can solve the low-cost, top-talent paradox.
Todd Schlanger, CFA
2
Introduction
Assets in passive investment strategies have been on the rise for decades now globally and have been gaining momentum within Canada more recently. For example, net cash flows into Canadian listed ETFs (which are mostly passive) outpaced active funds sales for the first time in ten years in 2018. This is relevant because although there are more similarities than differences between ETFs and mutual funds, it was the ETFs’ ease of distribution that brought passive investing to Canada in a significant way. The benefits of passive investing have been clear enough to the investing public that they have resulted in this shift in investor preferences. Yet, a number of prevailing myths and misconceptions of the active/passive decision are circulating within Canada.
Vanguard is uniquely suited to provide insight on the active/passive decision, with over $1.3 trillion (USD) in actively managed assets along with $4 trillion (USD) in passive strategies, making us one of the largest providers of active and passive strategies in the world. In this research note, we explore seven of the most common myths and misconceptions of the active/passive decision and provide the empirical truth. The list is far from exhaustive and none of the analysis precludes success with active management for long-term, patient investors who can solve the low-cost, top-
talent paradox. In fact, we believe that investors following our investment principles of having clear and appropriate goals, building balanced and diversified portfolios, minimizing the cost of investing, and maintaining long term perspective and discipline can achieve investment success with active, passive, or a combination of both investment strategies.
Myth #1: Why settle for ‘average’ performance?
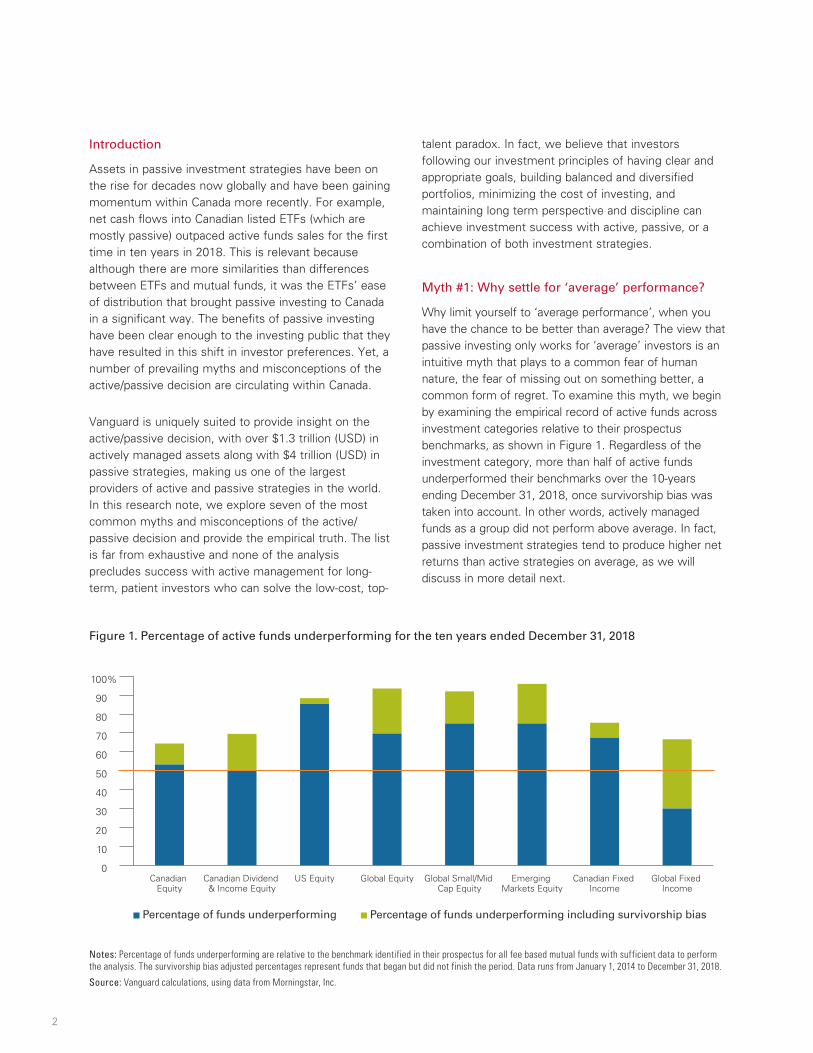
Why limit yourself to ‘average performance’, when you have the chance to be better than average? The view that passive investing only works for ‘average’ investors is an intuitive myth that plays to a common fear of human nature, the fear of missing out on something better, a common form of regret. To examine this myth, we begin by examining the empirical record of active funds across investment categories relative to their prospectus benchmarks, as shown in Figure 1. Regardless of the investment category, more than half of active funds underperformed their benchmarks over the 10-years ending December 31, 2018, once survivorship bias was taken into account. In other words, actively managed funds as a group did not perform above average. In fact, passive investment strategies tend to produce higher net returns than active strategies on average, as we will discuss in more detail next.
Figure 1. Percentage of active funds underperforming for the ten years ended December 31, 2018
0
10
20
30
40
50
60
70
80
90
100%
Global Fixed Income
Canadian Fixed Income
Emerging Markets Equity
Global Small/Mid Cap Equity
Global EquityUS EquityCanadian Dividend & Income Equity
Canadian Equity
Percentage of funds underperforming Percentage of funds underperforming including survivorship bias
Notes: Percentage of funds underperforming are relative to the benchmark identified in their prospectus for all fee based mutual funds with sufficient data to perform the analysis. The survivorship bias adjusted percentages represent funds that began but did not finish the period. Data runs from January 1, 2014 to December 31, 2018.
Source: Vanguard calculations, using data from Morningstar, Inc.
3
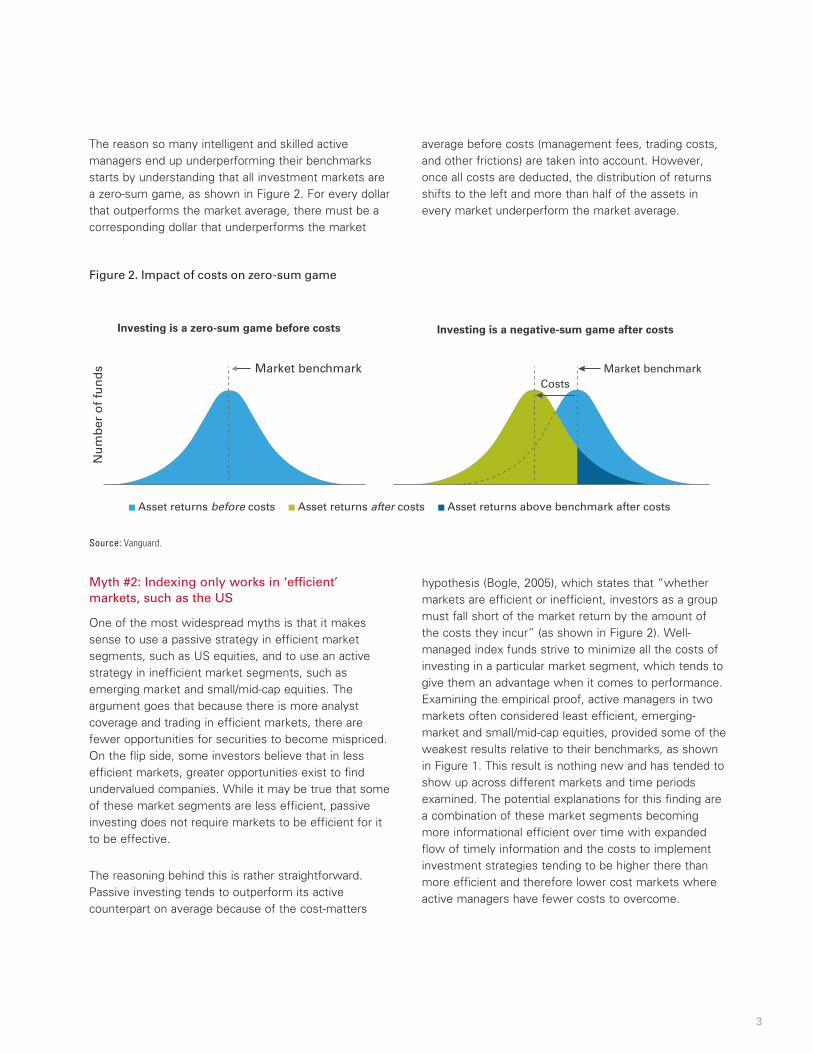
The reason so many intelligent and skilled active managers end up underperforming their benchmarks starts by understanding that all investment markets are a zero-sum game, as shown in Figure 2. For every dollar that outperforms the market average, there must be a corresponding dollar that underperforms the market
average before costs (management fees, trading costs, and other frictions) are taken into account. However, once all costs are deducted, the distribution of returns shifts to the left and more than half of the assets in every market underperform the market average.
Figure 2. Impact of costs on zero-sum game
Asset returns before costs Asset returns after costs Asset returns above benchmark after costs
Investing is a zero-sum game before costs Investing is a negative-sum game after costs
Nu
mb
er o
f fu
nd
s Market benchmark Market benchmarkCosts
Source: Vanguard.
Myth #2: Indexing only works in ‘efficient’ markets, such as the US
One of the most widespread myths is that it makes sense to use a passive strategy in efficient market segments, such as US equities, and to use an active strategy in inefficient market segments, such as emerging market and small/mid-cap equities. The argument goes that because there is more analyst coverage and trading in efficient markets, there are fewer opportunities for securities to become mispriced. On the flip side, some investors believe that in less efficient markets, greater opportunities exist to find undervalued companies. While it may be true that some of these market segments are less efficient, passive investing does not require markets to be efficient for it to be effective.
The reasoning behind this is rather straightforward. Passive investing tends to outperform its active counterpart on average because of the cost-matters
hypothesis (Bogle, 2005), which states that “whether markets are efficient or inefficient, investors as a group must fall short of the market return by the amount of the costs they incur” (as shown in Figure 2). Well-managed index funds strive to minimize all the costs of investing in a particular market segment, which tends to give them an advantage when it comes to performance. Examining the empirical proof, active managers in two markets often considered least efficient, emerging-market and small/mid-cap equities, provided some of the weakest results relative to their benchmarks, as shown in Figure 1. This result is nothing new and has tended to show up across different markets and time periods examined. The potential explanations for this finding are a combination of these market segments becoming more informational efficient over time with expanded flow of timely information and the costs to implement investment strategies tending to be higher there than more efficient and therefore lower cost markets where active managers have fewer costs to overcome.

4
Myth #3: The bond markets provide better opportunities for active managers than the equity markets
Related to the inefficient markets myth, but worthy of its own separate mention is that active managers perform better in the bond markets than the equity markets. The argument goes that because bond markets trade over the counter and are generally less efficient, they provide more fertile ground for active managers to exploit opportunities and outperform their benchmarks. The myth has appealing intuition and in some time periods may appear true as commonly used prospectus benchmarks tend to be heavily weighted toward government securities, while active managers tend to overweight higher yielding bonds with lower credit ratings or exposure to emerging markets, creating an opportunity to outperform when these segments are in favor. However, once these risk factors are taken into account, this apparent advantage disappears completely for the average bond manager (Roberts et al, 2018). Credit sensitive bonds also tend to outperform over long periods of time periods and different market cycles, while they can underperform significantly in periods of market stress and return much of their outperformance. Therefore, even with the mismeasurement issues between the average active bond fund and its benchmark we discussed, outperformance relative to their prospectus benchmark cannot be assumed. Referring back to Figure 1 to examine the empirical results, 67% of Canadian fixed income funds underperformed their prospectus benchmark by a median excess return of -82 basis points and 75% underperformed once survivorship bias was taken into account. Within the global fixed income category, we found similar but more nuanced results as 70% of
surviving funds outperformed their prospectus benchmarks by a median of +49 basis points. However, this category had a disproportionate number of funds that closed over the period (either liquidated or merged) and once survivorship bias was taken into account, the results looked similar to Canadian fixed income with only 33% of funds that began the period going on to outperform their prospectus benchmark.
Myth #4: You get what you pay for: Price = Quality
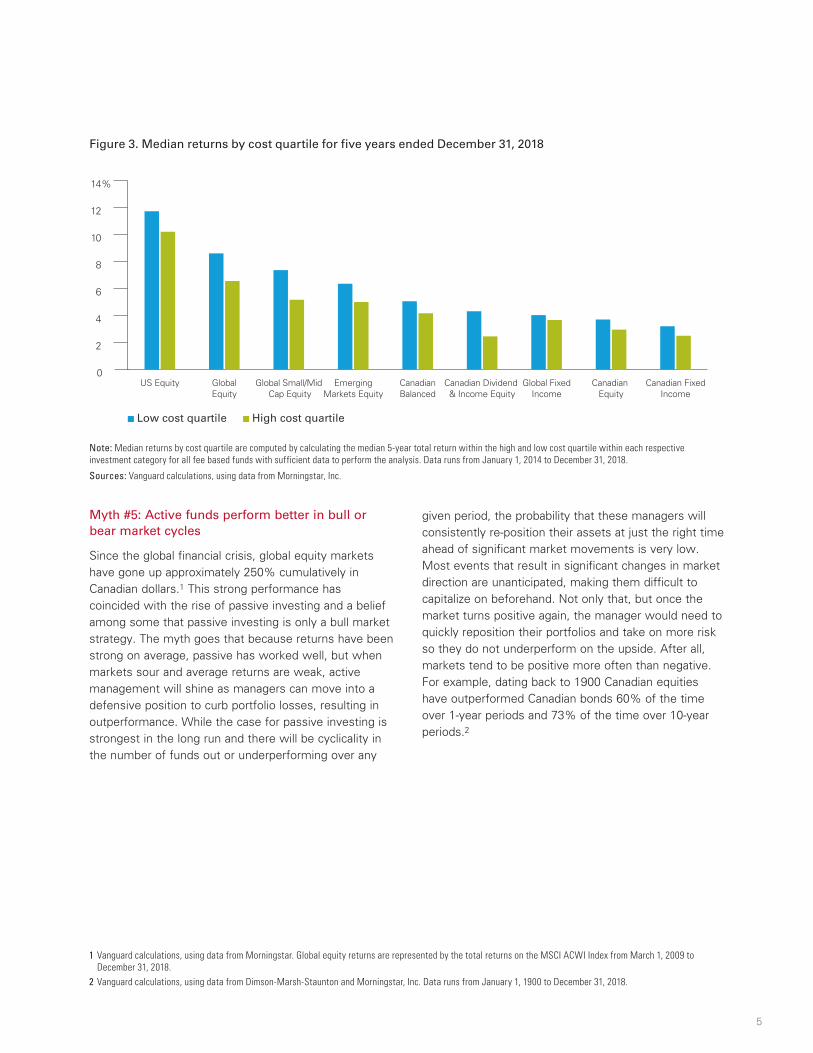
The “higher the price, the better the product” myth is another intuitive, everyday rule of thumb that tends to work well in many areas for consumers but falls short when it comes to investing. The reality is that with investing, this seemingly common-sense relationship is reversed—you often get more for what you don’t pay for and higher performance is typically associated with lower cost investments. Figure 3 demonstrates this by displaying the relative performance of both active and passive funds across investment categories for the five years through December 31, 2018, grouped by cost quartile. In each instance, the lower-cost group outperformed the higher-cost group. The explanation for this relationship is rather straightforward, every dollar of cost incurred is a dollar deducted from the net return of the investment. Given this relationship holds across both active and passive funds is more proof that the decision to invest in a high or low cost investment is more important than the decision to invest in an active or passive investment.
5
Figure 3. Median returns by cost quartile for five years ended December 31, 2018
Low cost quartile High cost quartile
0
2
4
6
8
10
12
14%
Canadian FixedIncome
Canadian Equity
Global FixedIncome
Canadian Dividend & Income Equity
CanadianBalanced
EmergingMarkets Equity
Global Small/Mid Cap Equity
GlobalEquity
US Equity
Note: Median returns by cost quartile are computed by calculating the median 5-year total return within the high and low cost quartile within each respective investment category for all fee based funds with sufficient data to perform the analysis. Data runs from January 1, 2014 to December 31, 2018.
Sources: Vanguard calculations, using data from Morningstar, Inc.
Myth #5: Active funds perform better in bull or bear market cycles
Since the global financial crisis, global equity markets have gone up approximately 250% cumulatively in Canadian dollars.1 This strong performance has coincided with the rise of passive investing and a belief among some that passive investing is only a bull market strategy. The myth goes that because returns have been strong on average, passive has worked well, but when markets sour and average returns are weak, active management will shine as managers can move into a defensive position to curb portfolio losses, resulting in outperformance. While the case for passive investing is strongest in the long run and there will be cyclicality in the number of funds out or underperforming over any
given period, the probability that these managers will consistently re-position their assets at just the right time ahead of significant market movements is very low. Most events that result in significant changes in market direction are unanticipated, making them difficult to capitalize on beforehand. Not only that, but once the market turns positive again, the manager would need to quickly reposition their portfolios and take on more risk so they do not underperform on the upside. After all, markets tend to be positive more often than negative. For example, dating back to 1900 Canadian equities have outperformed Canadian bonds 60% of the time over 1-year periods and 73% of the time over 10-year periods.2
1 Vanguard calculations, using data from Morningstar. Global equity returns are represented by the total returns on the MSCI ACWI Index from March 1, 2009 to December 31, 2018.
2 Vanguard calculations, using data from Dimson-Marsh-Staunton and Morningstar, Inc. Data runs from January 1, 1900 to December 31, 2018.
6
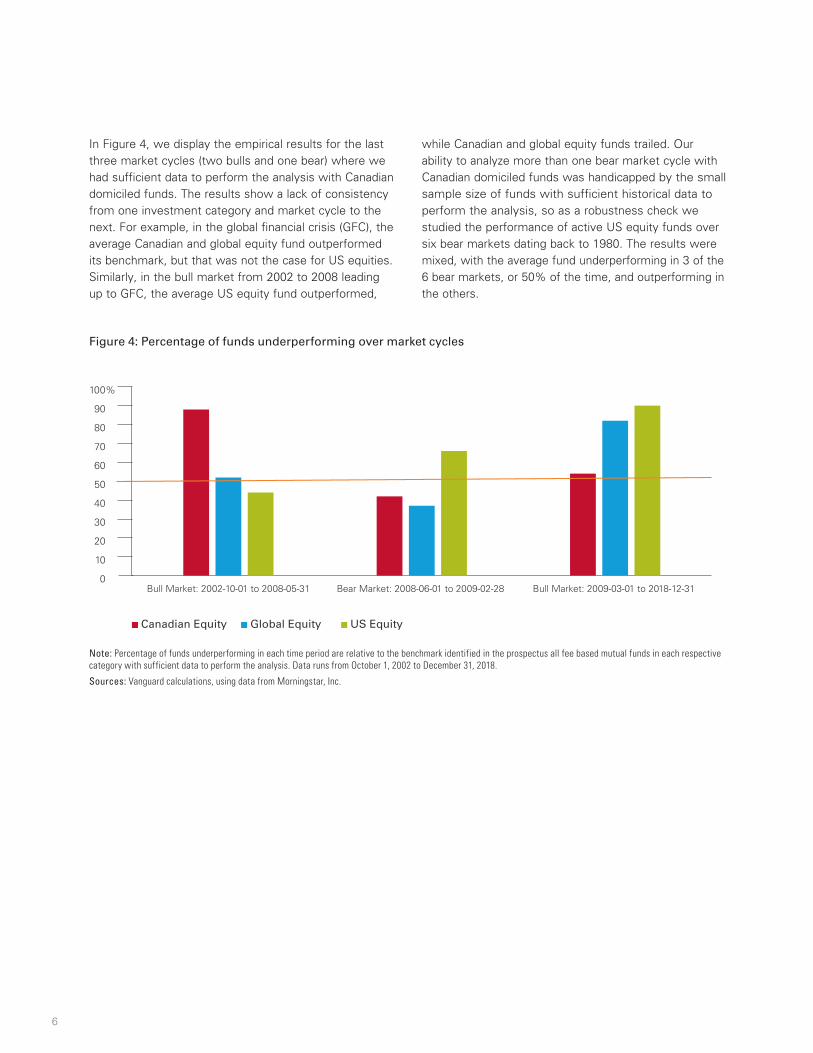
In Figure 4, we display the empirical results for the last three market cycles (two bulls and one bear) where we had sufficient data to perform the analysis with Canadian domiciled funds. The results show a lack of consistency from one investment category and market cycle to the next. For example, in the global financial crisis (GFC), the average Canadian and global equity fund outperformed its benchmark, but that was not the case for US equities. Similarly, in the bull market from 2002 to 2008 leading up to GFC, the average US equity fund outperformed,
while Canadian and global equity funds trailed. Our ability to analyze more than one bear market cycle with Canadian domiciled funds was handicapped by the small sample size of funds with sufficient historical data to perform the analysis, so as a robustness check we studied the performance of active US equity funds over six bear markets dating back to 1980. The results were mixed, with the average fund underperforming in 3 of the 6 bear markets, or 50% of the time, and outperforming in the others.
Figure 4: Percentage of funds underperforming over market cycles
Canadian Equity Global Equity US Equity
0
10
20
30
40
50
60
70
80
90
100%
Bull Market: 2009-03-01 to 2018-12-31 Bear Market: 2008-06-01 to 2009-02-28 Bull Market: 2002-10-01 to 2008-05-31
Note: Percentage of funds underperforming in each time period are relative to the benchmark identified in the prospectus all fee based mutual funds in each respective category with sufficient data to perform the analysis. Data runs from October 1, 2002 to December 31, 2018.
Sources: Vanguard calculations, using data from Morningstar, Inc.
7
Myth #6: The more concentrated the portfolio is in the portfolio managers “best ideas,” the better the performance
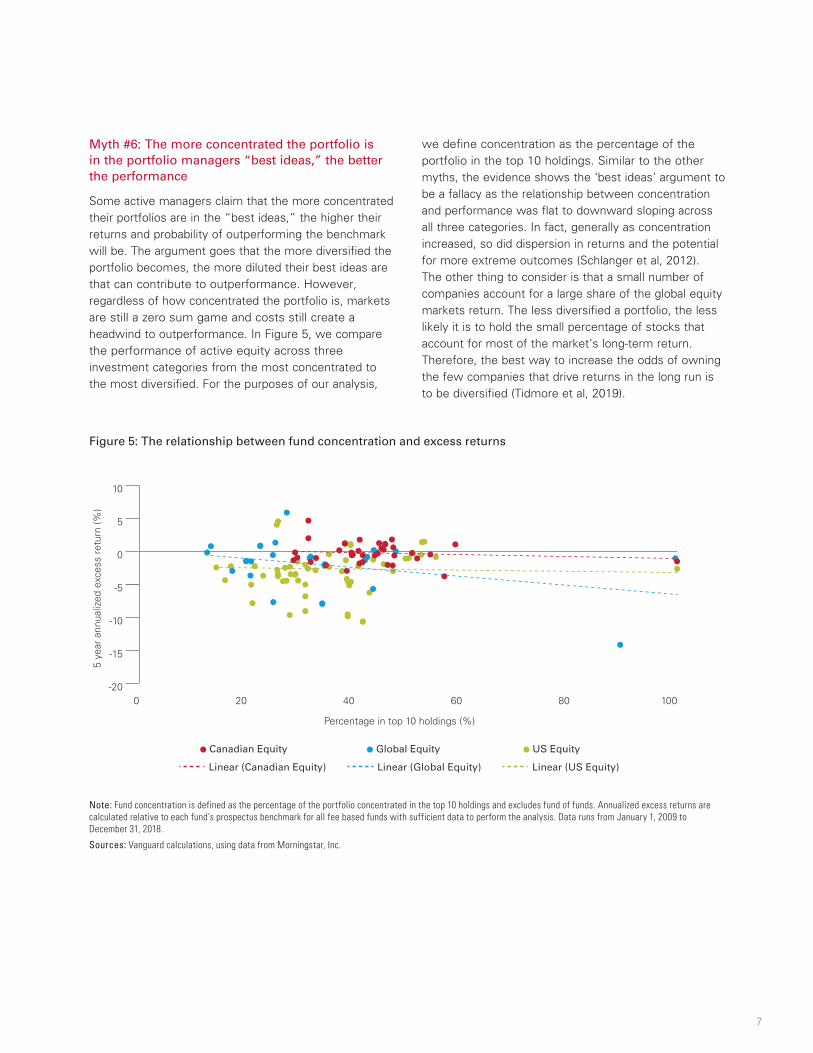
Some active managers claim that the more concentrated their portfolios are in the “best ideas,” the higher their returns and probability of outperforming the benchmark will be. The argument goes that the more diversified the portfolio becomes, the more diluted their best ideas are that can contribute to outperformance. However, regardless of how concentrated the portfolio is, markets are still a zero sum game and costs still create a headwind to outperformance. In Figure 5, we compare the performance of active equity across three investment categories from the most concentrated to the most diversified. For the purposes of our analysis,
we define concentration as the percentage of the portfolio in the top 10 holdings. Similar to the other myths, the evidence shows the ‘best ideas’ argument to be a fallacy as the relationship between concentration and performance was flat to downward sloping across all three categories. In fact, generally as concentration increased, so did dispersion in returns and the potential for more extreme outcomes (Schlanger et al, 2012). The other thing to consider is that a small number of companies account for a large share of the global equity markets return. The less diversified a portfolio, the less likely it is to hold the small percentage of stocks that account for most of the market’s long-term return. Therefore, the best way to increase the odds of owning the few companies that drive returns in the long run is to be diversified (Tidmore et al, 2019).
Figure 5: The relationship between fund concentration and excess returns
Canadian Equity
Linear (Canadian Equity)
US Equity
Linear (US Equity)
Global Equity
Linear (Global Equity)
Percentage in top 10 holdings (%)
5 ye
ar a
nnua
lized
exc
ess
retu
rn (%
)
Note: Fund concentration is defined as the percentage of the portfolio concentrated in the top 10 holdings and excludes fund of funds. Annualized excess returns are calculated relative to each fund’s prospectus benchmark for all fee based funds with sufficient data to perform the analysis. Data runs from January 1, 2009 to December 31, 2018.
Sources: Vanguard calculations, using data from Morningstar, Inc.
8
Myth #7: Passive investing is better than active investing
So far, we have discussed mostly myths and misconceptions that claim the superiority of active investing over passive investing based on certain variables, such as by investment category, within a certain market cycle, based on the management expense ratio, or the concentration of the portfolio. There are, however, also myths and misconceptions that claim the superiority of passive investing over active investing. There is no universal case for passive investing as not all indexes are diversified and low cost. Alternatively, not all active funds are high cost and concentrated. Therefore, you cannot conclude that passive investing is better than active investing because some active funds share similar characteristics to passive funds (low costs, diversified, disciplined) that explain their performance advantage, on average. Ultimately, to be successful with active management an investor needs to solve the low-cost, top-talent
paradox and be patient with a talented manager, once found, to reap the long-run rewards. While the theory and results discussed provide a strong case for using passive strategies, they do not rule out the potential for success with active management, as the main impediment to outperformance is the cost of implementing the investment strategy. Research has shown that by focusing on active managers with a high degree of skill relative to their peers who execute their strategies at a low relative cost, an investor can increase their chances of achieving long-term outperformance with active management (Wallick et al, 2015). The track record of Vanguard active equity funds demonstrates that success for investors adhering to these principles is achievable, having outperformed their benchmarks by +66 basis points on an asset weighted basis and +29 basis points on an equally weighted basis over the 30-year period ending December 31, 2018.

9
Conclusion
In this research note, we provided the theoretical and empirical evidence to show that seven of the most common myths and misconceptions of the active/passive decision circling within Canada are fallacies. This list is far from exhaustive and none of the analysis precludes success with active management for patient, long term investors who can solve the top talent, low cost paradox. Our goal in providing this analysis is to help better inform Canadian investors so that they do not make their investment decisions based on these prevailing myths and misconceptions and instead focus
on the key drivers of long-term investment success, such as having clear investment goals, building balance and diversified portfolios, keeping implementation costs low, and maintaining long-term discipline with their approach. We believe that investors following these principles can achieve investment success with active, passive, or a combination of both investment strategies. As a client owned Investment Company and one of the largest providers of both active and passive investment strategies in the world, we believe we are uniquely positioned to provide this perspective.

10
References
Bogle, John C., 2005. “The Relentless Rules of Humble Arithmetic. In Bold Thinking on Investment Management” The FAJ 60th Anniversary Anthology. Charlottesville, Va.: CFA Institute, 127-43.
Philips, Christopher B., and Francis M. Kinniry Jr., 2010. “Mutual Fund Ratings and Future Performance.” Valley Forge, Pa.: The Vanguard Group.
Philips, Christopher B., Francis M. Kinniry Jr., David J. Walker, and Charles J. Thomas, 2011. “A Review of Alternative Approaches to Equity Indexing.” Valley Forge, Pa.: The Vanguard Group.
Philips, Christopher B., Francis M. Kinniry Jr., Joshua M. Hirt, and Todd Schlanger, 2014. “The Case for Index-Fund Investing.” Valley Forge, Pa.: The Vanguard Group.
Roberts, Daren, Thomas Paradise, and Chris Tidmore, 2018. “Global active bond fund returns: A factor decomposition.” Valley Forge, Pa.: The Vanguard Group.
Schlanger, Todd, Christopher B. Philips, and Karin Peterson LaBarge, 2011. “The search for outperformance: Evaluating ‘active share.’” Valley Forge, Pa.: The Vanguard Group.
Sharpe, William F., 1991. “The Arithmetic of Active Management.” Financial Analysts Journal 47(1): 7–9.
Thomas, Charles J., and Donald G. Bennyhoff, 2012. “A Review of Alternative Approaches to Fixed Income Indexing.” Valley Forge, Pa.: The Vanguard Group.
Tidmore, Chris, Francis M. Kinniry Jr., Giulio Renzi, and Edoardo Cila, 2019. “How to increase the odds of owning the few stocks that drive returns.” Valley Forge, Pa.: The Vanguard Group.
Wallick,Daniel, W., Brian R. Wimmer, and James Balsamo, 2015. “Keys to improving the odds of active management success.” Valley Forge, Pa.: The Vanguard Group.


The views expressed in this material are based on the author’s assessment as of the first publication date in August 2019, and are subject to change without notice and may not represent the views and/or opinions of Vanguard Investments Canada Inc. The authors may not necessarily update or supplement their views and opinions whether as a result of new information, changing circumstances, future events or otherwise. Any “forward-looking” information contained in this material should be construed as general investment or market information and no representation is being made that any investor will, or is likely to achieve, returns similar to those mentioned in this material or anticipated in this material.
While this information has been compiled from sources believed to be reliable, Vanguard Investments Canada Inc. does not guarantee the accuracy, completeness, timeliness or reliability of this information or any results from its use. Information, figures and charts are summarized for illustrative purposes only and are subject to change without notice.
In this material, references to “Vanguard” are provided for convenience only and may refer to, where applicable, only The Vanguard Group, Inc., and/or may include its affiliates, including Vanguard Investments Canada Inc.
This material is for informational purposes only. This material is not intended to be relied upon as research, investment, or tax advice and is not an implied or express recommendation, offer or solicitation to buy or sell any security or to adopt any particular investment or portfolio strategy. Any views and opinions expressed do not take into account the particular investment objectives, needs, restrictions and circumstances of a specific investor and, thus, should not be used as the basis of any specific investment recommendation. Please consult your financial and/or tax advisor for financial and/or tax information applicable to your specific situation.
Connect with Vanguard® > vanguardcanada.ca
© 2019 Vanguard Investments Canada Inc. All rights reserved.
WP7M_CA 092019