Embed Size (px)
Citation preview
Prevailing Wage Rates in Minnesota
An Examination of Alternative Calculation Methods and Their Effects on Public Construction Wages
Minnesota Taxpayers Association
February 2005

Acknowledgements
We wish to thank the Minnesota Departments of Labor and Industry and Employment and Economic Development for information provided on prevailing wage rates and median wage rates that were used in the preparation of this report. Aaron Twait, MTA Research Associate, did most of the research, calculations, and initial drafting of the report. Lynn Reed, MTA Executive Director, did the final editing for publication. The research for this report was funded entirely by the Associated Builders and Contractors of Minnesota. MTA is solely responsible for the research, analysis, conclusions, and recommendations contained in this report.
About the Minnesota Taxpayers Association
The Minnesota Taxpayers Association did most of the research and analysis for this study in cooperation with other members of the NTC (see below). MTA was founded in 1926 for the purpose of disseminating factual information that will educate and inform all Minnesotans about Minnesota tax and spending policies. For over seventy-five years, the Association has advocated for the adoption of sound fiscal policies through its research efforts, publications, and meetings. The Association is a non-profit, non-partisan group supported by membership dues. For information about membership, call (651) 224-7477, or visit our web site at www.mntax.org.


Table of Contents
I. EXECUTIVE SUMMARY............................................................................................................. I Purpose and Objectives of the Study ................................................................................................ i Methodology of the Study................................................................................................................. i Analysis............................................................................................................................................ ii
Comparison of Minnesota Law to other State and Federal Prevailing Wage Statutes ..... ii Labor Cost Comparison Between Current Law and Alternatives ..................................... ii
Recommendations ........................................................................................................................... iii II. BACKGROUND AND POLICY PROBLEM ............................................................................. 1
Policy Problem—Why This Study? ................................................................................................. 4 III. METHODOLOGY......................................................................................................................... 5
Public Construction Projects ............................................................................................................ 5 Estimates of Public Construction Project Wage Costs..................................................................... 5 Sources for Prevailing Wage Data ................................................................................................... 6 Estimates of Labor Inputs ................................................................................................................ 7 Matching Job Classification Categories ........................................................................................... 7 Comparison Between State Prevailing Wage, Federal Prevailing Wage and Median Wage........... 8 Data Limitations............................................................................................................................... 8
IV. ANALYSIS AND INTERPRETATION ...................................................................................... 9 Comparison Between Current Law and Federal Prevailing Wage Determinations ......................... 9 Comparison Between Current Law and Median Wage Determinations ........................................ 13 Corroboration by Other Studies ..................................................................................................... 15
V. RECOMMENDATIONS............................................................................................................. 17
VI. APPENDIX A: PROJECTS ANALYZED IN COURSE OF STUDY.................................... 19
VII. APPENDIX B: DEED PLANNING AREAS AND MINNESOTA HIGHWAY/HEAVY PREVAILING WAGE REGIONS, BY COUNTY ................................................................... 30
VIII. APPENDIX C: BRIEF SURVEY OF OTHER STATES' PREVAILING WAGE LAWS ........................................................................................................................................................ 31
IX. APPENDIX D: EXAMPLES OF INDIVIDUAL PROJECT SAVINGS OR COST ............. 33

Prevailing Wage Rates in Minnesota, Minnesota Taxpayers Association
i
I. Executive Summary
Purpose and Objectives of the Study Prevailing wage laws govern much of the public construction in the United States. They require contractors constructing buildings involving the federal or Minnesota state governments to pay government-designated wage and benefit rates that are “prevailing” in the area in which the construction is occurring. The wage and benefit rates for each job classification (electrician, carpenter, roofer, et cetera) are determined independent of each other. Such laws have been in force at the federal level since 1931, and in Minnesota since 1973. Although citizens may equate “prevailing wage” with “average wage”, this is not always the case. In many cases, the government-determined prevailing wage is 30 to 40 percent higher than the wages paid to an average laborer undertaking the same work on a job which is not subject to the prevailing wage requirements. The federal law was instituted during the nation’s Great Depression primarily as a method of protecting local laborers from cheaper imported labor. Proponents of prevailing wage laws also believe it improves the quality of construction, but evaluating that claim is not the purpose of this study. This study focuses on the more narrow question of the direct fiscal impact of such laws on public construction expenditures. This study was funded by the Associated Builders and Contractors, Inc. of Minnesota, an association of mostly non-union builders and contractors and has two main parts: 1. History and overview: a synopsis of the history of prevailing wage laws, both federally
and in Minnesota, to present the arguments made for and against prevailing wage legislation, and to describe the unique features of Minnesota’s prevailing wage statutes as compared with similar state and federal legislation.
2. Analysis of labor costs under different prevailing wage scenarios: compiles a list of
state public construction projects in Minnesota subject to prevailing wage legislation, and evaluates changes in labor costs for those projects when substituting federal prevailing wage rates and government-determined median wage rates for Minnesota’s current prevailing wage rates.
Methodology of the Study A list of school, state, and state transportation construction projects approved in calendar year 2002 was compiled from the Minnesota Department of Education, the 2002 Capital Investment Bill, and the Minnesota Department of Transportation. Using data from the Minnesota Department of Labor and Industry, the federal Department of Labor and the Minnesota Department of Employment and Economic Development (DEED), we estimated each job classification’s share of the labor undertaken on projects on a county-by-county basis. MTA staff then compared labor costs given current prevailing wage rates to estimated labor costs if federal prevailing wage rates or DEED-determined median wages were substituted.

Executive Summary
ii
Analysis Comparison of Minnesota Law to other State and Federal Prevailing Wage Statutes As part of the study, Minnesota Associated Builders and Contractors surveyed states to update the national Associated Builders and Contractors’ 1995 prevailing wage study. This information indicated that 32 states and the federal government currently have prevailing wage laws, although nine other states have had prevailing wage laws in the past which have been repealed. Prevailing wage determinations in the 32 states are made in one of four ways:
1. by adopting the federal prevailing wage determinations, 2. by empowering a state official or officials to determine the rates, 3. by adopting collectively bargained rates, 4. by surveying to set prevailing wage rates (the method used by the federal
government). Minnesota employs the fourth option using survey information to derive the prevailing wage. However, Minnesota (and California) law does differ from the Davis-Bacon Act, and from most other state prevailing wage laws which average survey data, in one major respect. Most states and the federal government use two approaches to calculate the prevailing wage. If more than half of the workers in a survey are paid the same wage, then that wage is used. If no majority emerges, then an average is used. Minnesota and California, however, are unique in using a modal calculation: whatever rate is most frequently reported in a survey is the rate designated as “prevailing”. Given a class of workers with five survey responses of hourly wages of $7.00, $9.00, $12.00, $12.00 and $13.00, Minnesota would set the prevailing wage at $12.00 (the mode—that most frequently reported); while many other states and the federal government would set the prevailing wage at $10.60 (the average of the five salaries, since a majority did not emerge). The use of the modal method for determining prevailing wage increases the likelihood that large-scale collectively-bargained wage rates become the prevailing wage, since these rates tend to be uniform within a specific job class.
Labor Cost Comparison Between Current Law and Alternatives This study incorporated 34 school district construction projects (excluding land purchases), 57 state building projects and 247 state transportation projects, with total project costs of over $1.7 billion. From an analysis of the labor costs associated with the different alternatives, we found that:
o In 26 of the 32 counties which state building projects were located, federal prevailing wage rates were set entirely from union rates
o In 17 of the 82 counties in which state transportation projects were located, federal prevailing wage rates were set entirely from union rates
o Minnesota would have experienced estimated additional costs of $3.1 to $8.7 million, or 0.2% to 0.5% of total project cost, if the state substituted the federal rates for current state prevailing wage rates
o In 64 of the 82 counties in which state transportation projects were located, federal prevailing wage rates were 5 years old or older, likely depressing the estimated costs of substituting the federal prevailing wage rates
o Minnesota would have experienced estimated savings of $126 to $171 million, or 7.4% to 10.0% of total project costs in 2002 if the state had

Prevailing Wage Rates in Minnesota, Minnesota Taxpayers Association
iii
substituted the Department of Employment and Economic Development median wage rates for current state prevailing wage rates (assuming benefits at 22% of the reported median wages)
Recommendations Minnesota’s modal method of determining prevailing wages for public construction projects is used only in one other state, California. It results in wage rates significantly higher than those reported by DEED in its median wage survey. Using the federal method for calculating prevailing wage rates would add even more cost to public construction projects, apparently because of the limited number of federal projects and limited federal survey data in Minnesota. The term “prevailing wage” itself connotes a wage that is typical of an area, and is most likely commonly understood as an average wage by the general public. However, its application in Minnesota results in prevailing wage rates that are not reflective of typical wage rates. The primary purpose of “Little Davis-Bacon” laws is to protect local workers from cheap, imported labor, and as long as the wage rates that are used are truly “prevailing” (that is, typical of an area), that purpose does not seem to be threatened regardless of the methodology used to calculate those rates. The claim by proponents of the current method of calculating Minnesota’s prevailing wage rates that buildings are constructed more quickly and with better quality cannot be evaluated in a study like this of such limited scope. However, our underlying assumption is that contract specifications, penalty provisions for delays, and aggressive construction management can provide at the very least an equally effective alternative method for addressing timing and quality issues for public construction projects. In view of these observations, MTA recommends: • that the widely used DEED survey for median wages be used as an alternative definition
of prevailing wage for public construction projects in Minnesota; • that DEED develop a survey comparable to the median wage survey for employee
benefits to be used for the benefits portion of the prevailing wage rates as an alternative to the currently determined prevailing benefit rates;
• this alternate method of determining prevailing wage rates be tested in specific locations and compared to comparable public construction projects in the state in order to compare the costs of such projects directly with one another, at the earliest possible time.
Such a comparison would allow there to be an empirical test of the claims of both proponents and opponents of Minnesota’s current prevailing wage law. Should the test demonstrate that using the median wage rates calculated by Minnesota’s DEED results in lowered costs for public construction projects, those median wage rates (along with DEED’s surveyed benefits rates) should replace Minnesota’s current method of determining prevailing wage rates.

Executive Summary
iv
This Page Intentionally Blank

Prevailing Wage Rates in Minnesota, Minnesota Taxpayers Association
1
II. Background and Policy Problem
History of Prevailing Wage Laws The first law in the United States regulating minimum pay standards for construction workers was passed by the Kansas legislature in 1891. The debate began at the federal level after that, and successful action was instigated after an Alabama construction firm brought construction laborers from that state to work on a Long Island hospital building project in 1927. The wages paid to these workers were those prevalent in their home state of Alabama, rather than the higher wages typically paid to New York construction workers. Fearful that they would continue to be undercut, New York businessmen complained about the practice to Congress. By 1931, Congress has passed the Davis-Bacon bill (so-named for its sponsors, Republican Representative Robert Bacon of New York and Republican Senator James Davis of Pennsylvania), which prohibited contractors engaged on federal construction projects from importing “cheap labor” to cut costs. The bill was later modified in 1935 to “require the payment of not less than the wages found by the Secretary of Labor to be ‘prevailing for the corresponding classes of laborers and mechanics employed on projects of a character similar to the contract work in the city, town, village or other civil subdivision of the state in which the work is be to performed.”1 A similar scenario took place on a University of Minnesota farm project in the early 1970s, when out-of-state workers were hired for less than local workers. In 1973, Minnesota’s legislature enacted a state prevailing wage law (often referred to, along with other state prevailing wage laws, as the “little Bacon-Davis law), which Governor Wendell Anderson signed. Like its federal counterpart, the Minnesota law requires persons employed on construction projects which are entirely or partially funded with state monies to be paid the “prevailing wage”. Currently, 32 states have prevailing wage statutes. Of the other 18, 9 have never had prevailing wage laws, while the other 9 have repealed earlier “little Davis-Bacon” laws.
Literature Review A significant amount of literature has been published on the effects of the prevailing wage laws. Unions, their members, union contractors, liberal academics and liberal policy groups tend to support prevailing wage. Non-union contractors, public executive officials, conservative academics and conservative policy groups tend to oppose prevailing wage. Although many studies have been published on the effects of prevailing wage laws, most of them have been conducted and/or funded by these groups. Few of them have been conducted by government entities. Notable exceptions are the Kentucky Legislative Research Commission’s (LRC) Analysis of Kentucky’s Prevailing Wage Laws and Procedures, the Ohio Legislative Service Commission’s (LSC) Effects of the Exemption of School Construction Projects from Ohio’s Prevailing Wage Law, and various reports published by the federal Government Accounting Office (GAO). Not surprisingly, there is a wide disparity of findings. Proponents of prevailing wage make the following arguments:
• Prevailing wage laws prevent contractors from hiring non-local workers at lower wages, thus preserving the jobs and wages of local construction workers.
1 A Guide to Minnesota’s Prevailing Wage. Minnesota Department of Labor and Industry

Background and Policy Problem
2
As noted earlier, this was the original justification used for passage of the Davis-Bacon Act in 1931.
• Prevailing wage laws reduce, rather than increase, building costs over the life of the building. Supporters assert that wages correlate with skill level, and so paying the higher prevailing wage draws more highly skilled workers to a construction project than would work there with a lower wage. Prevailing wage proponents cite three separate savings associated with skilled workers:
1. They argue that skilled workers provide increased job productivity. With greater skills, construction workers can work more quickly. Contractors also have an incentive to substitute mechanical labor for human laborers in an effort to cut costs. Although the per hour construction wage rates may be greater with prevailing wage, the total cost is lower because laborers work significantly less hours, resulting in savings to the taxpayer.
2. Proponents contend that more highly skilled workers are less likely to cause accidents. Accidents are costly because they extend the time needed to complete a project, adding extra wage hours to the project’s overall cost. Moreover, in the case of serious accidents, employers must contribute to the injured laborer’s health care costs, are liable for sick pay, and must compensate for the loss of the laborer on the project either by increasing existing worker productivity or by hiring a replacement. Since skilled workers are already assumed to be working at a high level of productivity, there will be few gains to be made and the contractor must either hire a replacement or extend the life of the project.
3. Proponents maintain that more highly skilled workers produce a higher-quality product. Fewer materials and man-hours are wasted with higher quality work, reducing construction costs. In addition, proponents assert that, with higher quality buildings, there will be fewer maintenance and repair costs associated with the building over its useful life. Hence, although construction costs are higher, savings are reaped over the life of the building.
• Prevailing wage laws support training and education of construction workers. Certain studies indicate that “where prevailing wages are paid, training programs are more prevalent, including higher participation by minorities and disadvantaged workers”.2 Proponents argue that these programs not only enable minorities and the disadvantaged to become construction workers, but that they also increase the skill level of all workers that take part in the programs, leading to a higher overall skill level.
• Prevailing wage laws increase local tax bases. Proponents contend that, by enforcing the prevailing wage, lower-skilled workers with lower wages do not drive out more highly-skilled workers with their higher wages. If lower-skilled workers did drive higher-skilled workers out of the locality, the income base would be eroded, leading to lower income tax collections.
Opponents of the current prevailing wage laws make their own, sometimes competing claims: • Prevailing wage laws add unnecessary expenses to construction projects.
Various studies indicate that the prevailing wage is higher that that necessary to complete the project.
• Prevailing wage laws make unions too powerful in setting prevailing wage rates. As Kentucky’s Legislative Research Commission (LRC) study notes: “the
2 State Building and Construction Trades Council of California, http://sbctc.org/?id=895&pagetype=sitemap

Prevailing Wage Rates in Minnesota, Minnesota Taxpayers Association
3
determination process used…is more likely to yield prevailing wages that are representative of union wages than wages for all construction workers in the locality. While union workers account for approximately 21% of non-residential construction workers, 81% of the workers for which wages were submitted at prevailing wage hearings were union members. Sixty-four percent of the determinations made resulted in the prevailing wage being set equal to the union wage.”
The Kentucky LRC’s study provides a good summary for the reasons behind the wide divergence of study results:
Empirical estimates of the effects vary greatly, due largely to the difficulty in separating the effects of prevailing wage laws from other factors that affect construction costs. Ideally, to measure any cost effect from prevailing wage laws, it is necessary to compare the costs of projects under the prevailing wage to the costs of the same exact projects in the absence of a prevailing wage law. Unfortunately, it is not possible to see what construction costs would be in the total absence of a prevailing wage law. Therefore, several alternative methods have been developed over the years in an attempt to estimate the effects. Some studies compare construction costs in prevailing wage states to construction costs in non-prevailing wage states. Other compare the Davis-Bacon wages to other, more representative measures of wages. These methods are discussed in a number of studies. There is little agreement between the studies as to whether prevailing wage laws increase costs, because a commonality in all of them is that there is always some technical issue that could substantially affect the results.3
Prevailing Wage Determination Methods Minnesota’s prevailing wage law is, in most respects, similar to the federal Davis-Bacon legislation and many other state prevailing wage laws. The Department of Labor and Industry defines classes of labor and determines prevailing wage rates for two different types of construction: highway/heavy and commercial. Labor and Industry sets these rates through an annual survey of entities involved in the construction industry, mainly businesses and unions. Labor and Industry defines highway/heavy construction as “construction and maintenance of highways, streets, airport runways, bridges, power plants, dams, wastewater treatment plants, water towers, high-voltage power lines and utilities”.4 While it does not determine prevailing wage rates, Minnesota’s Department of Transportation is responsible for enforcing wage rates on highway construction projects. State highway/heavy prevailing wage rates are determined for ten regions, into which each of Minnesota’s counties then fall. Labor and Industry defines commercial construction as “building projects exclusive of residential [single- or two-family home] construction”.5 State commercial construction prevailing wage rates are set on a county-by-county basis.
Prevailing wage determinations in the 32 states are made in one of four ways:
1. by adopting the federal prevailing wage determinations, 2. by empowering a state official or officials to determine the rates, 3. by adopting collectively bargained rates,
3 Kentucky LRC Report, pp. 45-46. 4 Minnesota Department of Labor and Industry website: http://www.doli.state.mn.us/laborlaw 5 Ibid.

Background and Policy Problem
4
4. by surveying to set prevailing wage rates (the method used by the federal government).6
Minnesota employs the fourth option using survey information to derive the prevailing wage. However, Minnesota law does differ from the Davis-Bacon Act, and from most other state prevailing wage laws which average survey data, in one major respect. Most states and the federal government use two approaches to calculate the prevailing wage. If more than half of the workers in a survey are paid the same wage, then that wage is used. If no majority emerges, then an average is used. Minnesota calculates the prevailing wage differently. An administrative law judge has concluded that the Minnesota law requires the mode, or most-often-cited wage, to become the prevailing wage, regardless of whether or not that wage is paid to a majority of workers in the survey. For example, if a class of workers had five survey responses, with those persons being paid wages of $9.17, $10.40, $13.55, $13.55 and $14.06, then the state of Minnesota would set the prevailing wage at $13.55 (the mode); while the federal government would set the prevailing wage at $12.15 (the average of the five salaries, since a majority did not emerge).7 The State of California effectively uses the same prevailing wage determination method as Minnesota.8
Policy Problem—Why This Study? This study is primarily a comparison of the wage costs of public construction projects subject to prevailing wage laws under current Minnesota law, and our estimates of what those costs would be if either federal prevailing wage law were in effect, or if the prevailing wage statutes set wages equal to the median wages as determined by the Minnesota Department of Employment and Economic Development (DEED). The Associated Builders and Contractors, Inc. (ABC) of Minnesota requested that MTA do the research for this study. We agreed to estimate the narrow question of what differences in cost arise by using Minnesota’s method of calculating prevailing wage rates rather than using the federal method, or using DEED’s median wage rates.
6 This information was provided by Minnesota Associated Builders and Contractors, who provided us with their national association’s 1995 prevailing wage study. They also surveyed states to determine what changes had taken place since then. The relevant information which they provided is attached at the end of this report as Appendix C. 7 House Research, Minnesota House of Representatives, http://www.house.leg.state.mn.us/hrd/issinfo/prevwage.htm. 8 California Department of Industrial Relations, http://workitout.ca.gov/viewfaq.asp?id=143&fid=216.

Prevailing Wage Rates in Minnesota, Minnesota Taxpayers Association
5
III. Methodology
Public Construction Projects A list of public construction projects subject to prevailing wage rates was obtained from several state agencies. The Department of Education collects data from all school districts regarding building projects. Education posts this data on its website as part of the Review and Comment process, and we collected our school construction data from that website. Unfortunately, this data only includes the aggregate amount bonded for each project. State highway construction projects are let at auction, and the bidding results are posted on the Department of Transportation’s website. State building projects are not processed or compiled centrally, and so to facilitate the study, we used those projects funded through capital investment (“bonding”) bills as our list of state-funded building projects. Given that the legislature failed to enact a bonding bill during the 2004 session, we used the 2002 bonding bill to determine state-funded building projects, as well as 2002 school and transportation projects. Based on discussions with experts in local finance, we excluded any potential city, county and township projects as inordinately difficult to compile. Our complete list of projects follows this report as Appendix A. Importantly, only Minnesota counties with public construction projects have been included in this analysis. Five counties; Brown, Jackson, McLeod, Murray and Watonwan, had no public building or transportation projects included in our list of 2002 list, projects so have been excluded entirely from this analysis. Another 50 counties had transportation, but no building projects. Those counties are included in our analysis of transportation prevailing wage, but not building prevailing wage.
Estimates of Public Construction Project Wage Costs The available public construction data available presented aggregate building project costs. Since only wage payments are subject to prevailing wage statutes, we set about to determine what portion of total public construction costs are wage costs. In order to do this, we used the following formulas Prevailing wage (PW) costs = raw construction costs (RCC) X percent of RCC subject to PW RCC = bond costs – non-construction costs – profit fees not subject to prevailing wage Determining raw construction costs (RCC) was not difficult for transportation projects, since those bidding results were actual project, rather than bonding costs. To determine raw construction costs for state-funded building projects, we compared construction costs versus total costs for all proposed 2002 state building projects, which were available through each agency’s capital budget request through the Department of Finance. Our analysis indicated that the raw construction costs ranged from 71 to 77 percent of total costs. Since this data was not readily available to us for bonding projects, we consulted construction and architectural professionals, who indicated that on a typical bond issue, 65 to 70 percent of the bond pertains to construction costs. Of that, 10 to 12 percent is profit, project management fees that are not subject to prevailing wage. That leaves 53 to 60 percent of “raw construction costs”.

Methodology
6
Since this data was not readily available to us for state transportation and school building projects, we again consulted construction and architectural professionals. They indicated that 40 to 55 percent is typically construction labor costs subject to prevailing wage. From this data, we estimated that the total public construction project costs subject to prevailing wage fall into the following ranges:
Table 1: Percentage of Total Public Construction Project Costs Subject to Prevailing Wage Schools State – Building State - Transportation
Cost Category Low Wage High Wage Low Wage High Wage Low Wage High Wage
Construction-related bonding costs: 65% 70% N.A. N.A. 100% 100%
Minus project management bonding costs - 12% - 10% N.A. N.A. - 12% - 10%
= Raw construction bonding costs 53% 60% 71% 77% 88% 90%Times percent of raw construction costs subject to prevailing wage x 40% x 50% x 40% x 50% x 40% x 50%
= Estimated Cost Subject to Prevailing Wage 21.2% 33.3% 28.4% 38.5% 35.2% 45.0%Sources: Department of Finance agency capital budget requests, informal MTA surveys of architectural and construction professionals. N.A. indicates percentages are not available.
Finally, we assigned each project into the county in which it was located. Certain transportation projects were assigned to multiple counties throughout a region. In those cases, the project was divided equally among relevant counties. Certain state building projects were also designated “systemwide” or “statewide”. University of Minnesota statewide projects were divided by enrollment at each of the four campuses (Twin Cities, Duluth, Crookston and Morris). The portion of projects assigned to the Twin Cities Campus were then equally divided between Hennepin County (Minneapolis Campus), and Ramsey County (St. Paul Campus). Other “systemwide” or “statewide” building projects were not assigned to a particular county, but instead were analyzed in a separate “statewide” category.
Sources for Prevailing Wage Data We also determined median wage rates, state prevailing wage rates and federal prevailing wage rates for each county in Minnesota. Minnesota’s Department of Employment and Economic Development (DEED) surveys Minnesota businesses quarterly to provide Occupational Employment Statistics (OES) wage data. We used third quarter 2004 data for “Construction and Extraction Occupations” as the median wage9. State prevailing wage rates are provided by the Minnesota Department of Labor and Industry (DOLI), and were current as of November, 2004.10 The Wage and Hour Division of the U.S. Department of Labor determines prevailing wage rates to be paid on federally funded or assisted construction projects, and that data was also current as of November, 2004.11 None of these agencies provides archived data through their websites. Separate surveys are conducted for construction projects (buildings) and for transportation projects (roads). One major difference between the prevailing wage data and median wage data is that prevailing wage data includes hourly benefit rates, while median wage data does not. We undertook a cursory survey of benefit packages in the construction industry, and concluded
9 DEED provides this information at http://www.deed.state.mn.us/lmi/tools/oes.htm. 10 DOLI provides this information at http://www.doli.state.mn.us/pw_rates.html. 11 The U.S. Department of Labor provides this information at http://www.access.gpo.gov/davisbacon/.

Prevailing Wage Rates in Minnesota, Minnesota Taxpayers Association
7
that industry-wide, companies provide benefits 22% beyond salary. We adjusted our median wage data to reflect this finding.
Estimates of Labor Inputs Wage differentials between median wage, state prevailing wage and federal prevailing wage vary according to job classification (carpenter, electrician, et cetera). In order to adequately assess the costs associated with each wage determination method, we next estimated the portion of total work completed on a public construction project by each job classification. This allows us to correctly weight the wage differentials. Since the project data did not readily indicate how much of the work on each project, we used the share of total state employment in the construction industry as reported in the OES wage data as a proxy. DEED personnel confirmed our assumption as reasonable. We excluded “first-line supervisors/managers of construction trades and extraction workers (47-1011) and “construction and building inspectors” (47-4011) after determining that the prevailing wage statutes do not apply to persons employed in those categories. We also excluded any classification number 47-5000 and above, since those categories apply to extraction, rather than construction workers. We collected OES wage and employment data by planning area, and applied the data to each county within the planning area. A list of planning areas and their constituent counties follows this report as Appendix B.
Matching Job Classification Categories Using OES employment data as the basis for classification, we then matched the state and federal prevailing wage classes to it. While these three measurement methods share many job classifications, others differed from method to method. In particular, three assumptions deserve to be highlighted. First, the median wage job classifications “paving, surfacing, and tamping equipment operators” (47-2071) and “operating engineers and other construction equipment operators” (47-2073) do not have equivalent prevailing wage counterparts. Both state and federal prevailing wage statements list “power equipment operators” and “truck drivers”, both of which are usually divided into multiple groups. At both the state and federal levels, we averaged wage listings for all groups within “power equipment operators” and “truck drivers” and matched the result to the two above-mentioned median wage job classifications. Second, median wage calculations include various “helper” categories. Private industry classifies such “helpers” as apprentices or juniors in their particular fields, and as such, pays a significantly smaller wage. However, these “helper” classifications are generally not recognized by prevailing wage as apprentices, and so the statutes require that they be paid at the full journeyman rate. Therefore, although we have carried the “helper” job classifications into prevailing wage (where they do not exist), we have applied the journeyman wage rate to them. This allows us to measure costs associated with prevailing wage’s apprentice requirements. Lastly, certain job classifications were not represented in every wage determination method. When comparing two methods of wage determination, we applied the total differential between job classifications that did match to those that did not. For example, if the federal prevailing wage costs exceeded the state prevailing wage costs by two percent for all job
Methodology
8
classifications that did match, then we applied that two percent increase to all remaining job classifications.
Comparison Between State Prevailing Wage, Federal Prevailing Wage and Median Wage Once these methodological hurdles were overcome, we began converting between wage determination methods. The wage cost for each project was divided into the wages paid to each job classification. We then divided total job classification wages by the state prevailing wage rate to estimate the total number of hours worked by persons employed in each job classification on the project. To determine the project wage costs under federal prevailing wage and median wage, we then multiplied hours worked in each job classification by the appropriate federal prevailing wage rate or median wage rate. By using a low and high wage estimates, we arrived at a range within which total wages paid will fall.
Data Limitations Our data on public construction projects is limited substantially in three respects:
• We were unable to obtain a comprehensive list of public construction projects for political subdivisions in the state, excepting school districts. No centralized database of such projects is known to exist.
• We were able to determine labor costs only for state building projects. No such detail was available for school district or highway construction projects.
• None of the public construction project information available contained detailed information on either the amount of work performed by laborers in each job classification, or the amount of wages paid to laborers in each job classification. Although our assumptions regarding the labor mix were confirmed by DEED personnel as reasonable, further information could alter our labor mix assumptions substantially. Given the number of variables involved, a sensitivity analysis is not feasible.
Our prevailing wage data also suffers from the following limitations: • Job classification categories differ slightly in some regards between the different wage
determination methodologies. Importantly, our method of averaging the reported wages for all subcategories within the prevailing wage job categories of “power equipment operator” and “truck driver” creates some concern. Again, our lack of knowledge concerning the actual labor mix is the key factor here: if we knew how to accurately weight each of the subcategories within these groups, our prevailing wage estimates for them would almost certainly change. Since, however, the wages for most of these subcategories are within a fairly narrow range, it is unlikely that any changes would significantly impact our findings.
• We have not been able to examine the actual surveys upon which the state and federal prevailing wage determinations are based. This leads to a number of limitations:
o We must use the time frames provided by these agencies. This is problematic since much of the federal highway construction prevailing wage data is generally two to four years older than comparable state data. More current data would almost certainly raise the costs of transportation projects under the federal prevailing wage model.
o We do not know how many surveys were submitted to the relevant authority for any of the prevailing wage determinations. Hence, we do not have the ability to accurately ascertain the veracity of the prevailing wage determinations provided by either the state or federal government.
Prevailing Wage Rates in Minnesota, Minnesota Taxpayers Association
9
IV. Analysis and Interpretation
The findings of this study are reported in two main areas:
• First, regarding the federal method of determining prevailing wage. • Second, we also report on the added costs or cost savings associated with the use of each
wage determination method.
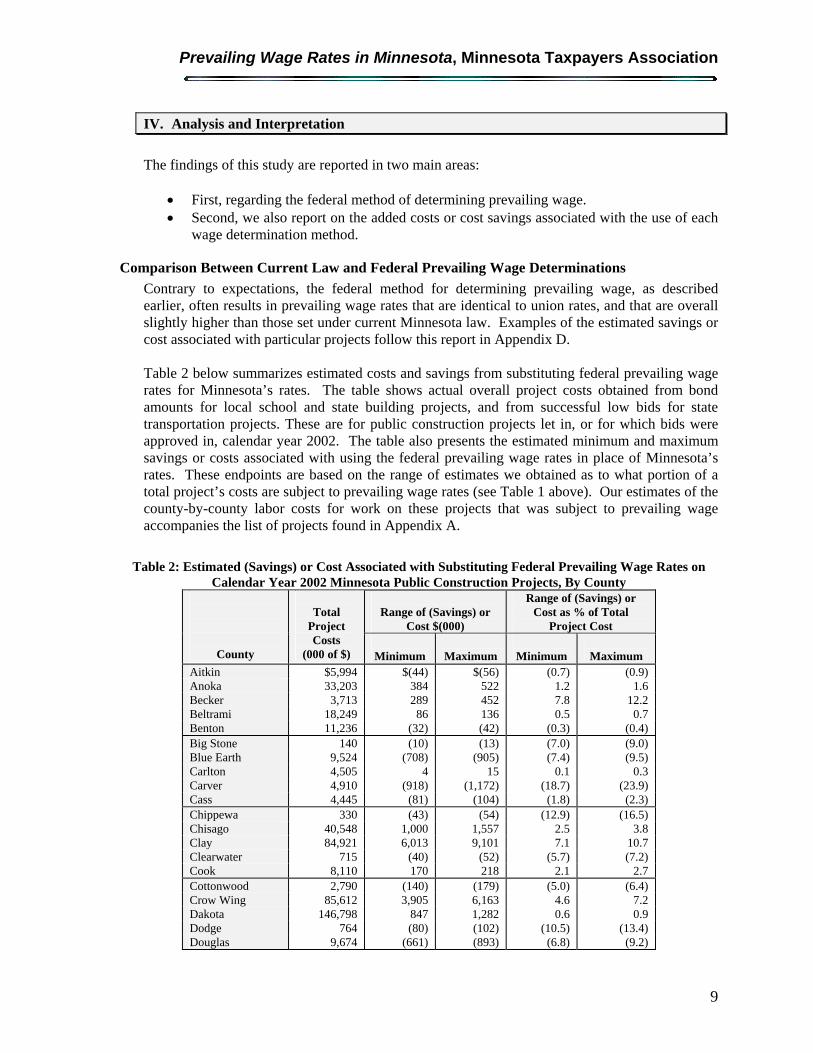
Comparison Between Current Law and Federal Prevailing Wage Determinations Contrary to expectations, the federal method for determining prevailing wage, as described earlier, often results in prevailing wage rates that are identical to union rates, and that are overall slightly higher than those set under current Minnesota law. Examples of the estimated savings or cost associated with particular projects follow this report in Appendix D. Table 2 below summarizes estimated costs and savings from substituting federal prevailing wage rates for Minnesota’s rates. The table shows actual overall project costs obtained from bond amounts for local school and state building projects, and from successful low bids for state transportation projects. These are for public construction projects let in, or for which bids were approved in, calendar year 2002. The table also presents the estimated minimum and maximum savings or costs associated with using the federal prevailing wage rates in place of Minnesota’s rates. These endpoints are based on the range of estimates we obtained as to what portion of a total project’s costs are subject to prevailing wage rates (see Table 1 above). Our estimates of the county-by-county labor costs for work on these projects that was subject to prevailing wage accompanies the list of projects found in Appendix A.
Table 2: Estimated (Savings) or Cost Associated with Substituting Federal Prevailing Wage Rates on Calendar Year 2002 Minnesota Public Construction Projects, By County
Range of (Savings) or
Cost $(000)
Range of (Savings) or Cost as % of Total
Project Cost
County
Total
Project Costs
(000 of $)
Minimum
Maximum
Minimum
Maximum Aitkin $5,994 $(44) $(56) (0.7) (0.9) Anoka 33,203 384 522 1.2 1.6 Becker 3,713 289 452 7.8 12.2 Beltrami 18,249 86 136 0.5 0.7 Benton 11,236 (32) (42) (0.3) (0.4) Big Stone 140 (10) (13) (7.0) (9.0) Blue Earth 9,524 (708) (905) (7.4) (9.5) Carlton 4,505 4 15 0.1 0.3 Carver 4,910 (918) (1,172) (18.7) (23.9) Cass 4,445 (81) (104) (1.8) (2.3) Chippewa 330 (43) (54) (12.9) (16.5) Chisago 40,548 1,000 1,557 2.5 3.8 Clay 84,921 6,013 9,101 7.1 10.7 Clearwater 715 (40) (52) (5.7) (7.2) Cook 8,110 170 218 2.1 2.7 Cottonwood 2,790 (140) (179) (5.0) (6.4) Crow Wing 85,612 3,905 6,163 4.6 7.2 Dakota 146,798 847 1,282 0.6 0.9 Dodge 764 (80) (102) (10.5) (13.4) Douglas 9,674 (661) (893) (6.8) (9.2)

Analysis and Interpretation
10
Range of (Savings) or
Cost $(000)
Range of (Savings) or Cost as % of Total
Project Cost
County
Total
Project Costs
(000 of $)
Minimum
Maximum
Minimum
Maximum Faribault 449 (33) (43) (7.4) (9.5) Fillmore 2,686 (281) (359) (10.5) (13.4) Freeborn $15,577 $(3,046) $(3,894) (0.2) (25.0) Goodhue 4,842 (243) (310) (5.0) (6.4) Grant 7,122 (480) (613) (6.7) (8.6) Hennepin 251,476 1,755 2,511 0.7 1.0 Houston 12,464 (87) (111) (0.7) (0.9) Hubbard 387 (15) (20) (4.0) (5.1) Isanti 3,777 (680) (869) (18.0) (23.0) Itasca 16,918 (117) (134) (0.7) (0.8) Kanabec 36 (1) (2) (4.1) (5.3) Kandiyohi 40,827 (5,251) (6,714) (12.9) (16.4) Kittson 390 (135) (173) (34.6) (44.2) Koochiching 2,559 (339) (434) (13.3) (16.9) Lac Qui Parle 1,628 (210) (268) (12.9) (16.5) Lake 39,885 513 789 1.3 2.0 Lake of the Woods 1,683 (95) (121) (5.7) (7.2) Le Sueur 6,383 (467) (598) (7.3) (9.4) Lincoln 1,114 (144) (183) (12.9) (16.5) Lyon 8,427 (746) (955) (8.9) (11.3) Mahnomen 7,286 308 482 4.2 6.6 Marshall 4,239 (257) (328) (6.1) (7.7) Martin 111 (6) (7) (5.0) (6.4) Meeker 156 (14) (17) (8.7) (11.2) Mille Lacs 36 (1) (2) (4.1) (5.3) Morrison 14,052 368 635 2.6 4.5 Mower 59 (6) (8) (10.5) (13.4) Nicollet 4,351 (5) (3) (0.1) (0.1) Nobles 1,445 (73) (94) (5.1) (6.5) Norman 306 (19) (24) (6.1) (7.7) Olmsted 779 (5) (7) (0.7) (0.9) Otter Tail 7,772 (433) (587) (5.6) (7.6) Pennington 3,153 (34) (39) (1.1) (1.2) Pine 592 (25) (32) (4.2) (5.4) Pipestone 5,396 (695) (888) (12.9) (16.5) Polk 10,338 187 253 1.8 2.5 Pope 182 (13) (17) (7.2) (9.1) Ramsey 176,160 1,071 1,455 0.6 0.8 Red Lake 306 (19) (24) (6.1) (7.7) Redwood 1,745 (174) (223) (10.0) (12.8) Renville 5,784 (744) (951) (12.9) (16.4) Rice 1,528 (2) (2) (0.1) (0.1) Rock 1,864 (95) (121) (5.1) (6.5) Roseau 4,545 (59) (59) (1.3) (1.3) Saint Louis 86,230 1,002 1,401 1.2 1.6 Scott 9,874 92 134 0.9 1.4 Sherburne 12,358 453 580 3.7 4.7 Sibley 1,976 (143) (183) (7.2) (9.3) Stearns 2,824 28 43 1.0 1.5 Steele 3,087 (350) (447) (11.3) (14.5) Stevens 28,045 (10) (12) (0.0) (0.0) Swift 140 (19) (25) (13.9) (17.8) Todd 6,859 (956) (1,222) (13.9) (17.8) Traverse 645 (44) (56) (6.9) (8.8) Wabasha 809 (68) (87) (8.4) (10.7)

Prevailing Wage Rates in Minnesota, Minnesota Taxpayers Association
11
Range of (Savings) or
Cost $(000)
Range of (Savings) or Cost as % of Total
Project Cost
County
Total
Project Costs
(000 of $)
Minimum
Maximum
Minimum
Maximum Wadena 199 (27) (35) (13.7) (17.5) Waseca 7,157 (532) (680) (7.4) (9.5) Washington 132,426 140 185 0.1 0.1 Wilkin 3,638 (234) (305) (6.4) (8.4) Winona 31,873 782 1,062 2.5 3.3 Wright 15,465 338 495 2.2 3.2 Yellow Medicine 212 (27) (35) (12.9) (16.5) Unassigned 216,459 3,573 4,845 1.7 0.0 Totals $1,707,269 $3,091 $8,427 0.2% 0.5%
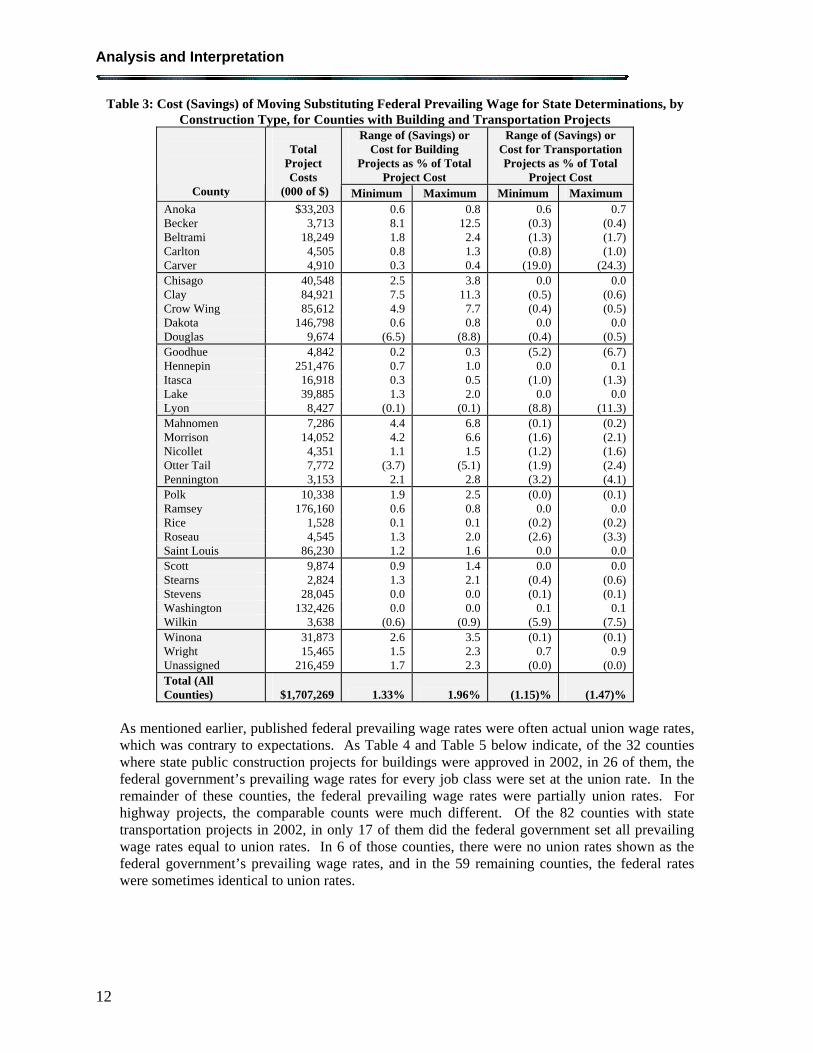
As Table 2 indicates, public construction costs would rise slightly if the state used the federal method of determining prevailing wage, but there would likely be additional costs associated with moving to the federal method of determining prevailing wages. While the federal prevailing wage rates reported for building projects generally date from between 2002 and 2004, the rates reported for building projects were much older. In 61 counties, the rates dated from 1999. In one county (Polk), the non-union rates date from 1992. In three other counties, Carver, Clay and Isanti, the non-union rates date from 1990. The time period disparity is evident when comparing estimated costs or savings of substituting the federal prevailing wages by construction type. As Table 3 below reveals, wage costs increase significantly more for building (non-highway) projects under such a substitution, both overall and at the county-by-county level. In only four counties (Douglas, Lake, Otter Tail and Wright) do transportation wage costs increase more than building wage costs under a move from state to federal prevailing wages. Our analysis indicates that, while the state would save 1.2% to 1.5% on transportation projects by making this switch, Minnesota would assume 1.3% to 2.0% higher costs for building projects. Not surprisingly, because of the datedness of the rates, Carver, Clay and Isanti counties had, respectively the largest, second-largest and fourth-largest reductions in costs when federal prevailing wage rates were substituted for state rates for transportation projects. With a more timely determination of rates, such savings on transportation projects by using federal prevailing wage rates would disappear, further increasing the statewide costs of such a substitution.
Analysis and Interpretation
12
Table 3: Cost (Savings) of Moving Substituting Federal Prevailing Wage for State Determinations, by Construction Type, for Counties with Building and Transportation Projects
Range of (Savings) or Cost for Building
Projects as % of Total Project Cost
Range of (Savings) or Cost for Transportation Projects as % of Total
Project Cost
County
Total
Project Costs
(000 of $) Minimum Maximum Minimum Maximum Anoka $33,203 0.6 0.8 0.6 0.7 Becker 3,713 8.1 12.5 (0.3) (0.4) Beltrami 18,249 1.8 2.4 (1.3) (1.7) Carlton 4,505 0.8 1.3 (0.8) (1.0) Carver 4,910 0.3 0.4 (19.0) (24.3) Chisago 40,548 2.5 3.8 0.0 0.0 Clay 84,921 7.5 11.3 (0.5) (0.6) Crow Wing 85,612 4.9 7.7 (0.4) (0.5) Dakota 146,798 0.6 0.8 0.0 0.0 Douglas 9,674 (6.5) (8.8) (0.4) (0.5) Goodhue 4,842 0.2 0.3 (5.2) (6.7) Hennepin 251,476 0.7 1.0 0.0 0.1 Itasca 16,918 0.3 0.5 (1.0) (1.3) Lake 39,885 1.3 2.0 0.0 0.0 Lyon 8,427 (0.1) (0.1) (8.8) (11.3) Mahnomen 7,286 4.4 6.8 (0.1) (0.2) Morrison 14,052 4.2 6.6 (1.6) (2.1) Nicollet 4,351 1.1 1.5 (1.2) (1.6) Otter Tail 7,772 (3.7) (5.1) (1.9) (2.4) Pennington 3,153 2.1 2.8 (3.2) (4.1) Polk 10,338 1.9 2.5 (0.0) (0.1) Ramsey 176,160 0.6 0.8 0.0 0.0 Rice 1,528 0.1 0.1 (0.2) (0.2) Roseau 4,545 1.3 2.0 (2.6) (3.3) Saint Louis 86,230 1.2 1.6 0.0 0.0 Scott 9,874 0.9 1.4 0.0 0.0 Stearns 2,824 1.3 2.1 (0.4) (0.6) Stevens 28,045 0.0 0.0 (0.1) (0.1) Washington 132,426 0.0 0.0 0.1 0.1 Wilkin 3,638 (0.6) (0.9) (5.9) (7.5) Winona 31,873 2.6 3.5 (0.1) (0.1) Wright 15,465 1.5 2.3 0.7 0.9 Unassigned 216,459 1.7 2.3 (0.0) (0.0) Total (All Counties)
$1,707,269 1.33% 1.96%
(1.15)%
(1.47)%
As mentioned earlier, published federal prevailing wage rates were often actual union wage rates, which was contrary to expectations. As Table 4 and Table 5 below indicate, of the 32 counties where state public construction projects for buildings were approved in 2002, in 26 of them, the federal government’s prevailing wage rates for every job class were set at the union rate. In the remainder of these counties, the federal prevailing wage rates were partially union rates. For highway projects, the comparable counts were much different. Of the 82 counties with state transportation projects in 2002, in only 17 of them did the federal government set all prevailing wage rates equal to union rates. In 6 of those counties, there were no union rates shown as the federal government’s prevailing wage rates, and in the 59 remaining counties, the federal rates were sometimes identical to union rates.

Prevailing Wage Rates in Minnesota, Minnesota Taxpayers Association
13
Table 4: Counties Whose Federal Prevailing Wage Rates are Entirely Union Wage Rates, by Construction Type
Building Highway Anoka Mahnomen Anoka Sherburne Becker Morrison Benton Stearns Beltrami Nicollet Carlton Washington Carlton Pennington Chisago Wright Carver Polk Cook Chisago Ramsey Dakota Clay Rice Hennepin Crow Wing Roseau Houston Dakota Saint Louis Lake Goodhue Scott Olmsted Hennepin Washington Ramsey Itasca Winona Saint Louis Lake Wright Scott
Table 5: Counties Whose Federal Prevailing Wage Rates Include No Union Wage Rates, by Construction Type
Building (no counties) Highway Carver Steele Clay Todd Isanti Wadena
Because the methodology requires the Department of Labor to use the average, rather than the modal wage, the expectation was that the federal prevailing wage rates would not typically use union rates and would be lower than Minnesota’s rates. Since data submitted through this survey program is confidential, we can only speculate as to why higher union rates are so often used as the federal prevailing rate. Anecdotal evidence indicates that while non-union contractors are aware of this survey, few know how even to obtain the requisite forms from the Department of Labor, and are thus likely under-represented in the survey data.
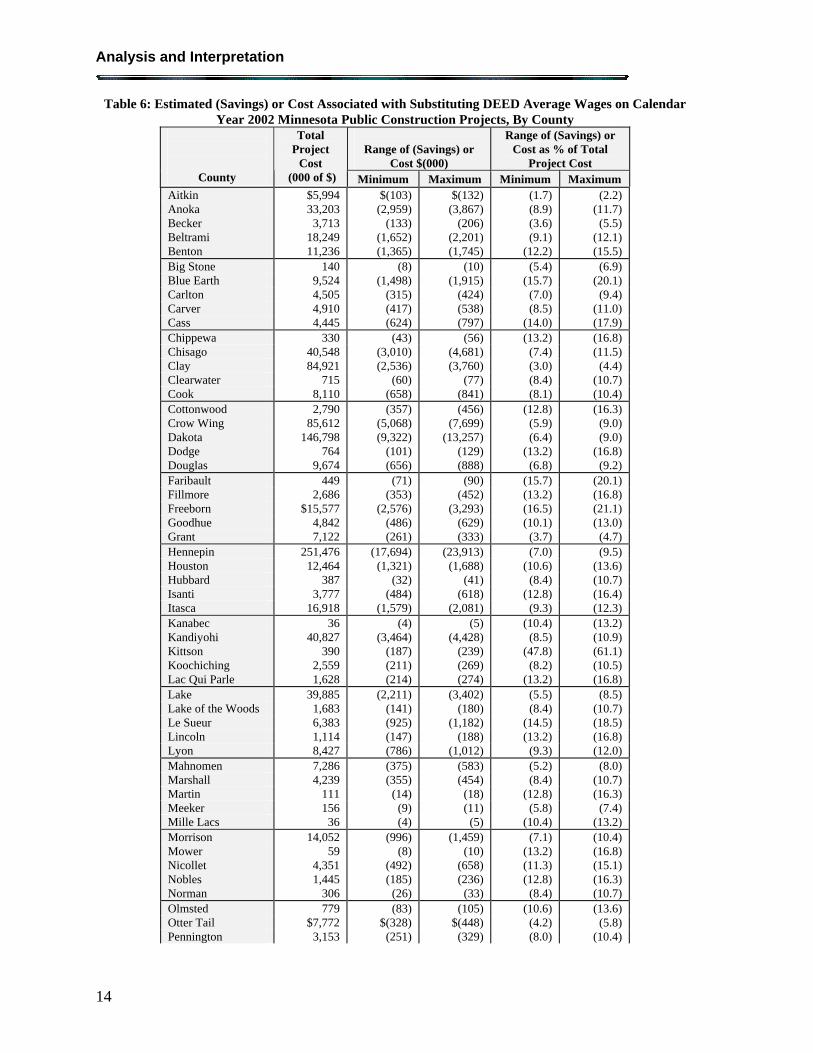
Comparison Between Current Law and Median Wage Determinations Because the general public most likely intuitively expects a term like “prevailing wage” to be similar to an average wage, we examined the effect on public construction costs of using wage rates that are closer to that intuitive understanding. The Minnesota Department of Employment and Economic Development (DEED) surveys Minnesota businesses regarding wages on a quarterly basis. The survey has a much wider distribution than current prevailing wage rate surveys, since employers are required to participate in the survey in order to qualify for certain discounts associated with the state’s insurance policies. We estimate that state and local governments would experience significant savings in wage costs if DEED average wages were substituted for the current prevailing wage system. After factoring in fringe benefits of 22% plus wages, based on informal surveys from non-union construction contractors, we estimate that between $126 million and $171 million could have been cut from the project costs examined for this study. Put another way, the same projects could have been constructed for 7.4% to 10.0% less than actual or proposed costs, under the assumptions used in this study. Table 6 provides a county-by-county summary of our findings.
Analysis and Interpretation
14
Table 6: Estimated (Savings) or Cost Associated with Substituting DEED Average Wages on Calendar Year 2002 Minnesota Public Construction Projects, By County
Range of (Savings) or
Cost $(000)
Range of (Savings) or Cost as % of Total
Project Cost
County
Total Project
Cost (000 of $) Minimum Maximum Minimum Maximum
Aitkin $5,994 $(103) $(132) (1.7) (2.2) Anoka 33,203 (2,959) (3,867) (8.9) (11.7) Becker 3,713 (133) (206) (3.6) (5.5) Beltrami 18,249 (1,652) (2,201) (9.1) (12.1) Benton 11,236 (1,365) (1,745) (12.2) (15.5) Big Stone 140 (8) (10) (5.4) (6.9) Blue Earth 9,524 (1,498) (1,915) (15.7) (20.1) Carlton 4,505 (315) (424) (7.0) (9.4) Carver 4,910 (417) (538) (8.5) (11.0) Cass 4,445 (624) (797) (14.0) (17.9) Chippewa 330 (43) (56) (13.2) (16.8) Chisago 40,548 (3,010) (4,681) (7.4) (11.5) Clay 84,921 (2,536) (3,760) (3.0) (4.4) Clearwater 715 (60) (77) (8.4) (10.7) Cook 8,110 (658) (841) (8.1) (10.4) Cottonwood 2,790 (357) (456) (12.8) (16.3) Crow Wing 85,612 (5,068) (7,699) (5.9) (9.0) Dakota 146,798 (9,322) (13,257) (6.4) (9.0) Dodge 764 (101) (129) (13.2) (16.8) Douglas 9,674 (656) (888) (6.8) (9.2) Faribault 449 (71) (90) (15.7) (20.1) Fillmore 2,686 (353) (452) (13.2) (16.8) Freeborn $15,577 (2,576) (3,293) (16.5) (21.1) Goodhue 4,842 (486) (629) (10.1) (13.0) Grant 7,122 (261) (333) (3.7) (4.7) Hennepin 251,476 (17,694) (23,913) (7.0) (9.5) Houston 12,464 (1,321) (1,688) (10.6) (13.6) Hubbard 387 (32) (41) (8.4) (10.7) Isanti 3,777 (484) (618) (12.8) (16.4) Itasca 16,918 (1,579) (2,081) (9.3) (12.3) Kanabec 36 (4) (5) (10.4) (13.2) Kandiyohi 40,827 (3,464) (4,428) (8.5) (10.9) Kittson 390 (187) (239) (47.8) (61.1) Koochiching 2,559 (211) (269) (8.2) (10.5) Lac Qui Parle 1,628 (214) (274) (13.2) (16.8) Lake 39,885 (2,211) (3,402) (5.5) (8.5) Lake of the Woods 1,683 (141) (180) (8.4) (10.7) Le Sueur 6,383 (925) (1,182) (14.5) (18.5) Lincoln 1,114 (147) (188) (13.2) (16.8) Lyon 8,427 (786) (1,012) (9.3) (12.0) Mahnomen 7,286 (375) (583) (5.2) (8.0) Marshall 4,239 (355) (454) (8.4) (10.7) Martin 111 (14) (18) (12.8) (16.3) Meeker 156 (9) (11) (5.8) (7.4) Mille Lacs 36 (4) (5) (10.4) (13.2) Morrison 14,052 (996) (1,459) (7.1) (10.4) Mower 59 (8) (10) (13.2) (16.8) Nicollet 4,351 (492) (658) (11.3) (15.1) Nobles 1,445 (185) (236) (12.8) (16.3) Norman 306 (26) (33) (8.4) (10.7) Olmsted 779 (83) (105) (10.6) (13.6) Otter Tail $7,772 $(328) $(448) (4.2) (5.8) Pennington 3,153 (251) (329) (8.0) (10.4)

Prevailing Wage Rates in Minnesota, Minnesota Taxpayers Association
15
Range of (Savings) or
Cost $(000)
Range of (Savings) or Cost as % of Total
Project Cost
County
Total Project
Cost (000 of $) Minimum Maximum Minimum Maximum
Pine 592 (83) (106) (14.1) (18.0) Pipestone 5,396 (711) (909) (13.2) (16.8) Polk 10,338 (793) (1,056) (7.7) (10.2) Pope 182 (7) (9) (3.9) (5.0) Ramsey 176,160 (13,125) (17,483) (7.5) (9.9) Red Lake 306 (26) (33) (8.4) (10.7) Redwood 1,745 (230) (294) (13.2) (16.9) Renville 5,784 (491) (627) (8.5) (10.9) Rice 1,528 (153) (208) (10.0) (13.6) Rock 1,864 (238) (304) (12.8) (16.3) Roseau 4,545 (325) (461) (7.2) (10.2) Saint Louis 86,230 (7,639) (10,057) (8.9) (11.7) Scott 9,874 (579) (839) (5.9) (8.5) Sherburne 12,358 (1,501) (1,919) (12.2) (15.5) Sibley 1,976 (314) (402) (15.9) (20.3) Stearns 2,824 (222) (345) (7.9) (12.2) Steele 3,087 (354) (452) (11.5) (14.7) Stevens 28,045 (47) (70) (0.2) (0.3) Swift 140 (16) (21) (11.7) (14.9) Todd 6,859 (931) (1,191) (13.6) (17.4) Traverse 645 (24) (31) (3.7) (4.8) Wabasha 809 (93) (119) (11.5) (14.7) Wadena 199 (27) (34) (13.4) (17.1) Waseca 7,157 (1,126) (1,439) (15.7) (20.1) Washington 132,426 (11,321) (14,505) (8.6) (11.0) Wilkin 3,638 (134) (177) (3.7) (4.9) Winona 31,873 (2,591) (3,504) (8.1) (11.0) Wright 15,465 (1,327) (1,968) (8.6) (12.7) Yellow Medicine 212 (28) (36) (13.2) (16.8) Unassigned 216,459 (14,887) (20,177) (6.9) (9.3) Totals $1,707,269 $(126,495) $(171,120) (7.4)% (10.0)%
Corroboration by Other Studies Other studies of prevailing wage legislation have come to similar conclusions regarding wage rate differentials between a state’s prevailing wage rate determination and average or median rates.
• MTA’s 1997 limited examination of the fiscal implications of the prevailing wage law on Minnesota school districts showed that the prevailing wage requirement added 4-10% to the cost of the selected school building projects already in progress.
• The estimates in this study also resemble the findings from a study authorized by the State of Ohio from 1997 to 2001. During that period, the state exempted construction undertaken by school districts from the state’s prevailing wage requirements. The Ohio Legislative Service Commission, found “indications of a savings of $487.9 million in aggregate school construction savings during the post exemption period, an overall savings of 10.7 percent.”12 Given that inflation factors would likely decrease the number
12 S.B. 102 Report: The Effects of the Exemption of School Construction Projects from Ohio’s Prevailing Wage Law, Ohio Legislative Service Commission, May 20, 2002.

Analysis and Interpretation
16
somewhat, the savings from this study would almost certainly fall within the range indicated above.

Prevailing Wage Rates in Minnesota, Minnesota Taxpayers Association
17
V. Recommendations
This report has examined the issue of prevailing wages in the state of Minnesota, and has tried to provide reasonable estimates of the fiscal impact on taxpayers of the changes to current statute; both by moving to the federal wage determinations, and from moving to DEED’s published median wage. Minnesota’s modal method of determining prevailing wages for public construction projects is used only in one other state, California. It results in wage rates significantly higher than those reported by DEED in its median wage survey. Using the federal method for calculating prevailing wage rates would add even more cost to public construction projects, apparently because of the limited number of federal projects and limited federal survey data in Minnesota. The term “prevailing wage” itself connotes a wage that is typical of an area, and is most likely commonly understood as an average wage by the general public. However, its application in Minnesota results in prevailing wage rates that are not reflective of typical wage rates. The primary purpose of “Little Davis-Bacon” laws is to protect local workers from cheap, imported labor, and as long as the wage rates that are used are truly “prevailing” (that is, typical of an area), that purpose does not seem to be threatened regardless of the methodology used to calculate those rates. The claim by proponents of the current method of calculating Minnesota’s prevailing wage rates that buildings are constructed more quickly and with better quality cannot be evaluated in a study like this of such limited scope. However, our underlying assumption is that contract specifications, penalty provisions for delays, and aggressive construction management can provide at the very least an equally effective alternative method for addressing timing and quality issues for public construction projects. In view of these observations, MTA recommends: • That the widely used DEED survey for median wages be used as an alternative definition
of prevailing wage for public construction projects in Minnesota; o The methodology underlying the current system is, at best, not indicative of wage
rates that actually prevail in a given area. The modal, rather than median or average, calculation of prevailing wage provides a built-in incentive to unions to report their wage rates, which are standardized to the penny. The voluntary reporting system further ensures that those who benefit least from the current wage determination system have little, if any reason to report wage data.
• that DEED develop a survey comparable to the median wage survey for employee benefits to be used for the benefits portion of the prevailing wage rates as an alternative to the currently determined prevailing benefit rates;
o The Department of Employment and Economic Development’s quarterly survey is the most comprehensive in the state.
• that this alternate method of determining prevailing wage rates be tested in specific locations and compared to comparable public construction projects in the state in order to compare the costs of such projects directly with one another, at the earliest possible time.
Such a comparison would allow there to be an empirical test of the claims of both proponents and opponents of Minnesota’s current prevailing wage law. Should the test demonstrate that

Recommendations
18
using the median wage rates calculated by Minnesota’s DEED results in lowered costs for public construction projects, those median wage rates (along with DEED’s surveyed benefits rates) should then replace Minnesota’s current method of determining prevailing wage rates.
Prevailing Wage Rates in Minnesota, Minnesota Taxpayers Association
19
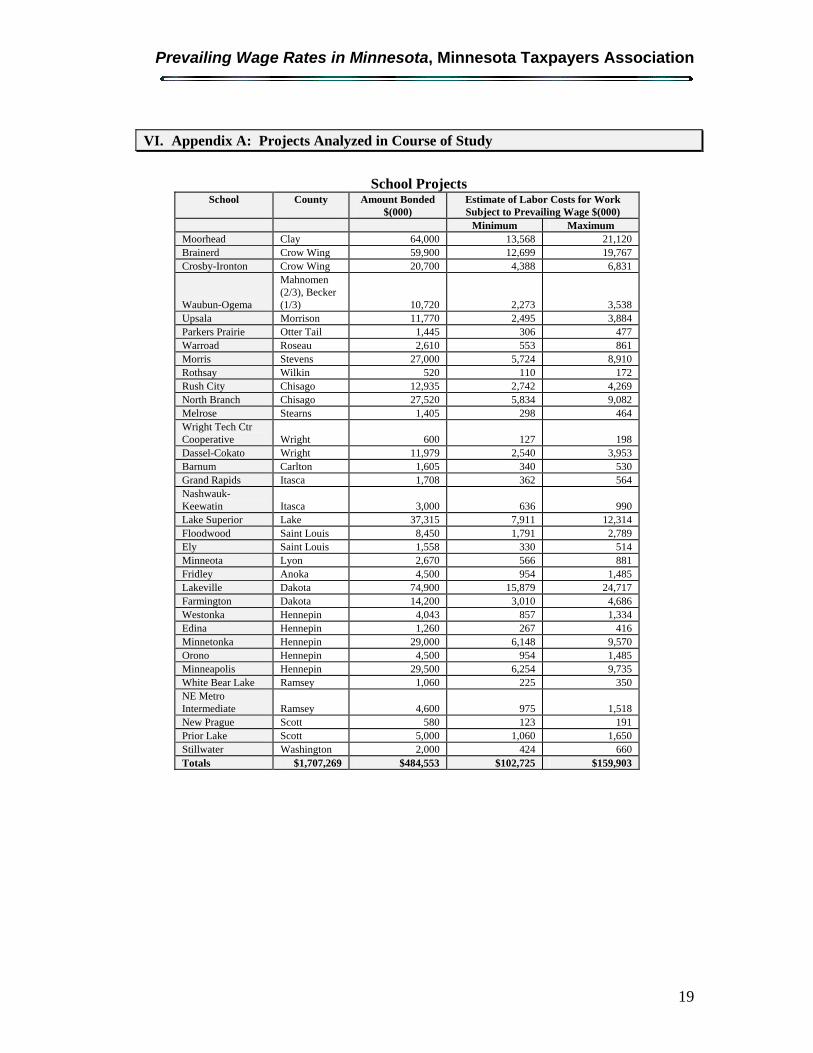
VI. Appendix A: Projects Analyzed in Course of Study
School Projects
School County Amount Bonded $(000)
Estimate of Labor Costs for Work Subject to Prevailing Wage $(000)
Minimum Maximum Moorhead Clay 64,000 13,568 21,120 Brainerd Crow Wing 59,900 12,699 19,767 Crosby-Ironton Crow Wing 20,700 4,388 6,831
Waubun-Ogema
Mahnomen (2/3), Becker (1/3) 10,720 2,273 3,538
Upsala Morrison 11,770 2,495 3,884 Parkers Prairie Otter Tail 1,445 306 477 Warroad Roseau 2,610 553 861 Morris Stevens 27,000 5,724 8,910 Rothsay Wilkin 520 110 172 Rush City Chisago 12,935 2,742 4,269 North Branch Chisago 27,520 5,834 9,082 Melrose Stearns 1,405 298 464 Wright Tech Ctr Cooperative Wright 600 127 198 Dassel-Cokato Wright 11,979 2,540 3,953 Barnum Carlton 1,605 340 530 Grand Rapids Itasca 1,708 362 564 Nashwauk-Keewatin Itasca 3,000 636 990 Lake Superior Lake 37,315 7,911 12,314 Floodwood Saint Louis 8,450 1,791 2,789 Ely Saint Louis 1,558 330 514 Minneota Lyon 2,670 566 881 Fridley Anoka 4,500 954 1,485 Lakeville Dakota 74,900 15,879 24,717 Farmington Dakota 14,200 3,010 4,686 Westonka Hennepin 4,043 857 1,334 Edina Hennepin 1,260 267 416 Minnetonka Hennepin 29,000 6,148 9,570 Orono Hennepin 4,500 954 1,485 Minneapolis Hennepin 29,500 6,254 9,735 White Bear Lake Ramsey 1,060 225 350 NE Metro Intermediate Ramsey 4,600 975 1,518 New Prague Scott 580 123 191 Prior Lake Scott 5,000 1,060 1,650 Stillwater Washington 2,000 424 660 Totals $1,707,269 $484,553 $102,725 $159,903

Appendix A
20
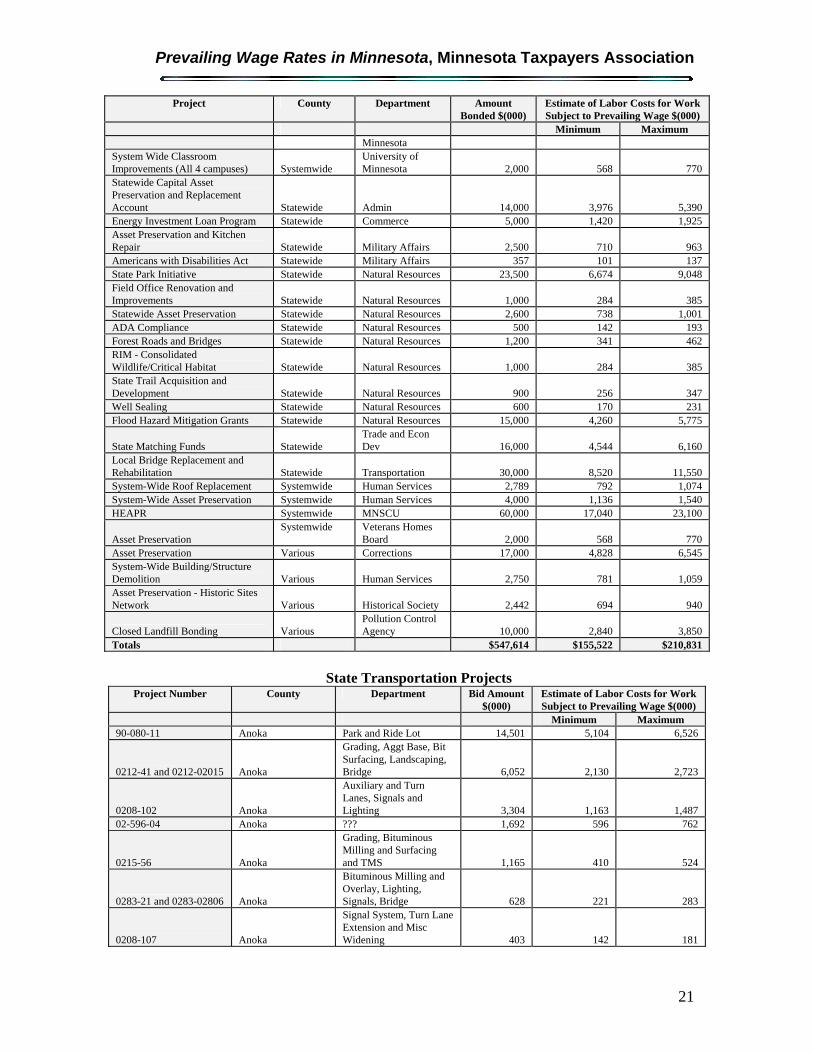
State Building Projects
Project County Department Amount Bonded $(000)
Estimate of Labor Costs for Work Subject to Prevailing Wage $(000)
Minimum Maximum Lino Lakes 416 Bed Offender Housing Unit Anoka Corrections 4,146 1,177 1,596 Red Lake School Additions and Renovations Beltrami Education 12,400 3,522 4,774 MSU Moorhead - New Science Building Clay MNSCU 18,955 5,383 7,298 Sibley Historic Site Preservation Dakota Historical Society 300 85 116 Hastings V.H. Renovation and Improvements Dakota
Veterans Homes Board 8,553 2,429 3,293
Asset Presevation Dakota Zoological Gardens 3,000 852 1,155
Alexandria TC - Classroom/Technology Bldg Douglas MNSCU 9,150 2,599 3,523 Northwest Metro Busway Hennepin Metro Council 20,000 5,680 7,700 Historic Fort Snelling Site Improvements Hennepin Historical Society 500 142 193 Normandale CC - Science Remodel Phase 2 Hennepin MNSCU 9,900 2,812 3,812 Mpls C&TC - Consolidation Remodel Phase 2 Hennepin MNSCU 9,000 2,556 3,465
Performance Hall Cat Walk Hennepin Perpich Center for A.E. 125 36 48
Asset Preservation Hennepin Perpich Center for A.E. 643 183 248
Nicholson Hall Hennepin University of Minnesota 10,000 2,840 3,850
Fergus Falls RTC - Upgrade Program Facilities Otter Tail Human Services 3,000 852 1,155 Fergus Falls - Solid Waste Combustor Otter Tail
Office of Env. Assist. 1,150 327 443
Office Facilities Development Pennington Natural Resources 1,500 426 578
Crookston - Bede Hall Replacement Polk University of Minnesota 7,701 2,187 2,965
Health and Agriculture Laboratories Ramsey Admin 60,000 17,040 23,100 Capitol Complex Electrical Work Ramsey Admin 3,231 918 1,244 Capitol Building: Asset Preservation Ramsey
Capital Area Arch. Pl. Bd. 646 183 249
Metro SU - Library and Info Technology Center Ramsey MNSCU 17,442 4,954 6,715 Century C&TC - Design Intermediate Space Remodel Ramsey MNSCU 2,500 710 963 St. Paul - Plant Growth Facilities, Phase II Ramsey
University of Minnesota 17,700 5,027 6,815
Shakopee - ILC Renovation and Support Space Scott Corrections 3,070 872 1,182 Metro Regional Parks Capital Improvements Metro Counties Natural Resources 6,000 1,704 2,310
Silver Bay V.H. Roof Replacement Lake Veterans Homes Board 2,345 666 903
Saint Peter Regional Treatment Center - Convert Power Plan to Low Pressure Nicollet Human Services 3,619 1,028 1,393
Asset Preservation Rice Minnesota State Academies 1,500 426 578
Duluth - Laboratory Science Building Saint Louis
University of Minnesota 25,500 7,242 9,818
Winona SU - New Science Building Winona MNSCU 30,000 8,520 11,550 MSC-SETC - Student Services Remodel
Goodhue and Winona MNSCU 1,900 540 732
Systemwide - HEAPR Systemwide University of 35,000 9,940 13,475
Prevailing Wage Rates in Minnesota, Minnesota Taxpayers Association
21
Project County Department Amount Bonded $(000)
Estimate of Labor Costs for Work Subject to Prevailing Wage $(000)
Minimum Maximum Minnesota
System Wide Classroom Improvements (All 4 campuses) Systemwide
University of Minnesota 2,000 568 770
Statewide Capital Asset Preservation and Replacement Account Statewide Admin 14,000 3,976 5,390 Energy Investment Loan Program Statewide Commerce 5,000 1,420 1,925 Asset Preservation and Kitchen Repair Statewide Military Affairs 2,500 710 963 Americans with Disabilities Act Statewide Military Affairs 357 101 137 State Park Initiative Statewide Natural Resources 23,500 6,674 9,048 Field Office Renovation and Improvements Statewide Natural Resources 1,000 284 385 Statewide Asset Preservation Statewide Natural Resources 2,600 738 1,001 ADA Compliance Statewide Natural Resources 500 142 193 Forest Roads and Bridges Statewide Natural Resources 1,200 341 462 RIM - Consolidated Wildlife/Critical Habitat Statewide Natural Resources 1,000 284 385 State Trail Acquisition and Development Statewide Natural Resources 900 256 347 Well Sealing Statewide Natural Resources 600 170 231 Flood Hazard Mitigation Grants Statewide Natural Resources 15,000 4,260 5,775
State Matching Funds Statewide Trade and Econ Dev 16,000 4,544 6,160
Local Bridge Replacement and Rehabilitation Statewide Transportation 30,000 8,520 11,550 System-Wide Roof Replacement Systemwide Human Services 2,789 792 1,074 System-Wide Asset Preservation Systemwide Human Services 4,000 1,136 1,540 HEAPR Systemwide MNSCU 60,000 17,040 23,100
Asset Preservation Systemwide Veterans Homes
Board 2,000 568 770 Asset Preservation Various Corrections 17,000 4,828 6,545 System-Wide Building/Structure Demolition Various Human Services 2,750 781 1,059 Asset Preservation - Historic Sites Network Various Historical Society 2,442 694 940
Closed Landfill Bonding Various Pollution Control Agency 10,000 2,840 3,850
Totals $547,614 $155,522 $210,831
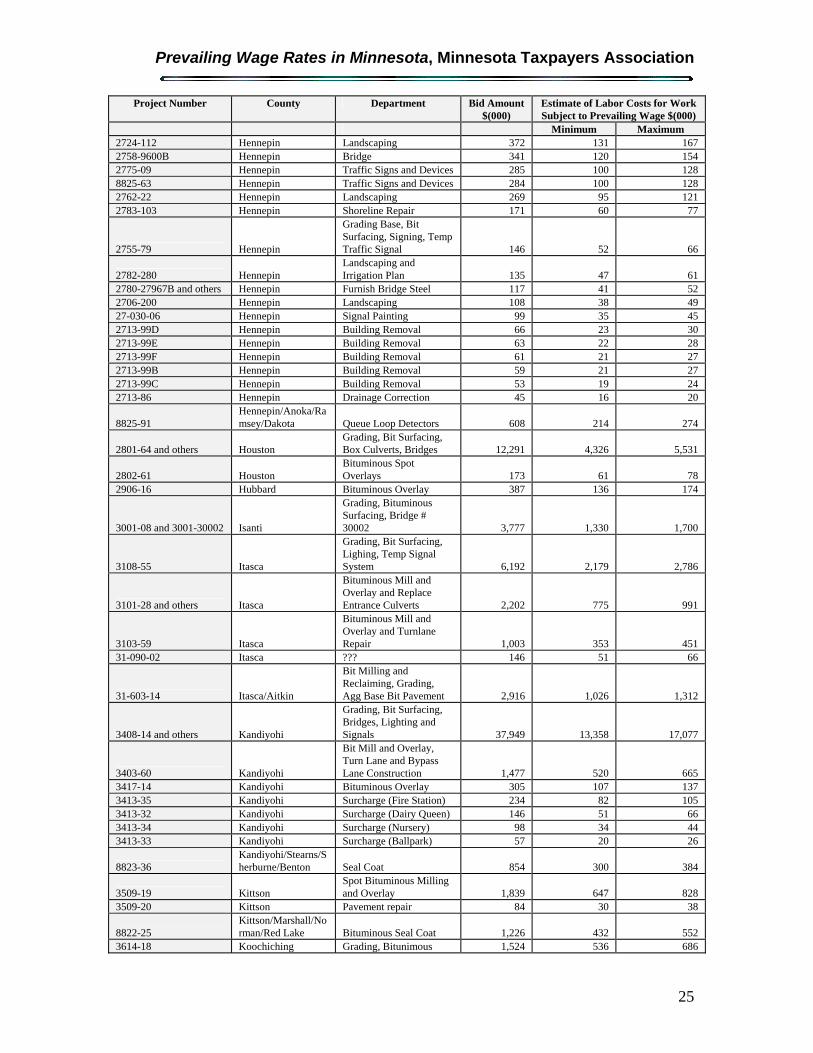
State Transportation Projects Project Number County Department Bid Amount
$(000) Estimate of Labor Costs for Work Subject to Prevailing Wage $(000)
Minimum Maximum 90-080-11 Anoka Park and Ride Lot 14,501 5,104 6,526
0212-41 and 0212-02015 Anoka
Grading, Aggt Base, Bit Surfacing, Landscaping, Bridge 6,052 2,130 2,723
0208-102 Anoka
Auxiliary and Turn Lanes, Signals and Lighting 3,304 1,163 1,487
02-596-04 Anoka ??? 1,692 596 762
0215-56 Anoka
Grading, Bituminous Milling and Surfacing and TMS 1,165 410 524
0283-21 and 0283-02806 Anoka
Bituminous Milling and Overlay, Lighting, Signals, Bridge 628 221 283
0208-107 Anoka
Signal System, Turn Lane Extension and Misc Widening 403 142 181

Appendix A
22
Project Number County Department Bid Amount $(000)
Estimate of Labor Costs for Work Subject to Prevailing Wage $(000)
Minimum Maximum
8825-52 Anoka/Chisago/Dakota/Ramsey Group Relamping 371 131 167
8825-71 Anoka/Hennepin/Ramsey
Traffic Management Changeable Messages Signs and Signing 418 147 188
0205-78 and others Anoka/Washington
Signal Systems Interconnect and Electric Lighting System 125 44 56
0416-27 and others Beltrami Grading, Bit Surfacing, Signals, Bridges 4,324 1,522 1,946
04-605-25 Beltrami Agg Base and Shoulder, Bit Surf 737 260 332
04-615-15 Beltrami
Signal Systems, Shldr Widening, Agg Base, Bit Surf 444 156 200
8822-15 Beltrami Traffic Signs and Devices 305 107 137 0406-49 Beltrami Drainage Ditch 39 14 17
0502-89 and 0502-05016 Benton Grading, Surfacing, Retaining Wall, Drainage 7,926 2,790 3,567
05-604-20 Benton Grading, Agg base, Bit Surfacing 1,817 640 818
05-596-01 Benton Grading, Base, Bituminous Surfacing 899 316 405
8823-30 Benton/Stearns Signal Revisions 108 38 48
0713-71 Blue Earth
Grading, Bit Surfacing, Lihgting and Retaining Wall 1,669 587 751
137-090-04 Blue Earth North Minnesota River Trail 990 349 446
0702-108 and 8103-45 Blue Earth/Waseca
Grading, Base, Bituminous and Concrete Surfacing 13,425 4,726 6,041
0707-11 and 8105-19 Blue Earth/Waseca Seal Coat 245 86 110
0910-26 and 0916-09 Carlton
Grading, Bit Mill and Surfacing, Lighting and Utilities 2,074 730 933
0980-135 Carlton Bituminous Mill and Inlay 490 173 221
0980-133 Carlton De-Icing System 158 56 71 0980-09819 and 5580-58816 Carlton/Olmsted Bridge Painting 235 83 106
1002-74 Carver
Bit Mill and Overlay, Turn Lane and Shld Widening and Signing 550 194 248
91-090-02 Carver Bike Trail Underpass 427 150 192
1012-22 Carver Bituminous Mill and Overlay 53 19 24
1004-24 and others Carver/Hennepin
Shld and Turn Lane Const, Bit Overlay, Bridge, Utilities 6,030 2,123 2,713
1119-32 Cass Bituminous Milling and Overlay and Turn Lanes 1,027 362 462
1115-20 Cass Grading and Bituminous Surfacing 218 77 98
1104-21 and 3106-23 Cass/Itasca
Bit Mill and Overlay, Culvert Replacement, Turn Lane Const 2,298 809 1,034
1115-18 and others Cass/Morrison
Grading, Crack and Seat Conc, Bit Surfacing, Culv, Bridge 3,821 1,345 1,719
8823-31 Cass/Todd Bituminous Seal Coat 210 74 94
1207-18 and 3409-17 Chippewa/Kandiyohi Bituminous Overlay 520 183 234

Prevailing Wage Rates in Minnesota, Minnesota Taxpayers Association
23
Project Number County Department Bid Amount $(000)
Estimate of Labor Costs for Work Subject to Prevailing Wage $(000)
Minimum Maximum
8828-46 Chippewa/Kandiyohi Seal Coat Surfacing 141 50 63
1402-15 Clay
Bit Mill and Overlay, Turn lane Const, Culvert Replacement 1,826 643 822
1504-10 Clearwater
Milling, Bit Overlay, Culvert Replacement, Crack Treatment 715 252 322
1602-38 Cook
Grading, Bit Surfacing, Drainage Structures, Box Culvert 6,341 2,232 2,854
1601-59 Cook
Bituminous Milling and Surfacing, Turn Lanes, Drainage 1,224 431 551
1604-38 Cook Const Fish Ladder in Box Culvert 36 12 16
8821-80 Cook/Carlton/Itasca/Koochiching/Pine
Bit Mill and Overlay, Turn Lanes, Replace Strip Seal, etc. 327 115 147
8821-83
Cook/Carlton/Itasca/Koochiching/St. Louis/Pine Message Striping 32 11 14
8821-69 Cook/Pine/Saint Louis/Koochiching
District Wide Culvert Repair and Replacement 1,798 633 809
1703-64 and 1706-24 Cottonwood
Mill, Bit Overlay, Aggregate Shoulders, Culvert Extensions 2,790 982 1,256
1809-58 and 1809-18006 Crow Wing
Grading, Bituminous Sirfacing and Bridge # 18066 4,658 1,640 2,096
1809-65 Crow Wing Landscaping 318 112 143
1923-08 Dakota
Bit Milling and Overlay, Guardrail, Culvert Improvements 1,257 443 566
1928-47 Dakota
Bituminous Mill and Overlay and Guardrail Improvements 918 323 413
1982-19859A Dakota Shoulder Reinforcement and Bridge Rehab 896 315 403
1980-64 Dakota Traffic Management System 631 222 284
1980-19848 Dakota Bridge # 19848 and Approaches 442 155 199
8825-61 Dakota Traffic Signs and Devices 171 60 77
1909-83 Dakota Traffic Control Signal and Interconnect Systems 132 46 59
8825-111 Dakota/Ramsey/Washington
Traffic Management Changeable Message Signs 435 153 196
20-599-85 Dodge Bridge and Approach Grading 525 185 236
2007-35 Dodge Traffic Control Signal System 110 39 50
2002-30 Dodge Landscaping 70 25 31
2003-11 and others Dodge/Freeborn/Mower
Bituminous Mill and Overlay and Ditch Cleaning 177 62 80
2106-34 and 2106-21002 Douglas Lake Channel and Grading for Bridge 342 120 154
2204-23 Faribault Bituminous Overlay 320 112 144
2208-39 Faribault Remove and Replace Bituminous Shoulders 100 35 45
2307-16 and others Filllmore Grading, Bit Surfacing, 2,326 819 1,047

Appendix A
24
Project Number County Department Bid Amount $(000)
Estimate of Labor Costs for Work Subject to Prevailing Wage $(000)
Minimum Maximum Bridges
2304-44 Filllmore Bituminous Mill and Overlay 360 127 162
2480-81 and others Freeborn
Unbonded Conc Overlay with Bit Shld and Bridge Repair 14,684 5,169 6,608
8826-20 Freeborn
Bit and Conc Mill, Bit Overlay, Turn Lanes, Pavement 680 239 306
2480-96 Freeborn Landscaping 74 26 34 2401-34 Freeborn Jacking of Drainage Tile 25 9 11 2516-9040A Goodhue Bridge Painting 2,844 1,001 1,280
2502-22 Goodhue Bituminous Mill and Overlay 250 88 112
2514-113 Goodhue Traffic Control Signal System 206 72 93
2506-63 Goodhue Bituminous Pavement Crack Repair 39 14 17
2512-10 and 7902-18 Goodhue/Wabasha
Right Turn Lanes, Bituminous Mill and Overlay 1,108 390 499
2610-10 Grant Grading, Bituminous and Concerte Surfacing 6,948 2,446 3,127
2603-09 Grant Landscaping 34 12 15
2785-327 and others Hennepin Grading, Conc and Bit Surfacing 28,623 10,075 12,881
2786-115 Hennepin
Grading, Conc and Bit Surfacing, Drainage, Noise Walls, etc 20,514 7,221 9,231
2735-172 Hennepin Grading, Surfacing, Signals, Bridge # 27283 15,426 5,430 6,942
2780-53 and others Hennepin
SHLG Replacement and Widening and various bridges 7,198 2,534 3,239
2774-07 and others Hennepin
Bit Mill and Overlay, Storm Sewer, Median Barrier, Br Painting 3,870 1,362 1,742
2781-337 and 2781-400 Hennepin
Lowry Hill and Portland Tunnel Lighting Modifications 3,778 1,330 1,700
2785-27V33A and 2785-27V34A Hennepin Bridges (steel only) 3,625 1,276 1,631
2785-332 Hennepin
Misc Grading, Bit Surfacing, Retaining Wall, Signal, etc 3,241 1,141 1,458
2758-60 Hennepin
Mill and Overlay, Bit Surfacing, Conc Pavt Rehab 2,929 1,031 1,318
2744-54 Hennepin
Bituminous Mill and Overlay, Guardrail and Drainage 1,528 538 687
2772-39 Hennepin Noise Wall and Retaining Wall 1,482 522 667
116-090-01 Hennepin Ped/Bike Br. 1,335 470 601 2782-6652 and others Hennepin Bridge Painting 1,068 376 481
2785-325 Hennepin
Bituminous Mill and Overlay, TMC and Striping 979 345 440
2724-113 Hennepin Landscaping 530 187 239
2714-138 Hennepin Turn Lane, Revise Traffic Signals and Interconnect 505 178 227
2758-9600A Hennepin Bridge Painting 419 147 188
Prevailing Wage Rates in Minnesota, Minnesota Taxpayers Association
25
Project Number County Department Bid Amount $(000)
Estimate of Labor Costs for Work Subject to Prevailing Wage $(000)
Minimum Maximum 2724-112 Hennepin Landscaping 372 131 167 2758-9600B Hennepin Bridge 341 120 154 2775-09 Hennepin Traffic Signs and Devices 285 100 128 8825-63 Hennepin Traffic Signs and Devices 284 100 128 2762-22 Hennepin Landscaping 269 95 121 2783-103 Hennepin Shoreline Repair 171 60 77
2755-79 Hennepin
Grading Base, Bit Surfacing, Signing, Temp Traffic Signal 146 52 66
2782-280 Hennepin Landscaping and Irrigation Plan 135 47 61
2780-27967B and others Hennepin Furnish Bridge Steel 117 41 52 2706-200 Hennepin Landscaping 108 38 49 27-030-06 Hennepin Signal Painting 99 35 45 2713-99D Hennepin Building Removal 66 23 30 2713-99E Hennepin Building Removal 63 22 28 2713-99F Hennepin Building Removal 61 21 27 2713-99B Hennepin Building Removal 59 21 27 2713-99C Hennepin Building Removal 53 19 24 2713-86 Hennepin Drainage Correction 45 16 20
8825-91 Hennepin/Anoka/Ramsey/Dakota Queue Loop Detectors 608 214 274
2801-64 and others Houston Grading, Bit Surfacing, Box Culverts, Bridges 12,291 4,326 5,531
2802-61 Houston Bituminous Spot Overlays 173 61 78
2906-16 Hubbard Bituminous Overlay 387 136 174
3001-08 and 3001-30002 Isanti
Grading, Bituminous Surfacing, Bridge # 30002 3,777 1,330 1,700
3108-55 Itasca
Grading, Bit Surfacing, Lighing, Temp Signal System 6,192 2,179 2,786
3101-28 and others Itasca
Bituminous Mill and Overlay and Replace Entrance Culverts 2,202 775 991
3103-59 Itasca
Bituminous Mill and Overlay and Turnlane Repair 1,003 353 451
31-090-02 Itasca ??? 146 51 66
31-603-14 Itasca/Aitkin
Bit Milling and Reclaiming, Grading, Agg Base Bit Pavement 2,916 1,026 1,312
3408-14 and others Kandiyohi
Grading, Bit Surfacing, Bridges, Lighting and Signals 37,949 13,358 17,077
3403-60 Kandiyohi
Bit Mill and Overlay, Turn Lane and Bypass Lane Construction 1,477 520 665
3417-14 Kandiyohi Bituminous Overlay 305 107 137 3413-35 Kandiyohi Surcharge (Fire Station) 234 82 105 3413-32 Kandiyohi Surcharge (Dairy Queen) 146 51 66 3413-34 Kandiyohi Surcharge (Nursery) 98 34 44 3413-33 Kandiyohi Surcharge (Ballpark) 57 20 26
8823-36 Kandiyohi/Stearns/Sherburne/Benton Seal Coat 854 300 384
3509-19 Kittson Spot Bituminous Milling and Overlay 1,839 647 828
3509-20 Kittson Pavement repair 84 30 38
8822-25 Kittson/Marshall/Norman/Red Lake Bituminous Seal Coat 1,226 432 552
3614-18 Koochiching Grading, Bitunimous 1,524 536 686

Appendix A
26
Project Number County Department Bid Amount $(000)
Estimate of Labor Costs for Work Subject to Prevailing Wage $(000)
Minimum Maximum Surfacing, Signing and Lighting
3602-24 Koochiching
Grading, Bitumibnous Surfacing, Curb and Gutter, Sidewalk 347 122 156
3609-31 Koochiching Clearing Trees and Brush along the Roadway 180 63 81
37-602-14 Lac Qui Parle Bituminous Surfacing and Aggregate Surfacing 1,611 567 725
8828-47
Lac Qui Parle/Kandiyohi/Meeker/Yellow Medicine
Bituminous Surface Repair, Route and Seal 67 23 30
3805-91 Lake
Fire Protection System and Const of Access Road 225 79 101
3904-20 Lake of the Woods Cold-inplace-recycle, Bit Overlay, Culvert Repair 1,683 592 757
4013-43 and 4013-40007 Le Sueur
Grading, Bit Surfacing, Drainage, Lighting and Br # 40007 6,354 2,237 2,859
41-617-23 Lincoln Bikepath Grading and Street Overlay 337 119 152
4105-08 and others Lincoln/Lyon/Pipestone
Bituminous Mill, Cold Recycle and Bituminous Overlay 2,008 707 904
8828-45
Lincoln/Lyon/Redwood/Yellow Medicine Seal Coat Surfacing 430 151 194
4202-24 Lyon
Bit Mill and Overlay, Edge Drains, Replace Widening Block, etc 1,421 500 639
42-602-30 Lyon Agg Base, Bit Surface, Agg Shoulder 814 287 366
139-129-01 Lyon Bridege Replacement and Approaches 581 205 262
8828-48 Lyon Bituminous Shoulder and Riprap 122 43 55
4203-41 and 5902-21 Lyon/Pipestone
Bit Mill and Overlay, Turn/Bypass Lane Construction 4,028 1,418 1,812
4501-36 and 4501-45002 Marshall
Grading, Bit Paving, Storm and Sanitary Sewer, Br # 45002 2,715 956 1,222
4508-23 Marshall Bituminous Overlay 1,218 429 548 4603-41 Martin Bituminous Overlay 111 39 50
47-999-02 Meeker
Storm Repair - Slope Repair and Ditch Cleanout 83 29 37
4709-26 Meeker Concrete Pavement Replacement 56 20 25
8825-58 and 8825-60 Metro Region Signal Sys Controller and Cab Replacement 106 37 48
8823-33 Morrison Micro-Surfacing 172 61 78 8823-32 Morrison/Wadena Bituminous Overlay 326 115 147 165-999-01 Nicollet Street Restoration 556 196 250 5203-89 Nicollet Bituminous Overlay 146 51 66
5308-28 and 5308-53007 Nobles Grading, Bit Surfacing, Box Culv 1,276 449 574
5307-26 Nobles Mill Bituminous Surface and Bituminous Overlay 168 59 76
8823-34 Northwest Region/Northeast
Bituminous Spot Overlays 286 101 129

Prevailing Wage Rates in Minnesota, Minnesota Taxpayers Association
27
Project Number County Department Bid Amount $(000)
Estimate of Labor Costs for Work Subject to Prevailing Wage $(000)
Minimum Maximum Region/Central Region
8824-31
Northwest Region/Southwest Region
Bituminous Crack Sealing 148 52 67
8824-33
Northwest Region/Southwest Region Bituminous Seal Coat 1,529 538 688
5502-99A Olmsted Building Removal 572 201 258
5508-104 Olmsted Traffic Control Signal System 89 31 40
5601-30 Otter Tail Bituminous Mill and Overlay and Edge Drains 1,766 622 795
5622-15 Otter Tail Bituminous Milling and Overlay 229 81 103
8824-23
Otter Tail/Douglas/Pope/Stearns Riprap 169 59 76
5703-39 Pennington
Grading, Bit Pavement, Storn Sewer, C and G, Sidewalk, Box Culv 1,653 582 744
5802-19 Pine Erosion Control 82 29 37
59-611-03 Pipestone Grading, Agg base, Bit Surfacing, Box Culvert 964 339 434
59-610-23 Pipestone
Plant Mixed Bit Non Wearing and Wearing Courses aand Agg Shldrs 453 160 204
5905-21 and others Pipestone/Rock
Bituminous Milling and Overlay and Aggregate Shoulders 2,589 911 1,165
6008-14 Polk
Bituminous Mill and Overlay and Subsurface Drainage 2,020 711 909
6286-47 Ramsey Bituminous Mill and Overlay and Guardrail 1,754 617 789
6283-155 Ramsey Traffic Management System 1,320 465 594
6221-40 Ramsey Bituminous and Concrete Mill and Overlay 615 216 277
6285-128 Ramsey Traffic Management System 584 205 263
6222-141 Ramsey Guardrail Improvements 127 45 57 6212-151 Ramsey Electric Lighting System 44 16 20 6211-80 Ramsey Traffic Signs and Devices 43 15 19
62-642-03 Ramsey/Hennepin Widen and Rehabilitate Ford Bridge 18,690 6,579 8,410
6286-62825 and others Ramsey/Washington
JT Replacement, Railing and Deck Repair, Bridge Painting 1,766 621 795
64-613-14 Redwood Grading, Base, Bituminous Surfacing 868 306 391
64-606-25 Redwood Construction Bridge and Approaches 624 220 281
64-999-02 Redwood
Bituminous Shoulder and Riprap Placement on Inslopes 145 51 65
6511-30 Renville
Concrete and Bituminous Paving, Signal and Lighting 5,784 2,036 2,603
8809-264 Rice/Steele Traffic Signs on Railroad Corridor 73 56 20 25
6706-14 Rock Bituminous Mill and Overlay 540 190 243
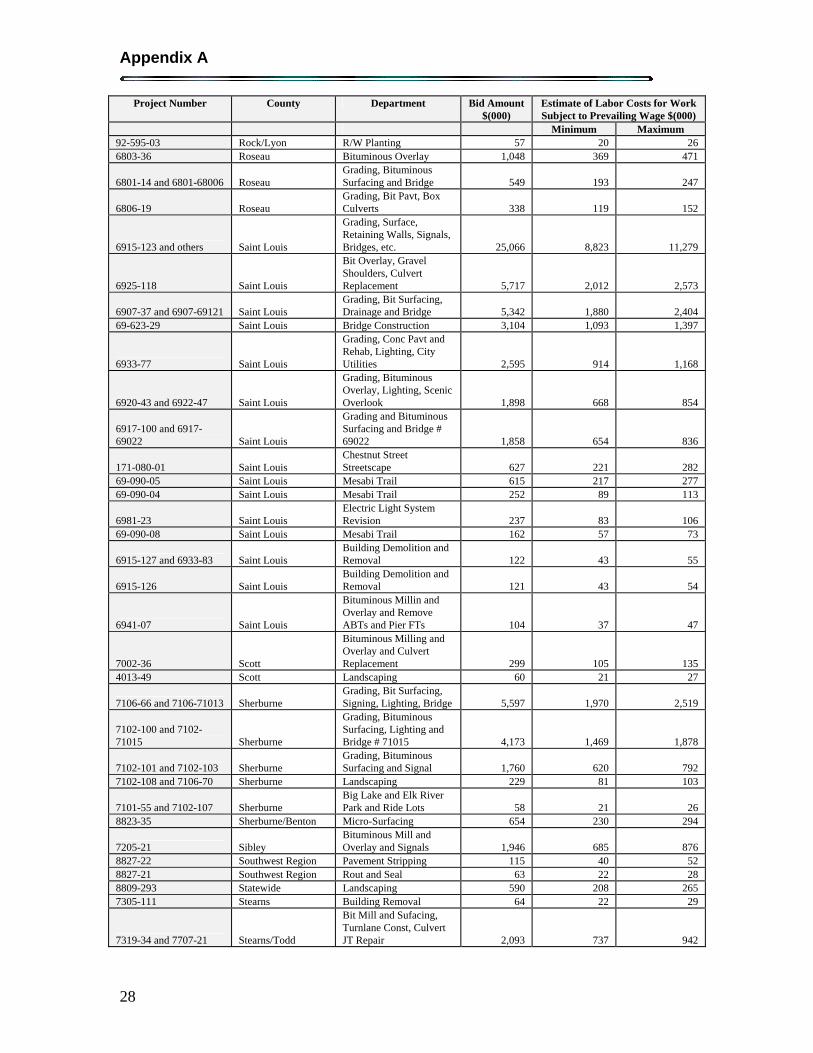
Appendix A
28
Project Number County Department Bid Amount $(000)
Estimate of Labor Costs for Work Subject to Prevailing Wage $(000)
Minimum Maximum 92-595-03 Rock/Lyon R/W Planting 57 20 26 6803-36 Roseau Bituminous Overlay 1,048 369 471
6801-14 and 6801-68006 Roseau Grading, Bituminous Surfacing and Bridge 549 193 247
6806-19 Roseau Grading, Bit Pavt, Box Culverts 338 119 152
6915-123 and others Saint Louis
Grading, Surface, Retaining Walls, Signals, Bridges, etc. 25,066 8,823 11,279
6925-118 Saint Louis
Bit Overlay, Gravel Shoulders, Culvert Replacement 5,717 2,012 2,573
6907-37 and 6907-69121 Saint Louis Grading, Bit Surfacing, Drainage and Bridge 5,342 1,880 2,404
69-623-29 Saint Louis Bridge Construction 3,104 1,093 1,397
6933-77 Saint Louis
Grading, Conc Pavt and Rehab, Lighting, City Utilities 2,595 914 1,168
6920-43 and 6922-47 Saint Louis
Grading, Bituminous Overlay, Lighting, Scenic Overlook 1,898 668 854
6917-100 and 6917-69022 Saint Louis
Grading and Bituminous Surfacing and Bridge # 69022 1,858 654 836
171-080-01 Saint Louis Chestnut Street Streetscape 627 221 282
69-090-05 Saint Louis Mesabi Trail 615 217 277 69-090-04 Saint Louis Mesabi Trail 252 89 113
6981-23 Saint Louis Electric Light System Revision 237 83 106
69-090-08 Saint Louis Mesabi Trail 162 57 73
6915-127 and 6933-83 Saint Louis Building Demolition and Removal 122 43 55
6915-126 Saint Louis Building Demolition and Removal 121 43 54
6941-07 Saint Louis
Bituminous Millin and Overlay and Remove ABTs and Pier FTs 104 37 47
7002-36 Scott
Bituminous Milling and Overlay and Culvert Replacement 299 105 135
4013-49 Scott Landscaping 60 21 27
7106-66 and 7106-71013 Sherburne Grading, Bit Surfacing, Signing, Lighting, Bridge 5,597 1,970 2,519
7102-100 and 7102-71015 Sherburne
Grading, Bituminous Surfacing, Lighting and Bridge # 71015 4,173 1,469 1,878
7102-101 and 7102-103 Sherburne Grading, Bituminous Surfacing and Signal 1,760 620 792
7102-108 and 7106-70 Sherburne Landscaping 229 81 103
7101-55 and 7102-107 Sherburne Big Lake and Elk River Park and Ride Lots 58 21 26
8823-35 Sherburne/Benton Micro-Surfacing 654 230 294
7205-21 Sibley Bituminous Mill and Overlay and Signals 1,946 685 876
8827-22 Southwest Region Pavement Stripping 115 40 52 8827-21 Southwest Region Rout and Seal 63 22 28 8809-293 Statewide Landscaping 590 208 265 7305-111 Stearns Building Removal 64 22 29
7319-34 and 7707-21 Stearns/Todd
Bit Mill and Sufacing, Turnlane Const, Culvert JT Repair 2,093 737 942
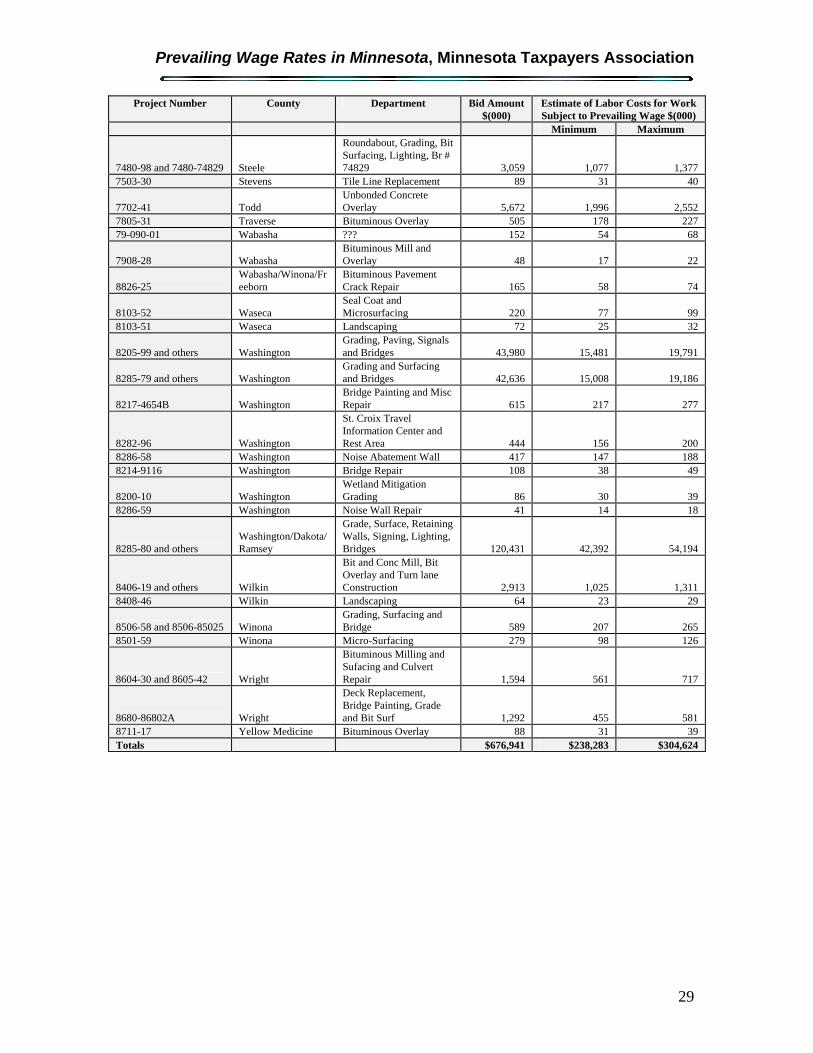
Prevailing Wage Rates in Minnesota, Minnesota Taxpayers Association
29
Project Number County Department Bid Amount $(000)
Estimate of Labor Costs for Work Subject to Prevailing Wage $(000)
Minimum Maximum
7480-98 and 7480-74829 Steele
Roundabout, Grading, Bit Surfacing, Lighting, Br # 74829 3,059 1,077 1,377
7503-30 Stevens Tile Line Replacement 89 31 40
7702-41 Todd Unbonded Concrete Overlay 5,672 1,996 2,552
7805-31 Traverse Bituminous Overlay 505 178 227 79-090-01 Wabasha ??? 152 54 68
7908-28 Wabasha Bituminous Mill and Overlay 48 17 22
8826-25 Wabasha/Winona/Freeborn
Bituminous Pavement Crack Repair 165 58 74
8103-52 Waseca Seal Coat and Microsurfacing 220 77 99
8103-51 Waseca Landscaping 72 25 32
8205-99 and others Washington Grading, Paving, Signals and Bridges 43,980 15,481 19,791
8285-79 and others Washington Grading and Surfacing and Bridges 42,636 15,008 19,186
8217-4654B Washington Bridge Painting and Misc Repair 615 217 277
8282-96 Washington
St. Croix Travel Information Center and Rest Area 444 156 200
8286-58 Washington Noise Abatement Wall 417 147 188 8214-9116 Washington Bridge Repair 108 38 49
8200-10 Washington Wetland Mitigation Grading 86 30 39
8286-59 Washington Noise Wall Repair 41 14 18
8285-80 and others Washington/Dakota/Ramsey
Grade, Surface, Retaining Walls, Signing, Lighting, Bridges 120,431 42,392 54,194
8406-19 and others Wilkin
Bit and Conc Mill, Bit Overlay and Turn lane Construction 2,913 1,025 1,311
8408-46 Wilkin Landscaping 64 23 29
8506-58 and 8506-85025 Winona Grading, Surfacing and Bridge 589 207 265
8501-59 Winona Micro-Surfacing 279 98 126
8604-30 and 8605-42 Wright
Bituminous Milling and Sufacing and Culvert Repair 1,594 561 717
8680-86802A Wright
Deck Replacement, Bridge Painting, Grade and Bit Surf 1,292 455 581
8711-17 Yellow Medicine Bituminous Overlay 88 31 39 Totals $676,941 $238,283 $304,624

Appendix B
30
VII. Appendix B: DEED Planning Areas and Minnesota Highway/Heavy Prevailing Wage Regions, by County
County DEED
Planning Area Minnesota
Highway/Heavy Prevailing Wage
Region
County DEED Planning Area
Minnesota Highway/Heavy Prevailing Wage
Region Aitkin Northeast MN 3 Marshall Northwest MN 2 Anoka Metro Area 9 Martin Southwest MN 10 Becker Northwest MN 4 Meeker Central MN 8 Beltrami Northwest MN 2 Mille Lacs Central MN 3 Benton Central MN 5 Morrison Northwest MN 3 Big Stone Southwest MN 4 Mower Southeast MN 6 Blue Earth Southwest MN 7 Nicollet Southwest MN 7 Carlton Northeast MN 1 Nobles Southwest MN 10 Carver Metro Area 9 Norman Northwest MN 2 Cass Northwest MN 3 Olmsted Southeast MN 6 Chippewa Southwest MN 8 Otter Tail Northwest MN 4 Chisago Central MN 9 Pennington Northwest MN 2 Clay Northwest MN 4 Pine Central MN 1 Clearwater Northwest MN 2 Pipestone Southwest MN 8 Cook Northeast MN 1 Polk Northwest MN 2 Cottonwood Southwest MN 10 Pope Northwest MN 4 Crow Wing Northwest MN 3 Ramsey Metro Area 9 Dakota Metro Area 9 Red Lake Northwest MN 2 Dodge Southeast MN 6 Redwood Southwest MN 8 Douglas Northwest MN 4 Renville Central MN 8 Faribault Southwest MN 7 Rice Southeast MN 6 Fillmore Southeast MN 6 Rock Southwest MN 10 Freeborn Southeast MN 6 Roseau Northwest MN 2 Goodhue Southeast MN 6 Saint Louis Northeast MN 1 Grant Northwest MN 4 Scott Metro Area 9 Hennepin Metro Area 9 Sherburne Central MN 5 Houston Southeast MN 6 Sibley Southwest MN 7 Hubbard Northwest MN 2 Stearns Central MN 5 Isanti Central MN 5 Steele Southeast MN 6 Itasca Northeast MN 1 Stevens Northwest MN 4 Kanabec Central MN 3 Swift Southwest MN 4 Kandiyohi Central MN 8 Todd Northwest MN 3 Kittson Northwest MN 2 Traverse Northwest MN 4 Koochiching Northeast MN 1 Wabasha Southeast MN 6 Lac Qui Parle Southwest MN 8 Wadena Northwest MN 3 Lake Northeast MN 1 Waseca Southwest MN 7 Lake of the Woods Northwest MN 2 Washington Metro Area 9 Le Sueur Southwest MN 7 Wilkin Northwest MN 4 Lincoln Southwest MN 8 Winona Southeast MN 6 Lyon Southwest MN 8 Wright Central MN 5 Mahnomen Northwest MN 4 Yellow Medicine Southwest MN 8

31
VIII. Appendix C: Brief Survey of Other States' Prevailing Wage Laws
State Statutory/regulatory method13 Alaska Commis. survey, 50% or avg. Arkansas 50% or average California modal rate Connecticut Commis. survey, take Davis-Bacon Delaware 50% or average Hawaii 50%, 30%, or average Illinois ascertain from Director Indiana 3-man committee sets Kentucky 50%, simple average Maine median of survey Maryland 40% or average Massachusetts not less than collectively-bargained Minnesota modal rate Missouri unspecified; annual survey Montana weighted average of survey Nebraska at least rate paid by 50% Nevada use Davis-Bacon New Jersey hold hearings, use collectively-bargained New Mexico 50%, 30%, or average New York annual survey, collectively-bargained if 30% Ohio annual survey, collectively-bargained Oklahoma take federal Davis-Bacon rate Oregon 50% or average Pennsylvania Commis. ascertains Rhode Island Director investigates Tennessee simple average of survey Texas up to individual agency Washington 50% or avg. in largest city West Virginia survey, if necessary Wisconsin weighted average of survey Wyoming by public agency, 2-yr survey, add inflation factor
13 Information from untitled 1995 prevailing wage report, written by Dr. Armand J. Thieblot, Jr., and distributed by ABC National; except for Wisconsin data from MTA research.

Appendix C
32
This Page Intentionally Blank
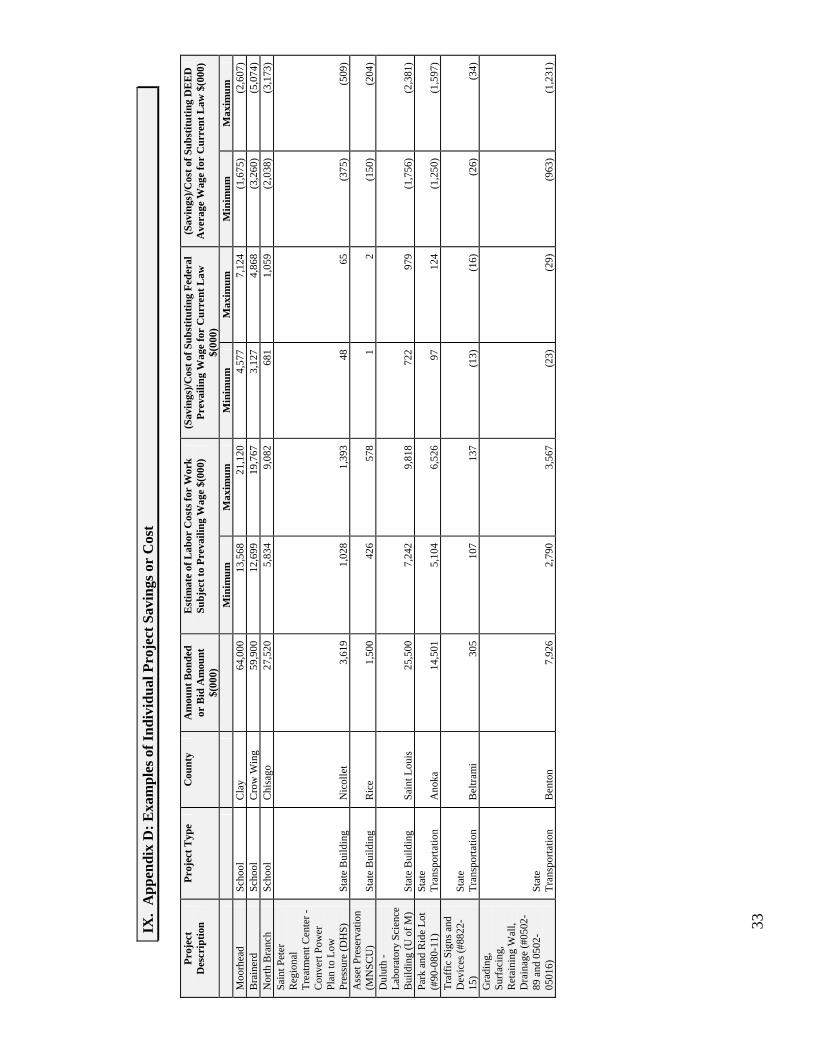
33
IX.
App
endi
x D
: Exa
mpl
es o
f Ind
ivid
ual P
roje
ct S
avin
gs o
r C
ost
Pr
ojec
t D
escr
iptio
n Pr
ojec
t Typ
e C
ount
y A
mou
nt B
onde
d or
Bid
Am
ount
$(
000)
Est
imat
e of
Lab
or C
osts
for
Wor
k Su
bjec
t to
Prev
ailin
g W
age
$(00
0)
(Sav
ings
)/Cos
t of S
ubst
itutin
g Fe
dera
l Pr
evai
ling
Wag
e fo
r C
urre
nt L
aw
$(00
0)
(Sav
ings
)/Cos
t of S
ubst
itutin
g D
EE
D
Ave
rage
Wag
e fo
r C
urre
nt L
aw $
(000
)
Min
imum
M
axim
um
Min
imum
M
axim
um
Min
imum
M
axim
um
Moo
rhea
d
Scho
ol
Cla
y 64
,000
13
,568
21
,120
4,
577
7,12
4 (1
,675
) (2
,607
) B
rain
erd
Sc
hool
C
row
Win
g 59
,900
12
,699
19
,767
3,
127
4,86
8 (3
,260
) (5
,074
) N
orth
Bra
nch
Scho
ol
Chi
sago
27
,520
5,
834
9,08
2 68
1 1,
059
(2,0
38)
(3,1
73)
Sain
t Pet
er
Reg
iona
l Tr
eatm
ent C
ente
r -
Con
vert
Pow
er
Plan
to L
ow
Pres
sure
(DH
S)
Stat
e B
uild
ing
Nic
olle
t 3,
619
1,02
8 1,
393
48
65
(375
) (5
09)
Ass
et P
rese
rvat
ion
(MN
SCU
) St
ate
Bui
ldin
g R
ice
1,50
0 42
6 57
8 1
2 (1
50)
(204
) D
ulut
h -
Labo
rato
ry S
cien
ce
Bui
ldin
g (U
of M
) St
ate
Bui
ldin
g Sa
int L
ouis
25
,500
7,
242
9,81
8 72
2 97
9 (1
,756
) (2
,381
) Pa
rk a
nd R
ide
Lot
(#90
-080
-11)
St
ate
Tran
spor
tatio
n A
noka
14
,501
5,
104
6,52
6 97
12
4 (1
,250
) (1
,597
) Tr
affic
Sig
ns a
nd
Dev
ices
(#88
22-
15)
Stat
e Tr
ansp
orta
tion
Bel
tram
i 30
5 10
7 13
7 (1
3)
(16)
(2
6)
(34)
G
radi
ng,
Surf
acin
g,
Ret
aini
ng W
all,
Dra
inag
e (#
0502
-89
and
050
2-05
016)
St
ate
Tran
spor
tatio
n B
ento
n 7,
926
2,79
0 3,
567
(23)
(2
9)
(963
) (1
,231
)