Embed Size (px)
Citation preview

Prevalence and Associated Factors of Moderate to Severe Heat
Related Illness Among Solid Waste Management Workers in
Negeri Sembilan, Malaysia.
Dr. Zawiah bt Mansor
SUPERVISORProf. Dr. Norhassim bin IsmailProf Dr. Jamal Hisham Hashim
Dr. Rosnah bt Ismail
Seminar on Climate Change and Health 4th May 2017
1

INTRODUCTION
• Intergovernmental Panel on Climate Change (IPCC) concern regarding the increment in average global temperature of 1.4oC‐3.1oC (estimated average 3.00C) in year 2100
• Among occupational groups, higher risk of heat illness are :those who are working outdoor Indoor workers in factories or other workplaces with inadequate cooling facilities.
2

Impact of Occupational Heat related Illness
Heat Syncope
Heat Cramps
Heat Exhaustion
Heat Stroke
3

4
WHAT THIS STUDY WILL ADD? • Heat exposure at outdoor workplace.• Heat related illness among solid waste workers• Factors associated with heat related illness among workers.
• Prevention action that can protect workers from heat related illness.

General objective
• To determine moderate to severe heat related illness and factors affecting it among solid waste management workers in Negeri Sembilan.
Specific Objective
1. To determine the environmental heat exposure level inSeremban district, Negeri Sembilan.
2. To determine prevalence of moderate to severe heatrelated illness among solid waste management worker inSeremban, Negeri Sembilan.
3. To determine factors associated with moderate tosevere heat related illness among solid wastemanagement worker in Seremban, Negeri Sembilan.
5

METHODOLOGY
• Cross sectional study• Solid waste workers in Seremban District, Negeri Sembilan
• March – April 2016
*Solid waste workers included : Sweeping roadside, drain cleaning & grass cutting only
6

Environmental Assesment Personal Assesment
Measurement of WBGT using 3M Quest Temp 34 at the workplace for 8 hours working shift ( 8.00 am‐4pm)
Administration of Study Questionnaire,Heat Illness
Screening Index Questionnaire
Physical examination (BMI)
Data analysis
Simple random sampling of respondent
DATA COLLECTION
7
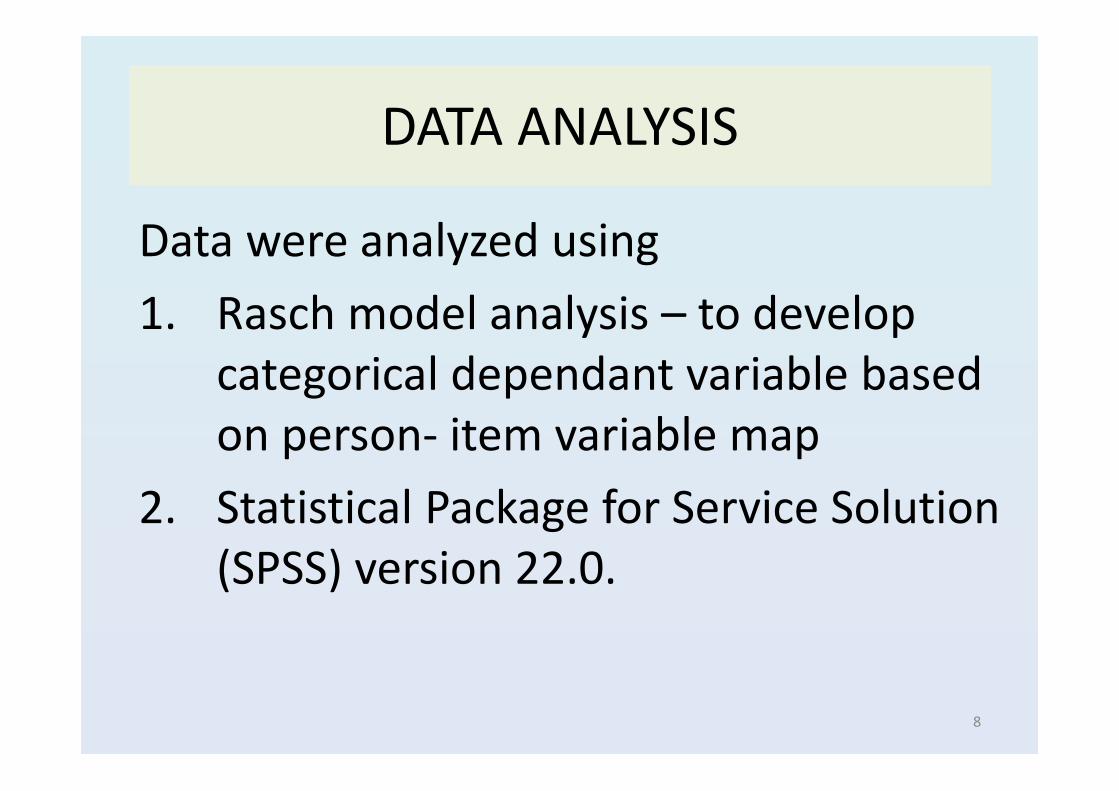
DATA ANALYSIS
Data were analyzed using 1. Rasch model analysis – to develop
categorical dependant variable based on person‐ item variable map
2. Statistical Package for Service Solution (SPSS) version 22.0.
8

RESULT
9

HEAT EXPOSURE AT WORKPLACE
25.00
27.00
29.00
31.00
33.00
35.00
37.00
39.00
8:00
8:30
9:00
9:30
10:00
10:30
11:00
11:30
12:00
12:30
13:00
13:30
14:00
14:30
15:00
15:30
16:00
Ambien
t tem
perature ( oC
)
TIME ( HOURS)
Day 1
Day 2
Day 3
Day 4
Day 5
Day 6
Day 7
Day 8
Ambient Temperature • Mean: 32.84 oC (SD:1.21)• Max : 38.76 oC (Day 4)• Min: 28.05 oC (Day 7)
10

15.00
25.00
35.00
45.00
55.00
65.00
75.00
8:00
8:45
9:30
10:15
11:00
11:45
12:30
13:15
14:00
14:45
15:30
Hum
idity
(%)
Time (hour)
Day 1
Day 2
Day 3
Day 4
Day 5
Day 6
Day 7
Day 8
Humidity• Mean: 40.47% (SD:8.73)• Max : 68.0 % (Day 7) • Min: 22.0 oC % (Day 1)
25.0030.0035.0040.0045.0050.0055.0060.00
8:00
8:45
9:30
10:15
11:00
11:45
12:30
13:15
14:00
14:45
15:30Radian
t tem
perature (oC)
Time (hour)
Day 1
Day 2
Day 3
Day 4
Day 5
Day 6
Day 7
Day 8
Radiant temperature • Mean: 44.64 oC (SD:4.11)• Max : 55.26 oC (Day 1)• Min: 30.72 oC (Day 7)
11

WBGT VALUE AT WORKPLACE
25.00
26.00
27.00
28.00
29.00
30.00
31.00
32.00
33.00
34.00
35.008:00
8:30
9:00
9:30
10:00
10:30
11:00
11:30
12:00
12:30
13:00
13:30
14:00
14:30
15:00
15:30
16:00
WBG
T ( o
C)
Time (hour)
Day 1
Day 2
Day 3
Day 4
Day 5
Day 6
Day 7
Day 8
Mean WBGT • Mean: 30.5oC (SD:0.5)• Max : 34.06 oC (Day 1)• Min: 26.42 oC (Day 3) 12
WBGT (outdoor) =0.7Tw+0.1Ta +0.2Tg

WBGT VALUE AND THRESHOLD BY ACGIH 2006
25.00
26.00
27.00
28.00
29.00
30.00
31.00
32.00
33.00
34.00
35.00
8:00
8:30
9:00
9:30
10:00
10:30
11:00
11:30
12:00
12:30
13:00
13:30
14:00
14:30
15:00
15:30
16:00
WBG
T ( o
C)
Time (hour)
Day 1 Day 2 Day 3 Day 4Day 5 Day 6 Day 7 Day 8
Conclusion: Respondent exposed to above TLV since early hour of working shift high risk of heat illness. 13
Moderate : sweeping roadside & drain cleaning
Heavy : Grass cutting

Rasch AnalysisPerson‐item variable map
PERSON - MAP - ITEM <more>|<rare> 4 + . | | | | 3 +T | | | | VOMITING 2 + | CONFUSIO |S CHILLS | . | NAUSEA 1 . + . | GIDDINES | . | .# T| 0 . +M # | .# | CRAMPS .# | MSWEAK .##### | -1 .##### S+ DIZZINES HEATSENS ### | .###### | ### |S .##### | -2 ######### + .######## M| THIRST .# | TIRED .### | .####### | -3 .########## +T .######## | .######## S| | .####### | -4 + | #### | T| | -5 + <less>|<frequ>
HEAT ILLNESS CATEGORY
Logitscore
Mild < 2.18Moderate to severe
> 2.18
14
Mild : Thirst and /or tired only
Moderate to severe : Thirst and/or tired plus other symptoms

Profile Mean (SD) n % Heat illness category
Light 179 55.9Moderate to severe 141 44.1
Age group (years) 43 ( 9.49) <29 29 9.1
30-39 78 24.440-49 121 37.8
50+ 92 28.8 Gender
Male 148 46.3Female 172 53.8
Race Malay 95 29.7
Chinese 6 1.9Indian 216 67.5
Others 3 .9 Education level
No formal education 20 6.3Primary education 120 37.5
Secondary education 180 56.3 Type of work
Sweeping roadside 232 72.5Grass cutting 46 14.4
Drain cleaning 42 13.1 Duration of service (months ) 51 (42)
15
Mild
Prevalence

Characteristic Mean (SD)
n %
WBGT (oC) 30.5
(0.53) Metabolic rate Moderate 274 85.6 Heavy 46 14.4 History of heat illness Yes 152 47.5 No 168 52.5 Medical illness Present 98 30.6 Absent 222 69.4 Medication intake Yes 105 32.8 No 215 67.2 Alcohol intake Yes 6 1.9 No 314 98.1 Total volume of water intake during working shift. (mL)
2150.50 (953.09)
Time of water intake When feeling thirsty 286 89.4 Fixed timing 34 10.6 Type of drink Plain water 258 80.6 Sweetened drink 13 4.1 Tea/coffee 49 15.3 Hydration status Adequate hydration 181 56.6 Dehydrated 139 43.4 Body mass index Underweight 20 6.3 Normal 62 19.4 Overweight 106 33.1 Obese 132 41.3
16
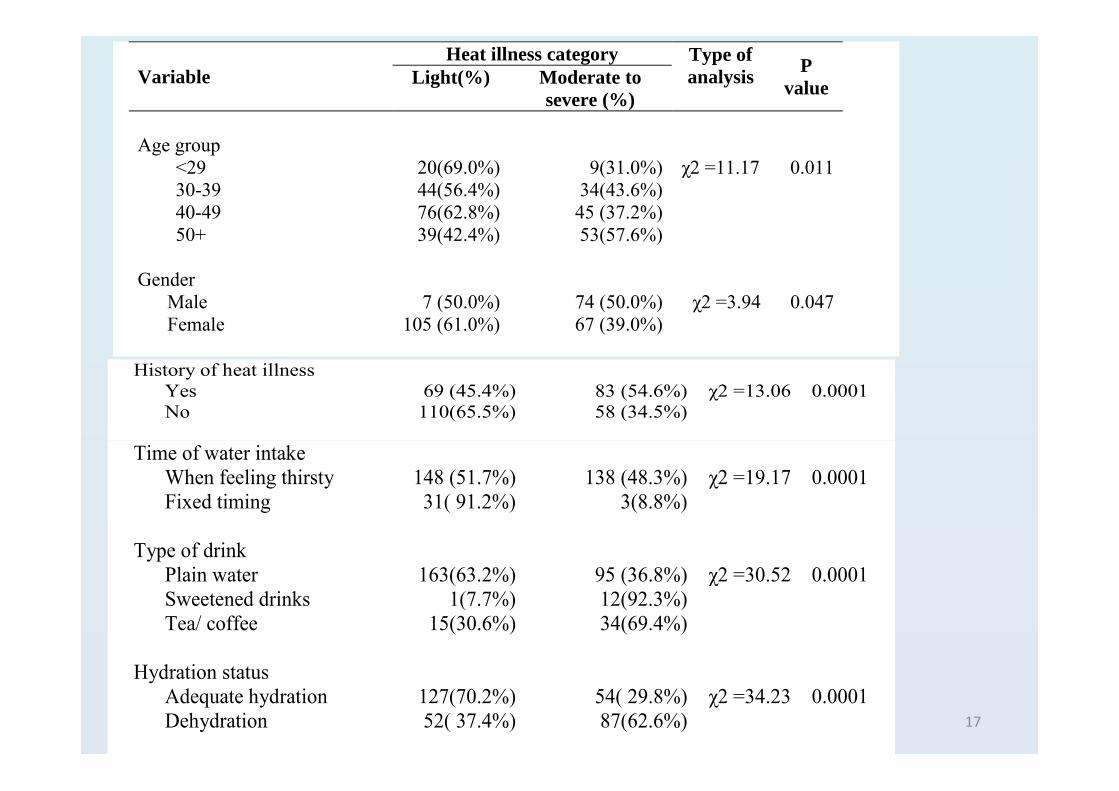
Variable Heat illness category Type of
analysis
P value Light(%) Moderate to
severe (%) Age group <29 20(69.0%) 9(31.0%) χ2 =11.17 0.011 30-39 44(56.4%) 34(43.6%) 40-49 76(62.8%) 45 (37.2%) 50+ 39(42.4%) 53(57.6%) Gender Male 7 (50.0%) 74 (50.0%) χ2 =3.94 0.047 Female 105 (61.0%) 67 (39.0%)
Time of water intake When feeling thirsty 148 (51.7%) 138 (48.3%) χ2 =19.17 0.0001 Fixed timing 31( 91.2%) 3(8.8%) Type of drink Plain water 163(63.2%) 95 (36.8%) χ2 =30.52 0.0001 Sweetened drinks 1(7.7%) 12(92.3%) Tea/ coffee 15(30.6%) 34(69.4%) Hydration status Adequate hydration 127(70.2%) 54( 29.8%) χ2 =34.23 0.0001 Dehydration 52( 37.4%) 87(62.6%)
History of heat illness Yes 69 (45.4%) 83 (54.6%) χ2 =13.06 0.0001 No 110(65.5%) 58 (34.5%)
17

Variable Simple Logistic Regression Multiple Logistic Regression Crude OR 95%CI p value Adj. OR 95%CI X2 stat (df)a P value
WBGT 1.19 (0.78;1.80) 0.421 1.76 (1.04;2.97) 4.61 0.034 Age group 0.012 13.85 (3) b 0.003 30-39 1.72 (0.70;4.25) b 0.242 3.00 (0.96;9.40)) 4.21(1) b 0.059 40-49 1.32 (0.55;3.14) b 0.536 2.69 (0.88;8.11) 3.06(1) b 0.080 50+ 3.02 (1.24;7.35) b 0.015 6.77 (2.15;21.29) 10.68 (1) b 0.001 <29 1.00 1.00 Gender Male 1.57 (1.01;2.45) 0.047 - - - - Female 1.00 History of heat illness Yes 2.28 (1.45;3.58) 0.001 2.25 (1.31;3.87) 8.76(1) 0.003 No 1.00 1.00 Time of water intake When feeling thirsty 9.64 (2.88;32.23) 0.001 14.76 (3.89;55.94) 23.09(1) <0.001 Fixed timing 1.00 1.00 Type of drink <0.001 17.30(2) b <0.001 Sweetened drink 20.59 (2.64;160.84) b 0.004 27.23 (2.80;264.49) 8.11(1) b 0.004 Tea/Coffee 3.89 (2.01;7.51) b <0.001 3.77 (1.76;8.09) 11.65(1) b 0.001 Plain water 1.00 1.00 Hydration status Dehydrated 3.94 (2.46;6.27) <0.001 3.51 (2.04;6.07) 21.26(1) <0.001 Adequate hydration 1.00 1.00 a : Likelihood ratio b : Wald test Adj OR : Adjusted odd ratio Backward LR method used for multiple logistic regression (r2=0.38; the model is reasonably fits well; model assumptions are met; no multicolinearity problem)
18

DISCUSSION
• Solid waste workers in Negeri Sembilan was exposed to heat above TLV and at high risk of developing heat related illness.
• Prevalence of heat related illness among solid waste workers was 44%. It was higher than other studies among outdoor workers in other studies (Mirabelli et al 2010, Tawatsupa et al 2012, Xiang et al 2016)
19

DISCUSSION
• WBGT, heat illness history, hydration status, type of drink and time of fluid intake associated with occurrence of heat illness was similar with previous study (Bethel et al (2014), Deghan et. al (2012), Lundgren et al(2013), Montazer et al (2013))
• Soft drinks, sweetened drink and caffeinated drinks will result in hyperosmolarity which will increase metabolic rate and additional body heat and increase the risk of having heat illness(Tonelli et al, 2011) .
20

DISCUSSION
• Paced fluid replacement need to be emphasized in hydration practice at workplace rather than responding to thirst sensation(Brake, D. J., & Bates, G. P, 2003).
• American Conference of Governmental Industrial Hygienists (ACGIH) recommend replacing fluids frequently when exposed to heat stress, such as one cup (250 ml) every 20 minutes when working in warm environments.
21

CONCLUSION
• This study adds to the knowledge of heat exposure among outdoor workers in Malaysia.
• Predicting factors such as age group and heat illness history can be used to identify high risk individual of having heat illness at workplace.
• Fluid intake at workplace (type of fluid and time of intake) and monitoring of hydration status based on urine colour need to be emphasized in education and prevention of heat related illness among workers who expose to heat stress environment.
22

References1. Bethel, J. W. & Harger, R. 2014. Heat-Related Illness among Oregon Farmworkers. International Journal
of Environmental Research and Public Health, 11, 9273–9285. doi:10.3390/ijerph1109092732. Cortez, O. D. 2009. Heat stress assessment among workers in a Nicaraguan sugarcane farm. Global Health
Action, 2. doi:10.3402/gha.v2i0.20693. Dr Ross Di Corleto. 2012. Physical Hazards : Thermal Environment. OHS Body of Knowledge Physical
Hazards: Thermal Environment Page, hlm.1–29.4. Epstein, Y. & Moran, D. S. 2006. Thermal Comfort and the Heat Stress Indices. Journal of Industrial
Health, 44, 388–398.5. Farshad, A., Montazer, S. & Monazzam, M. R. 2014. Heat Stress Level among Construction Workers.
Iranian Journal of Public Health, 43(4), 492–498.6. Hancock, P. a & Vasmatzidis, I. 2003. Effects of heat stress on cognitive performance: the current state of
knowledge. International journal of hyperthermia : the official journal of European Society for Hyperthermic Oncology, North American Hyperthermia Group, 19, 355–72. doi:10.1080/0265673021000054630
7. Havenith, G. 2001. Individualized model of human thermoregulation for the simulation of heat stress response. Journal of applied physiology (Bethesda, Md. : 1985), 90, 1943–1954.
8. Havenith, G. 2005. Temperature regulation, Heat balance and climatic stress. Extreme Weather Events and Public Health Responses, hlm.69–80. doi:10.1007/3-540-28862-7_7
9. Howe, A. S. & Boden, B. P. 2007. Heat-related illness in athletes. The American journal of sports medicine, 35(8), 1384–95. doi:10.1177/0363546507305013
23

10. Hyatt, O. M., Lemke, B. & Kjellstrom, T. 2010. Regional maps of occupational heat exposure: past, present, and potential future. Global health action, 1. doi:10.3402/gha.v3i0.5715
11. IPCC. 2007. Fourth assessment report. Geneva, Inter-governmental Panel on Climate Change.
12. Keim, S. M., Guisto, J. A. & Sullivan, J. B. 2002. Environmental thermal stress. Annals of Agricultural and Environmental Medicine, 9, 1–15. doi:10.1213/ANE.0b013e3182147f6d
13. Kjellstrom, T., Lemke, B. & Otto, M. 2013. Mapping occupational heat exposure and effects in South-East Asia: Ongoing time trends 1980-2011 and future estimates to 2050. Industrial Health, 51, 56–67. doi:10.2486/indhealth.2012-0174
14. Kjellstrom, T., Sawada, S.-I., Bernard, T. E., Parsons, K., Rintamäki, H. & Holmér, I. 2013. Climate change and occupational heat problems. Industrial Health, 51, 1–2. doi:10.2486/indhealth.MS5101ED
15. Kjellstrom, T. & Weaver, H. J. 2009. Climate change and health: impacts, vulnerability, adaptation and mitigation. New South Wales Public Health Bulletin,. doi:10.1071/NB08053
16. Lucas, R. A. I., Epstein, Y. & Kjellstrom, T. 2014a. Excessive occupational heat exposure: A significant ergonomic challenge and health risk for current and future workers. Extreme Physiology and Medicine, 3, 1–8. doi:10.1186/2046-7648-3-14
17. 073/pnas.091335210724

17. Lucas, R. A. I., Epstein, Y. & Kjellstrom, T. 2014b. Excessive occupational heat exposure: A significant ergonomic challenge and health risk for current and future workers. Extreme Physiology and Medicine, 3, 1–8. doi:10.1186/2046-7648-3-14
18. Lundgren, K., Kuklane, K., Gao, C. & Holmér, I. 2013. Effects of Heat Stress on Working Populations when Facing Climate Change. Industrial health, 51.
19. Mohammad Yusof, N. A., Karuppiah, K. & Mohd Tamrin, S. B. 2014. Heat Related Illness in Palm Oil Mill Workers under Heat Stress. Advances in Environmental Biology, 8(15), 171–176.
20. O’Neill, M. S. & Ebi, K. L. 2009. Temperature extremes and health: impacts of climate variability and change in the United States. Journal of occupational and environmental medicine / American College of Occupational and Environmental Medicine, 51, 13–25. doi:10.1097/JOM.0b013e318173e122
21. Parsons, K. 2006. Heat stress standard ISO 7243 and its global application. Industrial health, 44, 368–379. doi:10.2486/indhealth.44.368
22. Parsons, K. C. 2011. Assessment of Heat Stress and Heat Stress Indices 42. Heat and Cold,International Labor Organization.
23. Pau, J. ., Pao, W. & Kee, K. . 2013. A Modified Fanger ’ s Model for Malaysia Climate. 6th Engineering Conference, “Energy and Environment,”.
24. Sherwood, S. C. & Huber, M. 2010. An adaptability limit to climate change due to heat stress. Proceedings of the National Academy of Sciences of the United States of America, 107, 9552–9555. doi:10.1073/pnas.0913352107
25

25. Bethel, J. W., & Harger, R. (2014). Heat-Related Illness among Oregon Farmworkers. International Journal of Environmental Research and Public Health, 11, 9273–9285. doi:10.3390/ijerph110909273
26. Brake, D. J., & Bates, G. P. (2003). Fluid losses and hydration status of industrial workers under thermal stress working extended shifts. Occupational Environment Medicine, 60, 90–96.
27. Dehghan, H., Mortazavi, S. B., Jafari, M. J., & Maracy, M. R. (2012). Evaluation of wet bulb globe temperature index for estimation of heat strain in hot / humid conditions in the Persian Gulf. Journal of Research in Medical Sciences, 17, 1108–13.
28. Donoghue, A. M., Sinclair, M. J., Bates, G. P., Mines, M. I., & Isa, M. (2000). Heat exhaustion in a deep underground metalliferous mine. Occupational Environment Medicine, 57, 165–174.
29. Farshad, A., Montazer, S., & Monazzam, M. R. (2014). Heat Stress Level among Construction Workers. Iranian Journal of Public Health, 43(4), 492–498.
30. Lundgren, K., Kuklane, K., Gao, C., & Holmér, I. (2013). Effects of Heat Stress on Working Populations when Facing Climate Change. Industrial Health, 51.
31. Mirabelli, M. C., Quandt, S. A., Crain, R., Grzywacz, J. G., Robinson, E. N., Vallejos, Q. M., & Arcury, T. A. (2010). Symptoms of Heat Illness Among Latino Farm Workers in North Carolina. AMEPRE, 39(5), 468–471. doi:10.1016/j.amepre.2010.07.008
32. Montazer, S., Farshad, A. L. I. A., Monazzam, M. R., Eyvazlou, M., Akbar, A. L. I., Yaraghi, S., & Mirkazemi, R. (2013). Assessment of construction workers ’ hydration status using urine specific gravity, 26(5), 762–769. doi:10.2478/s13382-013-0143-x
26

33. Tawatsupa, B., Lim, L. L.-Y., Kjellstrom, T., Seubsman, S., Sleigh, A., & Study Team, the T. C. (2012). Association Between Occupational Heat Stress and Kidney Disease Among 37 816 Workers in the Thai Cohort Study (TCS). Journal of Epidemiology. doi:10.2188/jea.JE20110082
34. Tonelli, S., Ramey, S. L., Donham, K., & Fuortes, L. (2011). Preventing Heat-Related Illness Among Hispanic Farmworkers. American Association of Occupational Health Nurses, 59(1), 23–33. doi:10.3928/08910162-20101228-01
35. Xiang, J., Hansen, A., Pisaniello, D., & Bi, P. (2016). Workers ’ perceptions of climate change related extreme heat exposure in South Australia : a cross-sectional survey. BMC Public Health, 16(549), 1–13. doi:10.1186/s12889-016-3241-4
36. Zander, K. K., Moss, S. A., Garnett, S. T., & Territory, N. (2017). Drivers of self-reported heat stress in the Australian labour force. Environmental Research, 152(October 2016), 272–279. doi:10.1016/j.envres.2016.10.029
27

HEAT RELATED
ILLNESS
CONCEPTUAL FRAMEWORK Environmental factors
Radiant temperature*Ambient Temperature*Humidity*Air Movement*
Socio-demographicfactors
Age *Gender*Ethnic*Migrant statusLocation (urban)
Behavioural FactorsClothing *Metabolic rate*Alcohol consumption*Fluid intake*Type of fluid intakeTiming of fluid intakeMedication intake*Knowledge of Heat illness
Physiological factorsBody morphology *Hydration status*Medical illness*History of heat illness*Aerobic capacityAcclimatization status 29

8 scale Urine Colour Chart
Developed by Armstrong et al. in 1994 to assess hydration status
Had significant linear relationship with urine osmolality and urine specific gravity
Specificity ( 97% ) and specificity (81%)
Adequate hydration
Dehydrated
30

Symptom or
Sensation
None Mild, did not
interfere with
work
Moderate,
slowed my
work down
Significant
enough to
take a break
Severe
enough to
stop work
Tired
Muscle Cramps
Nausea
Dizziness
Thirst
Vomiting
Confusion
Muscle Weakness
Heat Sensation on
Head or Neck
Chills
Lightheaded 31

RESEARCH JUSTIFICATION
Heat exposure level in outdoor setting in Malaysia
Solid waste management workers
Predictors of heat related illness
Heat Illness Screening tools
Heat stress prevention in Malaysia and globally32