Embed Size (px)
Citation preview
PREVALENCE AND FACTORS ASSOCIATED WITH DIFFERENTIAL
MALARIA SPECIES INFECTIONS IN CHILDREN UNDER 5 YEARS IN SELECTED
ZAMBIAN POPULTIONS
by
Lungowe Sitali
A dissertation submitted in Partial Fulfillment of the Requirements for the Degree of
Master of Science in Epidemiology
The University of Zambia
November, 2013
ii
DECLARATION
This dissertation is the original work of LUNGOWE SITALI. It has been done in
accordance with the guidelines for dissertations for the University of Zambia. It has not
been submitted elsewhere for a degree at this or another University.
Signature………………………………………………………………………………
Date…………………………………………………………………………………….
Copyright: All rights reserved; no part of this dissertation may be produced, stored in a
retrieval system or transmitted in any form or by other means, electronic, mechanical,
photocopy or recoding without prior consent of author.
iii
CERTIFICATE OF COMPLETION OF DESERTATION
I………………………………………………………………………………………
Hereby certify that this dissertation is the product of my own work and, in submitting it for
the Degree of Master of Science in Epidemiology programme, further attest that it has not
been submitted to another University in part or whole for the award of any programme.
Signature……………………………………………………………………………………
Date………………………………………………………………………………………….
Supervisors
I, …………………………………………………………………………………………
having supervised and read this dissertation is satisfied that this is the original work of the
author under whose name it is being presented.
I confirm that the work has been completed satisfactorily and is ready for presentation to
the examiners.
Supervisor’s Name………………………………………………………………………….
Date…………………………………………………………………………………………
Department…………………………………………………………………………………
Signature:.…………………………………………………………………………………..
iv
CERTIFICATE OF APPROVAL
The University of Zambia approves this dissertation of Lungowe Sitali in partial
fulfillment of the requirements for the award of the degree in Master of Science in
Epidemiology.
Examiner’s signature Date
…………………………………….. ………………………..
…………………………………….. …………………………
…………………………………….. ………………………...
v
ABSTRACT
Introduction
Malaria remains one of the treatable and preventable infectious diseases, and yet still claims more
than 660,000 lives every year worldwide. Malaria diagnosis in some health facilities is based on
falciparum rapid diagnostic test and hence missed the other species. Furthermore, there is no data
on the prevalence of non-falciparum species in Zambia. This study sought to determine the
presence of differential malarial plasmodium species and examine associated factors for infection
in children in selected communities in Zambia.
Methods
Data stem from the 2012 population based Zambia Malaria Indicator Survey (ZMIS) for Luapula
and Northern Provinces of Zambia. The MIS took place between April and May country wide.
Background, social, and behavioral information were collected from households. In addition, blood
slides and dried blood spots (BDS) were collected from children below 5 years. Slides were stained
using giemsa and examined under a microscope. Polymerase Chain Reaction (PCR) was used to
analyse the dried blood spots for malaria plasmodia species. Multivariate logistic regression was
used to examine factors associated with differential species’ infection prevalence in the population
Results
Overall (n=873), prevalence of malaria by PCR was 54.3%, and the prevalence of the individual
plasmodium species were P.falciparum 53.4%, P.malariea 5.0%, P.ovale 2.1% and P.vivax 0.2%.
These species mostly occurred as mixed infections. The prevalence of mixed infections was 5.6%.
In terms of their contribution of the species to malaria prevalence, 88% were P. falciparum; with
10.6% being mixed infections and 1.4% were non falciparum mono infections. Older children as
compared to younger children were more likely have mixed infection AOR 2.8, CI 1.31-5.69, with
a beta value of 0.09.
Conclusion
The study reveals significant high burden of malaria infection in the study population. The major
factor associated with the burden of non-falciparum and falciparum malaria was the age of the
child, which further supports the notion of increased exposure to environmental factors as a child
grows. This might call for repackaging of additional site specific prevention and control measures
grounded in local matrics. There is need to pay attention to other species but it may not be
necessary to change the falciparum only RDTs as the other species mostly occur as mixed
infections.
vi
DEDICATION
This dissertation is dedicated to my lovely daughter Divine Thetiwe Njahi Zimba who had
to understand that her mum was busy despite being a baby, my Husband Gerald S. Zimba
who had been very supportive throughout my studies, My Dad and Mum (Dr. and Mrs.
Sitali) who have always been and continue to be my source of inspiration and role models,
and to my sisters and brothers Liseli, Mubita, Mwangala, Namukolo and Etambuyu, who
have always and continue to encourage me in all my endeavors.
vii
ACKNOWLEDGEMENTS
This dissertation would not have been possible without the concerted effort and support of
many people.
Many thanks to my supervisors Dr. C. C. Michelo, who is the Head of Department for
Public Health, Dr J. Chipeta who is a lecturer at the University of Zambia, School of
Medicine and Assistant Dean Research, Dr. John Miller - Malaria Control and Evaluation
Partnership in Africa (MACEPA), and Dr Bill Moss, of John Hopkins, my ICEMR mentor
for reading my numerous revisions and making corrections.
Special thanks to Norwegian Agency for Development Cooperation (NORAD)'s
Programme for Master Studies, NOMA, who sponsored my course and part of my research
work; providers of International Centers of Excellence in Malaria Research (ICEMR)
grant, that was used for most of the molecular work; The Ministry of Health and MACEPA
for allowing me to use the Malaria Indicator Survey data (MIS); National Malaria Control
Centre Laboratory, for allowing me to use their Molecular laboratory and Prof.N.Kumar
facilitator of the Malaria Training Capacity Building Southern Africa (MTCBSA) forgaty
grant that was used for quality control of the samples.
My thanks also go to my Head of Department, Dr G. Kwenda, for the support he rendered
during my studies; Mulenga C. Mwenda and Kasanda Chiwele who helped me with the
molecular work; Chisanga Chileshe Mulomba, for the help and support rendered. I also
want to thank Professor Sudesh of Tulane University, School of Medicine, and Mumbi
Chola, who assisted me with the data analysis.
I also wish to thank my colleagues, course mates, friends and relatives; I wish to thank
them for the roles they played towards the completion of this dissertation.
Finally but not the least, I wish to thank the mothers and guardians to the study participants
and the participants themselves for their cooperation; and the Malaria Indicator Survey
teams that went in the field to collect the data.
viii
TABLE OF CONTENTS
DECLARATION ................................................................................................................................ ii
CERTIFICATE OF COMPLETION OF DESERTATION .............................................................. iii
CERTIFICATE OF APPROVAL ..................................................................................................... iv
ABSTRACT ...................................................................................................................................... iv
DEDICATION .................................................................................................................................. vi
ACKNOWLEDGEMENTS............................................................................................................... vi
List of Tables ................................................................................................................................................ x
List of Figures ................................................................................................................................................ x
List of Appendices ......................................................................................................................................... x
CHAPTER ONE ........................................................................................................................................... 1
1.0 INTRODUCTION ........................................................................................................................... 1
1.1 Background ....................................................................................................................................... 1
1.2 Challenges and gaps ......................................................................................................................... 5
1.3 Rationale ........................................................................................................................................... 7
2.1 Research question ............................................................................................................................. 8
2.2 General Objective ............................................................................................................................. 8
2.3 Specific objectives ............................................................................................................................ 8
2.4 Conceptual framework for determinants of malaria infections .............................................................. 9
CHAPTER THREE .................................................................................................................................... 11
3.0 METHODOLOGY ......................................................................................................................... 11
3.1 Study setting and population ......................................................................................................... 11
3.2 Study design ................................................................................................................................... 12
3.3 Data extraction ................................................................................................................................ 16
3.4 Data analysis ................................................................................................................................... 19
3.5 Ethical considerations ..................................................................................................................... 19
4.0 RESULTS ...................................................................................................................................... 20
4.1 Overall Population description ....................................................................................................... 20
4.2 Proportion of Plasmodium malaria species ................................................................................... 22
4.3 Association of factors with malaria infections .............................................................................. 26
ix
4.4 Predictors of malaria infections ..................................................................................................... 29
4.5 Sensitivity and Specificity .............................................................................................................. 31
CHAPTER FIVE ........................................................................................................................................ 31
5.0 DISCUSSION ................................................................................................................................. 32
5.1 Conclusion ...................................................................................................................................... 35
5.2 Recommendations .......................................................................................................................... 36
Appendix A: Data collection form ............................................................................................................. 44
Appendix C: Budget ................................................................................................................................... 48
x
List of Tables
Table Page No.
Table 1: Operational variable framework…………………………………...…16
Table 2: Primer sequences……………………………………………………..17
Table 3: Overall proportions of selected socio-demographic factors.………....20
Table 4: Proportions of selected Socio-demographic factors………………….21
Table 5: Comparative prevalence of Plasmodium species by Province……….23
Table 6: Association of factors with plasmodium malaria infections………....26
Table 7: Association of factors with plasmodium mixed infections……….….27
Table 8: Association of factors with plasmodium mono infections…………...28
Table 9: Prediction model……………………………………………………..29
Table 10: Sensitivity and specificity……………………………………………30
List of Figures
Figure Page No.
Figure 1: Conceptual framework………………………………………………..10
Figure 2: Map of Zambia, ……………………………………………………....11
Figure 3: Pooled province proportions of the differential malaria species………20
Figure 4: Prevalence of mixed-infection and mono-infections………………….22
Figure 5: Proportions of the mixed and mono- infections among all positives.....22
List of Appendices
Appendix No. Title Page No.
Appendix A Data extraction form 41
Appendix B Work Plan 44
Appendix C Budget 45
Appendic D Gel picture 46
Appendix E Ethical clearance letter 50
Appendix F Board of Graduate Studies Approval 52
xi
List of Abbreviations
BCC………………………………………..Behavioural Change Communication,
CSAs……………………………………….Census Supervisory Areas
CSO………………………………………..Central Statistic Officer
DBS………………………………………..Dried Blood Spot
DNA………………………………………..Deoxyribonucleic Acid
HIV…………………………………………Human Immuno-deficiency Virus
HMIS………………………………………Health Management Information System
GF…………………………………………Global Funds
G6PD………………………………………Glocose-6-Phospate Dehydrogenase
HRP II……………………………………..Histidine Rich Protein II
IEC…………………………………………Information, Education Communication
ITNs………………………………………..Insecticide Treated Nets
IRS …………………………………………Indoor Residual Spraying
IPTp…………………………………………Intermittent Preventive Therapy in pregnancy
ACT………………………………………...Artemisinin-based combination therapy
NMCC………………………………………National Malaria Control Centre
NMCP……………………………………… National Malaria Control Programme
NMSP………………………………………National Malaria strategic plan
NPV………………………………………...Negative predictive value
MDGs……………………………………….Millennium Development Goals
xii
OPD………………………………………..Out Patient Department
SEAs……………………………………….Standard Enumeration Areas
SP…………………………………………. Sulfadoxine-Pyrimethamine
pLDH………………………………………Plasmodium Lactate Dehydrogenase
PCR………………………………………. Polymerase Chain Reaction
PPV………………………………………..Positive predictive value
RDTs……………………………………….Rapid Diagnostic Tests
WHO……………………………………….World Health Organisation
ZMIS………………………………………Zambia Malaria Indicator Survey
1 | P a g e
CHAPTER ONE
1.0 INTRODUCTION
1.1 Background
Malaria is a parasitic infection caused by protozoan called plasmodia; there are five
species of the Plasmodium that cause malaria in humans namely Plasmodium
falciparum, P. vivax, P. ovale, P. malariae and P. knowlesi (Gerald and Larry, 2000).
The species, P. knowlesi, is typically found in animals like monkeys and had first been
identified as a clinically significant pathogen in humans in 1965 (Chin W, 1965,
White 2008). The burden of malaria is still a dilemma worldwide despite the
intervention measures in place. Approximately 40% of the world's population lives in
areas that have some risk of malaria infection. Every year more than 500 million
people are infected, particularly children under 5 years of age and pregnant women
who are more susceptible to severe manifestations of the disease (Carter, et al., 2002;
World Malaria Report, 2010). Ninety percent of these cases are found in Africa,
mainly in sub-Saharan Africa. In Zambia, it remains one of the serious public health
problems accounting for 2.9 million Out Patient Department (OPD) cases per year in
2009, which reflects about 60% of all diseases seen at Out Patient Departments in
health facilities (HMIS, 2009).
The real distribution of differential malaria parasite species worldwide including
Zambia is not known. Mueller et al. 2007, reported that the global numbers for P.
malariae and P.ovale are not known. The burdens of P. ovale and P. malariae are
even more underrepresented in blood film survey since P. ovale can sometimes
resemble P. vivax except for the rarer oval infected erythrocytes or number of nuclei
in schizonts (Mueller et al. 2007). In addition, non-falciparum species are often
missed on thick blood film during examination.
Differential species
Differential species refers to malaria species other than P.falciparum. The non-
falciparum species are common in Africa, Zambia included. Species of P.malariae
are found in Zambia and the prevalence is said to be an anectodal 2%, as there seem to
be no proper documentation on the source. A case report by Blossom, et al.2005,
describes a case of the 23 years old woman who after a trip to Zambia, presented with
2 | P a g e
a prolonged illness characterized by fevers of up to 38.1oC and fatigue; malaria film
and antibody tests were negative, but Polymerase Chain Reaction (PCR) showed
P.vivax. Although scientific evidence shows that most parts of Africa have individuals
with duffy negative antigen, a recent study showed that P.vivax was found in
individuals who were duffy negative (Mendes et al., 2011). This implies that the
probability of finding P.vivax in most parts of Africa is there. The ‘Duffy antigen’ is
one of the surface antigens found on Red Blood Cells (RBCs) that P.vivax exploits in
order for it to enter the cells. It is one of the genetic resistance factors to malaria
(Larina et al., 2009, Carvalho et al., 2009). Non-human plasmodium species have also
become common in humans. In Rag-lai.Vietnam, two young children below five years
were found with non-falciparum species, in one of them, P. knowlesi was identified
again one year later, indicating that human exposure to P. knowlesi infection was not a
rare event. P.knowlesi infections in humans were also found in central Vietnam in
2004 and 2006 (Eede et al., 2009).
Mixed infections
Infections with more than one plasmodium species are possible, and are called mixed
infections. Mixed malaria species infections are often not recognized or are
underestimated. In Asia, past surveys have reported less than 2% of infections as
mixed, whereas therapeutic studies in P. vivax or P. falciparum malaria have reported
a high prevalence (30%) of infections with the other malaria species during
convalescence, suggesting covert co-infection (Mayfong et al, 2004). In Manhica
District of Mozambique, P. malariae and P. ovale occurred almost exclusively in
mixed infections in a number of patients (Marques et al., 2005). This situation may be
similar to the Zambian scenario, as the geography and climate are similar. Although
this has not been documented, technologists and scientists see and report a few cases
of mixed infections routinely. These could have an effect on the clinical outcomes of
some patients. On the contrary, Marques et al., 2005, suggest that slight differences in
environmental characteristics can affect transmission patterns, and may have an effect
in the way different human malaria species establish in the human.
It is possible that all the species or at least three can be found in a malaria endemic
country. In one study conducted in Mali, four species of malaria parasite were found
3 | P a g e
in circulation in the north-eastern region of Mali, where P. falciparum had a seasonal
influence. (Koita, et al., 2012). In a southern Vietnam study, a single Anopheles dirus
mosquito carrying sporozoites of P. knowlesi, P. falciparum, and P. vivax was
discovered in Khanh Phu (Marchand, et al., 2011). This further supports the evidence
that these species can be transferred to a human being. In the same study by Marchand
et al, 2011, P. knowlesi infections in humans were always associated with infections
of other Plasmodium species. Mixed infections with P. falciparum are frequent with
an interesting observation that in the dry season when P. falciparum densities
decrease, P. malariae densities increase (Bousema, et al., 2008, Marchand, et al.,
2011).
Species that were thought to be benign are now being seen to cause severe and
complicated manifestations such as those associated with P. falciparum. Gogia et al
2012, highlighted that P. vivax malaria, although considered to be a benign entity, can
have a severe and complicated course. In India, a case was found where acute
pancreatitis was seen in a 17-year-old male who had P. vivax, and was believed to be
associated with P. vivax (Sharma et al., 2012). On the other hand, there is evidence for
some cross-species immunity or a protective effect in mixed infections against some
clinical outcomes of malaria. These interactions have important clinical and public
health implications (Bruce, et al., 2008, Maitland et al., 1996), and such interactions
would potentially be critical in endemic countries (Coyway, 2007). An early PCR
study in Cote d’Ivoire around 1993 gave preliminary data showing that P. malariae
infections may reduce the risk of symptomatic P. falciparum infection (Black, et al.,
1994), but since then very little has been done to follow it up in larger studies or in
other African populations (Conway, 2007).
Malaria diagnosis
The laboratory diagnosis of malaria is done using microscopy by examining giemsa
stained blood films. Microscopy has been known to be, and remain the ‘gold
standard’, (MOH, Malaria training manual, 2012), while other methods used are
Polymerase Chain Reaction (PCR), Rapid Diagnostic Tests (RDTs) and clinical
4 | P a g e
assessments. However, by 2007, only 19 % of health facilities in Zambia had
microscopy available. Of the 19 %, only 17 % were functional (Hamer et al., 2007).
This implies that 83% of health facilities depended only on clinical diagnosis. While
the situation might have improved slightly as microscopes were procured with the
help of Global Funds (GF) and other partners, (NMCC, NMCP strategic plan 2011-
2015), there are a few trained personnel to operate the microscopes and hence
misdiagnosis is taking place.
In cases where there is no laboratory or RDTs, presumptive treatment based on fevers
and other signs and symptoms of malaria is commenced, although this is no longer
encouraged because it often contributes to misdiagnosis of the disease and irrational
drug use (Amexo, et al., 2004). In a study conducted in Uganda, Källander et al 2004,
stressed the difficulty in making a presumptive diagnosis of malaria, and highlighted
the urgent need for improved diagnostic tools that can be used at community and
primary-care level. Furthermore, this is compounded by the presence of uncommon
species. Misdiagnosis of the uncommon parasites is even more likely as seen from two
studies, by Singh B et al., 2004 and Cox Singh et al., 2008 that showed that
microscopic analysis of asexual stages of P. knowlesi can lead to misidentification of
these parasites as P. malariae.
Numerous malaria RDTs have been developed and are extensively available;
however, a number of challenges attributed to these products have become apparent
(Murray et al., 2008), some of them are to do with sensitivity and specificity. For
instance, the recently discovered is the deletion of the Histidine Rich Protein II gene
(Koita et al., 2012), which is the target for falciparum based RDTs and impacts on the
RDTs’ sensitivity.
The sensitivity and specificity of the diagnostic methods have been reported in
literature; Coleman et al., 2006 reports that the sensitivity and specificity of PCR was
96% and 98% respectively; while Bukirwa, 2011 reported sensitivity of RDTs to be
90%, on the other hand, the sensitivity of microscopy can be as low as 65%, as
reported by Relet et al 2010. Amexo, et al., 2004 and Murray et al., 2008 have
reported that the introduction of RDTs for malaria has changed the approach to
malaria diagnosis and leads to better management of malaria cases.
5 | P a g e
Progressive strides have been made in the epidemiologic studies of malaria by
increasing the utilization of diagnostic tests, there is need to greatly augment the
coverage of sensitive malarial detection. Despite the achievements, a large degree of
uncertainty still exists on the annual burden of malarial cases. Accurate, sensitive
detection and treatment of asymptomatic reservoirs important to infections
transmission are additional components necessary for future control measures
(Sullivan, 2010). In addition, accurate and effective malaria diagnosis should involve
a rational approach to each patient with suspected malaria employing both signs and
symptoms and laboratory-based malaria diagnostic methods (Chipeta et al.,2009).
Furthermore, diagnostic strategies need to be effective not only in resource-limited
areas, where malaria has a substantial burden on society, but also in developed
countries, where expertise in the diagnosis of malaria is frequently lacking (Bell et al
2006, Reyburn et al 2007)
Prevention and control strategies
Although malaria remains a serious public health problem in Zambia, different
preventive and control strategies have been employed that have led to the decrease of
malaria cases in the country. The control of plasmodium species is the same generally;
most control and preventive measure that apply for P. falciparum will apply to the
other species. Effective management of malaria according to WHO has focused on
insecticide treated nets (ITNs), indoor residual spraying (IRS), and intermittent
presumptive therapy in pregnancy (IPTp) and artemisinin-based combination therapy
(ACT). Prompt and accurate treatment applies to all species. Hence, it is fundamental
to improve the services and care for patients infected with malaria so they can access
prompt and accurate diagnosis and treatment in order to prevent excess morbidity and
mortality while avoiding unnecessary use of anti-malarial agents and minimizing the
spread of resistance to anti-malarial drugs (Bell et al., 2006, Reyburn et al., 2007).
1.2 Challenges and gaps
In meeting the Millennium Development Goals (MDGs) on health, target 6.C - which
states “to combat HIV/AIDS, malaria and other diseases; Have halted by 2015 and
begun to reverse the incidence of malaria and other major diseases”
(www.un.org/millenniumgoals). Zambia was committed to control malaria at a
national level in its 2006–2011 National Malaria Strategic Plan (National Malaria
6 | P a g e
Strategic Plan 2006- 2011) and the National Malaria Control Action Plan for scaled up
impact on malaria whose objective for case management was to have at least 80% of
patients receiving prompt and effective diagnosis and treatment within 24hours
(NMCAP, 2010).
The prevalence of malaria parasites in Zambian children is 16 % (MIS, 2010), and it
has always been said that 95% or 98 % (anecdotal) of these malaria cases are caused
by P. falciparum, the remaining 2% or 5% (anecdotal) are caused by other
Plasmodium species, but the specific data source for this information is unavailable.
Routine laboratory work and the 2008 and2010 Malaria Indicator Surveys (MIS)
revealed a number of the non-falciparum species in some parts of the country,
although they were not confirmed.
The current Zambia malaria drug policy recommends Coaterm™ (Artemether
/Lumefantrin) as the first line treatment (Zambia treatment guideline, 2011) for
malaria. In addition, WHO malaria treatment guidelines also recommend the use
ACTs for treatment of all malaria species; it further recommends that treatment with
primaquine should be given to patients with confirmed P. vivax and P. ovale, except
in high transmission settings where the risk of re-infection is high. WHO has also
indicated that P. ovale and P. malariae are susceptible to amodiaquine, mefloquine
and the artemisinin derivatives and their susceptibility to Sulfadoxine-Pyrimethamine
(SP), is not assured (WHO Guideline for malaria treatment, 2010).
The diagnostic services at most health facilities in the country utilize RDTs which are
Histidine Rich Protein II (HRP II) based. HRP-II is a water-soluble protein produced
by asexual and sexual stages of P. falciparum only (Rock, et al., 1987) which is
expressed on the Red Blood Cells (RBCs) membrane surface (Moody, 2002) and
hence can only detect P.falciparum. This may have serious implications on patient
management if non-falciparum species are present. Plasmodium lactate
dehydrogenase (pLDH) based RDTs, which can detect all the species, are available,
but were less reliable, as reported by Hopkins et al, 2007, hence not used in Zambia.
Thus, currently, in Zambia, only microscopy has the capacity to detect and
differentiate all plasmodium species. Unfortunately, not all health facilities have
microscopes, while some facilities despite having microscopy services; the laboratory
personnel may not be able to differentiate the species as it requires a lot of experience
7 | P a g e
and practice. To compound the problem, the country doesn’t have enough trained
laboratory staff.
1.3 Rationale
In order to reduce the impact of malaria on the population, i.e, morbidity and
mortality; and to meet the Millennium Development Goals (MDGs) of reducing
mortality and morbidity due to malaria (www.un.org/millenniumgoals), the Ministry
of Health has been implementing a number of prevention and control strategies
(National Malaria Strategic Plan 2006- 2011). Additionally, there is also a drive from
the malaria elimination goal (www.rollbackmalaria.org). Unfortunately, in terms of
diagnosis more needs to be done. All malaria species, if present, need to be diagnosed
and treated specifically if malaria is to be eliminated.
The non-falciparum parasites are missed by the RDTs, and this may have a serious
impact on treatment, management and prognosis of malaria. As a result of this,
information on the prevalence of non-falciparum species is vital as it will help inform
policy markers on malaria control programs and guide the distribution and allocation
of resources especially in terms of building capacities of laboratories. This
information will further guide malaria control programs on the distribution of malaria
parasite species in the country, and also highlight the need to conduct refresher
trainings in species identification and differentiation for biomedical scientists.
In addition, the results of this study will lead to studies that will profile the distribution
of the species countrywide, the morbidity and mortality due to these species and it will
stimulate studies on the treatment of the non-falciprum species and the effects of
mixed infections.
8 | P a g e
CHAPTER TWO
2.0 AIMS AND OBJECTIONS
2.1 Research question
What is the prevalence of differential plasmodium species and what socio-
demographic factors may be associated with them?
2.2 General Objective
To investigate the prevalence of differential malaria species infections and associated
socio-demographic factors in children under 5 years of age in Eastern and Luapula
provinces in Zambia.
2.3 Specific objectives
1. To determine the prevalence of P. falciparum, P. vivax, P. ovale,P. malariae
and mixed infections by microscopy and PCR in the two provinces.
2. To examine socio-demographic factors associated with the presence of mono-
plasmodium species infections.
3. To find out socio-demographic factors associated with mixed plasmodium
species infections.
4. To find out socio-demographic factors associated with presence of all
plasmodium species infections.
5. To assess the sensitivity and specificity of microscopy in detecting the malaria
infection, using “PCR as the standard” in this study.
In order to achieve these objectives, a malaria proximate determinant framework was
used.
9 | P a g e
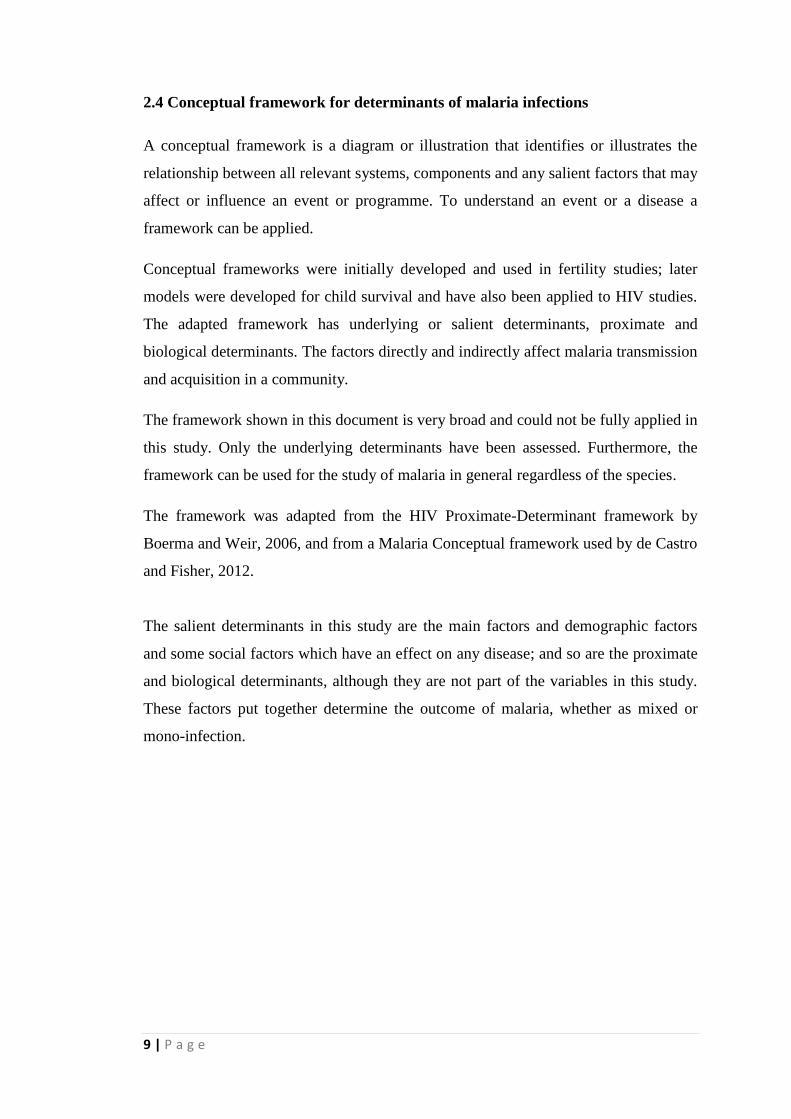
2.4 Conceptual framework for determinants of malaria infections
A conceptual framework is a diagram or illustration that identifies or illustrates the
relationship between all relevant systems, components and any salient factors that may
affect or influence an event or programme. To understand an event or a disease a
framework can be applied.
Conceptual frameworks were initially developed and used in fertility studies; later
models were developed for child survival and have also been applied to HIV studies.
The adapted framework has underlying or salient determinants, proximate and
biological determinants. The factors directly and indirectly affect malaria transmission
and acquisition in a community.
The framework shown in this document is very broad and could not be fully applied in
this study. Only the underlying determinants have been assessed. Furthermore, the
framework can be used for the study of malaria in general regardless of the species.
The framework was adapted from the HIV Proximate-Determinant framework by
Boerma and Weir, 2006, and from a Malaria Conceptual framework used by de Castro
and Fisher, 2012.
The salient determinants in this study are the main factors and demographic factors
and some social factors which have an effect on any disease; and so are the proximate
and biological determinants, although they are not part of the variables in this study.
These factors put together determine the outcome of malaria, whether as mixed or
mono-infection.
10 | P a g e
Figure 1: Conceptual framework showing Proximate- Determinant for “all
plasmodium species” infections
Salient
determinants
Proximate
determinants
Biological
determinants
Outcome
Note:1. Figure adapted from Boerma and Weir 2006.
(IRS- Indoor Residual Spraying, IEC- Information Education Communication, BCC-
Behavioral Change Communication, IPTp- Intermittent Presumptive Treatment in
Pregnancy, ITNs- Insecticide Treated Nets)
Contextual factors
Socio-Demographic
factors
Individual factors
Level of education
Occupation
Intervention
programmes
IRS
ITNs
Mosquito coils
IPTp
IEC/BCC
Bite by infected mosquito
Blood transfusion with
infected blood
Exposure of
susceptible
host
Efficiency of
transmission
Duration of
infectivity
Host
Immunity,
duff factor
Presence of reservoirs
with gametocytes
Bite by mosquito with
more than one parasite
Bite by several
mosquitoes with
different species
Adherence to antimalarial
treatment course
Drug resistance
Mixed infection
Mono
infection
Duratio
n of
infectivi
ty
Mixed
infections
Duration
of
infectivity
Malaria
signs and
symptoms
Recover
y/death
Duratio
n of
infectiv
ity
11 | P a g e
CHAPTER THREE
3.0 METHODOLOGY
3.1 Study setting and population
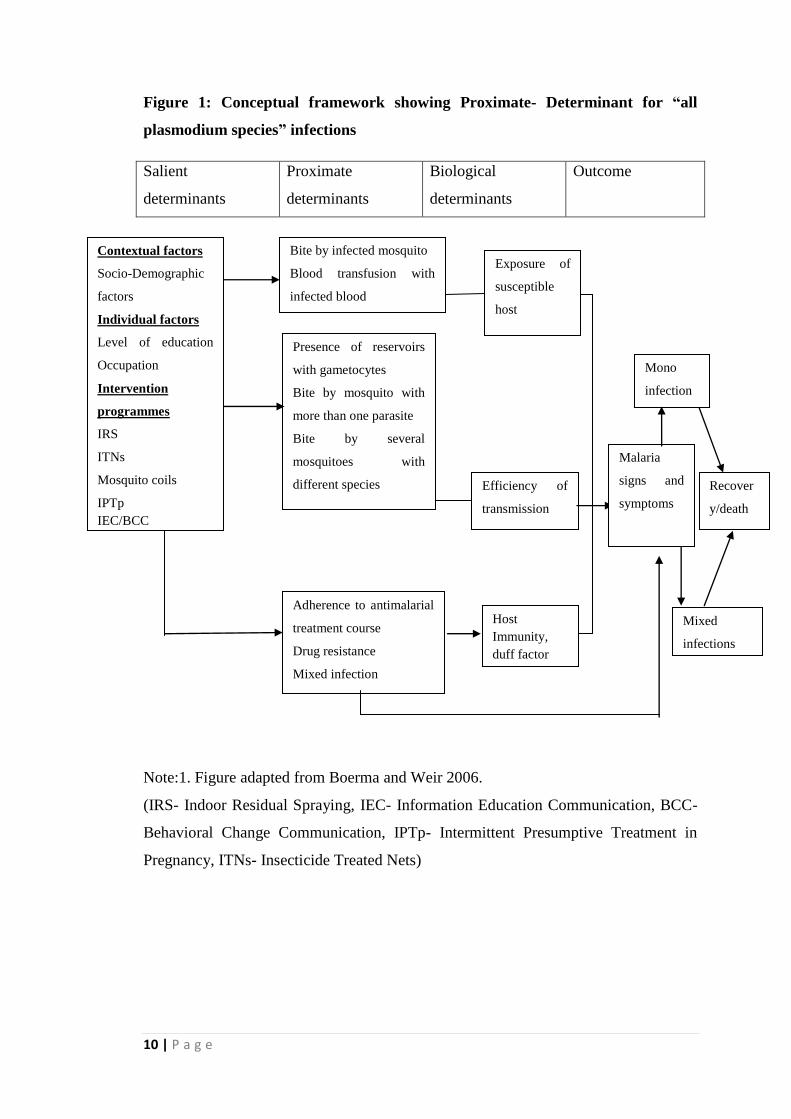
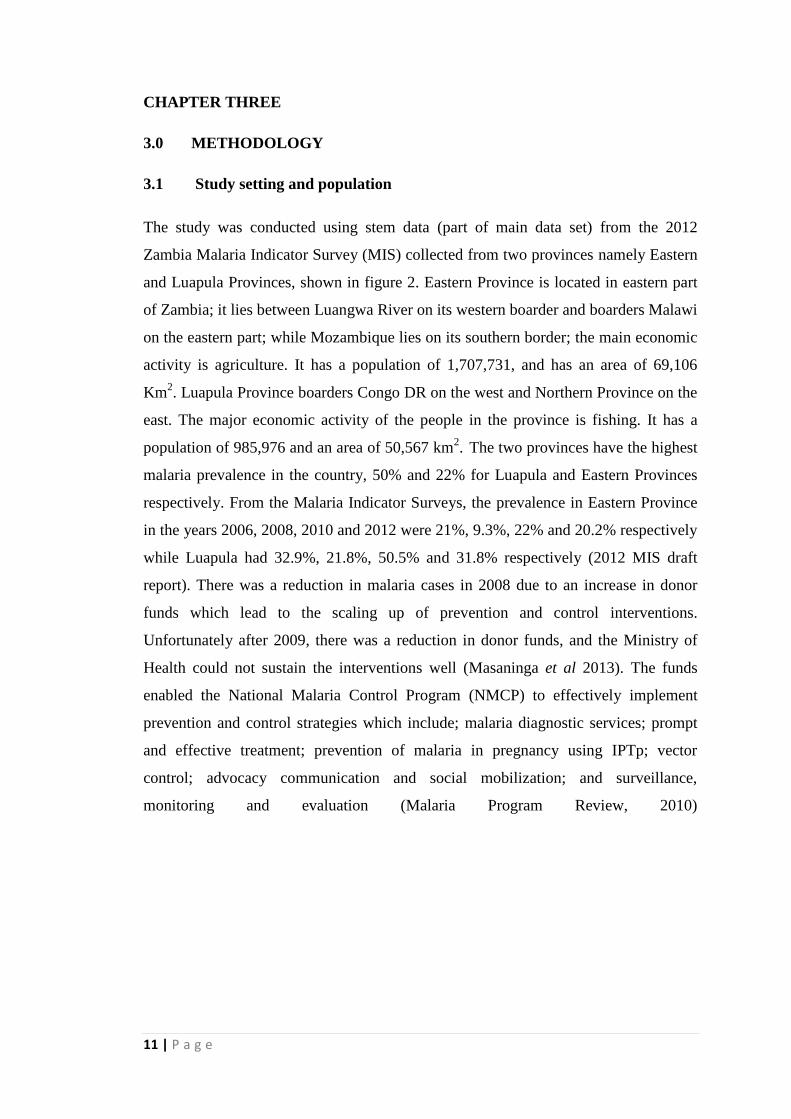
The study was conducted using stem data (part of main data set) from the 2012
Zambia Malaria Indicator Survey (MIS) collected from two provinces namely Eastern
and Luapula Provinces, shown in figure 2. Eastern Province is located in eastern part
of Zambia; it lies between Luangwa River on its western boarder and boarders Malawi
on the eastern part; while Mozambique lies on its southern border; the main economic
activity is agriculture. It has a population of 1,707,731, and has an area of 69,106
Km2. Luapula Province boarders Congo DR on the west and Northern Province on the
east. The major economic activity of the people in the province is fishing. It has a
population of 985,976 and an area of 50,567 km2. The two provinces have the highest
malaria prevalence in the country, 50% and 22% for Luapula and Eastern Provinces
respectively. From the Malaria Indicator Surveys, the prevalence in Eastern Province
in the years 2006, 2008, 2010 and 2012 were 21%, 9.3%, 22% and 20.2% respectively
while Luapula had 32.9%, 21.8%, 50.5% and 31.8% respectively (2012 MIS draft
report). There was a reduction in malaria cases in 2008 due to an increase in donor
funds which lead to the scaling up of prevention and control interventions.
Unfortunately after 2009, there was a reduction in donor funds, and the Ministry of
Health could not sustain the interventions well (Masaninga et al 2013). The funds
enabled the National Malaria Control Program (NMCP) to effectively implement
prevention and control strategies which include; malaria diagnostic services; prompt
and effective treatment; prevention of malaria in pregnancy using IPTp; vector
control; advocacy communication and social mobilization; and surveillance,
monitoring and evaluation (Malaria Program Review, 2010)
12 | P a g e
Figure 2: Map of Zambia, showing the location of the two Province
3.2 Study design
This is a “Plasmodium differential species survey” which focused on data from the
2012 Zambia Malaria Indicator Survey (MIS)
3.2.1 Malaria Indicator Survey (MIS)
The MIS is conducted every two years between April and May throughout the
country. Zambia is administratively divided into ten provinces and each province is in
turn subdivided into districts. For statistical purposes each district is subdivided into
Census Supervisory Areas (CSAs) and these are in turn subdivided into Standard
Enumeration Areas (SEAs). The population of Zambia is 13,045,508 and the country
has an updated list of 25,631 SEAs and 2,815,897 household (Census report 2010).
The design for the survey was a representative probability sample to produce
estimates for the country as a whole. The number of SEA Eastern and Luapula
Province were 3524 and 2224 SEA in Luapula Province respectively (Census report
2010).
The protocol of the survey presented a plan for conducting the follow-up of the 2010
Zambia National Malaria Indicator Survey (MIS), which is a comprehensive
nationally-representative household survey designed to evaluate progress toward
achieving the goals and targets set forth in the NMSP 2011 – 2015. The survey was a
Study
sites
13 | P a g e
follow-up household survey meant to give trend information at the population level
for malaria interventions and malaria disease burden. Some of the objectives were as
follows: to collect up-to-date information, building on the experience of the MIS
2006, 2008, and 2010, on coverage of the core malaria interventions included in the
National Malaria Strategic Plan 2011 – 2015; to assess malaria parasite prevalence
and status of anaemia among the target populations (children 6 – 60 months); to
implement standardized, representative household survey methods; to strengthen the
capacity of the National Malaria Control Centre and local agencies involved in order
to facilitate the implementation of surveys of this type in the future.
During the survey, two questionnaires were administered; one for the household head
and the other for women; then blood was collected from children aged 6 months to 60
months. The collected blood was used for slides and dried blood spots preparation, as
well as, malaria testing using RDTs and haemoglobin examinations were performed.
The questions in the household head questionnaires included questions on social
economic status, places where medical attention is normally sought, source of
drinking water, type of house and construction material used, type of malaria control
strategy used (ITNs, IRS, mosquito coil) and there was a section on haemoglobin and
malaria infection measurement for children under 6 years of age. On the women’s
questionnaire the questions addressed issues on parity, education, and knowledge
about malaria. (MIS protocol 2012, unpublished).
The primary samples were from the 2012 MIS Samples that were selected using
stratified two- stage cluster design with the assumption that future cross-sectional
surveys would be conducted. The numbers of clusters that were selected for the MIS
were calculated based on an average cluster of 25 completed interviews of all
respondents. These clusters were selected systematically with probability proportional
to the number of households where a sampling interval was calculated and a random
number was used. Households were selected by first coming up with a sampling
frame, then calculating the sampling interval and a random number was generated.
There were three strata; rural, urban and IRS areas and hence there was a
disproportional allocation to the three strata. Due to the disproportionate allocation of
the sample to the three different strata, sampling weights were calculated at the
national level. The sampling probability at first stage selection of SEAs and
14 | P a g e
probabilities of selecting the household were used to calculate the weights; the
weights of the sample were equal to the inverse of the probability of selection, details
in MIS report (MIS 2012).
3.2.2 Plasmodium differential species survey
A cross sectional study was carried out on some of samples from two provinces
(Eastern and Luapula); that were purposely selected based on high prevalence rates. In
these provinces all the samples were eligible for selection provided they met the
inclusion criteria. Demographics (age, gender, education status and region), access
and health seeking behavior variables were extracted from the main MIS data set;
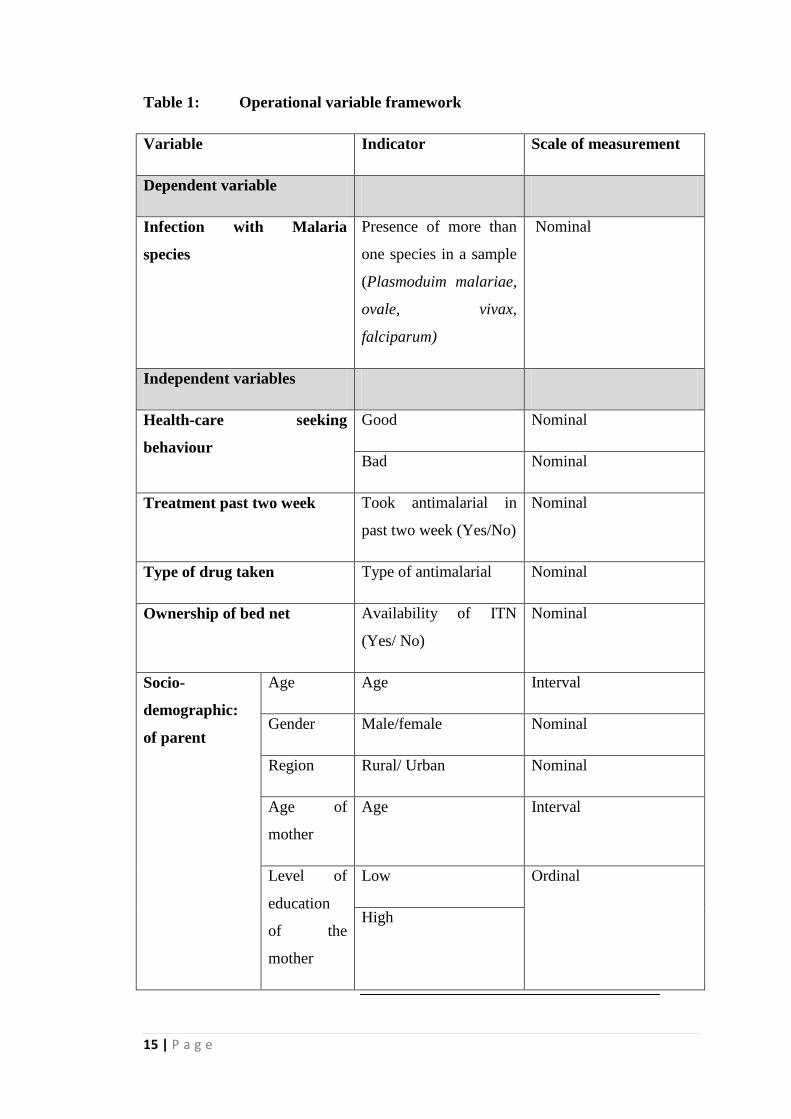
slide and Dried Blood Spot (DBS) were examined. Table 1 show the variable
measured.
15 | P a g e
Table 1: Operational variable framework
Variable Indicator Scale of measurement
Dependent variable
Infection with Malaria
species
Presence of more than
one species in a sample
(Plasmoduim malariae,
ovale, vivax,
falciparum)
Nominal
Independent variables
Health-care seeking
behaviour
Good Nominal
Bad Nominal
Treatment past two week Took antimalarial in
past two week (Yes/No)
Nominal
Type of drug taken Type of antimalarial Nominal
Ownership of bed net Availability of ITN
(Yes/ No)
Nominal
Socio-
demographic:
of parent
Age Age Interval
Gender Male/female Nominal
Region Rural/ Urban Nominal
Age of
mother
Age Interval
Level of
education
of the
mother
Low Ordinal
High
16 | P a g e
Sample size for the study: This study analyzed samples from the two provinces, in the
MIS, 23 clusters from Eastern and 17 cluster from Luapula were selected giving a
total of 40 clusters, out of the 3524 and 2224 respectively. This study took all the 1158
samples from the two provinces due to availability of resources and due to the fact
that they were sampled for the MIS study.
Inclusion and exclusion criteria for samples: Samples from children aged 0-60
months that were collected during the survey with complete information or data were
included. On the other hand, samples, whose key data for this study was not available
i.e. presence or absence of fever, Hb reading, slides, dried blood spot, information of
ITN and health seeking behavior of parent were excluded. The excluded 285 samples,
did not have dried blood spot specimens, leaving 873 samples for analysis.
3.3 Data extraction
3.3.1 Demographic factors
A data collection tool was designed to extract socio-demographic variables from the
Malaria Indicator Survey (MIS) questionnaire. The tool included the following
variables: age of the children, gender, residence (rural/ urban), the province, the age of
the mother, the level of education of the mother, history of taking any drug two weeks
prior to study interview, the type of drug and their health seeking behavior. The data
collection tool is in Appendix 2.
3.3.2 Laboratory data
Microscopy: The MIS slides were collected and processed by laboratory scientists and
technologist; who were also trained for one week on data collection prior to the
survey. During the training a day was dedicated to field tests of the survey instruments
in Chongwe District, where children were tested. These slides are stored in special
slide storage boxes, which ensure non-contact and independent standing of the slides.
Staining of the slides was done at the National Malaria Control Centre (NMCC)
parasitological laboratory using 3% Giemsa stain for 45 minutes.
The slides were then examined by two experienced biomedical scientists
independently; slides that had discordant results were given to a third independent
reader, blinded from the results to break the tie.
17 | P a g e
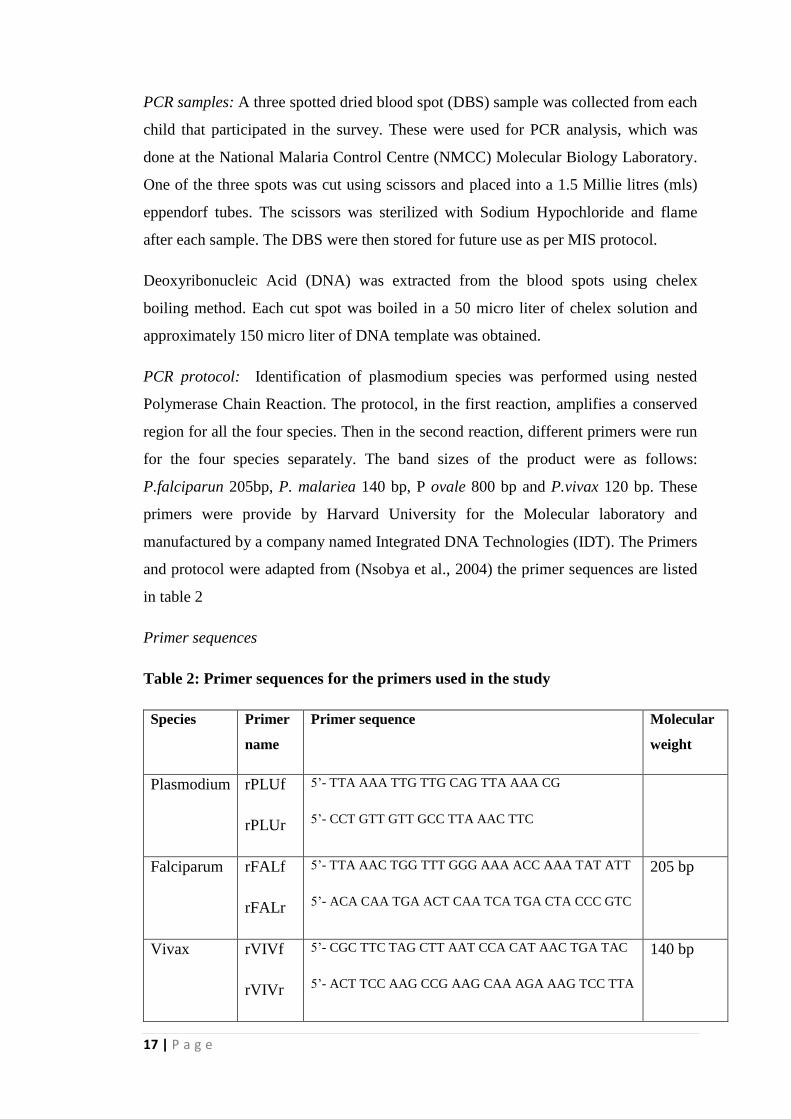
PCR samples: A three spotted dried blood spot (DBS) sample was collected from each
child that participated in the survey. These were used for PCR analysis, which was
done at the National Malaria Control Centre (NMCC) Molecular Biology Laboratory.
One of the three spots was cut using scissors and placed into a 1.5 Millie litres (mls)
eppendorf tubes. The scissors was sterilized with Sodium Hypochloride and flame
after each sample. The DBS were then stored for future use as per MIS protocol.
Deoxyribonucleic Acid (DNA) was extracted from the blood spots using chelex
boiling method. Each cut spot was boiled in a 50 micro liter of chelex solution and
approximately 150 micro liter of DNA template was obtained.
PCR protocol: Identification of plasmodium species was performed using nested
Polymerase Chain Reaction. The protocol, in the first reaction, amplifies a conserved
region for all the four species. Then in the second reaction, different primers were run
for the four species separately. The band sizes of the product were as follows:
P.falciparun 205bp, P. malariea 140 bp, P ovale 800 bp and P.vivax 120 bp. These
primers were provide by Harvard University for the Molecular laboratory and
manufactured by a company named Integrated DNA Technologies (IDT). The Primers
and protocol were adapted from (Nsobya et al., 2004) the primer sequences are listed
in table 2
Primer sequences
Table 2: Primer sequences for the primers used in the study
Species Primer
name
Primer sequence Molecular
weight
Plasmodium rPLUf
rPLUr
5’- TTA AAA TTG TTG CAG TTA AAA CG
5’- CCT GTT GTT GCC TTA AAC TTC
Falciparum rFALf
rFALr
5’- TTA AAC TGG TTT GGG AAA ACC AAA TAT ATT
5’- ACA CAA TGA ACT CAA TCA TGA CTA CCC GTC
205 bp
Vivax rVIVf
rVIVr
5’- CGC TTC TAG CTT AAT CCA CAT AAC TGA TAC
5’- ACT TCC AAG CCG AAG CAA AGA AAG TCC TTA
140 bp
18 | P a g e
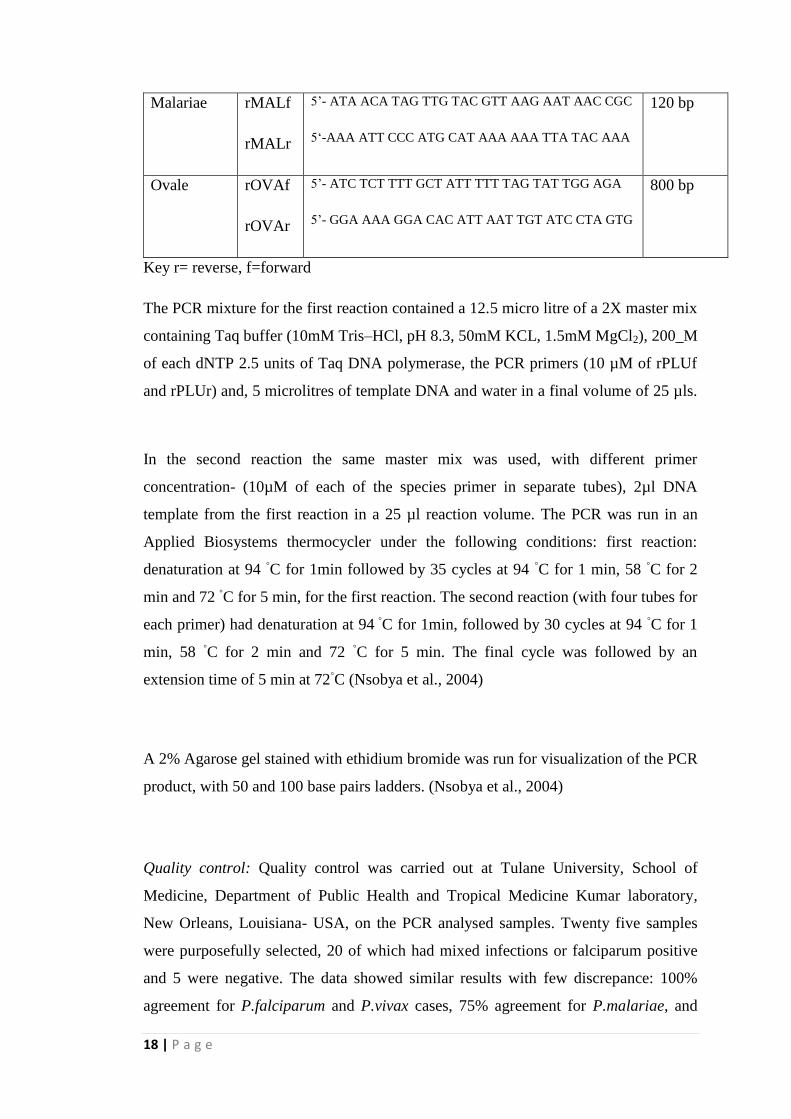
Malariae rMALf
rMALr
5’- ATA ACA TAG TTG TAC GTT AAG AAT AAC CGC
5‘-AAA ATT CCC ATG CAT AAA AAA TTA TAC AAA
120 bp
Ovale rOVAf
rOVAr
5’- ATC TCT TTT GCT ATT TTT TAG TAT TGG AGA
5’- GGA AAA GGA CAC ATT AAT TGT ATC CTA GTG
800 bp
Key r= reverse, f=forward
The PCR mixture for the first reaction contained a 12.5 micro litre of a 2X master mix
containing Taq buffer (10mM Tris–HCl, pH 8.3, 50mM KCL, 1.5mM MgCl2), 200_M
of each dNTP 2.5 units of Taq DNA polymerase, the PCR primers (10 µM of rPLUf
and rPLUr) and, 5 microlitres of template DNA and water in a final volume of 25 µls.
In the second reaction the same master mix was used, with different primer
concentration- (10µM of each of the species primer in separate tubes), 2µl DNA
template from the first reaction in a 25 µl reaction volume. The PCR was run in an
Applied Biosystems thermocycler under the following conditions: first reaction:
denaturation at 94 ◦C for 1min followed by 35 cycles at 94
◦C for 1 min, 58
◦C for 2
min and 72 ◦C for 5 min, for the first reaction. The second reaction (with four tubes for
each primer) had denaturation at 94 ◦C for 1min, followed by 30 cycles at 94
◦C for 1
min, 58 ◦C for 2 min and 72
◦C for 5 min. The final cycle was followed by an
extension time of 5 min at 72◦C (Nsobya et al., 2004)
A 2% Agarose gel stained with ethidium bromide was run for visualization of the PCR
product, with 50 and 100 base pairs ladders. (Nsobya et al., 2004)
Quality control: Quality control was carried out at Tulane University, School of
Medicine, Department of Public Health and Tropical Medicine Kumar laboratory,
New Orleans, Louisiana- USA, on the PCR analysed samples. Twenty five samples
were purposefully selected, 20 of which had mixed infections or falciparum positive
and 5 were negative. The data showed similar results with few discrepance: 100%
agreement for P.falciparum and P.vivax cases, 75% agreement for P.malariae, and
19 | P a g e
83% for P.ovale. This showed that the results obtained from the molecular lab in
Zambia could be trusted and were reliable. The primers used were different, their band
size was 300bp.
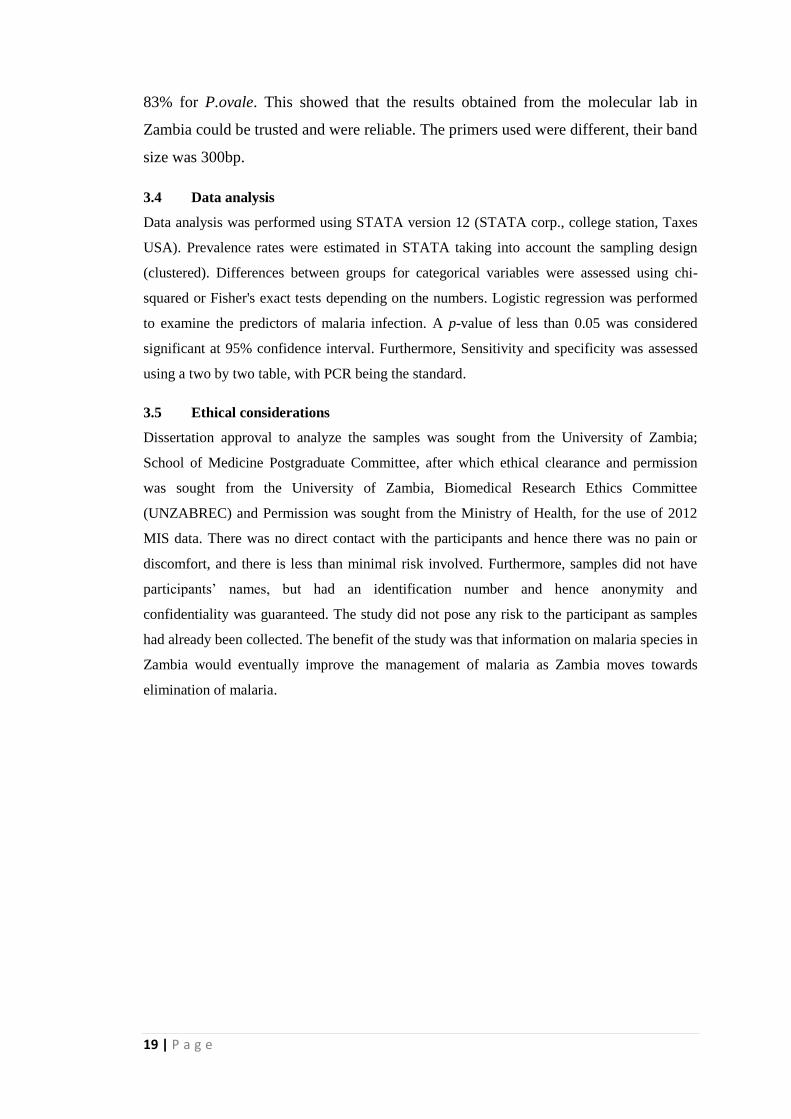
3.4 Data analysis
Data analysis was performed using STATA version 12 (STATA corp., college station, Taxes
USA). Prevalence rates were estimated in STATA taking into account the sampling design
(clustered). Differences between groups for categorical variables were assessed using chi-
squared or Fisher's exact tests depending on the numbers. Logistic regression was performed
to examine the predictors of malaria infection. A p-value of less than 0.05 was considered
significant at 95% confidence interval. Furthermore, Sensitivity and specificity was assessed
using a two by two table, with PCR being the standard.
3.5 Ethical considerations
Dissertation approval to analyze the samples was sought from the University of Zambia;
School of Medicine Postgraduate Committee, after which ethical clearance and permission
was sought from the University of Zambia, Biomedical Research Ethics Committee
(UNZABREC) and Permission was sought from the Ministry of Health, for the use of 2012
MIS data. There was no direct contact with the participants and hence there was no pain or
discomfort, and there is less than minimal risk involved. Furthermore, samples did not have
participants’ names, but had an identification number and hence anonymity and
confidentiality was guaranteed. The study did not pose any risk to the participant as samples
had already been collected. The benefit of the study was that information on malaria species in
Zambia would eventually improve the management of malaria as Zambia moves towards
elimination of malaria.
20 | P a g e
CHAPTER FOUR
4.0 RESULTS
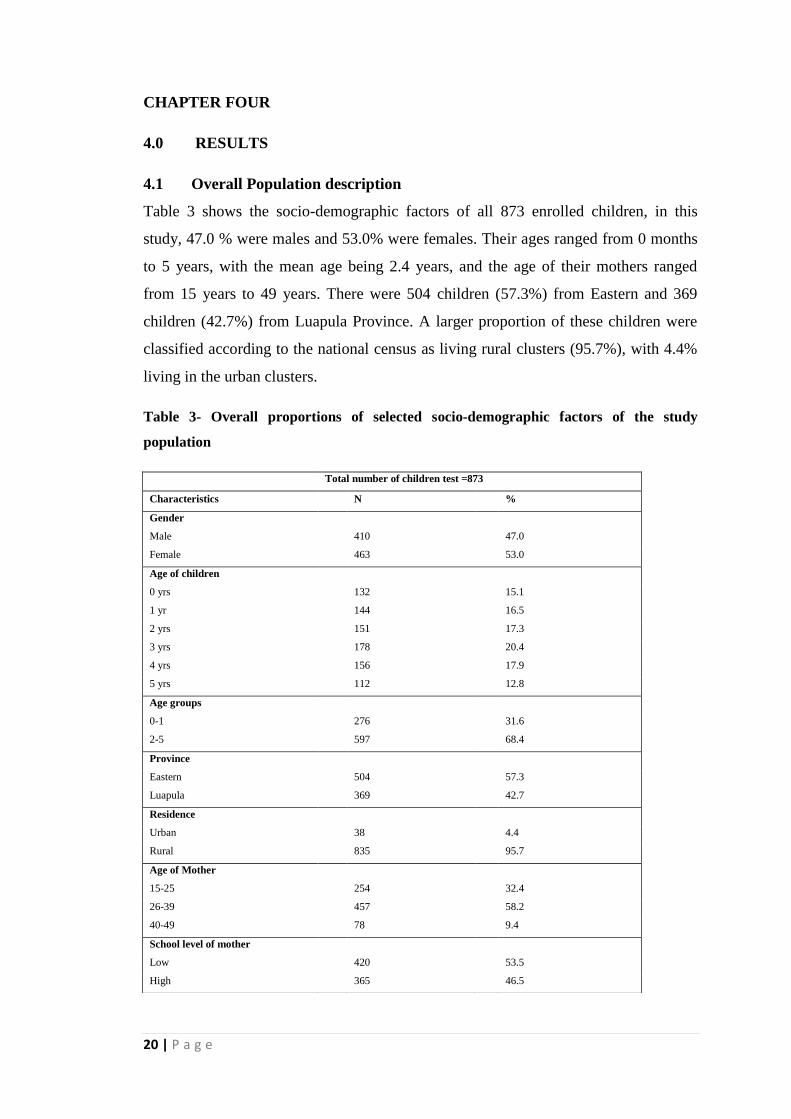
4.1 Overall Population description
Table 3 shows the socio-demographic factors of all 873 enrolled children, in this
study, 47.0 % were males and 53.0% were females. Their ages ranged from 0 months
to 5 years, with the mean age being 2.4 years, and the age of their mothers ranged
from 15 years to 49 years. There were 504 children (57.3%) from Eastern and 369
children (42.7%) from Luapula Province. A larger proportion of these children were
classified according to the national census as living rural clusters (95.7%), with 4.4%
living in the urban clusters.
Table 3- Overall proportions of selected socio-demographic factors of the study
population
Total number of children test =873
Characteristics N %
Gender
Male
410
47.0
Female
463
53.0
Age of children
0 yrs
132
15.1
1 yr
144
16.5
2 yrs
151
17.3
3 yrs
178
20.4
4 yrs
156
17.9
5 yrs
112
12.8
Age groups
0-1
276
31.6
2-5 597 68.4
Province
Eastern
504
57.3
Luapula
369
42.7
Residence
Urban
38
4.4
Rural
835
95.7
Age of Mother
15-25
254
32.4
26-39
457
58.2
40-49
78
9.4
School level of mother
Low
420
53.5
High
365
46.5
21 | P a g e
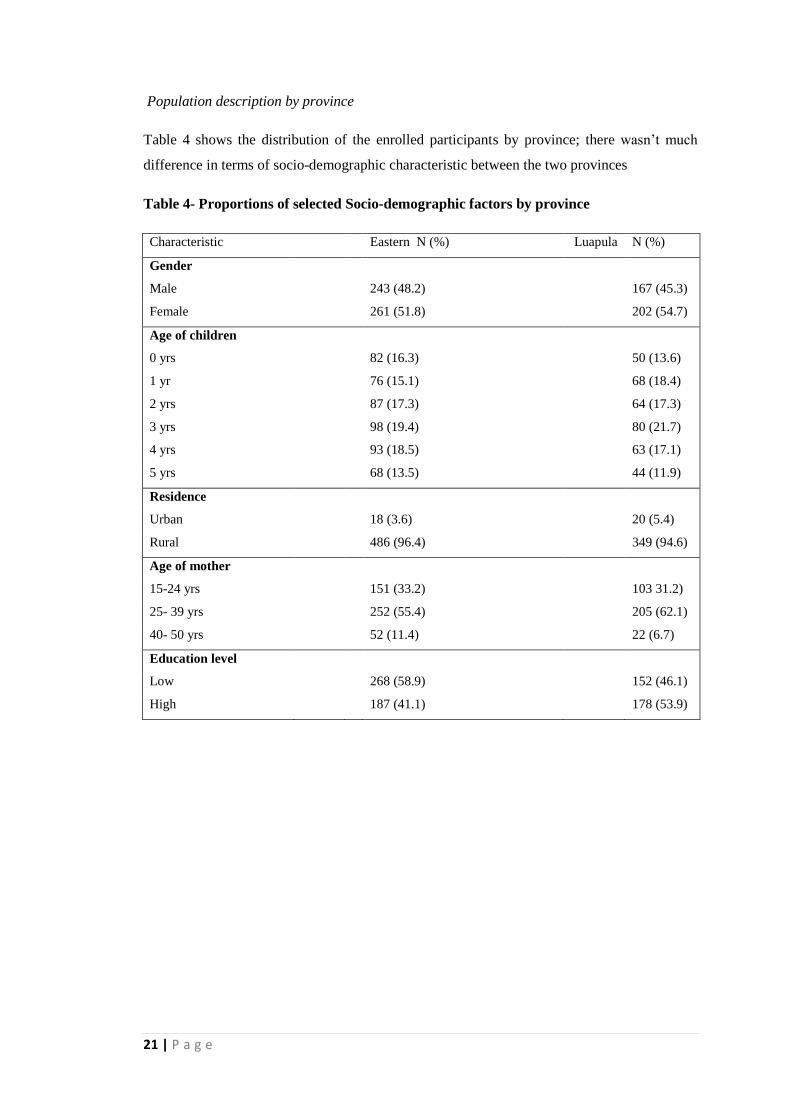
Population description by province
Table 4 shows the distribution of the enrolled participants by province; there wasn’t much
difference in terms of socio-demographic characteristic between the two provinces
Table 4- Proportions of selected Socio-demographic factors by province
Characteristic Eastern N (%) Luapula N (%)
Gender
Male
243 (48.2)
167 (45.3)
Female 261 (51.8) 202 (54.7)
Age of children
0 yrs
82 (16.3)
50 (13.6)
1 yr
76 (15.1)
68 (18.4)
2 yrs
87 (17.3)
64 (17.3)
3 yrs
98 (19.4)
80 (21.7)
4 yrs
93 (18.5)
63 (17.1)
5 yrs 68 (13.5) 44 (11.9)
Residence
Urban
18 (3.6)
20 (5.4)
Rural 486 (96.4) 349 (94.6)
Age of mother
15-24 yrs
151 (33.2)
103 31.2)
25- 39 yrs
252 (55.4)
205 (62.1)
40- 50 yrs 52 (11.4) 22 (6.7)
Education level
Low
268 (58.9)
152 (46.1)
High 187 (41.1) 178 (53.9)
22 | P a g e
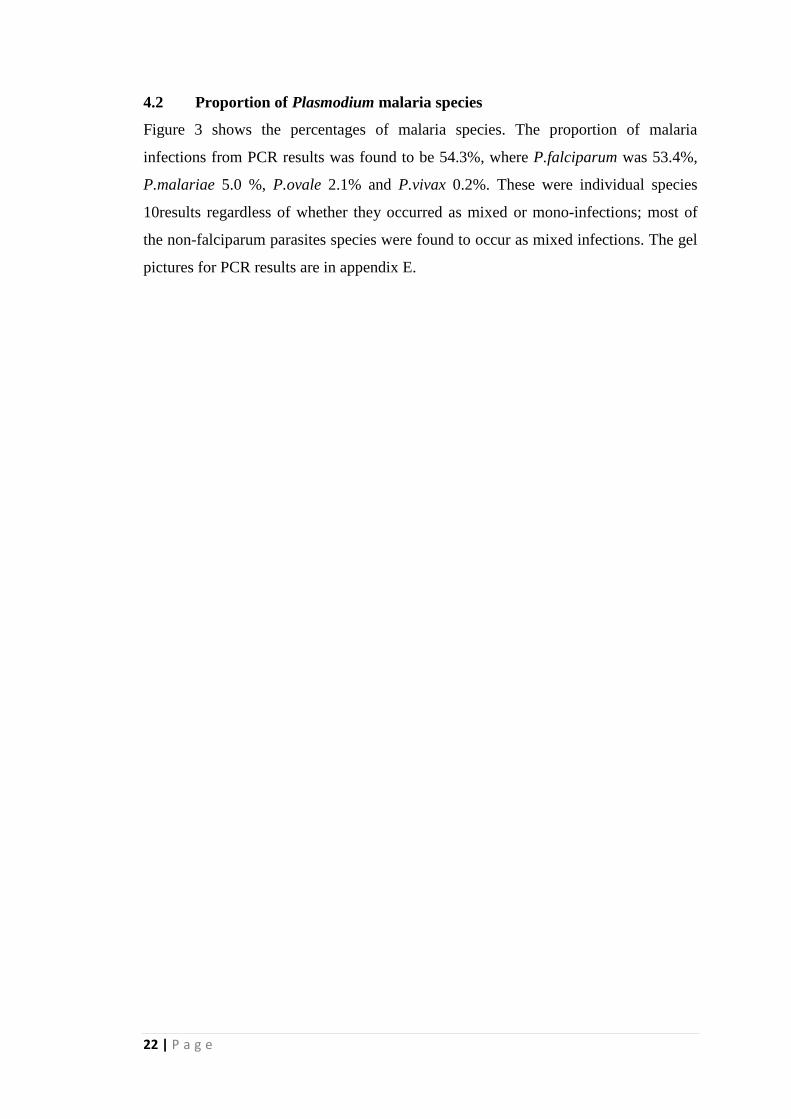
4.2 Proportion of Plasmodium malaria species
Figure 3 shows the percentages of malaria species. The proportion of malaria
infections from PCR results was found to be 54.3%, where P.falciparum was 53.4%,
P.malariae 5.0 %, P.ovale 2.1% and P.vivax 0.2%. These were individual species
10results regardless of whether they occurred as mixed or mono-infections; most of
the non-falciparum parasites species were found to occur as mixed infections. The gel
pictures for PCR results are in appendix E.
23 | P a g e
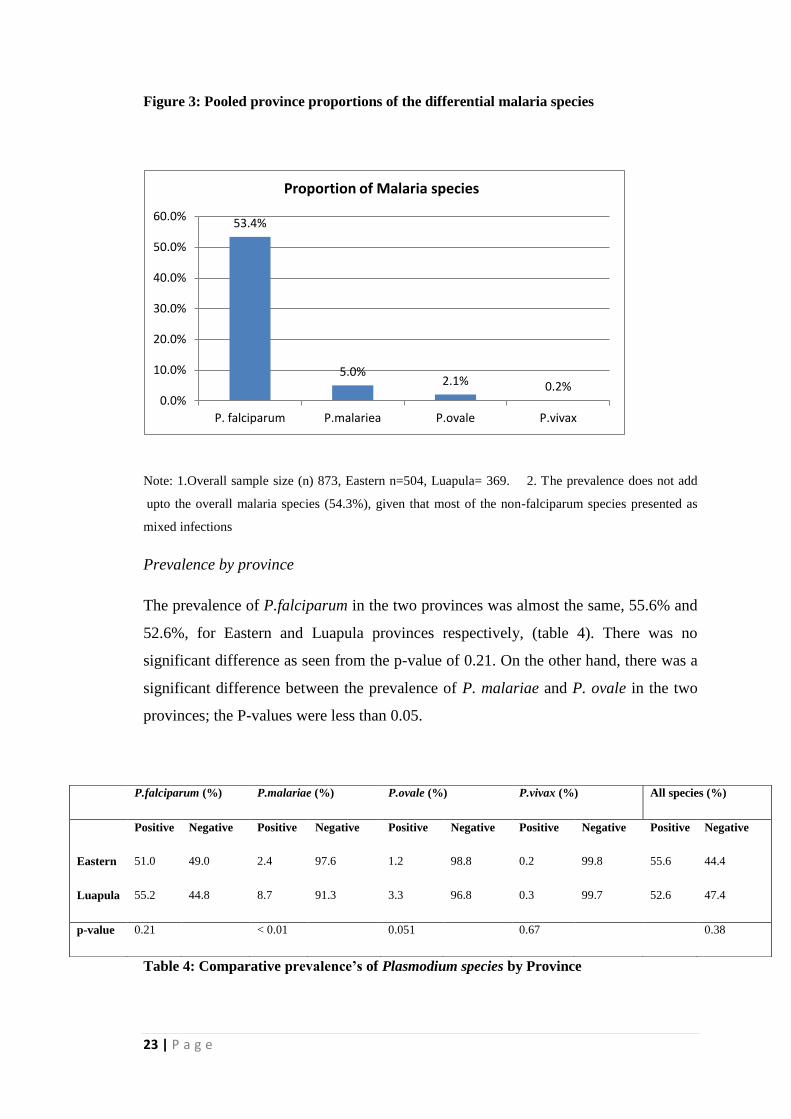
Figure 3: Pooled province proportions of the differential malaria species
Note: 1.Overall sample size (n) 873, Eastern n=504, Luapula= 369. 2. The prevalence does not add
upto the overall malaria species (54.3%), given that most of the non-falciparum species presented as
mixed infections
Prevalence by province
The prevalence of P.falciparum in the two provinces was almost the same, 55.6% and
52.6%, for Eastern and Luapula provinces respectively, (table 4). There was no
significant difference as seen from the p-value of 0.21. On the other hand, there was a
significant difference between the prevalence of P. malariae and P. ovale in the two
provinces; the P-values were less than 0.05.
Table 4: Comparative prevalence’s of Plasmodium species by Province
P.falciparum (%) P.malariae (%) P.ovale (%) P.vivax (%) All species (%)
Positive Negative Positive Negative Positive Negative Positive Negative Positive Negative
Eastern 51.0 49.0 2.4 97.6 1.2 98.8 0.2 99.8 55.6 44.4
Luapula 55.2 44.8 8.7 91.3 3.3 96.8 0.3 99.7 52.6 47.4
p-value 0.21 < 0.01 0.051 0.67 0.38
53.4%
5.0% 2.1% 0.2%
0.0%
10.0%
20.0%
30.0%
40.0%
50.0%
60.0%
P. falciparum P.malariea P.ovale P.vivax
Proportion of Malaria species
24 | P a g e
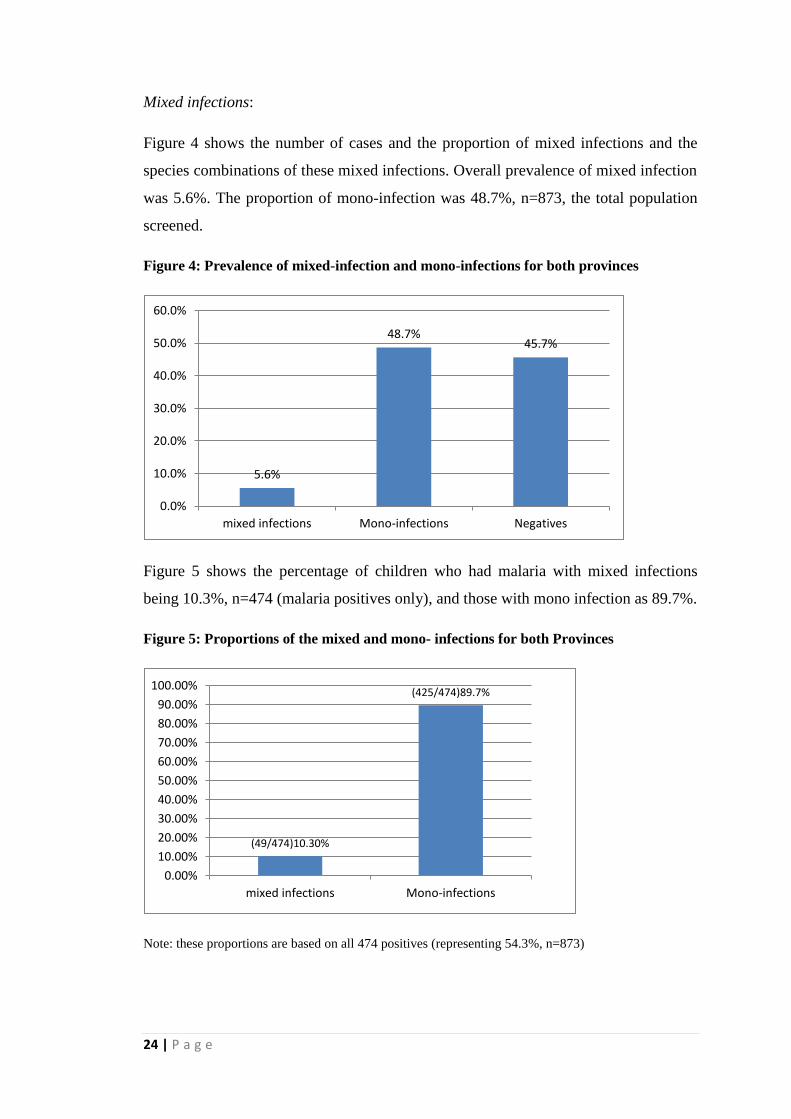
Mixed infections:
Figure 4 shows the number of cases and the proportion of mixed infections and the
species combinations of these mixed infections. Overall prevalence of mixed infection
was 5.6%. The proportion of mono-infection was 48.7%, n=873, the total population
screened.
Figure 4: Prevalence of mixed-infection and mono-infections for both provinces
Figure 5 shows the percentage of children who had malaria with mixed infections
being 10.3%, n=474 (malaria positives only), and those with mono infection as 89.7%.
Figure 5: Proportions of the mixed and mono- infections for both Provinces
Note: these proportions are based on all 474 positives (representing 54.3%, n=873)
5.6%
48.7% 45.7%
0.0%
10.0%
20.0%
30.0%
40.0%
50.0%
60.0%
mixed infections Mono-infections Negatives
(49/474)10.30%
(425/474)89.7%
0.00%
10.00%
20.00%
30.00%
40.00%
50.00%
60.00%
70.00%
80.00%
90.00%
100.00%
mixed infections Mono-infections
25 | P a g e
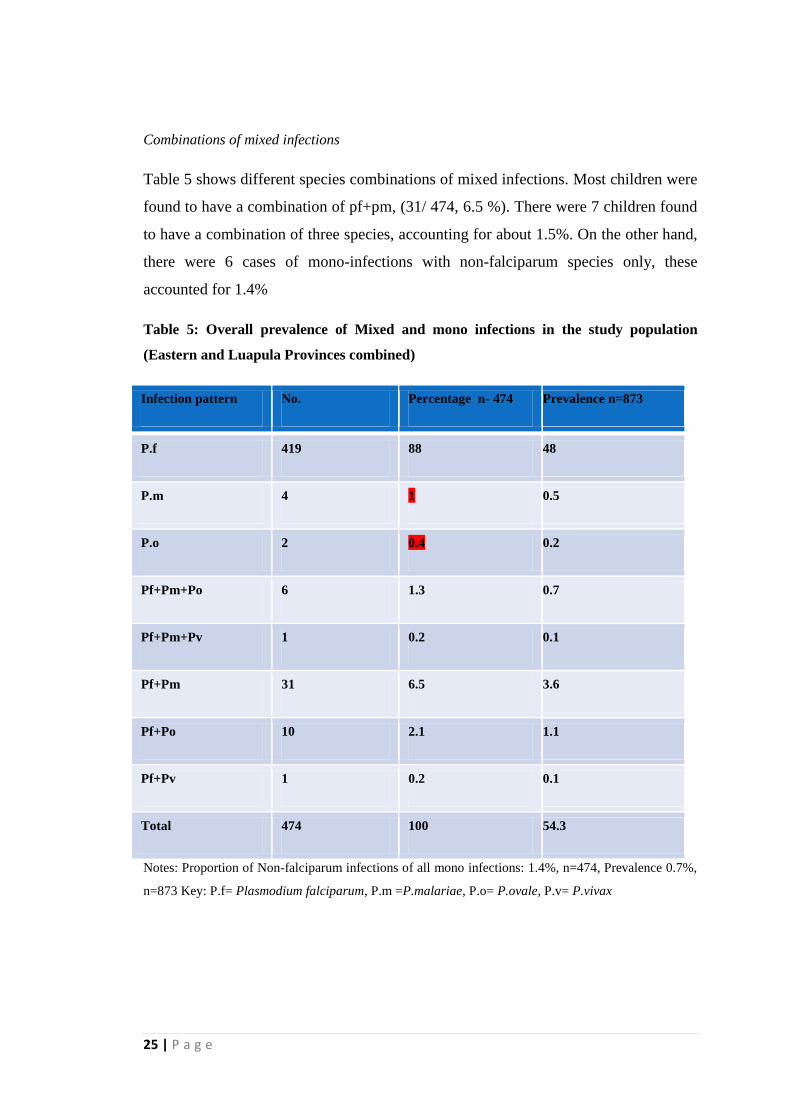
Combinations of mixed infections
Table 5 shows different species combinations of mixed infections. Most children were
found to have a combination of pf+pm, (31/ 474, 6.5 %). There were 7 children found
to have a combination of three species, accounting for about 1.5%. On the other hand,
there were 6 cases of mono-infections with non-falciparum species only, these
accounted for 1.4%
Table 5: Overall prevalence of Mixed and mono infections in the study population
(Eastern and Luapula Provinces combined)
Infection pattern No. Percentage n- 474 Prevalence n=873
P.f 419 88 48
P.m 4 1 0.5
P.o 2 0.4 0.2
Pf+Pm+Po 6 1.3 0.7
Pf+Pm+Pv 1 0.2 0.1
Pf+Pm 31 6.5 3.6
Pf+Po 10 2.1 1.1
Pf+Pv 1 0.2 0.1
Total 474 100 54.3
Notes: Proportion of Non-falciparum infections of all mono infections: 1.4%, n=474, Prevalence 0.7%,
n=873 Key: P.f= Plasmodium falciparum, P.m =P.malariae, P.o= P.ovale, P.v= P.vivax
26 | P a g e
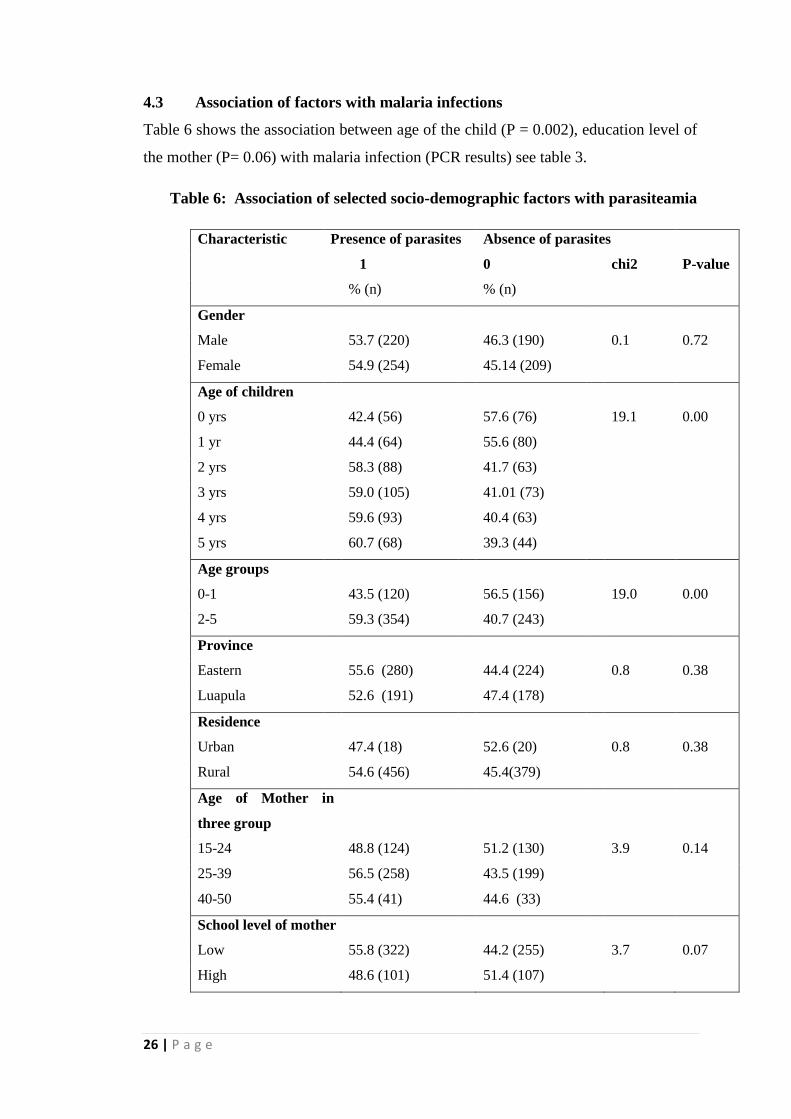
4.3 Association of factors with malaria infections
Table 6 shows the association between age of the child (P = 0.002), education level of
the mother (P= 0.06) with malaria infection (PCR results) see table 3.
Table 6: Association of selected socio-demographic factors with parasiteamia
Characteristic Presence of parasites Absence of parasites
1
0
chi2 P-value
% (n)
% (n)
Gender
Male
53.7 (220) 46.3 (190) 0.1 0.72
Female
54.9 (254) 45.14 (209)
Age of children
0 yrs
42.4 (56) 57.6 (76) 19.1 0.00
1 yr
44.4 (64) 55.6 (80)
2 yrs
58.3 (88) 41.7 (63)
3 yrs
59.0 (105) 41.01 (73)
4 yrs
59.6 (93) 40.4 (63)
5 yrs
60.7 (68) 39.3 (44)
Age groups
0-1
43.5 (120) 56.5 (156) 19.0 0.00
2-5 59.3 (354) 40.7 (243)
Province
Eastern
55.6 (280) 44.4 (224) 0.8 0.38
Luapula
52.6 (191) 47.4 (178)
Residence
Urban
47.4 (18)
52.6 (20)
0.8 0.38
Rural
54.6 (456) 45.4(379)
Age of Mother in
three group
15-24
48.8 (124) 51.2 (130) 3.9 0.14
25-39
56.5 (258) 43.5 (199)
40-50
55.4 (41)
44.6 (33)
School level of mother
Low 55.8 (322) 44.2 (255) 3.7 0.07
High 48.6 (101) 51.4 (107)
27 | P a g e
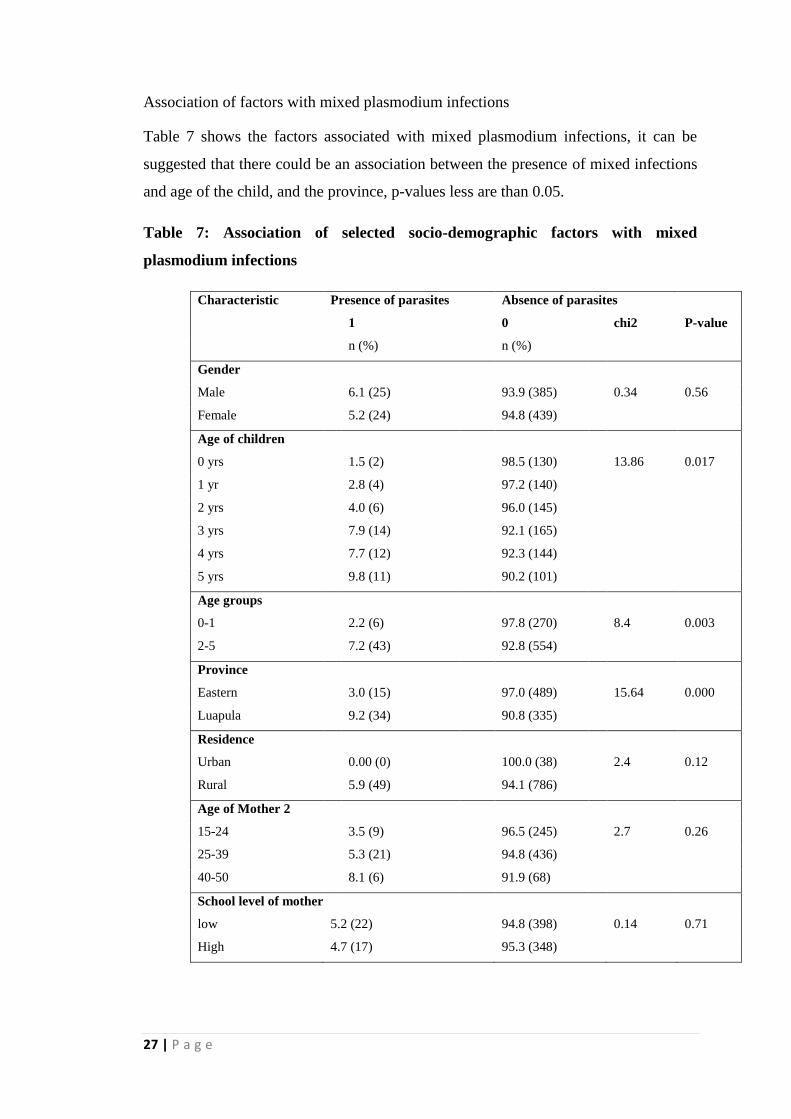
Association of factors with mixed plasmodium infections
Table 7 shows the factors associated with mixed plasmodium infections, it can be
suggested that there could be an association between the presence of mixed infections
and age of the child, and the province, p-values less are than 0.05.
Table 7: Association of selected socio-demographic factors with mixed
plasmodium infections
Characteristic Presence of parasites Absence of parasites
1
0
chi2 P-value
n (%)
n (%)
Gender
Male
6.1 (25) 93.9 (385) 0.34 0.56
Female
5.2 (24) 94.8 (439)
Age of children
0 yrs
1.5 (2) 98.5 (130) 13.86 0.017
1 yr
2.8 (4) 97.2 (140)
2 yrs
4.0 (6) 96.0 (145)
3 yrs
7.9 (14) 92.1 (165)
4 yrs
7.7 (12) 92.3 (144)
5 yrs
9.8 (11) 90.2 (101)
Age groups
0-1
2.2 (6) 97.8 (270) 8.4 0.003
2-5 7.2 (43) 92.8 (554)
Province
Eastern
3.0 (15) 97.0 (489) 15.64 0.000
Luapula
9.2 (34) 90.8 (335)
Residence
Urban
0.00 (0)
100.0 (38)
2.4 0.12
Rural
5.9 (49) 94.1 (786)
Age of Mother 2
15-24
3.5 (9) 96.5 (245) 2.7 0.26
25-39
5.3 (21) 94.8 (436)
40-50
8.1 (6)
91.9 (68)
School level of mother
low 5.2 (22) 94.8 (398) 0.14 0.71
High 4.7 (17) 95.3 (348)
28 | P a g e
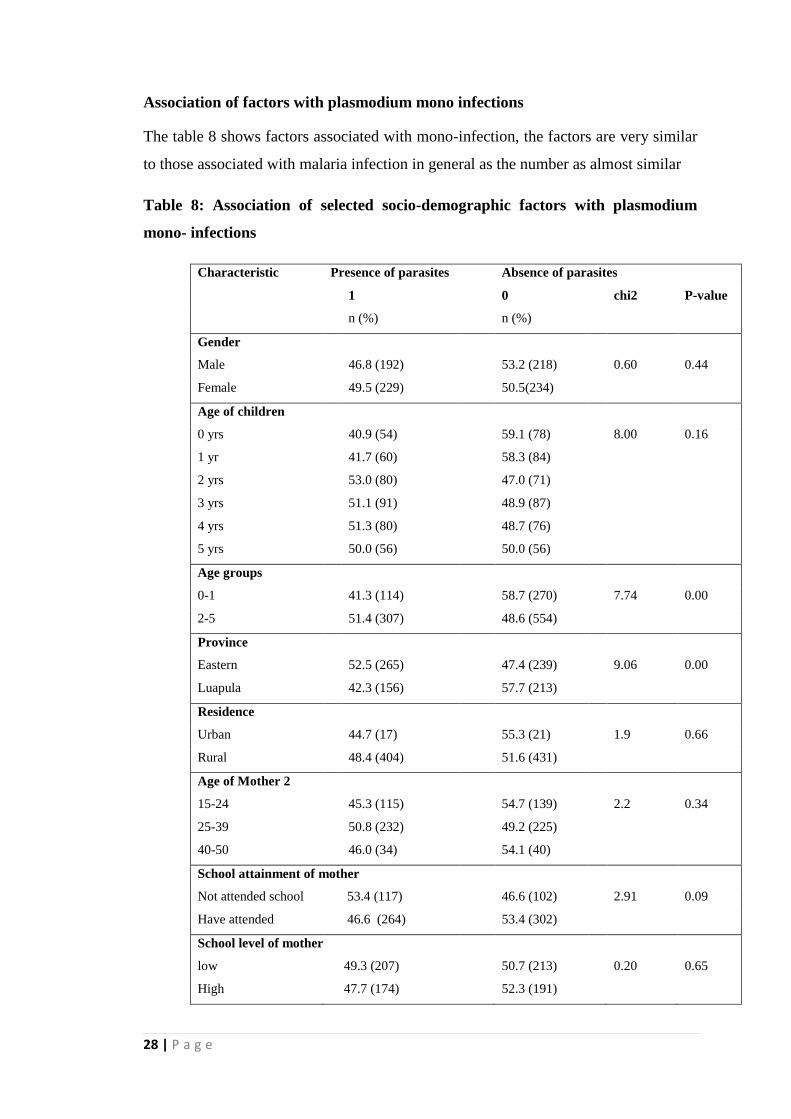
Association of factors with plasmodium mono infections
The table 8 shows factors associated with mono-infection, the factors are very similar
to those associated with malaria infection in general as the number as almost similar
Table 8: Association of selected socio-demographic factors with plasmodium
mono- infections
Characteristic Presence of parasites Absence of parasites
1
0
chi2 P-value
n (%)
n (%)
Gender
Male
46.8 (192) 53.2 (218) 0.60 0.44
Female
49.5 (229) 50.5(234)
Age of children
0 yrs
40.9 (54) 59.1 (78) 8.00 0.16
1 yr
41.7 (60) 58.3 (84)
2 yrs
53.0 (80) 47.0 (71)
3 yrs
51.1 (91) 48.9 (87)
4 yrs
51.3 (80) 48.7 (76)
5 yrs
50.0 (56) 50.0 (56)
Age groups
0-1
41.3 (114) 58.7 (270) 7.74 0.00
2-5 51.4 (307) 48.6 (554)
Province
Eastern
52.5 (265) 47.4 (239) 9.06 0.00
Luapula
42.3 (156) 57.7 (213)
Residence
Urban
44.7 (17)
55.3 (21)
1.9 0.66
Rural
48.4 (404) 51.6 (431)
Age of Mother 2
15-24
45.3 (115) 54.7 (139) 2.2 0.34
25-39
50.8 (232) 49.2 (225)
40-50
46.0 (34)
54.1 (40)
School attainment of mother
Not attended school 53.4 (117) 46.6 (102) 2.91 0.09
Have attended 46.6 (264) 53.4 (302)
School level of mother
low 49.3 (207) 50.7 (213) 0.20 0.65
High 47.7 (174) 52.3 (191)
29 | P a g e
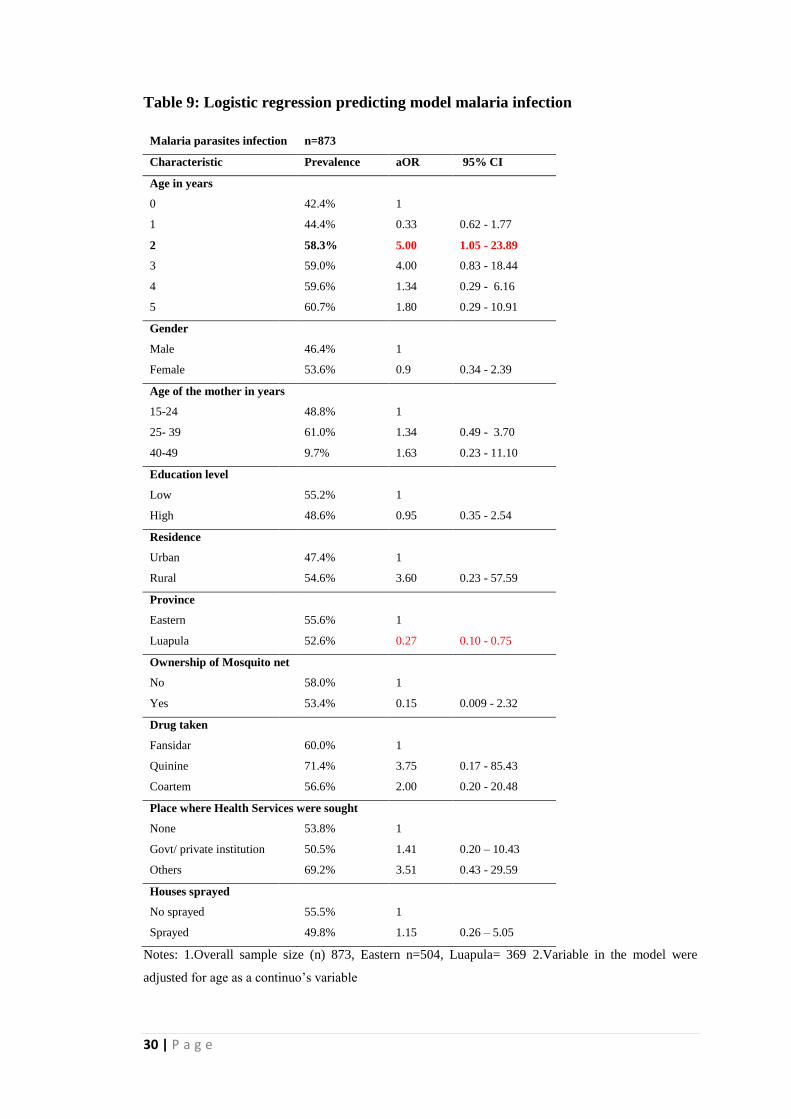
4.4 Predictors of malaria infections
Table 9 shows a logistic regression model, where gender, region, province, ITN use,
and sprayed houses are controlled for, to exam the association between age and
presence of malaria. The results showed an association between demographic and
social factors, and malaria infection; age of the child, particularly children age 2 years
as seen from the odds ratio of 5 and the confidence interval (1.05-23.89). Although,
the confidence interval is wide, implying the results may not be so precise, suggesting
the association is not very strong.
30 | P a g e
Table 9: Logistic regression predicting model malaria infection
Malaria parasites infection n=873
Characteristic Prevalence aOR 95% CI
Age in years
0
42.4% 1
1
44.4% 0.33 0.62 - 1.77
2
58.3% 5.00 1.05 - 23.89
3
59.0% 4.00 0.83 - 18.44
4
59.6% 1.34 0.29 - 6.16
5 60.7% 1.80 0.29 - 10.91
Gender
Male
46.4% 1
Female
53.6% 0.9 0.34 - 2.39
Age of the mother in years
15-24
48.8% 1
25- 39
61.0% 1.34 0.49 - 3.70
40-49
9.7% 1.63 0.23 - 11.10
Education level
Low
55.2% 1
High
48.6% 0.95 0.35 - 2.54
Residence
Urban
47.4% 1
Rural
54.6% 3.60 0.23 - 57.59
Province
Eastern
55.6% 1
Luapula
52.6% 0.27 0.10 - 0.75
Ownership of Mosquito net
No
58.0% 1
Yes
53.4% 0.15 0.009 - 2.32
Drug taken
Fansidar
60.0% 1
Quinine
71.4% 3.75 0.17 - 85.43
Coartem
56.6% 2.00 0.20 - 20.48
Place where Health Services were sought
None
53.8% 1
Govt/ private institution 50.5% 1.41 0.20 – 10.43
Others 69.2% 3.51 0.43 - 29.59
Houses sprayed
No sprayed
55.5% 1
Sprayed
49.8% 1.15 0.26 – 5.05
Notes: 1.Overall sample size (n) 873, Eastern n=504, Luapula= 369 2.Variable in the model were
adjusted for age as a continuo’s variable
31 | P a g e
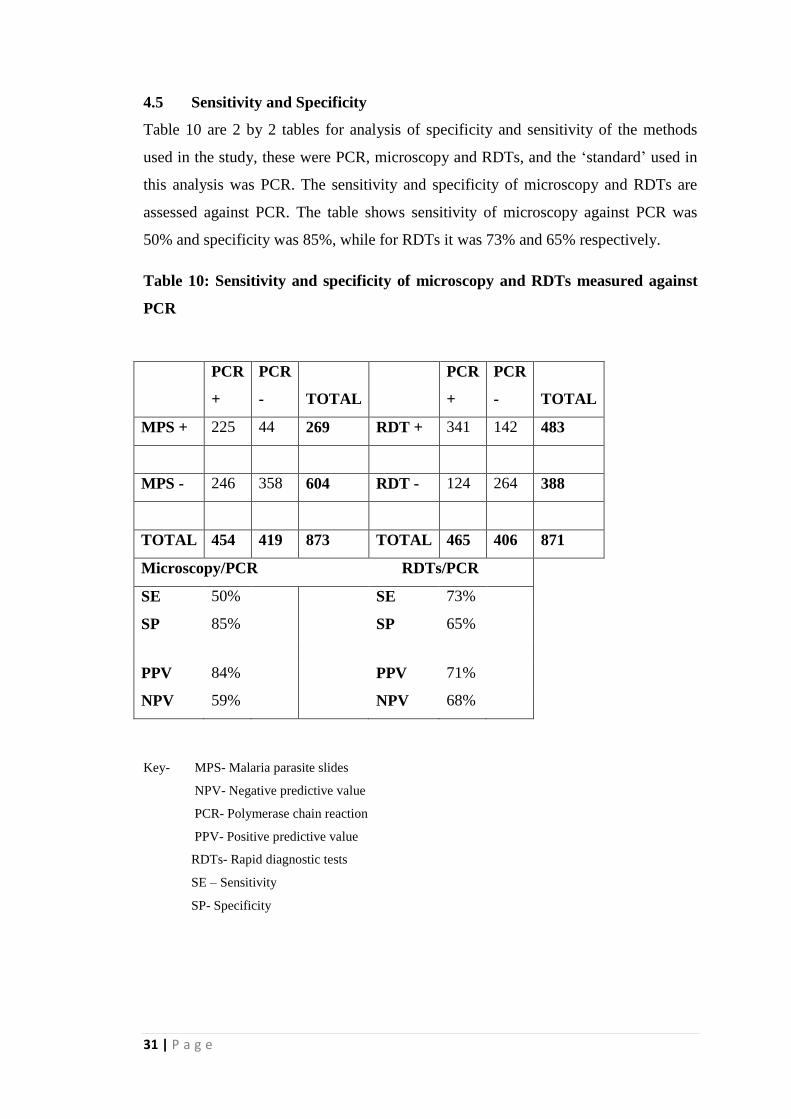
4.5 Sensitivity and Specificity
Table 10 are 2 by 2 tables for analysis of specificity and sensitivity of the methods
used in the study, these were PCR, microscopy and RDTs, and the ‘standard’ used in
this analysis was PCR. The sensitivity and specificity of microscopy and RDTs are
assessed against PCR. The table shows sensitivity of microscopy against PCR was
50% and specificity was 85%, while for RDTs it was 73% and 65% respectively.
Table 10: Sensitivity and specificity of microscopy and RDTs measured against
PCR
PCR
+
PCR
- TOTAL
PCR
+
PCR
- TOTAL
MPS + 225 44 269 RDT + 341 142 483
MPS - 246 358 604 RDT - 124 264 388
TOTAL 454 419 873 TOTAL 465 406 871
Microscopy/PCR RDTs/PCR
SE 50%
SE 73%
SP 85%
SP 65%
PPV 84%
PPV 71%
NPV 59%
NPV 68%
Key- MPS- Malaria parasite slides
NPV- Negative predictive value
PCR- Polymerase chain reaction
PPV- Positive predictive value
RDTs- Rapid diagnostic tests
SE – Sensitivity
SP- Specificity
32 | P a g e
CHAPTER FIVE
5.0 DISCUSSION
The findings illustrate high burden of malaria infection with an overall prevalence of
54.3%, although not significantly different by site (Eastern Province 52.6% and
Luapula Province 55.6%). This might partly explain why malaria remains one of the
leading causes of morbidity and mortality in Zambia, despite the preventive and
control measures in place. These figures are similar to or higher than reported
microscopy based results in the MIS 2010 report, where Luapula had a prevalence of
50% and Eastern Province had 22%, although different diagnostic methods were used.
The reasons for this high burden are unclear (and were beyond the scope of this
study), given that preventive and control measures that were available in the two
provinces, were similar to the ones in the other provinces in the country with low
malaria prevalence. This might suggest that additional and setting specific prevention
and control measures grounded in local values need to be considered. Masaninga et al
2013 suggested that diagnosis of all suspected cases, prompt treatment with ACTs and
strengthen surveillance in the whole country would reduce malaria cases. This high
prevalence (54.3%) comprised all the four species (48.7% P.falciparum, 0.5%
P.malariae, 0.2% P.ovale and 5.6% mixed infections). The prevalence of non-
falciparum infections was found to be 6.0%, which is higher than the anecdotal 2% the
country has been using notwithstanding the differential transmission patterns which
are core determinants for non-falciparum infections. This may further suggest that
there is need to continue monitoring non-falciparum infection burden in this
population, so as to decide at which point species-specific RDTs may be introduced
for diagnostic purposes especially in younger children. Age was found to be a
predictor of malaria infections and mixed infection; children aged two old years and
older had more infections than the other ages.
Comparing the prevalence in the two provinces, the proportions of malaria was similar
55.6% and 52.6% for Eastern and Luapula Provinces respectively, although there was
a significant difference between the prevalence of two species; P.malariae and
P.ovale. Eastern had a prevalence of 2.4%, and Luapula had 8.7 % for P.malaria; and
in the case of P.ovale, 1.2% and 3.3% for Eastern and Luapula respectively, indicating
that the prevalence of the two species is higher in Luapula than in Eastern Province.
Two cases of P.vivax were found, one from each province, their number may not be
33 | P a g e
significant but there is need to further investigate the cases further. The reasons for
these differences are beyond the scope of this study; on observation, the province with
the lower prevalence of malaria has the lower prevalence of the non-falciparum
species. Given this, it is reasonable to assume that, one of the contributing factors is
the misuse of ITNs. Eisele et al, 2011 stated that there was documented evidence of
misuse of ITNs as fishing net, wedding veils in Uganda, Kenya, Tanzania and
Zambia. This could explain high burden in Luapula Province which has more water
bodies, compared to Eastern Province.
Mixed malaria species infections are often unreported or under-reported; the
prevalence of mixed infections was 5.6% in this study, a study by Smuthuis et al,
2010, in adults conducted in Myanmar on response to ACT regimens found 16%
mixed infections. Another study by Mohapatra et al 2012, in Orissaon, India, on the
outcome of co-infections found 13.6% malaria species mixed infections. These two
studies were hospital based studies while this study was a community based survey so
the results are comparable. On the other hand, Mandunda et al, 2008, in a community
survey, found a prevalence of 2.9% in Mozambique. When stratified according to
provinces, Luapula Province has a higher prevalence of mixed infection compared to
Eastern Province. These mixed infections may have an impact on the development of
a vaccine for malaria, as the vaccines being developed mainly target falciparum
malaria and it is not clear how the vaccines can perform in individuals with mixed
infections. Ohrt et al, 2007 state that species error could have the effect of false
positives or negatives if a species-specific endpoint is defined for example in malaria
vaccines. In addition, presence of these species (P.ovale and P.vivax) calls for use of
Primaquine that is recommended for their treatment which can eliminate the dormant
hypnozoites, but can cause haemolysis in patients who have a Glocose-6-Phospate
Dehydrogenase (G6PD) deficiency (Galappaththy et al, 2008). This calls for screening
of the community before treatment, but this may not be feasible as most health
facilities lack laboratory facilities, hence ACTs will be used and hypnozoites will not
be cleared and the control of malaria will be affected.
The prevalence of mono-infections was 48.7%, of these, 48.0% were P. falciparum
and 0.7% were P.malariae and P.ovale, n=873. The fact that such cases are present
indicate the need to have a diagnostic tool that can detect them, however, it should not
necessarily be the primary diagnostic tool, but one that can be used in cases where
34 | P a g e
patients come back with symptoms of malaria and have negative Histidine Rich
Protein II (HRP II) based RDTs results. An RDTs that can detect the four species
should be used. With regards to health facilities where microscopy services are
present, there is need to conduct refresher courses for almost all laboratory staff in the
diagnosis of malaria especially on speciation despite the fact there are very few cases
of non-falciparum mono-infections. Ohrt et al, 2007, stated that training drastically
improves quality of microscopy, reducing false positives. These cases are not
alarming to warrant change in the diagnostic tools as most of the non-falciparum cases
occur as mixed infections, hence the use of HRP II based RDTs is still acceptable.
There is need to examine the Prevalence of the species in areas with low transmission
areas.
Among the factors associated with malaria infections, only age of the child seemed to
have had an association with co-infections and or presence of any malaria species.
Younger children aged 0-2 years were less likely to have malaria or were somehow
protected from malaria compared to those aged between 3-5 years. Our study showed
a gradual increase in percentage of children infected with malaria as age increased.
The younger children were less likely to have malaria, but as they grow, more children
tend to have malaria infections, as they reach the age of 5 years their immunity would
have belt up and infections reduce. It’s a known fact, that maternal acquired
antibodies protect infants up to the time they are 6-9 months from a number of
infections, malaria inclusive (Riley et al, 2001). Although recent studies suggest
otherwise (Alessandro et al, 2012) some study finding suggest that age maybe
protective. In addition, these finding could be attributed to the use of ITNs, younger
children sleep under ITNs as they are breast feeding; at the age of 2-3 years they are
weaned off and may not sleep under a net. The other variables which include gender,
education status of the mother, residence (Urban or rural) did not show any
association.
Effective, accurate and precise tools for diagnosis of any infection are vital in the
management of the infection. Malaria is not an exception or a special case; an accurate
and effective tool is vital to better manage it, and more so as the nation goes towards
elimination of the malaria parasites. The accuracy and precision of a diagnostic tool is
assessed using sensitivity and specificity analysis. The sensitivity of microscopy was
found to be 50% and its specificity was 85%, implying that microscopy can detect
35 | P a g e
only 50% of the true positive results and can correctly detect 85% as the negative, thus
50% of the positives are missed. This is not very good considering the different
transmission patterns in the county. The success of control hinges on effective
surveillance and diagnostic methods (Kamau E et al, 2011). Reley et al 2010,
reported a sensitivity of 65%, Coleman et al, 2006, reported sensitivity and specificity
for microscopy 33.5% and 58.5% respectively. In addition Batwala V et al, 2010,
found sensitivity and specificity of microscopy to be 41% and 97.1% respectively, and
for RDT 91.0% and 86.3% respectively. These findings are similar to the ones found
in this study, confirming that the shortfall of microscopy and RDTs are not unique to
our study. Despite molecular techniques being available and better, microscopy
remain the “gold standard” in malaria diagnosis in most countries and hence measures
need to be taken to improve it.
The likelihood of people tested using microscopy having malaria is about 84% and the
likelihood of them not having malaria is 59% as seen in the value of Positive
Predictive Value (PPV) and Negative Predictive Value (NPV). On the hand, for
patients tested using RDTs the likelihood that the test will show that they have malaria
is 71%, and the likelihood that those without malaria will have a negative test is 68%.
An ideal test should be easy to administer, interpret, of low cost and widely available,
and hence microscopy service need to be improved, for clinicians to have confidence
in it. Batwala et al 2010, show Positive Predictive values of 75% and 73.3% and NPV
of 80.7% and 95% for microscopy and RDTs respectively.
The study had a few limitations, which were; the effect of malaria species co-
infections on the outcome or clinical presentation could not be assessed as the study
was conducted in a community where most children were healthy and just carrying
parasites, even though some of them were found with fever and anaemia. Secondly,
occupation, income, proximity to health facility and environmental factors were also
not analysed, these could have given a clear picture of the associations or a better
prediction model. The slides were collected under field conditions and some of them
were dirty and difficult to examine. Finally, this data cannot be generalized to the
whole country, as this analysis is just for two provinces.
5.1 Conclusion
This study reveals presence of a high burden of non- falciparum malaria infections in
36 | P a g e
the study population, correlating with the high overall prevalence of malaria (54.7%).
The major factor associated with the burden of non-falciparum malaria was the age of
the child, which further supports the notion of increased exposure to environmental
factors as a child grows. This might call for repackaging of prevention and control
measures to account for environmental, maternal and programme factors linked to
child development. Having said this, it is further argued that the presence of non-
falciparum infections which might vary with transmission patterns, demographic
trends and geographical contrasts, needs to be monitored through a functional
surveillance system, in order to understand its epidemiological profile. Understanding
the epidemiology of non-falciparum will further help to dictate the development of
more sensitive species specific RDTs for diagnostics. Given that most of the non-
falciparum malaria occurred as mixed infections, the use of HRP II based RDT can
still continue in health facilities without microscopy, with an additional species-
specific test for patient who come back with malaria symptoms.
5.2 Recommendations
From the study, the following recommendations are made:
Firstly, a country wide study on the differential or non-falciparum species be carried
out at both health facility and community level, to ascertain the prevalence of
differential species. Furthermore, an active and a passive surveillance system should
be put in place. Secondly, additional site specific interventions measures grounded on
local malarial matrix should be introduced to eliminate the malaria. This also calls for
review of treatment and diagnostic protocols. Thirdly, the laboratory staff needs to be
trained on identification of species, and as such workshop and seminars should be
conducted. Finally, the National Malaria Control Centre Laboratory should
periodically perform PCR on randomly selected samples from the country.
37 | P a g e
REFERENCES
Amexo M, Tolhurst R, Barnish G, Bates I 2004, Malaria misdiagnosis: effects on the
poor and vulnerable. Lancet, vol 364 pp1896-1898.
Batwala V, Magnussen P, Nuwaha F. 2010. Are rapid diagnostic tests more accurate
in diagnosis of plasmodium falciparum Malaria compared to microscopy at rural
health centres? Malaria Journal 2010, 9:349
Bell D, Wongsrichanalai C, and Barnwell JW. 2006. “Ensuring quality and access for
malaria diagnosis: how can it be achieved?,” Nature Reviews Microbiology, vol. 4, no.
9, supplement, pp. 682–695.
Black J, Hommel M, Snounou G, and Pinder M 1994, Mixed infections with
Plasmodium falciparum and P. malariae and fever in malaria, Lancet vol 343
pp.1095.
Blossom BD., Kings CH. and Armitage KB. 2005 Occult plasmodium vivax infection
diagnosed by a polymerase chain reaction–based detection system: a case report, the
American Society of Tropical Medicine and Hygiene vol 73 no 1 pp. 188–190
Boerma JT and Weir SS 2006, Intergrating Demographic and Epidemiological
approach to research on HIV/AIDS; The proximate determinant framework. The
Journal of Infectous Diseases. Vol 191 no. 1: S61-7.
Bousema JT, Drakeley CJ, Mens PF, Arens T, Houben R, Omar SA, Gouagna LC,
Schallig H, Sauerwein RW 2008, Increased Plasmodium falciparum gametocyte
production in mixed infections with P. malariae. American Journal of Tropical
Medicine and Hygiene. vol. 78 no.3 pp442-8.
38 | P a g e
Bruce MC, Macheso A, Kelly-Hope LA, Nkhoma S, McConnachie A, et al. 2008,
Effect of Transmission Setting and Mixed Species Infections on Clinical Measures of
Malaria in Malawi. PLoS ONE vol. 3 no.7 pp2775.
Bukirwa H. Assessing rapid diagnostic tests for malaria [editorial]. Cochrane
Database Syst Rev. 2011
Carter R, Mendis KN 2002 Evolutionary and historical aspects of the burden of
malaria. Clinical Microbiology Review vol15 pp564-594.
Carvalho, TL, Ribolla PE, Curi RA and Mota LS. 2009. Characterization and and
transcriptional analysis of the promoter region of the Duffy blood group, chemokine
receptor (DARC) gene in cattle. Vet Immunol Immunopathol, 132, 153-9.
Chin W, Contacos PG, Coatney RG, Kimbal HR, 1965. Naturally acquired quotidian-
type malaria in man transferable to monkeys. Science vol 149 pp 865.
Chipeta J, Mharakurwa S, Thuma P, and Kumar N., 2009. A Synopsis of Current
Malaria Diagnosis Trends Medical Journal of Zambia, Vol 36 no. 2
Conway D.J 2007, Molecular epidemiology of malaria, Clinical Microbiology Review,
vol. 20 no.1 pp.188 – 204
Coleman RE, Sattabongkot J, Promstaporm S, Maneechai N, Tippayachai B,
Kengluecha A, Racapaew N, Zollner G, Miller RS, Vaughan J A, Thimasarn K and
Khuntirat B 2006, C Comparison of PCR and microscopy for the detection of
asymptomatic malaria in a Plasmodium falciparum/vivax endemic area in Thailand.
Malaria Journal, 5:121
Cox-Singh J, Davis TM, Lee KS, Shamsul SS, Matusop A, Ratman S, et al. 2008
Plasmodium knowlesi malaria in humans is widely distributed and potentially life
threatening. Clinical Infectious Diseases.vol 46 pp 165–71. DOI: 10.1086/524888
D’Alessandro U, Ubben D, Hamed K, Ceesay SJ, Okebe J, Taal M, Lama KE,
Koivogui L, Nahum A, Bojang Sonko AJ, Lalya FH and Brabin B 2012, Malaria in
39 | P a g e
infants aged less than six months-is it an area of unmet medical need? Malaria
Journal: 11 400
de Castro CM and Fisher GM 2012, Is Malaria illness among young children a cause
or consequence of low socio-economic status? Evidence from the United Republic of
Tanzania. Malaria Journal vol 11:161
Eede PVD, Van HN, Overmeir CV, Duc TN, Hung LX, Manh HN, Jozef A et al
2009, Plasmodium knowlesi infections in young children in central Vietnam Malaria
Journal vol. 8 pp 249
Eisele TP, Thwing J, Keating J 2011 Claims about the Misuse of Insecticide-Treated
Mosquito Nets: Are These Evidence-Based? PLoS Med 8(4): e1001019.
doi:10.1371/journal.pmed.1001019
Galappaththy GNL, Omari AAA, Tharyan P2008, Primaquine for preventing relapses
in people with Plasmodium vivax malaria (Review), Wiley publishers
http://www.thecochranelibrary.com
Gerald DS, and Larry SR., 2000. Foundations of Medical Parasitology, 6th
Ed: 141-
156. Singapore. McGraw Hill)
Gogia A , Kakar A, and Byotra SP, 2012 Is benign tertian malaria actually benign?
trop Doct vol. 42 no. 2 pp 92-93
Hamer DH, Ndhlovu M, Zurovac D, Fox M, Yeboah-Antwi K, Chanda P. 2009,
Improved diagnostic test for malaria treatment practices in Zambia. JAMA, vol. 279
no. 20 pp 2227- 2231
Hopkins H, Kambale W, Kamya MR, Staedke SG, Dorsey G, Rosenthal PJ:
Comparison of HRP2- and pLDH-based rapid diagnostic tests for malaria with
longitudinal follow-up in Kampala, Uganda. Am J Trop Med Hyg 2007, 76:1092-1097
Kallander K, Nsungwa-Sabiiti J, Peterson S, 2004 Symptom overlap for malaria and
pneumonia-policy implications for home management strategies. Acta Tropical vol.90
no. 2 pp 211-214
Kamau E, Tolbert LS, Kortepeter L, Pratt M, Nyakoe N, Muringo L, Ogutu B,
Waitumbi JN, Ockenhouse FC, 2011. Development of a Highly Sensitive Genus-
40 | P a g e
Specific Quantitative Reverse Transcriptase Real-Time PCR Assay for Detection and
Quantitation of Plasmodium by Amplifying RNA and DNA of the 18S rRNA Genes▿
Journal of Clinical Microbiology vol. 49 no. 8 2946-2953
Koita OA, Doumbo OK, Ouattara A, Tall LK, Konaré A, Diakité M, Diallo M, Sagara
I, Masinde GL, Doumbo SN, Dolo A, Tounkara A, Traoré I, Krogstad DJ 2012,False-
negative rapid diagnostic tests for malaria and deletion of the histidine-rich repeat
region of the hrp2 gene. American Journal of Tropical Medicine and Hygiene. vol. 86
no.2 pp194-8.
Larina SN, Sakharova TV, Chebyshev NV, 2009 Genetic resistance to malaria. Med
Parazitol (Mosk), 10-4.
Mabunda S, Casimiro S, Quinto L and Alonso A Pedro, 2008. Country-wide malaria
survey in Mozambique. I. Plasmodium falciparum infection in children in different
epidemiological settings, Malaria Journal 2008, 7:216 doi:10.1186/1475-2875-7-216
Maitland K, Williams TN., Bennett S, Newbold CI, Peto TE., Viji J, Timothy R,
Cleggy JB, Weatherall DJ, Bowden DK, 1996, The interaction between Plasmodium
falciparum and P. vivax in children on Espiritu Santo Island, Vanuatu. Trans. R. Soc.
Trop. Med. Hyg.vol. 90 pp 614–620
Malaria Indicator Survey 2010 report
Marchand R P, Culleton R, Maeno Y, Quang NT., and Nakazawa S 2011 Co-
infections of Plasmodium knowlesi, P. falciparum, and P. vivax among Humans and
Anopheles dirus Mosquitoes, Southern Vietnam , Emerging Infectious Diseases Vol.
17, No. 7.
Marques P., Saúte F, Pinto VV, Cardoso S, Pinto J., Alonso PL, do Rosário VE, Arez
AP, 2005, Plasmodium species mixed infections in two areas of Manhiça District,
Mozambique International Journal of Biological Sciences vol. 1 no.3 pp96-102 ISSN
1449-2288
Masaninga F, Chanda E, Chanda-kapata P, Hamainza B, Masendu TH, Kamuliwo M,
Kapelwa, Chimumbwe J, Govera J, Otten M, Fall S.I, Babaniyi O 2013, Review of the
41 | P a g e
malaria epidemiology and trends, Asian Pacific Journal of Tropical Biomedicine vol
3. No. 2 89-94
Mayxay M, Pukrittayakame S, Newton PN , White NJ 2004, Mixed-species malaria
infections in humans, Trends in Parasitology. Vol 20 (5): 233-40
Mckenzia FE, Jeffey GM, Collins WE 2002, Gametocytemia and fever in human
malaria infection. Journal of parasitology, vol. 93 no. 3 pp 627 - 633
Mendes C, Dias F, Figueiredo J, Mora VG, Cano J, Cano J., De sousa B, Do Rosario
VE., Benito A, Berzosa P. and Arez AP 2011. Duffy Negative Antigen Is No Longer a
Barrier to Plasmodium vivax – Molecular Evidences from the African West Coast
(Angola and Equatorial Guinea). PLoS Negl Trop Dis vol 5 no.6pp1192.
Ministry of Health: Health Management Information System, 2007 Lusaka, Zambia.
Minstry of Health: Guidelines for the Diagnosis and Treatment of Malaria in Zambia,
2010, Lusaka, Zambia
Moody A 2002, Rapid diagnostic test for malaria parasites. Clinical Microbiology
review, vol. 15 no. 1 pp 66-78
Mohapatra MK, Dash LK, Barih PK, and Karua PC, 2012 Profile of mixed species
(Plasmodium vivax and falciparum) malaria in adults. J Assoc Physicians India, 60,
pp 20-4
Mueller I, Zimmerman PA, Reeder JC 2007, Plasmodium malariae and Plasmodium
ovale—the ‘‘bashful’’ malaria parasites. Trends Parasitology. vol 23 no.6 pp 278–
283.
Murry CK, Gasser RA, Magill AJ, Miller R 2008, Update on rapid diagnostic tests for
malaria. Clinical Microbiology review, vol 21 no.1 pp 79 – 110
NMCC: National Malaria Control Programme Strategic Plan 2011- 2015
Nsobya SL,Parikh S, Kironde F, Lubega G, Kamya MR, Rosenthal PJ, Dorsey G,
2004. Molecular evaluation of the natural history of asymptomatic parasitemia in
Ugandan children. J Infect Dis, 189, 2220-6
42 | P a g e
Ohrt C, Obare P,NanaKorn A, Adhiambo C, Awuondo K., O’Meara P. W., Remich S,
Martin K, Cook E, Chretien J, Lucas C, Osoga J, McEvoy P, Owaga ML, Odera JS.
and Ogutu B 2007. Establishing a malaria diagnosis centre of excellence in Kisumu,
Kenya. Malaria Journal 6:79
Reyburn, H. Mbakilwa H. Mwangi R, Mweride O, Olomi R, Drakeley C and Whitty
CJ., 2007 , “Rapid diagnostic tests compared with malaria microscopy for guiding
outpatient treatment of febrile illness in Tanzania: randomised trial,” British Medical
Journal, vol. 334, no. 7590, p. 403,.
Riley EM, Wagner GE, Akanmori BD, Koram KA: 2001Do maternally acquired
antibodies protect infants from malaria infection? Parasite Immunology, 23:51-59.
Rock EP, Marsh K, Saul S J, Wellems TE, Taylor D W, Maloy WL, and Howard R J
1987, Comparative analysis of the Plasmodium falciparum histidine-rich proteins
HRP1, HRP2 and HRP3 in malaria diagnosis of diverse origin. Parasitology vol 95 pp
209–227.
Sharma V, Sharma A, Aggarwal A, Bhardwaj G, Aggarwal S 2012, Acute pancreatitis
in a patient with vivax malaria. JOP. Vol.13 no. 2 pp 215-6.
Singh B, Kim SL, Matusop A, Radhakrishnan A, Shamsul SS, Cox-Singh J, et al.
2004 A large focus of naturally acquired Plasmodium knowlesi infections in human
beings, Lancet, vol 363 pp1017–24. DOI: 10.1016/S0140-6736(04)15836-4
Smithuis F, Kyaw MK, Phe O, Win T, Aung PP, Oo AP, Naing AL, Nyo MY, Myint
NZ, Imwong M, Ashley E, Lee SJ, White N. J2010 Effectiveness of five artemisinin
combination regimens with or without primaquine in uncomplicated falciparum
malaria: an open-label randomised trial. Lancet Infectious Disease, 10:673-681.
Sullivan DJ, 2010 Uncertainty in Mapping Malaria Epidemiology: Implications for
Control Epidemiological Review, vol. 32 pp175–187
White NJ. 2008, Plasmodium knowlesi: the fifth human malaria parasite Clin Infect
Dis.vol 46 no. 2pp165-71.
WHO, “World Malaria Report,” 2010, http://www.who.int/ malaria/high risk
groups/en/.
43 | P a g e
WHO, Malaria Treatment Guideline, 2010
www.un.org/millenniumgoals.
www.rollbackmalaria.org/countryaction/aideMemoire/Zambia-The-malaria-program-
performance-review-2010.pdf
www.cdc.gov/malaria/diagnosis_treatment/microscopy, 2010
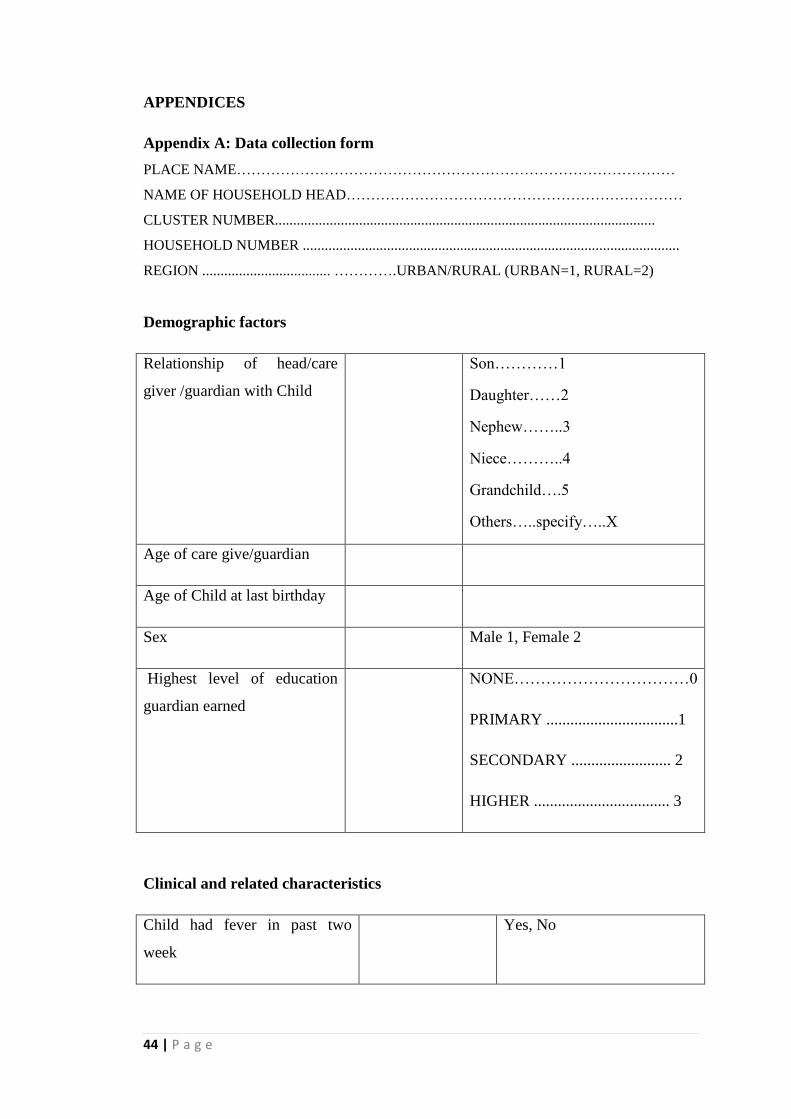
44 | P a g e
APPENDICES
Appendix A: Data collection form
PLACE NAME………………………………………………………………………………
NAME OF HOUSEHOLD HEAD……………………………………………………………
CLUSTER NUMBER........................................................................................................
HOUSEHOLD NUMBER .......................................................................................................
REGION ................................... ………….URBAN/RURAL (URBAN=1, RURAL=2)
Demographic factors
Relationship of head/care
giver /guardian with Child
Son…………1
Daughter……2
Nephew……..3
Niece………..4
Grandchild….5
Others…..specify…..X
Age of care give/guardian
Age of Child at last birthday
Sex Male 1, Female 2
Highest level of education
guardian earned
NONE……………………………0
PRIMARY .................................1
SECONDARY ......................... 2
HIGHER .................................. 3
Clinical and related characteristics
Child had fever in past two
week
Yes, No
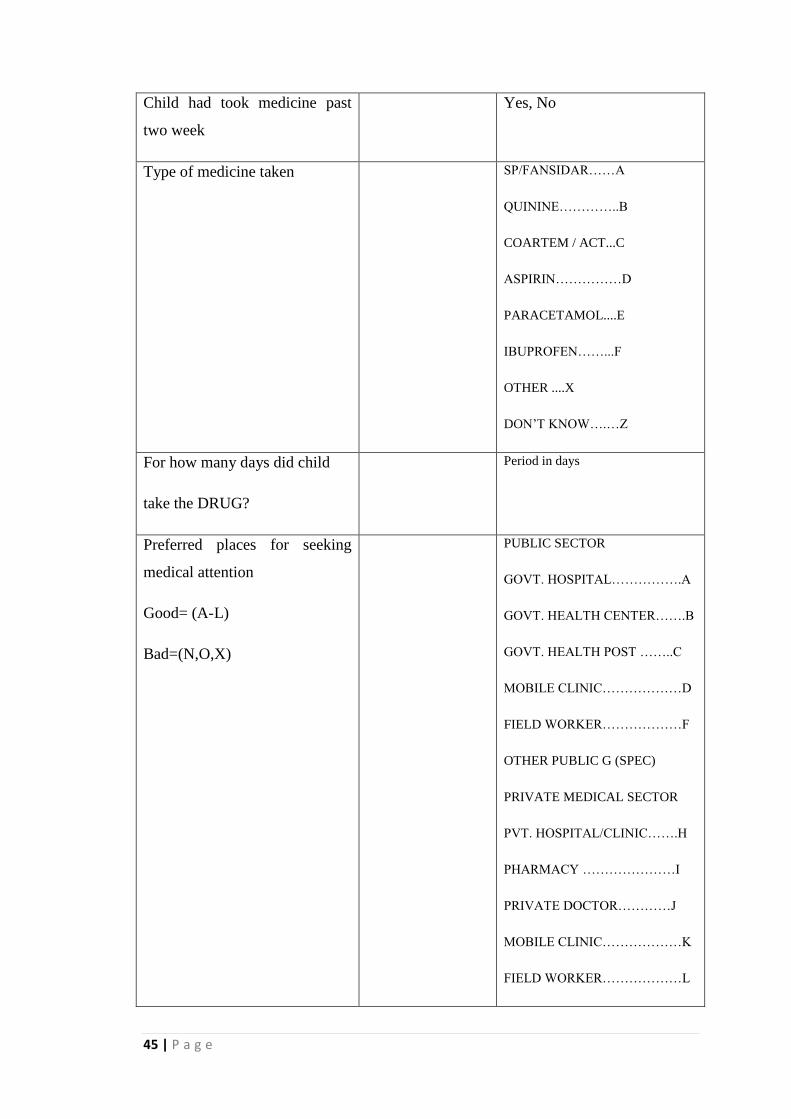
45 | P a g e
Child had took medicine past
two week
Yes, No
Type of medicine taken SP/FANSIDAR……A
QUININE…………..B
COARTEM / ACT...C
ASPIRIN……………D
PARACETAMOL....E
IBUPROFEN……...F
OTHER ....X
DON’T KNOW….…Z
For how many days did child
take the DRUG?
Period in days
Preferred places for seeking
medical attention
Good= (A-L)
Bad=(N,O,X)
PUBLIC SECTOR
GOVT. HOSPITAL…………….A
GOVT. HEALTH CENTER…….B
GOVT. HEALTH POST ……..C
MOBILE CLINIC………………D
FIELD WORKER………………F
OTHER PUBLIC G (SPEC)
PRIVATE MEDICAL SECTOR
PVT. HOSPITAL/CLINIC…….H
PHARMACY …………………I
PRIVATE DOCTOR…………J
MOBILE CLINIC………………K
FIELD WORKER………………L
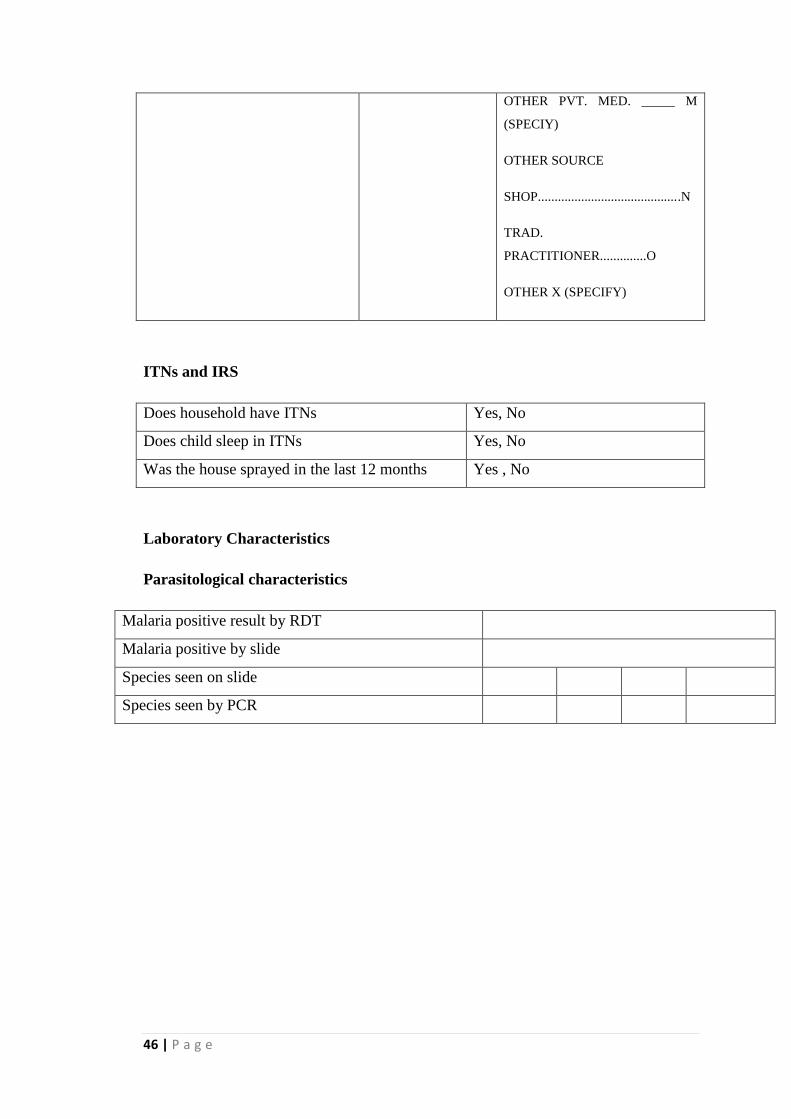
46 | P a g e
OTHER PVT. MED. _____ M
(SPECIY)
OTHER SOURCE
SHOP...........................................N
TRAD.
PRACTITIONER..............O
OTHER X (SPECIFY)
ITNs and IRS
Does household have ITNs Yes, No
Does child sleep in ITNs Yes, No
Was the house sprayed in the last 12 months Yes , No
Laboratory Characteristics
Parasitological characteristics
Malaria positive result by RDT
Malaria positive by slide
Species seen on slide
Species seen by PCR
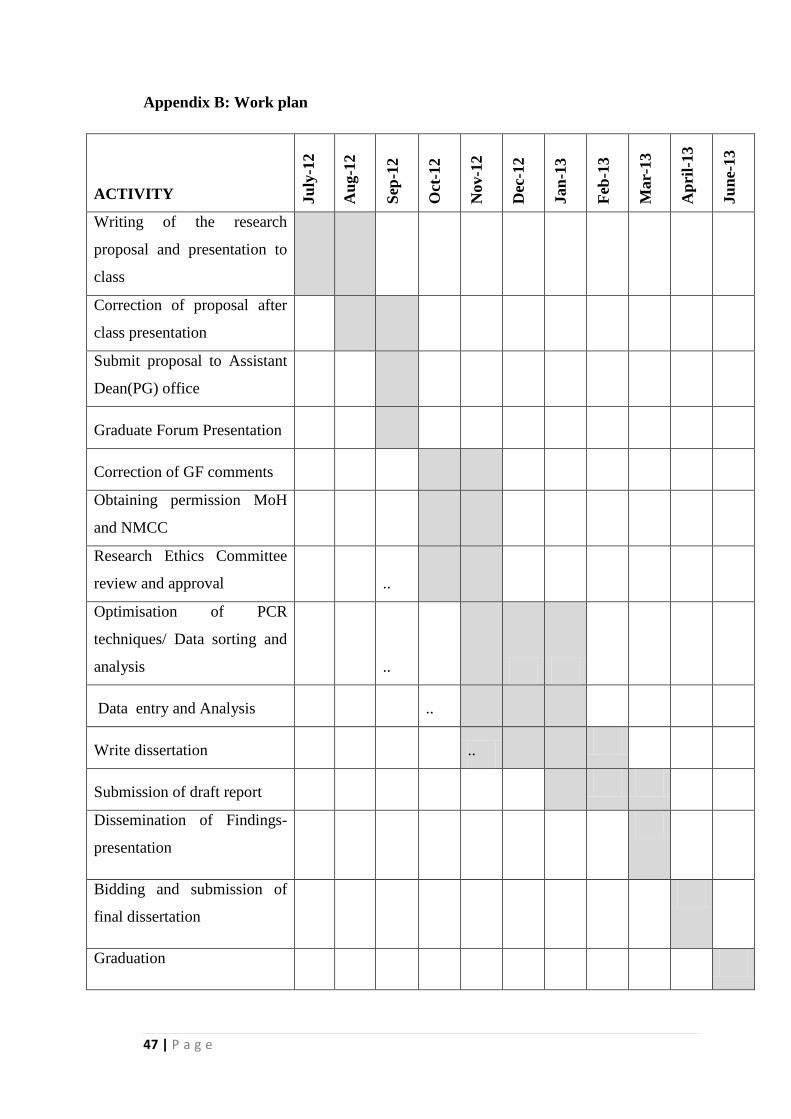
47 | P a g e
Appendix B: Work plan
ACTIVITY Ju
ly-1
2
Au
g-1
2
Sep
-12
Oct
-12
Nov-1
2
Dec
-12
Jan
-13
Feb
-13
Mar-
13
Ap
ril-
13
Ju
ne-
13
Writing of the research
proposal and presentation to
class
Correction of proposal after
class presentation
Submit proposal to Assistant
Dean(PG) office
Graduate Forum Presentation
Correction of GF comments
Obtaining permission MoH
and NMCC
Research Ethics Committee
review and approval
..
Optimisation of PCR
techniques/ Data sorting and
analysis
..
Data entry and Analysis ..
Write dissertation
..
Submission of draft report
Dissemination of Findings-
presentation
Bidding and submission of
final dissertation
Graduation
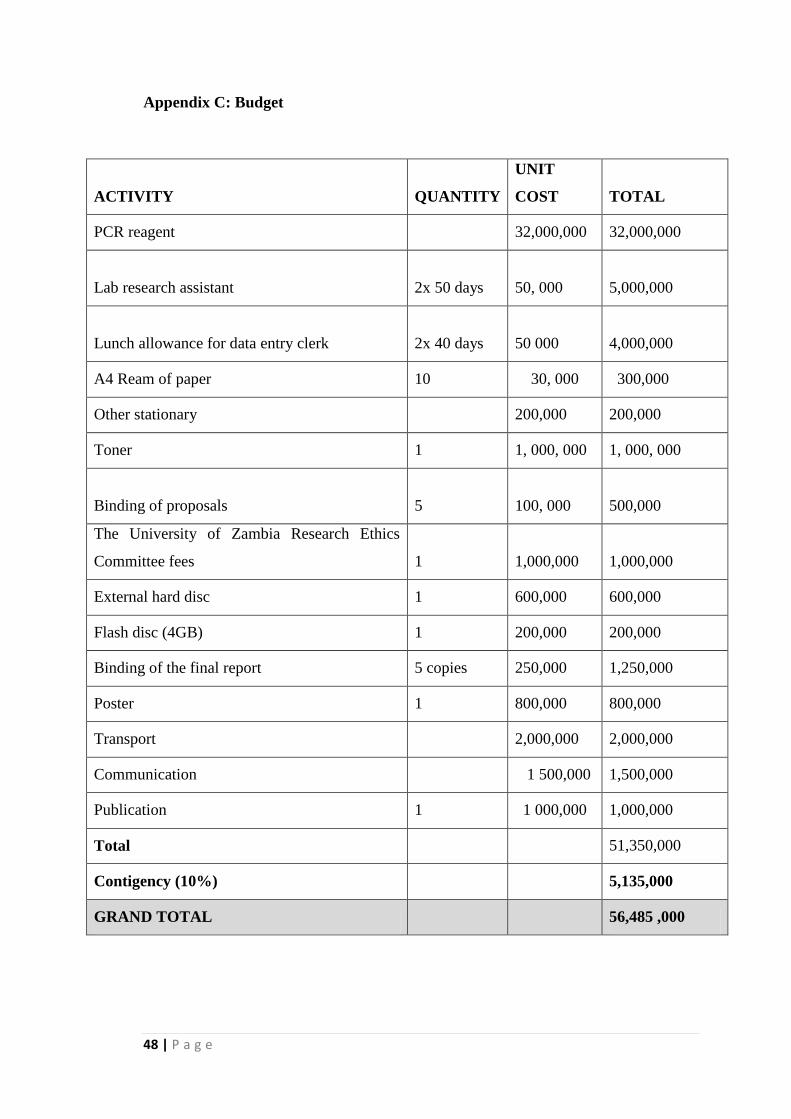
48 | P a g e
Appendix C: Budget
ACTIVITY QUANTITY
UNIT
COST TOTAL
PCR reagent
32,000,000 32,000,000
Lab research assistant 2x 50 days
50, 000
5,000,000
Lunch allowance for data entry clerk 2x 40 days
50 000
4,000,000
A4 Ream of paper 10 30, 000 300,000
Other stationary
200,000 200,000
Toner 1 1, 000, 000 1, 000, 000
Binding of proposals 5
100, 000
500,000
The University of Zambia Research Ethics
Committee fees 1
1,000,000
1,000,000
External hard disc 1 600,000 600,000
Flash disc (4GB) 1 200,000 200,000
Binding of the final report 5 copies 250,000 1,250,000
Poster 1 800,000 800,000
Transport
2,000,000 2,000,000
Communication
1 500,000 1,500,000
Publication 1 1 000,000 1,000,000
Total 51,350,000
Contigency (10%)
5,135,000
GRAND TOTAL
56,485 ,000
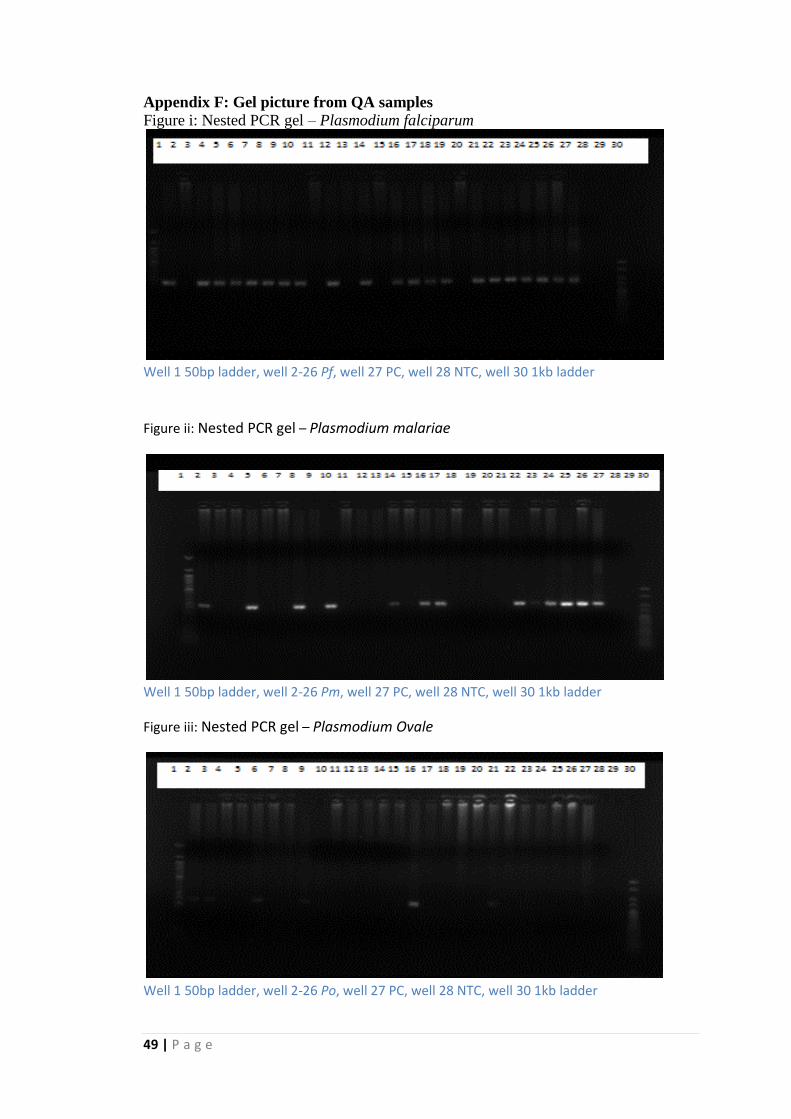
49 | P a g e
Appendix F: Gel picture from QA samples
Figure i: Nested PCR gel – Plasmodium falciparum
Well 1 50bp ladder, well 2-26 Pf, well 27 PC, well 28 NTC, well 30 1kb ladder
Figure ii: Nested PCR gel – Plasmodium malariae
Well 1 50bp ladder, well 2-26 Pm, well 27 PC, well 28 NTC, well 30 1kb ladder
Figure iii: Nested PCR gel – Plasmodium Ovale
Well 1 50bp ladder, well 2-26 Po, well 27 PC, well 28 NTC, well 30 1kb ladder
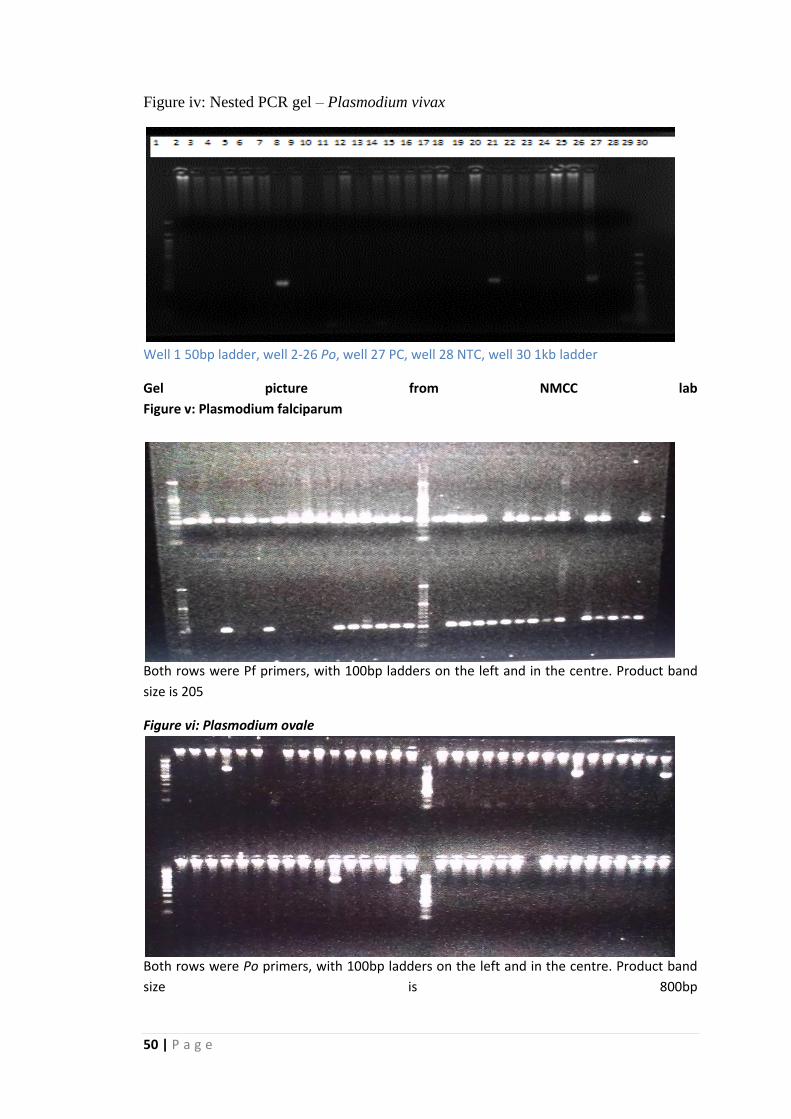
50 | P a g e
Figure iv: Nested PCR gel – Plasmodium vivax
Well 1 50bp ladder, well 2-26 Po, well 27 PC, well 28 NTC, well 30 1kb ladder
Gel picture from NMCC lab
Figure v: Plasmodium falciparum
Both rows were Pf primers, with 100bp ladders on the left and in the centre. Product band
size is 205
Figure vi: Plasmodium ovale
Both rows were Po primers, with 100bp ladders on the left and in the centre. Product band
size is 800bp
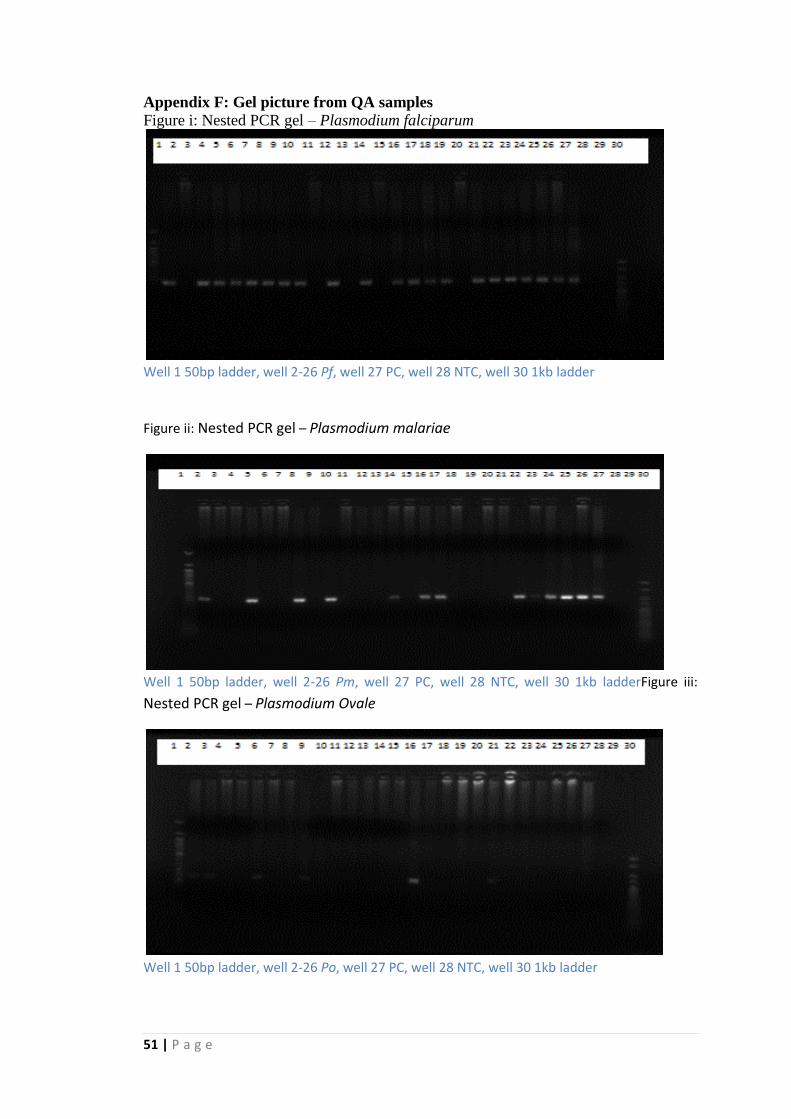
51 | P a g e
Appendix F: Gel picture from QA samples
Figure i: Nested PCR gel – Plasmodium falciparum
Well 1 50bp ladder, well 2-26 Pf, well 27 PC, well 28 NTC, well 30 1kb ladder
Figure ii: Nested PCR gel – Plasmodium malariae
Well 1 50bp ladder, well 2-26 Pm, well 27 PC, well 28 NTC, well 30 1kb ladderFigure iii:
Nested PCR gel – Plasmodium Ovale
Well 1 50bp ladder, well 2-26 Po, well 27 PC, well 28 NTC, well 30 1kb ladder
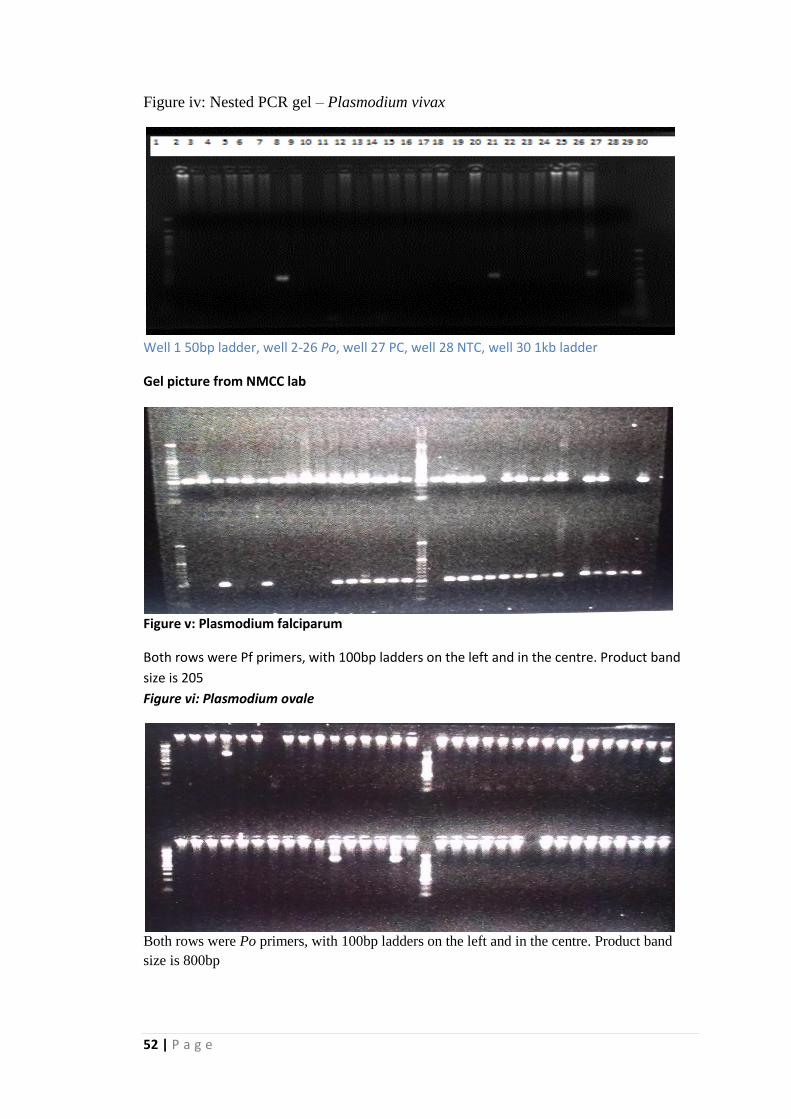
52 | P a g e
Figure iv: Nested PCR gel – Plasmodium vivax
Well 1 50bp ladder, well 2-26 Po, well 27 PC, well 28 NTC, well 30 1kb ladder
Gel picture from NMCC lab
Figure v: Plasmodium falciparum
Both rows were Pf primers, with 100bp ladders on the left and in the centre. Product band
size is 205
Figure vi: Plasmodium ovale
Both rows were Po primers, with 100bp ladders on the left and in the centre. Product band
size is 800bp