Embed Size (px)
Citation preview
Chen et al. BMC Gastroenterol (2021) 21:212 https://doi.org/10.1186/s12876-021-01782-w
RESEARCH ARTICLE
Prevalence of and risk factors for metabolic associated fatty liver disease in an urban population in China: a cross-sectional comparative studyYu‑ling Chen1†, Hao Li1†, Shu Li1†, Zhou Xu2†, Shen Tian1†, Juan Wu1†, Xin‑yu Liang1, Xin Li1, Zi‑li Liu1, Jun Xiao1, Jia‑ying Wei1, Chen‑yu Ma1, Kai‑nan Wu1, Liang Ran3* and Ling‑quan Kong1*
Abstract
Background: Metabolic associated fatty liver disease (MAFLD) is a new definition for liver disease associated with known metabolic dysfunction. Based on new diagnostic criteria, we aimed to investigate its prevalence and risk fac‑tors in Chinese population.
Methods: We conducted this study in a health examination population who underwent abdominal ultrasonography in China. The diagnosis of MAFLD was based on the new diagnostic criteria. The characteristics of the MAFLD popula‑tion, as well as the associations between MAFLD and metabolic abnormalities, were explored. Mann–Whitney U test and chi‑square test were performed to compare different variables. Binary logistic regression was used to determine the risk factors for MAFLD.
Results: Among 139,170 subjects, the prevalence of MAFLD was 26.1% (males: 35.4%; females: 14.1%). The preva‑lence based on female menopausal status, that is, premenopausal, perimenopausal, and postmenopausal, was 6.1%, 16.8%, and 30.2%, respectively. In different BMI groups (underweight, normal, overweight and obese), the prevalence was 0.1%, 4.0%, 27.4% and 59.8%, respectively. The proportions of abnormal metabolic features in the MAFLD group were significantly higher than those in the non‑MAFLD group, as was the proportion of elevated alanine aminotrans‑ferase (ALT) (42.5% vs. 11%, P < 0.001). In nonobese individuals with MAFLD, the proportions of abnormal metabolic features were also all significantly higher than those in nonobese individuals without MAFLD. The prevalence of meta‑bolic syndrome (MS), dyslipidaemia, and hyperuricaemia, respectively, in the MAFLD group (53.2%, 80.0%, and 45.0%) was significantly higher than that in the non‑MAFLD group (10.1%, 41.7%, and 16.8%). Logistic regression revealed
© The Author(s) 2021. Open Access This article is licensed under a Creative Commons Attribution 4.0 International License, which permits use, sharing, adaptation, distribution and reproduction in any medium or format, as long as you give appropriate credit to the original author(s) and the source, provide a link to the Creative Commons licence, and indicate if changes were made. The images or other third party material in this article are included in the article’s Creative Commons licence, unless indicated otherwise in a credit line to the material. If material is not included in the article’s Creative Commons licence and your intended use is not permitted by statutory regulation or exceeds the permitted use, you will need to obtain permission directly from the copyright holder. To view a copy of this licence, visit http:// creat iveco mmons. org/ licen ses/ by/4. 0/. The Creative Commons Public Domain Dedication waiver (http:// creat iveco mmons. org/ publi cdoma in/ zero/1. 0/) applies to the data made available in this article, unless otherwise stated in a credit line to the data.
Open Access
*Correspondence: [email protected]; [email protected] †Yu‑ling Chen,Hao Li, Shu Li, Zhou Xu, Shen Tian and Juan Wu have contributed equally tothis work1 Department of Endocrine and Breast Surgery, The First Affiliated Hospital of Chongqing Medical University, Chongqing 400016, China3 The Health Management Center of the First Affiliated Hospital of Chongqing Medical University, Chongqing, ChinaFull list of author information is available at the end of the articleYu‑ling Chen,Hao Li, Shu Li, Zhou Xu, Shen Tian and Juan Wu have contributed equally tothis work

Page 2 of 12Chen et al. BMC Gastroenterol (2021) 21:212
BackgroundMetabolic associated fatty liver disease (MAFLD), formerly known as nonalcoholic fatty liver disease (NAFLD), is a new definition of liver disease asso-ciated with known metabolic dysfunction and is the most common chronic liver disease worldwide. NAFLD affects 24% of the adult population world-wide and poses a threat to human health [1]. NAFLD is generally considered to be closely related to obesity and multiple metabolic disorders, and can vary from hepatic steatosis to steatohepatitis, fibrosis or cirrho-sis [2]. It is regarded as the hepatic manifestation of multisystem metabolic dysfunction [3]. Previously, the diagnosis of NAFLD was an exclusion diagnosis [3]; however, since research has progressed, NAFLD has been found to be derived from the potential state of multiple metabolic dysfunctions with complex patho-physiological characteristics, and its high prevalence in the general population makes it common to coex-ist with other liver diseases, which indicates that the exclusion criteria can no longer meet the current requirements for the diagnosis of the disease. Hence, in a recent international expert consensus, “MAFLD” was considered to be a better descriptor of liver dis-ease associated with known metabolic dysfunction [4], and a set of positive diagnostic criteria were quickly released [5] so that MAFLD could be accurately, com-prehensively and easily diagnosed. With the patient population being somewhat different from that of NAFLD, disease characteristics can be better mani-fested through the patient population diagnosed by new diagnostic criteria.
Therefore, this cross-sectional comparative study aims to investigate the prevalence and risk factors for MAFLD based on the new diagnostic criteria to better elucidate the association between MAFLD and mul-tiple metabolic disorders, and provide a more accu-rate reference for the management and prevention of MAFLD.
MethodsStudy populationThis cross-sectional study used data from an urban population in Southwest China who participated in the health examination at the Quality Control Center of Health Examination in Chongqing, Southwest China, which is also known as the Health Management Center of the First Affiliated Hospital of Chongqing Medical University, from January 2015 to September 2018. In China, many organizations and companies may organize health check-ups for their employees and some individu-als would also voluntarily go to medical institutions for regular health examinations to get known about their health condition. Therefore, the population of this study is a sample of an urban population in Southwest China. Our study included 139,170 participants, all of them had undergone comprehensive anthropometric measure-ments and clinical examinations, which included abdom-inal ultrasonography and the collection of fasting blood and urine samples. Repeat examinations of the same per-son were recognized by their unique health examination ID, and only one data set was randomly involved in the study. The exclusion criteria were incomplete data; age younger than 18 years; history of malignancy; history of oophorectomy or hysterectomy; and history of liver surgery or nephrectomy. The study was approved and supervised by The Ethics Committee of The First Affili-ated Hospital of Chongqing Medical University (approval number: 2019-141) and was conducted in accordance with the Principles of the Helsinki Declaration. Require-ment for informed consent was waived because all infor-mation was anonymous and retrospective.
Anthropometric measurements and clinical examinationBlood pressure and anthropometric parameters, includ-ing height, weight and waist circumference, were measured using standardized procedures by trained examiners. Body mass index (BMI) was calculated as fol-lows: BMI (kg/m2) = weight (kg)/height squared (m2).
that age, BMI, waist circumference, ALT, triglycerides, fasting glucose, uric acid and platelet count were associated with MAFLD.
Conclusions: MAFLD is prevalent in China and varies considerably among different age, sex, BMI, and female meno‑pausal status groups. MAFLD is related to metabolic disorders, especially obesity, while metabolic disorders also play important roles in the occurrence of MAFLD in nonobese individuals. MAFLD patients exhibit a high prevalence of MS, dyslipidaemia, hyperuricaemia, and elevated liver enzymes. MAFLD tends to coexist with systemic metabolic disor‑ders, and a deep inner relationship may exist between MAFLD and MS. Metabolic disorders should be considered to improve the management of MAFLD.
Keywords: Metabolic associated fatty liver disease, Nonalcoholic fatty liver disease, Metabolic syndrome, Ultrasonography
Page 3 of 12Chen et al. BMC Gastroenterol (2021) 21:212
Venous blood samples of all participants were collected after at least 8 h of fasting and were analysed by standard laboratory procedures in the laboratory of The First Affil-iated Hospital of Chongqing Medical University, which is certified by the College of American Pathologists (CAP No. 7215494). Abdominal ultrasound was performed using ultrasound scanners (Aplio500, Toshiba Medical Systems, Japan or HD11XE, Philips Medical Systems, USA). All abdominal ultrasonographies were performed and evaluated by experienced ultrasonographers at the Quality Control Center of Health Examination. Because the diagnosis of MAFLD does not involve the assessment of alcohol consumption and hepatitis virus, we did not include the two examinations in our study. Disease his-tories were checked in the health examination results of each participant. All data were recorded in the electronic medical record system of the Quality Control Center of Health Examination in Chongqing.
Diagnosis of MAFLDIn our study, the diagnosis of MAFLD was based on the ultrasonically diagnosed hepatic steatosis and the pres-ence of one of the following three criteria: overweight or obesity (defined as BMI ≥ 23 kg/m2 in Asians), type 2 diabetes mellitus, or metabolic dysregulation. Metabolic dysregulation was defined by the presence of at least two of the following metabolic risk abnormalities: 1) waist circumference ≥ 90/80 cm in Asian men and women; 2) blood pressure ≥ 130/85 mmHg or specific drug treat-ment; 3) plasma triglycerides ≥ 1.70 mmol/L or specific drug treatment; 4) plasma HDL-cholesterol < 1.0 mmol/L for men and < 1.3 mmol/L for women or specific drug treatment; 5) prediabetes (i.e., fasting glucose levels 5.6 to 6.9 mmol/L, or 2-h post-load glucose levels 7.8 to 11.0 mmol or HbA1c 5.7% to 6.4%; 6) plasma high-sen-sitivity C-reactive protein (hs-CRP) level > 2 mg/L; and 7) homeostasis model assessment (HOMA)-insulin resist-ance score ≥ 2.5 [5]. The diagnosis of hepatic steatosis on ultrasound was based on the presence of hepatorenal echo contrast, liver parenchymal brightness, deep attenu-ation, and vascular blurring [6, 7].
DefinitionsBMI groups of underweight (< 18.5 kg/m2), normal (≥ 18.5 kg/m2, < 23.0 kg/m2), overweight (≥ 23.0 kg/m2, < 25.0 kg/m2) and obese (≥ 25.0 kg/m2) were cat-egorized based on the BMI criteria for Asians made by the WHO [8]. Metabolic syndrome (MS) was defined in accordance with the criteria by Joint Statement [9], which was based on the presence of at least 3 of the fol-lowing components: (1) elevated waist circumference (≥ 90 cm for men and ≥ 80 cm for women); (2) elevated triglycerides (≥ 1.70 mmol/L) or drug treatment for
elevated triglycerides; (3) reduced HDL-C (< 1.0 mmol/L for men and < 1.3 mmol/L for women) or drug treat-ment for reduced HDL-C; (4) elevated blood pressure (≥ 130/85 mm Hg) or drug treatment for hyperten-sion; and (5) elevated fasting glucose (≥ 5.6 mmol/L) or drug treatment for elevated glucose. Dyslipidaemia was defined according to the guidelines for the prevention and treatment of dyslipidaemia in Chinese adults [10] as follows: a total cholesterol level of ≥ 5.2 mmol/L; LDL-C level of ≥ 3.4 mmol/L; HDL-C level of < 1 mmol/L; and triglycerides level of ≥ 1.7 mmol/L. Hyperuricaemia was defined as a uric acid level of ≥ 416 μmol/L for men or ≥ 357 μmol/L for women [11]. Menopausal status was defined as premenopausal period (≤ 45 years old), perimenopausal period (45–54 years old) and post-menopausal period (≥ 55 years old) according to the mean menopausal period for the Chinese female popu-lation [12, 13]. Elevated liver enzymes were defined as ALT > 35 IU/L and AST > 40 IU/L [14].
Statistical analysisAll continuous variables were tested for normality and are described by medians (interquartile range) and pro-portions. The Mann–Whitney U test was performed to compare continuous variables due to their nonnormal distribution. For categorical variables, the chi-square test was performed to compare different variables. The specific prevalence of different age, BMI and female menopausal status groups and their 95% confidence intervals (CIs) were calculated. Binary logistic regres-sion analysis was performed to explore the related risk factors for MAFLD. Odds ratios (ORs) and their 95% CIs were finally calculated. Binary logistic regression was performed using RStudio version 4.0.1, and other analyses were performed using SPSS 25. A two-tailed p value < 0.05 was considered statistically significant.
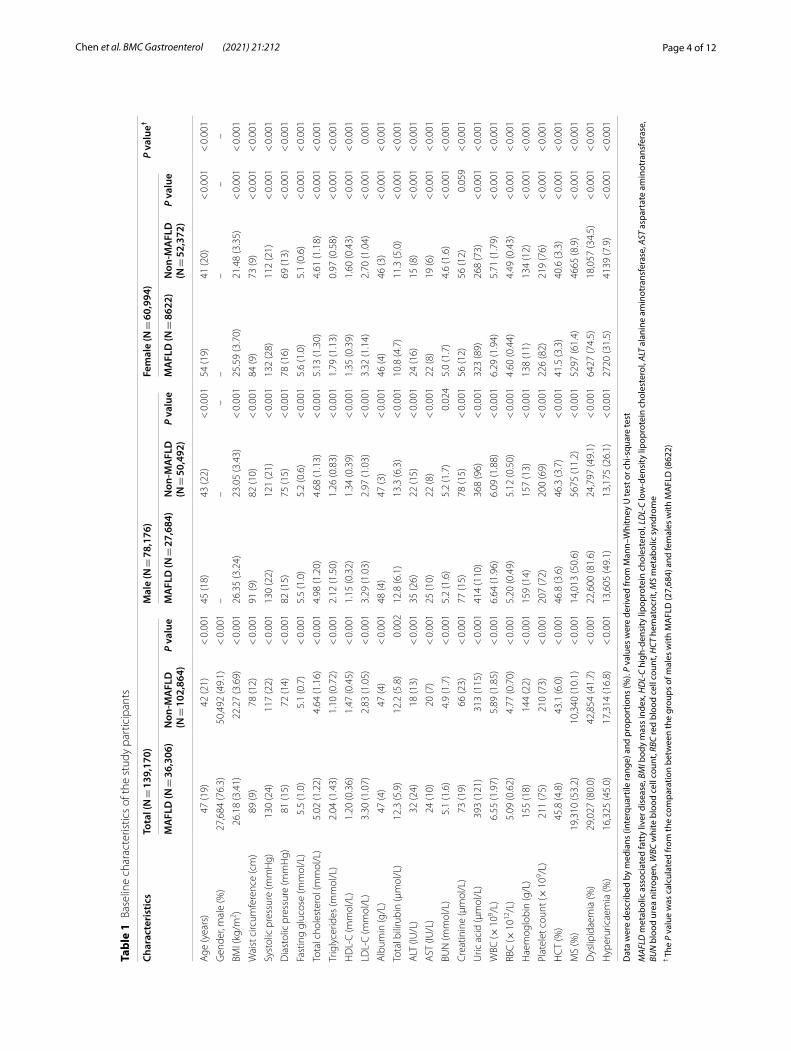
ResultsGeneral data for the participantsOf the 139,170 Chinese adults enrolled in the study, 78,176 subjects (56.2%) were males and 60,994 (43.8%) were females. The baseline characteristics of the study subjects are shown in Table 1. Compared with individu-als without MAFLD, those with MAFLD were older, predominantly male and had higher values of body mass index (BMI), waist circumference, blood pressure, fast-ing glucose, total cholesterol, triglycerides, low-density lipoprotein cholesterol (LDL-C), albumin, total bilirubin, alanine aminotransferase (ALT), aspartate aminotrans-ferase (AST), blood urea nitrogen (BUN), creatinine, uric acid, white blood cell count (WBC), red blood cell count (RBC), haemoglobin, platelet count, and hemato-crit (HCT), and lower value of high-density lipoprotein
Page 4 of 12Chen et al. BMC Gastroenterol (2021) 21:212
Tabl
e 1
Base
line
char
acte
ristic
s of
the
stud
y pa
rtic
ipan
ts
Dat
a w
ere
desc
ribed
by
med
ians
(int
erqu
artil
e ra
nge)
and
pro
port
ions
(%).
P va
lues
wer
e de
rived
from
Man
n–W
hitn
ey U
test
or c
hi-s
quar
e te
st
MAF
LD m
etab
olic
ass
ocia
ted
fatt
y liv
er d
isea
se, B
MI b
ody
mas
s in
dex,
HD
L-C
high
-den
sity
lipo
prot
ein
chol
este
rol,
LDL-
C lo
w-d
ensi
ty li
popr
otei
n ch
oles
tero
l, AL
T al
anin
e am
inot
rans
fera
se, A
ST a
spar
tate
am
inot
rans
fera
se,
BUN
blo
od u
rea
nitr
ogen
, WBC
whi
te b
lood
cel
l cou
nt, R
BC re
d bl
ood
cell
coun
t, H
CT h
emat
ocrit
, MS
met
abol
ic s
yndr
ome
† The
P v
alue
was
cal
cula
ted
from
the
com
para
tion
betw
een
the
grou
ps o
f mal
es w
ith M
AFL
D (2
7,68
4) a
nd fe
mal
es w
ith M
AFL
D (8
622)
Char
acte
rist
ics
Tota
l (N
= 1
39,1
70)
Mal
e (N
= 7
8,17
6)Fe
mal
e (N
= 6
0,99
4)P
valu
e†
MA
FLD
(N =
36,
306)
Non
-MA
FLD
(N
= 1
02,8
64)
P va
lue
MA
FLD
(N =
27,
684)
Non
-MA
FLD
(N
= 5
0,49
2)P
valu
eM
AFL
D (N
= 8
622)
Non
-MA
FLD
(N
= 5
2,37
2)P
valu
e
Age
(yea
rs)
47 (1
9)42
(21)
< 0
.001
45 (1
8)43
(22)
< 0
.001
54 (1
9)41
(20)
< 0
.001
< 0
.001
Gen
der,
mal
e (%
)27
,684
(76.
3)50
,492
(49.
1) <
0.0
01–
––
––
––
BMI (
kg/m
2 )26
.18
(3.4
1)22
.27
(3.6
9) <
0.0
0126
.35
(3.2
4)23
.05
(3.4
3) <
0.0
0125
.59
(3.7
0)21
.48
(3.3
5) <
0.0
01 <
0.0
01
Wai
st c
ircum
fere
nce
(cm
)89
(9)
78 (1
2) <
0.0
0191
(9)
82 (1
0) <
0.0
0184
(9)
73 (9
) <
0.0
01 <
0.0
01
Syst
olic
pre
ssur
e (m
mH
g)13
0 (2
4)11
7 (2
2) <
0.0
0113
0 (2
2)12
1 (2
1) <
0.0
0113
2 (2
8)11
2 (2
1) <
0.0
01 <
0.0
01
Dia
stol
ic p
ress
ure
(mm
Hg)
81 (1
5)72
(14)
< 0
.001
82 (1
5)75
(15)
< 0
.001
78 (1
6)69
(13)
< 0
.001
< 0
.001
Fast
ing
gluc
ose
(mm
ol/L
)5.
5 (1
.0)
5.1
(0.7
) <
0.0
015.
5 (1
.0)
5.2
(0.6
) <
0.0
015.
6 (1
.0)
5.1
(0.6
) <
0.0
01 <
0.0
01
Tota
l cho
lest
erol
(mm
ol/L
)5.
02 (1
.22)
4.64
(1.1
6) <
0.0
014.
98 (1
.20)
4.68
(1.1
3) <
0.0
015.
13 (1
.30)
4.61
(1.1
8) <
0.0
01 <
0.0
01
Trig
lyce
rides
(mm
ol/L
)2.
04 (1
.43)
1.10
(0.7
2) <
0.0
012.
12 (1
.50)
1.26
(0.8
3) <
0.0
011.
79 (1
.13)
0.97
(0.5
8) <
0.0
01 <
0.0
01
HD
L‑C
(mm
ol/L
)1.
20 (0
.36)
1.47
(0.4
5) <
0.0
011.
15 (0
.32)
1.34
(0.3
9) <
0.0
011.
35 (0
.39)
1.60
(0.4
3) <
0.0
01 <
0.0
01
LDL‑
C (m
mol
/L)
3.30
(1.0
7)2.
83 (1
.05)
< 0
.001
3.29
(1.0
3)2.
97 (1
.03)
< 0
.001
3.32
(1.1
4)2.
70 (1
.04)
< 0
.001
0.00
1
Alb
umin
(g/L
)47
(4)
47 (4
) <
0.0
0148
(4)
47 (3
) <
0.0
0146
(4)
46 (3
) <
0.0
01 <
0.0
01
Tota
l bili
rubi
n (μ
mol
/L)
12.3
(5.9
)12
.2 (5
.8)
0.00
212
.8 (6
.1)
13.3
(6.3
) <
0.0
0110
.8 (4
.7)
11.3
(5.0
) <
0.0
01 <
0.0
01
ALT
(IU
/L)
32 (2
4)18
(13)
< 0
.001
35 (2
6)22
(15)
< 0
.001
24 (1
6)15
(8)
< 0
.001
< 0
.001
AST
(IU
/L)
24 (1
0)20
(7)
< 0
.001
25 (1
0)22
(8)
< 0
.001
22 (8
)19
(6)
< 0
.001
< 0
.001
BUN
(mm
ol/L
)5.
1 (1
.6)
4.9
(1.7
) <
0.0
015.
2 (1
.6)
5.2
(1.7
)0.
024
5.0
(1.7
)4.
6 (1
.6)
< 0
.001
< 0
.001
Cre
atin
ine
(μm
ol/L
)73
(19)
66 (2
3) <
0.0
0177
(15)
78 (1
5) <
0.0
0156
(12)
56 (1
2)0.
059
< 0
.001
Uric
aci
d (μ
mol
/L)
393
(121
)31
3 (1
15)
< 0
.001
414
(110
)36
8 (9
6) <
0.0
0132
3 (8
9)26
8 (7
3) <
0.0
01 <
0.0
01
WBC
(× 1
09 /L)
6.55
(1.9
7)5.
89 (1
.85)
< 0
.001
6.64
(1.9
6)6.
09 (1
.88)
< 0
.001
6.29
(1.9
4)5.
71 (1
.79)
< 0
.001
< 0
.001
RBC
(× 1
012/L
)5.
09 (0
.62)
4.77
(0.7
0) <
0.0
015.
20 (0
.49)
5.12
(0.5
0) <
0.0
014.
60 (0
.44)
4.49
(0.4
3) <
0.0
01 <
0.0
01
Hae
mog
lobi
n (g
/L)
155
(18)
144
(22)
< 0
.001
159
(14)
157
(13)
< 0
.001
138
(11)
134
(12)
< 0
.001
< 0
.001
Plat
elet
cou
nt (×
109 /L
)21
1 (7
5)21
0 (7
3) <
0.0
0120
7 (7
2)20
0 (6
9) <
0.0
0122
6 (8
2)21
9 (7
6) <
0.0
01 <
0.0
01
HC
T (%
)45
.8 (4
.8)
43.1
(6.0
) <
0.0
0146
.8 (3
.6)
46.3
(3.7
) <
0.0
0141
.5 (3
.3)
40.6
(3.3
) <
0.0
01 <
0.0
01
MS
(%)
19,3
10 (5
3.2)
10,3
40 (1
0.1)
< 0
.001
14,0
13 (5
0.6)
5675
(11.
2) <
0.0
0152
97 (6
1.4)
4665
(8.9
) <
0.0
01 <
0.0
01
Dys
lipid
aem
ia (%
)29
,027
(80.
0)42
,854
(41.
7) <
0.0
0122
,600
(81.
6)24
,797
(49.
1) <
0.0
0164
27 (7
4.5)
18,0
57 (3
4.5)
< 0
.001
< 0
.001
Hyp
erur
icae
mia
(%)
16,3
25 (4
5.0)
17,3
14 (1
6.8)
< 0
.001
13,6
05 (4
9.1)
13,1
75 (2
6.1)
< 0
.001
2720
(31.
5)41
39 (7
.9)
< 0
.001
< 0
.001
Page 5 of 12Chen et al. BMC Gastroenterol (2021) 21:212
cholesterol (HDL-C) (P < 0.05). Compared with males with MAFLD, females with MAFLD tended to be older and had higher values of systolic pressure, fasting glu-cose, total cholesterol, HDL-C, LDL-C, and platelet count (P < 0.05).
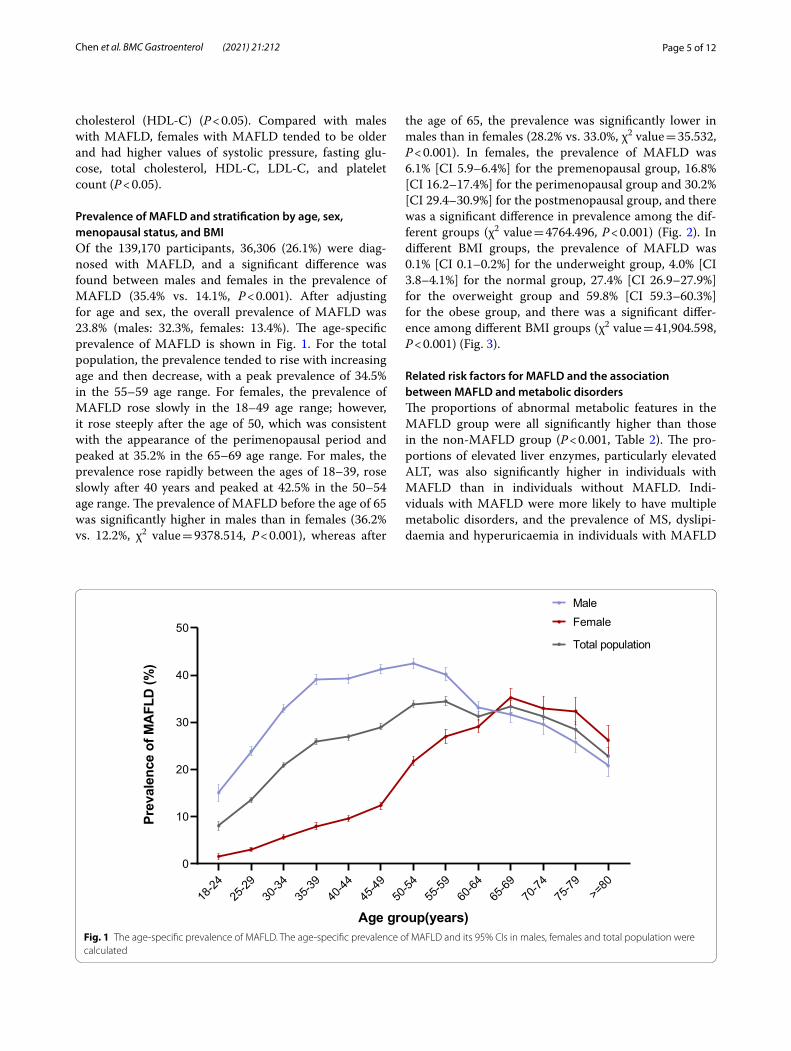
Prevalence of MAFLD and stratification by age, sex, menopausal status, and BMIOf the 139,170 participants, 36,306 (26.1%) were diag-nosed with MAFLD, and a significant difference was found between males and females in the prevalence of MAFLD (35.4% vs. 14.1%, P < 0.001). After adjusting for age and sex, the overall prevalence of MAFLD was 23.8% (males: 32.3%, females: 13.4%). The age-specific prevalence of MAFLD is shown in Fig. 1. For the total population, the prevalence tended to rise with increasing age and then decrease, with a peak prevalence of 34.5% in the 55–59 age range. For females, the prevalence of MAFLD rose slowly in the 18–49 age range; however, it rose steeply after the age of 50, which was consistent with the appearance of the perimenopausal period and peaked at 35.2% in the 65–69 age range. For males, the prevalence rose rapidly between the ages of 18–39, rose slowly after 40 years and peaked at 42.5% in the 50–54 age range. The prevalence of MAFLD before the age of 65 was significantly higher in males than in females (36.2% vs. 12.2%, χ2 value = 9378.514, P < 0.001), whereas after
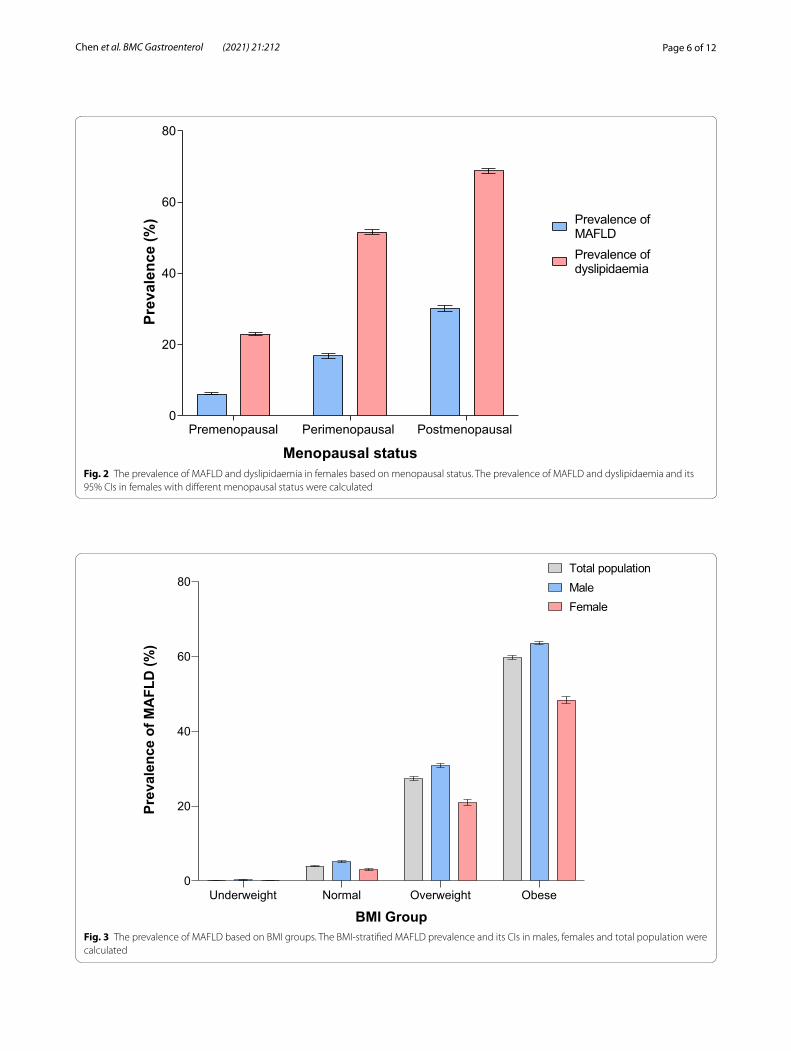
the age of 65, the prevalence was significantly lower in males than in females (28.2% vs. 33.0%, χ2 value = 35.532, P < 0.001). In females, the prevalence of MAFLD was 6.1% [CI 5.9–6.4%] for the premenopausal group, 16.8% [CI 16.2–17.4%] for the perimenopausal group and 30.2% [CI 29.4–30.9%] for the postmenopausal group, and there was a significant difference in prevalence among the dif-ferent groups (χ2 value = 4764.496, P < 0.001) (Fig. 2). In different BMI groups, the prevalence of MAFLD was 0.1% [CI 0.1–0.2%] for the underweight group, 4.0% [CI 3.8–4.1%] for the normal group, 27.4% [CI 26.9–27.9%] for the overweight group and 59.8% [CI 59.3–60.3%] for the obese group, and there was a significant differ-ence among different BMI groups (χ2 value = 41,904.598, P < 0.001) (Fig. 3).
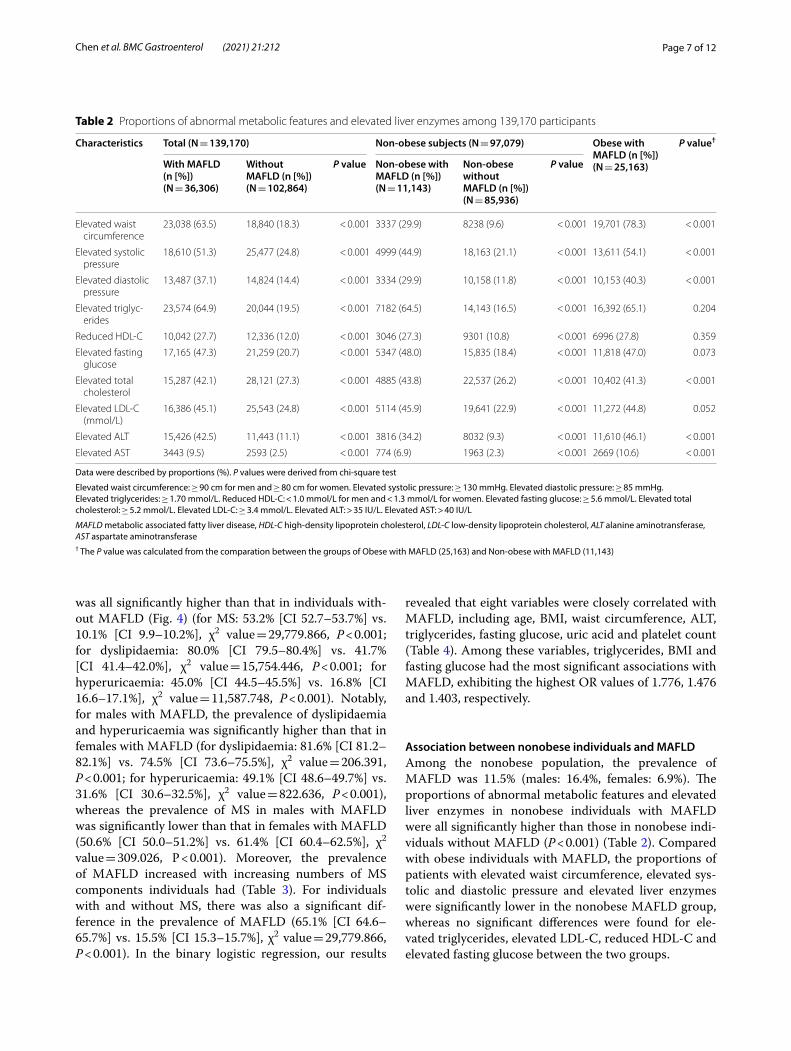
Related risk factors for MAFLD and the association between MAFLD and metabolic disordersThe proportions of abnormal metabolic features in the MAFLD group were all significantly higher than those in the non-MAFLD group (P < 0.001, Table 2). The pro-portions of elevated liver enzymes, particularly elevated ALT, was also significantly higher in individuals with MAFLD than in individuals without MAFLD. Indi-viduals with MAFLD were more likely to have multiple metabolic disorders, and the prevalence of MS, dyslipi-daemia and hyperuricaemia in individuals with MAFLD
18-24
25-29
30-34
35-39
40-44
45-49
50-54
55-59
60-64
65-69
70-74
75-79 >=
800
10
20
30
40
50
Age group(years)
Prev
alen
ceof
MA
FLD
(%)
MaleFemale
Total population
Fig. 1 The age‑specific prevalence of MAFLD. The age‑specific prevalence of MAFLD and its 95% CIs in males, females and total population were calculated
Page 6 of 12Chen et al. BMC Gastroenterol (2021) 21:212
Premenopausal Perimenopausal Postmenopausal 0
20
40
60
80
Menopausal status
Prev
alen
ce(%
)
Prevalence ofdyslipidaemia
Prevalence ofMAFLD
Fig. 2 The prevalence of MAFLD and dyslipidaemia in females based on menopausal status. The prevalence of MAFLD and dyslipidaemia and its 95% CIs in females with different menopausal status were calculated
Underweight Normal Overweight Obese0
20
40
60
80
BMI Group
Prev
alen
ceof
MA
FLD
(%)
MaleFemale
Total population
Fig. 3 The prevalence of MAFLD based on BMI groups. The BMI‑stratified MAFLD prevalence and its CIs in males, females and total population were calculated
Page 7 of 12Chen et al. BMC Gastroenterol (2021) 21:212
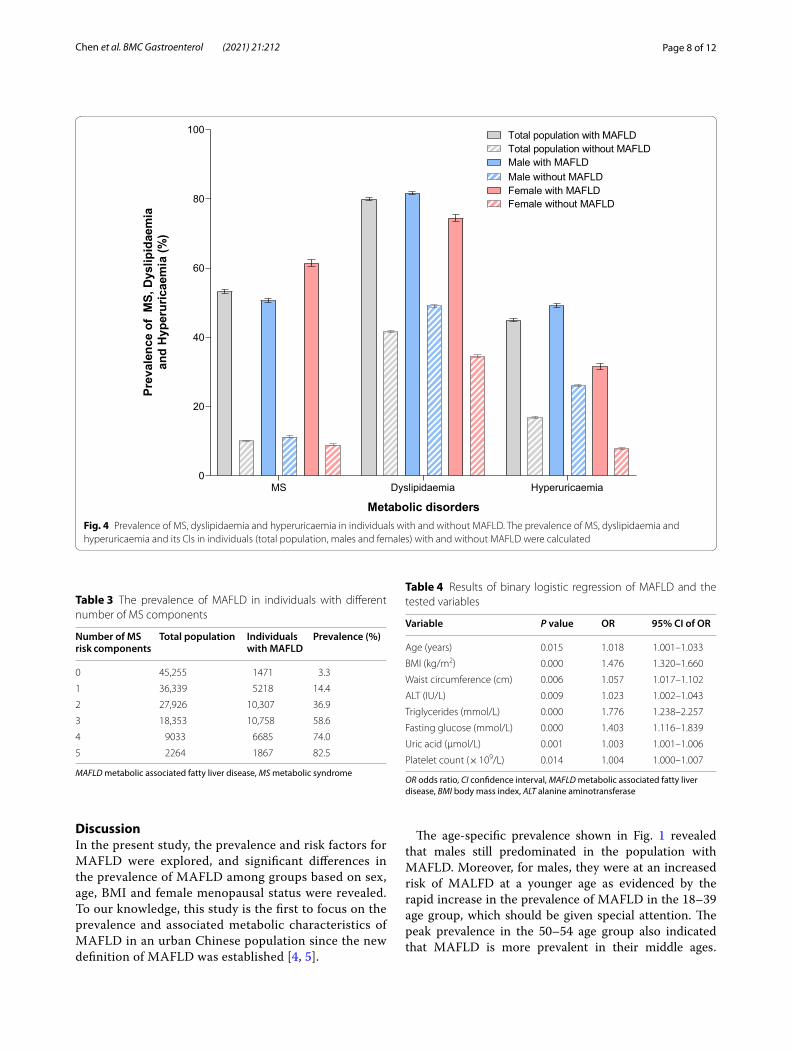
was all significantly higher than that in individuals with-out MAFLD (Fig. 4) (for MS: 53.2% [CI 52.7–53.7%] vs. 10.1% [CI 9.9–10.2%], χ2 value = 29,779.866, P < 0.001; for dyslipidaemia: 80.0% [CI 79.5–80.4%] vs. 41.7% [CI 41.4–42.0%], χ2 value = 15,754.446, P < 0.001; for hyperuricaemia: 45.0% [CI 44.5–45.5%] vs. 16.8% [CI 16.6–17.1%], χ2 value = 11,587.748, P < 0.001). Notably, for males with MAFLD, the prevalence of dyslipidaemia and hyperuricaemia was significantly higher than that in females with MAFLD (for dyslipidaemia: 81.6% [CI 81.2–82.1%] vs. 74.5% [CI 73.6–75.5%], χ2 value = 206.391, P < 0.001; for hyperuricaemia: 49.1% [CI 48.6–49.7%] vs. 31.6% [CI 30.6–32.5%], χ2 value = 822.636, P < 0.001), whereas the prevalence of MS in males with MAFLD was significantly lower than that in females with MAFLD (50.6% [CI 50.0–51.2%] vs. 61.4% [CI 60.4–62.5%], χ2 value = 309.026, P < 0.001). Moreover, the prevalence of MAFLD increased with increasing numbers of MS components individuals had (Table 3). For individuals with and without MS, there was also a significant dif-ference in the prevalence of MAFLD (65.1% [CI 64.6–65.7%] vs. 15.5% [CI 15.3–15.7%], χ2 value = 29,779.866, P < 0.001). In the binary logistic regression, our results
revealed that eight variables were closely correlated with MAFLD, including age, BMI, waist circumference, ALT, triglycerides, fasting glucose, uric acid and platelet count (Table 4). Among these variables, triglycerides, BMI and fasting glucose had the most significant associations with MAFLD, exhibiting the highest OR values of 1.776, 1.476 and 1.403, respectively.
Association between nonobese individuals and MAFLDAmong the nonobese population, the prevalence of MAFLD was 11.5% (males: 16.4%, females: 6.9%). The proportions of abnormal metabolic features and elevated liver enzymes in nonobese individuals with MAFLD were all significantly higher than those in nonobese indi-viduals without MAFLD (P < 0.001) (Table 2). Compared with obese individuals with MAFLD, the proportions of patients with elevated waist circumference, elevated sys-tolic and diastolic pressure and elevated liver enzymes were significantly lower in the nonobese MAFLD group, whereas no significant differences were found for ele-vated triglycerides, elevated LDL-C, reduced HDL-C and elevated fasting glucose between the two groups.
Table 2 Proportions of abnormal metabolic features and elevated liver enzymes among 139,170 participants
Data were described by proportions (%). P values were derived from chi-square test
Elevated waist circumference: ≥ 90 cm for men and ≥ 80 cm for women. Elevated systolic pressure: ≥ 130 mmHg. Elevated diastolic pressure: ≥ 85 mmHg. Elevated triglycerides: ≥ 1.70 mmol/L. Reduced HDL-C: < 1.0 mmol/L for men and < 1.3 mmol/L for women. Elevated fasting glucose: ≥ 5.6 mmol/L. Elevated total cholesterol: ≥ 5.2 mmol/L. Elevated LDL-C: ≥ 3.4 mmol/L. Elevated ALT: > 35 IU/L. Elevated AST: > 40 IU/L
MAFLD metabolic associated fatty liver disease, HDL-C high-density lipoprotein cholesterol, LDL-C low-density lipoprotein cholesterol, ALT alanine aminotransferase, AST aspartate aminotransferase† The P value was calculated from the comparation between the groups of Obese with MAFLD (25,163) and Non-obese with MAFLD (11,143)
Characteristics Total (N = 139,170) Non-obese subjects (N = 97,079) Obese with MAFLD (n [%]) (N = 25,163)
P value†
With MAFLD (n [%]) (N = 36,306)
Without MAFLD (n [%]) (N = 102,864)
P value Non-obese with MAFLD (n [%]) (N = 11,143)
Non-obese without MAFLD (n [%]) (N = 85,936)
P value
Elevated waist circumference
23,038 (63.5) 18,840 (18.3) < 0.001 3337 (29.9) 8238 (9.6) < 0.001 19,701 (78.3) < 0.001
Elevated systolic pressure
18,610 (51.3) 25,477 (24.8) < 0.001 4999 (44.9) 18,163 (21.1) < 0.001 13,611 (54.1) < 0.001
Elevated diastolic pressure
13,487 (37.1) 14,824 (14.4) < 0.001 3334 (29.9) 10,158 (11.8) < 0.001 10,153 (40.3) < 0.001
Elevated triglyc‑erides
23,574 (64.9) 20,044 (19.5) < 0.001 7182 (64.5) 14,143 (16.5) < 0.001 16,392 (65.1) 0.204
Reduced HDL‑C 10,042 (27.7) 12,336 (12.0) < 0.001 3046 (27.3) 9301 (10.8) < 0.001 6996 (27.8) 0.359
Elevated fasting glucose
17,165 (47.3) 21,259 (20.7) < 0.001 5347 (48.0) 15,835 (18.4) < 0.001 11,818 (47.0) 0.073
Elevated total cholesterol
15,287 (42.1) 28,121 (27.3) < 0.001 4885 (43.8) 22,537 (26.2) < 0.001 10,402 (41.3) < 0.001
Elevated LDL‑C (mmol/L)
16,386 (45.1) 25,543 (24.8) < 0.001 5114 (45.9) 19,641 (22.9) < 0.001 11,272 (44.8) 0.052
Elevated ALT 15,426 (42.5) 11,443 (11.1) < 0.001 3816 (34.2) 8032 (9.3) < 0.001 11,610 (46.1) < 0.001
Elevated AST 3443 (9.5) 2593 (2.5) < 0.001 774 (6.9) 1963 (2.3) < 0.001 2669 (10.6) < 0.001
Page 8 of 12Chen et al. BMC Gastroenterol (2021) 21:212
DiscussionIn the present study, the prevalence and risk factors for MAFLD were explored, and significant differences in the prevalence of MAFLD among groups based on sex, age, BMI and female menopausal status were revealed. To our knowledge, this study is the first to focus on the prevalence and associated metabolic characteristics of MAFLD in an urban Chinese population since the new definition of MAFLD was established [4, 5].
The age-specific prevalence shown in Fig. 1 revealed that males still predominated in the population with MAFLD. Moreover, for males, they were at an increased risk of MALFD at a younger age as evidenced by the rapid increase in the prevalence of MAFLD in the 18–39 age group, which should be given special attention. The peak prevalence in the 50–54 age group also indicated that MAFLD is more prevalent in their middle ages.
MS Dyslipidaemia Hyperuricaemia0
20
40
60
80
100
Metabolic disorders
Prev
alen
ceof
MS,
Dys
lipid
aem
iaan
dH
yper
uric
aem
ia(%
)
Total population with MAFLDTotal population without MAFLDMale with MAFLDMale without MAFLDFemale with MAFLDFemale without MAFLD
Fig. 4 Prevalence of MS, dyslipidaemia and hyperuricaemia in individuals with and without MAFLD. The prevalence of MS, dyslipidaemia and hyperuricaemia and its CIs in individuals (total population, males and females) with and without MAFLD were calculated
Table 3 The prevalence of MAFLD in individuals with different number of MS components
MAFLD metabolic associated fatty liver disease, MS metabolic syndrome
Number of MS risk components
Total population Individuals with MAFLD
Prevalence (%)
0 45,255 1471 3.3
1 36,339 5218 14.4
2 27,926 10,307 36.9
3 18,353 10,758 58.6
4 9033 6685 74.0
5 2264 1867 82.5
Table 4 Results of binary logistic regression of MAFLD and the tested variables
OR odds ratio, CI confidence interval, MAFLD metabolic associated fatty liver disease, BMI body mass index, ALT alanine aminotransferase
Variable P value OR 95% CI of OR
Age (years) 0.015 1.018 1.001–1.033
BMI (kg/m2) 0.000 1.476 1.320–1.660
Waist circumference (cm) 0.006 1.057 1.017–1.102
ALT (IU/L) 0.009 1.023 1.002–1.043
Triglycerides (mmol/L) 0.000 1.776 1.238–2.257
Fasting glucose (mmol/L) 0.000 1.403 1.116–1.839
Uric acid (μmol/L) 0.001 1.003 1.001–1.006
Platelet count (× 109/L) 0.014 1.004 1.000–1.007
Page 9 of 12Chen et al. BMC Gastroenterol (2021) 21:212
We observed that older men had a lower prevalence of MAFLD than middle-aged men. Possible reasons for this result might include the following: some individuals may die of other diseases at older ages as fatty liver can sig-nificantly increase overall mortality [15], and thus these individuals are not counted as part of the MAFLD pop-ulation; compared with older men who typically retire, middle-aged men who are at the peak of their careers may experience more pressure and engage in social behaviour that may lead to unhealthy lifestyles, which can increase their risk of having metabolic disorders. In females, the trend of prevalence differed from males. We observed that the prevalence of males rose rapidly during younger ages, rose slowly in their middle ages and then declined. While for females, the prevalence rose slowly during younger ages and then rose rapidly after the age of 45, which was consistent with the emergence of the perimenopausal period. Moreover, between the ages of 45 and 69, the prevalence in males showed a downward trend, whereas the prevalence in women still rose rapidly. These trends differences between sexes suggested that there might be a certain correlation between MAFLD and female menopausal status. Previous studies have found that a decrease in oestrogen in perimenopausal and post-menopausal women can lead to fat redistribution and thus cause metabolic disorders, including dyslipidaemia and glucose intolerance [16]. Our study also found that the prevalence of dyslipidaemia in females increased from the premenopausal period to the perimenopausal period and then to the postmenopausal period, which paralleled the rising prevalence of MAFLD in females in the three menopausal status groups (Fig. 2). This result indicates that the increase in MAFLD prevalence in women may be related to dyslipidaemia and metabolic disorders caused by a decline in oestrogen levels. Stud-ies have also found that oestrogen might have favourable effects on lipid metabolism in the liver [17], which might be a protective factor against fatty liver in females [18]. Therefore, in combination with our findings and previous conclusions, oestrogen may also be a protective factor for females with MAFLD, and low oestrogen levels during the perimenopausal and postmenopausal periods may be an important risk factor for MAFLD in females.
Previous studies have found that the presence of NAFLD is closely correlated with components of MS, such as obesity, insulin resistance, hypertension and dys-lipidaemia, and is considered to be the liver manifestation of MS [19]. Our study also found that after stratification by BMI, the prevalence of MAFLD increased sharply with increasing BMI, reaching 59.8% in obese individu-als (Fig. 3). In the binary logistic regression analysis (Table 4), BMI and waist circumference were also signifi-cantly associated with MAFLD, indicating that obesity is
closely associated with MAFLD and that obesity man-agement should be emphasized, as weight loss has been proven to reduce steatosis [20].
In individuals with MAFLD, the proportions of abnor-mal metabolic features were all significantly higher than those in individuals without MAFLD (Table 2), confirm-ing that MAFLD is closely associated with MS com-ponents, including abdominal obesity, hypertension, dyslipidaemia, and dysglycaemia. Among them, in addi-tion to elevated waist circumference, the most signifi-cant difference was found in elevated triglycerides, and triglycerides were also shown to be significantly associ-ated with MAFLD in the logistic regression (Table 4), with the highest OR value of 1.776, which suggests that elevated triglycerides may be an important risk factor for MAFLD. Moreover, the difference in the proportion of subjects with elevated fasting glucose was also highly sig-nificant, and fasting glucose was also significantly associ-ated with MAFLD in the logistic regression with an OR value of 1.403, which is consistent with a previous study that showed a correlation between fatty liver and dyslipi-daemia and dysglycaemia [21], indicating that elevated fasting glucose may also be an important risk factor for MAFLD. Previous studies have shown that NAFLD is not only closely correlated with cardiovascular and renal diseases associated with MS but also precedes the pres-entation of metabolic derangements [22], while a recent article found that compared with NAFLD, MAFLD can better identify patients with more metabolic disorders and a higher risk of disease progression [23]. In our study, we found a high prevalence of metabolic abnormalities (Table 2) and MS (Fig. 4) in patients with MAFLD. Mean-while, individuals with more MS risk factors had a higher prevalence of MAFLD (Table 3), and patients with MS also had a higher prevalence of MAFLD than those with-out MS. These findings suggested that MAFLD is prone to coexist with systemic metabolic disorders, and a deep inner relationship between MAFLD and MS may exist in which the two diseases have a great influence and inter-action on each other. Notably, we noticed that the prev-alence of MS in females with MAFLD was significantly higher than that in males with MAFLD (Fig. 4), indicat-ing that among patients with MAFLD, females may be more susceptible to MS than males, which warrants fur-ther investigation.
It was shown in our study that the prevalence of dyslip-idaemia and hyperuricaemia was significantly higher in individuals with MAFLD than in those without MAFLD (Fig. 4). Dyslipidaemia is a well-known risk factor for NAFLD [3], and this can also be reflected in the sharp rise in the prevalence of MAFLD in perimenopausal and postmenopausal women in our study, which might be related to dyslipidaemia due to oestrogen deficiency
Page 10 of 12Chen et al. BMC Gastroenterol (2021) 21:212
(Fig. 2), indicating that dyslipidaemia may also be a risk factor for MAFLD. In the binary logistic regression anal-ysis, uric acid was shown to be significantly correlated with MAFLD. Previous cross-sectional and prospective studies have found that elevated serum uric acid could independently predict an increased risk of NAFLD, even serum uric acid levels within the normal range were closely correlated with the presence of NAFLD indepen-dently [24–26]. Hence, combining the findings in our study with previous studies, serum uric acid might be considered an independent risk factor for MAFLD.
The present study revealed that individuals with MAFLD are more likely to have elevated liver enzymes, particularly elevated ALT, than those without MAFLD (Table 2), which indicates a higher proportion of abnor-mal liver function in individuals with MAFLD. Moreo-ver, Table 4 shows that ALT was significantly correlated with MAFLD, and previous studies have shown that elevated ALT is associated with the progression of NAFLD into steatohepatitis and even liver fibrosis [27], indicating that elevated ALT might also have important clinical significance for MAFLD. Platelets are elevated during inflammation, and previous studies have found a linear correlation between platelet count and the sever-ity of liver fibrosis in individuals with NAFLD [28]. In our study, we also found that platelet count was signifi-cantly correlated with MAFLD (Table 4), indicating that platelet count and ALT levels may be used as a reference indicator of MAFLD development and the resulting liver fibrosis. As some blood biomarkers, such as the NAFLD fibrosis score (NFS), have been used to assess the degree of liver fibrosis in NAFLD patients [29], more studies are also needed to build mathematical models on fibro-sis biomarkers and explore a noninvasive fibrosis scoring system for MAFLD patients.
Although the occurrence of NAFLD is closely corre-lated with obesity, nonobese individuals may also suf-fer from NAFLD, particularly in the Asia–Pacific region [30]. In our study, the proportions of abnormal metabolic features in nonobese individuals with MAFLD were all significantly higher than those in nonobese individuals without MAFLD (Table 2), suggesting that metabolic dis-orders also play an important role in the occurrence of MAFLD in nonobese individuals. Meanwhile, between obese and nonobese MAFLD patients, the proportions of patients with elevated blood pressure and elevated liver enzymes were significantly higher in obese MAFLD patients, while the relationship between obesity and ele-vated liver enzymes, potential liver function impairment, and elevated blood pressure has also been described in previous articles [31, 32], suggesting that obese patients may have an increased risk of cardiovascular events and liver function impairment; however, no significant
difference was found in the proportions of patients with abnormal blood lipids and elevated fasting glucose between the obese and nonobese MAFLD groups. These results indicate that even in nonobese MAFLD patients, there were already metabolic abnormalities in blood lipids and blood glucose levels that were comparable to those in obese MAFLD patients, which needs to be given sufficient attention.
Our study also has certain limitations. First, being a cross-sectional study, the natural course of MAFLD and causal relationships cannot be determined. Our study included a large sample size with a wide range of clini-cal data, making it possible to adjust for underlying con-founding factors. Second, the diagnosis of MAFLD was based on ultrasonography, which might be partially insensitive to mild hepatic steatosis; however, ultra-sonography has been widely used in epidemiological investigations of fatty liver because it is safe, noninva-sive, and widely available; has acceptable sensitivity and specificity in the detection of hepatic steatosis [33]; and is also recommended as the first-line imaging method by the Association for the Study of the Liver (APASL) in the clinical guidelines for MAFLD [34]. Using ultrasound to screen for MAFLD might underestimate the preva-lence of MAFLD; however, the possible underestimated value in our study has already shown the heavy burden of MAFLD in China, indicating that MAFLD in China should be given more attention. Third, certain selection bias may exist because the population who participated in the health examinations included in our study tended to be more concerned about their health. Fourth, some information was not available from the current health examination data, such as detailed medication history of participants and data on hepatitis virus and alcohol consumption. Further studies with subgroup analyses on viral hepatitis and alcohol consumption are needed. Last, because menopausal history was difficult to obtain in the population undergoing health examination, we artificially categorized menopausal status by age based on relevant research and the mean menopausal age of women, which might harbour information bias due to misclassification.
ConclusionsOur study revealed a high prevalence of MAFLD within an urban Chinese population. The prevalence of MAFLD varies considerably between different groups based on sex, age, BMI and female menopausal status. An increased prevalence was found to be associated with obesity and multiple metabolic disorders, and individuals with MAFLD had a high prevalence of MS, dyslipidae-mia, and hyperuricaemia. MAFLD tends to coexist with systemic metabolic disorders, the presence of MAFLD and MS interact with each other, and they may have a
Page 11 of 12Chen et al. BMC Gastroenterol (2021) 21:212
deep influence on each other. Moreover, nonobese indi-viduals also suffer from MAFLD, which was also found to be closely correlated with metabolic disorders. We also confirmed the high proportion of elevated ALT in individuals with MAFLD. Multiple metabolic disorders, especially obesity, should be given more attention to prevent and better manage MAFLD. More research is needed to determine the potential mechanisms under-lying the occurrence of MAFLD, and to better under-stand the relationship and causality between MAFLD and multiple metabolic disorders, which would provide crucial implications for the prevention and treatment of MAFLD.
AbbreviationsMAFLD: Metabolic associated fatty liver disease; NAFLD: Nonalcoholic fatty liver disease; MS: Metabolic syndrome; BMI: Body mass index; HDL‑C: High‑density lipoprotein cholesterol; LDL‑C: Low‑density lipoprotein cholesterol; ALT: Alanine aminotransferase; AST: Aspartate aminotransferase; BUN: Blood urea nitrogen; WBC: White blood cell count; RBC: Red blood cell count; HCT: Hematokrit; OR: Odds ratio; CI: Confidence interval; NFS: NAFLD fibrosis score.
AcknowledgementsThis study was supported through provision of data by The Quality Control Center of Health Examination in Chongqing, Chongqing Medical University, China. We thank Dr. Li‑ping Liu and Dr. Bo Tu for their help in data recognition and classification regarding abdominal ultrasound reports. There is no funding for this research.
Authors’ contributionsStudy concept and design, LK and YC; methodology, HL, XL1 and XL2; investi‑gation, SL and ZX; data acquisition, ST and JW1; data analysis, ZL, JX and JW2; visualization, CM; drafting of the manuscript, YC; review and editing, LR, LK and KW. All authors read and approved the final manuscript.
FundingThere is no funding for this research.
Availability of data and materialsThe datasets analysed during the current study are not publicly available because all data were recorded in the electronic medical record system of the Quality Control Center of Health Examination in Chongqing. However, they are available from the corresponding author on reasonable request.
Declarations
Ethics approval and consent to participateAll procedures in studies involving human participants were performed in accordance with the ethical standards of the institutional research committee (The Ethics Committee of the First Affiliated Hospital of Chongqing Medical University, approval number: 2019‑141) and with the 1964 Helsinki Declara‑tion and its later amendments or comparable ethical standards. The informed consent was waived because the information of all the participants was anonymous and retrospective.
Consent for publicationNot applicable.
Competing interestsThe authors declare that they have no competing interests.
Author details1 Department of Endocrine and Breast Surgery, The First Affiliated Hospital of Chongqing Medical University, Chongqing 400016, China. 2 Department
of Thyroid and Breast Surgery, Affiliated Hospital of North Sichuan Medical College, Nanchong 637000, Sichuan, China. 3 The Health Management Center of the First Affiliated Hospital of Chongqing Medical University, Chongqing, China.
Received: 17 January 2021 Accepted: 20 April 2021
References 1. Younossi Z, Anstee QM, Marietti M, Hardy T, Henry L, Eslam M, George J,
Bugianesi E. Global burden of NAFLD and NASH: trends, predictions, risk factors and prevention. Nat Rev Gastroenterol Hepatol. 2018;15(1):11–20.
2. Matteoni CA, Younossi ZM, Gramlich T, Boparai N, Liu YC, McCullough AJ. Nonalcoholic fatty liver disease: a spectrum of clinical and pathological severity. Gastroenterology. 1999;116(6):1413–9.
3. Chalasani N, Younossi Z, Lavine JE, Charlton M, Cusi K, Rinella M, Harrison SA, Brunt EM, Sanyal AJ. The diagnosis and management of nonalcoholic fatty liver disease: practice guidance from the American Association for the Study of Liver Diseases. Hepatology. 2018;67(1):328–57.
4. Eslam M, Sanyal AJ, George J. International consensus P: MAFLD: a consensus‑driven proposed nomenclature for metabolic associated fatty liver disease. Gastroenterology. 2020;158(7):1999e1991‑2014e1991.
5. Eslam M, Newsome PN, Sarin SK, Anstee QM, Targher G, Romero‑Gomez M, Zelber‑Sagi S, Wai‑Sun Wong V, Dufour JF, Schattenberg JM, et al. A new definition for metabolic dysfunction‑associated fatty liver disease: an international expert consensus statement. J Hepatol. 2020;73(1):202–9.
6. Needleman L, Kurtz AB, Rifkin MD, Cooper HS, Pasto ME, Goldberg BB. Sonography of diffuse benign liver disease: accuracy of pattern recogni‑tion and grading. AJR Am J Roentgenol. 1986;146(5):1011–5.
7. Kojima S, Watanabe N, Numata M, Ogawa T, Matsuzaki S. Increase in the prevalence of fatty liver in Japan over the past 12 years: analysis of clinical background. J Gastroenterol. 2003;38(10):954–61.
8. World Health Organization. Regional Office for the Western, Pacific. The Asia‑Pacific perspective : redefining obesity and its treatment. https:// apps. who. int/ iris/ handle/ 10665/ 206936. Accessed 20 May 2020. Sydney : Health Communications Australia; 2000.
9. Alberti KG, Eckel RH, Grundy SM, Zimmet PZ, Cleeman JI, Donato KA, Fruchart JC, James WP, Loria CM, Smith SC Jr, et al. Harmonizing the metabolic syndrome: a joint interim statement of the International Dia‑betes Federation Task Force on Epidemiology and Prevention; National Heart, Lung, and Blood Institute; American Heart Association; World Heart Federation; International Atherosclerosis Society; and International Association for the Study of Obesity. Circulation. 2009;120(16):1640–5.
10. The Joint Committee on The Revision of Guidelines for the Prevention and Treatment of Dyslipidemia in Chines Adults. The guidelines for the prevention and treatment of dyslipidemia in Chinese Adults (2016 Revi‑sion). http:// www. china circu lation. org/ Magaz ine/ Show/ 76944. Chin Circ J. 2016;31(10):937–50; (in Chinese).
11. Fang J, Alderman MH. Serum uric acid and cardiovascular mortality the NHANES I epidemiologic follow‑up study, 1971–1992. National Health and Nutrition Examination Survey. JAMA. 2000;283(18):2404–10.
12. Collaborative Group on Hormonal Factors in Breast C: Menarche, menopause, and breast cancer risk: individual participant meta‑analysis, including 118964 women with breast cancer from 117 epidemiological studies. Lancet Oncol. 2012;13(11):1141–51.
13. Yang L, Li L, Millwood IY, Lewington S, Guo Y, Sherliker P, Peters SA, Bian Z, Wu X, Yu M, et al. Adiposity in relation to age at menarche and other reproductive factors among 300 000 Chinese women: findings from China Kadoorie Biobank study. Int J Epidemiol. 2017;46(2):502–12.
14. Chalasani N, Aljadhey H, Kesterson J, Murray MD, Hall SD. Patients with elevated liver enzymes are not at higher risk for statin hepatotoxicity. Gastroenterology. 2004;126(5):1287–92.
15. Simon TG, Roelstraete B, Khalili H, Hagstrom H, Ludvigsson JF. Mortality in biopsy‑confirmed nonalcoholic fatty liver disease: results from a nation‑wide cohort. Gut. 2020;6:66.
16. Suzuki A, Abdelmalek MF. Nonalcoholic fatty liver disease in women. Womens Health. 2009;5(2):191–203.
17. Shen L, Fan JG, Shao Y, Zeng MD, Wang JR, Luo GH, Li JQ, Chen SY. Prevalence of nonalcoholic fatty liver among administrative
Page 12 of 12Chen et al. BMC Gastroenterol (2021) 21:212
• fast, convenient online submission
•
thorough peer review by experienced researchers in your field
• rapid publication on acceptance
• support for research data, including large and complex data types
•
gold Open Access which fosters wider collaboration and increased citations
maximum visibility for your research: over 100M website views per year •
At BMC, research is always in progress.
Learn more biomedcentral.com/submissions
Ready to submit your researchReady to submit your research ? Choose BMC and benefit from: ? Choose BMC and benefit from:
officers in Shanghai: an epidemiological survey. World J Gastroenterol. 2003;9(5):1106–10.
18. Gutierrez‑Grobe Y, Ponciano‑Rodriguez G, Ramos MH, Uribe M, Mendez‑Sanchez N. Prevalence of non alcoholic fatty liver disease in premeno‑pausal, posmenopausal and polycystic ovary syndrome women. The role of estrogens. Ann Hepatol. 2010;9(4):402–9.
19. Grundy SM, Cleeman JI, Daniels SR, Donato KA, Eckel RH, Franklin BA, Gordon DJ, Krauss RM, Savage PJ, Smith SC Jr, et al. Diagnosis and man‑agement of the metabolic syndrome: an American Heart Association/National Heart, Lung, and Blood Institute scientific statement: executive summary. Crit Pathw Cardiol. 2005;4(4):198–203.
20. Ueno T, Sugawara H, Sujaku K, Hashimoto O, Tsuji R, Tamaki S, Torimura T, Inuzuka S, Sata M, Tanikawa K. Therapeutic effects of restricted diet and exercise in obese patients with fatty liver. J Hepatol. 1997;27(1):103–7.
21. Speliotes EK, Massaro JM, Hoffmann U, Vasan RS, Meigs JB, Sahani DV, Hirschhorn JN, O’Donnell CJ, Fox CS. Fatty liver is associated with dys‑lipidemia and dysglycemia independent of visceral fat: the Framingham Heart Study. Hepatology. 2010;51(6):1979–87.
22. Ghouri N, Preiss D, Sattar N. Liver enzymes, nonalcoholic fatty liver dis‑ease, and incident cardiovascular disease: a narrative review and clinical perspective of prospective data. Hepatology. 2010;52(3):1156–61.
23. Lin S, Huang J, Wang M, Kumar R, Liu Y, Liu S, Wu Y, Wang X, Zhu Y. Com‑parison of MAFLD and NAFLD diagnostic criteria in real world. Liver Int. 2020;40(9):2082–9.
24. Lee JW, Cho YK, Ryan M, Kim H, Lee SW, Chang E, Joo KJ, Kim JT, Kim BS, Sung KC. Serum uric Acid as a predictor for the development of nonalcoholic Fatty liver disease in apparently healthy subjects: a 5‑year retrospective cohort study. Gut Liver. 2010;4(3):378–83.
25. Xu C, Yu C, Xu L, Miao M, Li Y. High serum uric acid increases the risk for nonalcoholic Fatty liver disease: a prospective observational study. PLoS ONE. 2010;5(7):e11578.
26. Hwang IC, Suh SY, Suh AR, Ahn HY. The relationship between normal serum uric acid and nonalcoholic fatty liver disease. J Korean Med Sci. 2011;26(3):386–91.
27. Ratziu V, Giral P, Charlotte F, Bruckert E, Thibault V, Theodorou I, Khalil L, Turpin G, Opolon P, Poynard T. Liver fibrosis in overweight patients. Gastroenterology. 2000;118(6):1117–23.
28. Yoneda M, Fujii H, Sumida Y, Hyogo H, Itoh Y, Ono M, Eguchi Y, Suzuki Y, Aoki N, Kanemasa K, et al. Platelet count for predicting fibrosis in nonal‑coholic fatty liver disease. J Gastroenterol. 2011;46(11):1300–6.
29. Xiao G, Zhu S, Xiao X, Yan L, Yang J, Wu G. Comparison of laboratory tests, ultrasound, or magnetic resonance elastography to detect fibrosis in patients with nonalcoholic fatty liver disease: A meta‑analysis. Hepatol‑ogy. 2017;66(5):1486–501.
30. Xu C, Yu C, Ma H, Xu L, Miao M, Li Y. Prevalence and risk factors for the development of nonalcoholic fatty liver disease in a nonobese Chinese population: the Zhejiang Zhenhai Study. Am J Gastroenterol. 2013;108(8):1299–304.
31. Lam GM, Mobarhan S. Central obesity and elevated liver enzymes. Nutr Rev. 2004;62(10):394–9.
32. Narkiewicz K. Diagnosis and management of hypertension in obesity. Obes Rev. 2006;7(2):155–62.
33. Sanyal AJ, American Gastroenterological A. AGA technical review on nonalcoholic fatty liver disease. Gastroenterology. 2002;123(5):1705–25.
34. Eslam M, Sarin SK, Wong VW, Fan JG, Kawaguchi T, Ahn SH, Zheng MH, Shiha G, Yilmaz Y, Gani R, et al. The Asian Pacific Association for the Study of the Liver clinical practice guidelines for the diagnosis and manage‑ment of metabolic associated fatty liver disease. Hepatol Int. 2020;5:66.
Publisher’s NoteSpringer Nature remains neutral with regard to jurisdictional claims in pub‑lished maps and institutional affiliations.