Embed Size (px)
Citation preview
prevalence of generalized & abdominal obesity in urban & rural india- the icmr-indiab study (phase-i) [icmr-indiab-3]
rajendra pradeepa1, ranjit mohan anjana1, shashank r. Joshi2, anil bhansali3, mohan deepa1, prashant p. Joshi4, Vinay K. dhandania5, sri Venkata madhu6, paturi Vishnupriya rao7, Loganathan Geetha1, radhakrishnan subashini1, ranjit Unnikrishnan1, deepak Kumar shukla8, Tanvir Kaur8, Viswanathan mohan1 & ashok Kumar das9, for the icmr-indiab collaborative study Group
1Department of Epidemiology & Diabetology, Madras Diabetes Research Foundation & Dr Mohan’s Diabetes Specialities Centre, Chennai, 2Department of Endocrinology, Lilavati Hospital, Mumbai, 3Department of Endocrinology, Postgraduate Institute of Medical Education & Research, Chandigarh, 4Department of Medicine, Indira Gandhi Government Medical College, Nagpur, 5Department of Diabetology, Diabetes Care Center, Ranchi, 6Department of Medicine, University College of Medical Sciences & GTB Hospital, Delhi, 7Department of Endocrinology & Metabolism, Nizam’s Institute of Medical Sciences, Hyderabad, 8Division of Non Communicable Diseases, Indian Council of Medical Research, New Delhi & 9Department of Endocrinology, Jawaharlal Institute of Postgraduate Medical Education & Research, Puducherry, India
received October 9, 2013
Background & objectives: Overweight and obesity are rapidly increasing in countries like India. This study was aimed at determining the prevalence of generalized, abdominal and combined obesity in urban and rural India.Methods: Phase I of the ICMR-INDIAB study was conducted in a representative population of three states [Tamil Nadu (TN), Maharashtra (MH) and Jharkhand (JH)] and one Union Territory (UT)[Chandigarh (CH)] of India. A stratified multi-stage sampling design was adopted and individuals ≥20 yr of age were included. WHO Asia Pacific guidelines were used to define overweight [body mass index (BMI) ≥23 kg/m2 but <25 kg/m2], generalized obesity (GO, BMI≥25kg/m2), abdominal obesity (AO, waist circumference ≥90 cm for men and ≥80cm for women) and combined obesity (CO, GO plus AO). Of the 14,277 participants, 13,800 subjects (response rate, 96.7%) were included for the analysis (urban: n=4,063; rural: n=9737).Results: The prevalence of GO was 24.6, 16.6, 11.8 and 31.3 per cent among residents of TN, MH, JH and CH, while the prevalence of AO was 26.6, 18.7, 16.9 and 36.1 per cent, respectively. CO was present in 19.3, 13.0, 9.8 and 26.6 per cent of the TN, MH, JH and CH population. The prevalence of GO, AO and CO were significantly higher among urban residents compared to rural residents in all the four regions studied. The prevalence of overweight was 15.2, 11.3, 7.8 and 15.9 per cent among residents of TN, MH, JH and CH, respectively. Multiple logistic regression analysis showed that female gender, hypertension, diabetes, higher socio-economic status, physical inactivity and urban residence were significantly associated with GO, AO and CO in all the four regions studied. Age was significantly associated with AO and CO, but not with GO.Interpretation & conclusions: Prevalence of AO as well as of GO were high in India. Extrapolated to the whole country, 135, 153 and 107 million individuals will have GO, AO and CO, respectively. However, these figures have been estimated from three States and one UT of India and the results may be viewed in this light.
Key words abdominal obesity - combined obesity - generalized obesity - indiab - india
indian J med res 142, august 2015, pp 139-150dOi:10.4103/0971-5916.164234
139
according to the World Health Organization (WHO), obesity is one of the most common, yet among the most neglected, public health problems in both developed and developing countries1. according to the WHO World Health statistics report 2012, globally one in six adults is obese and nearly 2.8 million individuals die each year due to overweight or obesity2. due to the increased risk of morbidity and mortality, obesity is now being recognized as a disease in its own right. additionally, obesity is strongly associated with other metabolic disorders including diabetes, hypertension, dyslipidaemia, cardiovascular disease and even some cancers. The risk for these disorders appears to start3 from a body mass index (bmi) of about 21 kg/m2. Obesity is generally classified as generalized obesity (GO) and abdominal obesity (aO). individuals with obesity have higher rates of mortality and morbidity compared to non obese individuals4,5.
india, with 1.2 billion people is the second most populous country in the world and is currently experiencing rapid epidemiological transition. Undernutrition due to poverty which dominated in the past, is being rapidly replaced by obesity associated with affluence6. industrialization and urbanization also contribute to increased prevalence of obesity. studies from different parts of india have provided evidence of the rising prevalence of obesity6-9. However, most reports have been region specific (mostly from urban areas). Further, different studies have used different methodologies, definitions and cut-off points for defining obesity, making comparisons difficult. To date, there has been no nationally representative study on the prevalence of obesity in india. Here we present the prevalence of generalized and abdominal obesity in urban and rural india based on phase i of the indian council of medical research - india diabetes (icmr-indiab) study, in which representative samples were obtained from three states and one Union Territory (UT) in different regions of india covering a population of 213 million.
Material & Methods
The icmr-indiab study is an ongoing cross-sectional national study on the prevalence of diabetes and related disorders such as obesity and hypertension. Funded by the icmr and the department of Health research (dHr), Government of india, the study plans to sample all the 28 states (now 29 states after the state of andhra pradesh was divided into Telangana and andhra pradesh) in india, 2 UTs namely chandigarh and puducherry and the national capital Territory
(ncT) of delhi. The detailed methodology of the study has been published separately10. Briefly, this is a door-to-door survey of individuals aged 20 yr and above. due to the complex logistics involved, the study is being done in phases. phase i of the icmr-indiab study was conducted from november 2008 to april 2010, in three states randomly selected to represent the south (Tamil nadu-Tn; population- 67.4 million), west (maharashtra-mH; population- 112.7 million) and east (Jharkhand-JH; population- 31.5 million) of india and one UT representing northern india (chandigarh-cH; population-1.4 million).
The sample size was calculated separately for urban and rural areas, as previous studies showed large variations in urban and rural prevalence of type 2 diabetes mellitus (approximately 10 and 4%, respectively). Using a precision of 20 per cent and allowing for a non response rate of 20 per cent, the sample size was calculated to be 2800 individuals in rural areas and 1200 individuals in urban areas, with a total sample size of 4000 individuals per state. Thus the sample size for the entire study once completed will be 1,24,000 individuals (28 states including 2 UTs and 1 ncT). Thus, 16,000 individuals from the states of Tamil nadu, maharashtra and Jharkhand, and the Union Territory of chandigarh (phase i of the icmr-indiab study) were included in this study to determine the prevalence of obesity.
Sampling strategy: A stratified multi-stage sampling design was adopted. The primary sampling units (psUs) were villages in rural areas and census enumeration blocks (CEBs) in urban areas. Three-level stratification was done in both urban and rural areas, based on geography, population size and socio-economic status in order to obtain a representative sample of the region being studied. The estimation of the sampling error of the prevalence took into account both the multi-stage nature of the sampling design, and standardization to the age-sex composition of the 2001 census population. a two-stage design was used in rural areas, while a three-stage design was adopted in urban areas. Ultimate stage units were households in both areas. in rural areas, the first stage of sampling involved selection of psUs (villages) using the probability proportional to population size (pps). in the second stage, households (n=56) were selected by systematic sampling with a random start. in urban areas, due to the large population involved, a three-stage design was used. The first stage involved selection of wards by pps method. in the next stage, one cEb was randomly selected from each
140 indian J mEd rEs, aUGUsT 2015
ward (the cEbs were of approximately the same size), and in the final stage, households (n=24) were selected from the cEbs by systemic sampling. in both rural and urban areas, only one individual was selected within each household using the World Health Organization (WHO) Kish method11.
For phase i, a total of 16,607 individuals (5,112 urban and 11,495 rural) were selected from 363 psUs (188 urban and 175 rural) of whom 14,277 individuals responded (response rate, 86%). For the present study, 13,800 of the 14,277 subjects who participated in phase i, for whom information on anthropometric measurements such as weight, height and waist was available, were included in the analysis (urban: n=4,063; rural=9,737). The study was approved by the institutional Ethics committee of the madras diabetes research Foundation, chennai, Tamil nadu, india, and written informed consent was obtained from all the participants.
in all study participants, a structured questionnaire was administered by trained field investigators to obtain data on socio-demographic parameters and behavioural aspects. anthropometric parameters were measured using standardized techniques12. Height (in centimeters) was measured using a stadiometer (sEca model 214, seca Gmbh co, Hamburg, Germany). The individual was asked to stand upright without shoes with his/her back against the vertical back board, heels together and eyes directed forward. Weight (in kilograms) was measured with an electronic weighing scale (sEca model 807, seca Gmbh co, Hamburg, Germany) that was kept on a firm horizontal flat surface. subjects were asked to wear light clothing, and weight was recorded to the nearest 0.5 kg. body mass index (bmi) was calculated using the formula weight (kg)/height (m)2.
Waist circumference (in centimeters) was measured using a non-stretchable measuring tape. Waist circumference was measured at the smallest horizontal girth between the costal margins and the iliac crest at the end of expiration.
blood pressure was recorded in the sitting position in the right arm to the nearest 1 mmHg using the electronic OmrOn machine (Omron corporation, Tokyo, Japan). Two readings were taken five minutes apart and their mean was taken as the blood pressure.
Fasting capillary blood glucose (cbG) was determined using a One Touch Ultra glucose meter (Johnson & Johnson, milpitas, ca, Usa). Oral glucose
(82.5 g, equivalent to 75 g of anhydrous glucose) was given and a 2 h post load cbG was collected. in individuals with self reported diabetes, only fasting cbG was measured.
Definitions
Overweight was defined as a BMI ≥23 kg/m2 but <25 kg/m2 for both genders (based on the World Health Organization Asia Pacific Guidelines) with or without abdominal obesity (aO)12.
Generalized obesity (GO) was defined as a BMI ≥ 25 kg/m2 for both genders (based on the World Health Organization Asia Pacific Guidelines) with or without abdominal obesity (aO)12.
Abdominal obesity (AO) was defined as a waist circumference (WC) ≥ 90 cm for men and ≥ 80 cm for women with or without GO13.
Isolated generalized obesity (IGO) was defined as a BMI ≥ 25 kg/m2 with waist circumference of < 90 cm in men and < 80 cm in women.
Isolated abdominal obesity (IAO) was defined as a waist circumference of ≥ 90 cm in men or ≥ 80 cm in women with a bmi < 25 kg/m2.
combined obesity (cO): individuals with both GO and aO.
non obese subjects: individuals without either GO or aO
Diabetes was defined by a physician diagnosis of diabetes and current use of medications for diabetes (insulin or oral hypoglycaemic agents) and/or fulfillment of criteria laid down by the WHO consultation Group report, i.e. a fasting CBG ≥7 mmol/l and/or a 2 h post glucose CBG value ≥12.2 mmol/l14.
Hypertension was diagnosed in subjects who were on antihypertensive medications or had a systolic bp ≥140 mmHg and/or a diastolic BP ≥90 mmHg15.
Statistical analysis: statistical analyses were performed using sas statistical package (version 9.0; sas institute, inc., cary, nc, Usa). One-way anOVa or student’s t test were used to compare groups for continuous variables and chi-square test was used to compare proportions between two groups. multiple logistic regression analysis was used to examine the association between various exposures and outcomes. For projections, Government of india population projections for 2011 for the respective states/UT were used16. For national estimates, the prevalence of three
pradEEpa et al: prEVaLEncE OF ObEsiTy in india 141
states was used (The UT was excluded as it is highly urbanized and may enormously inflate projections).
Results
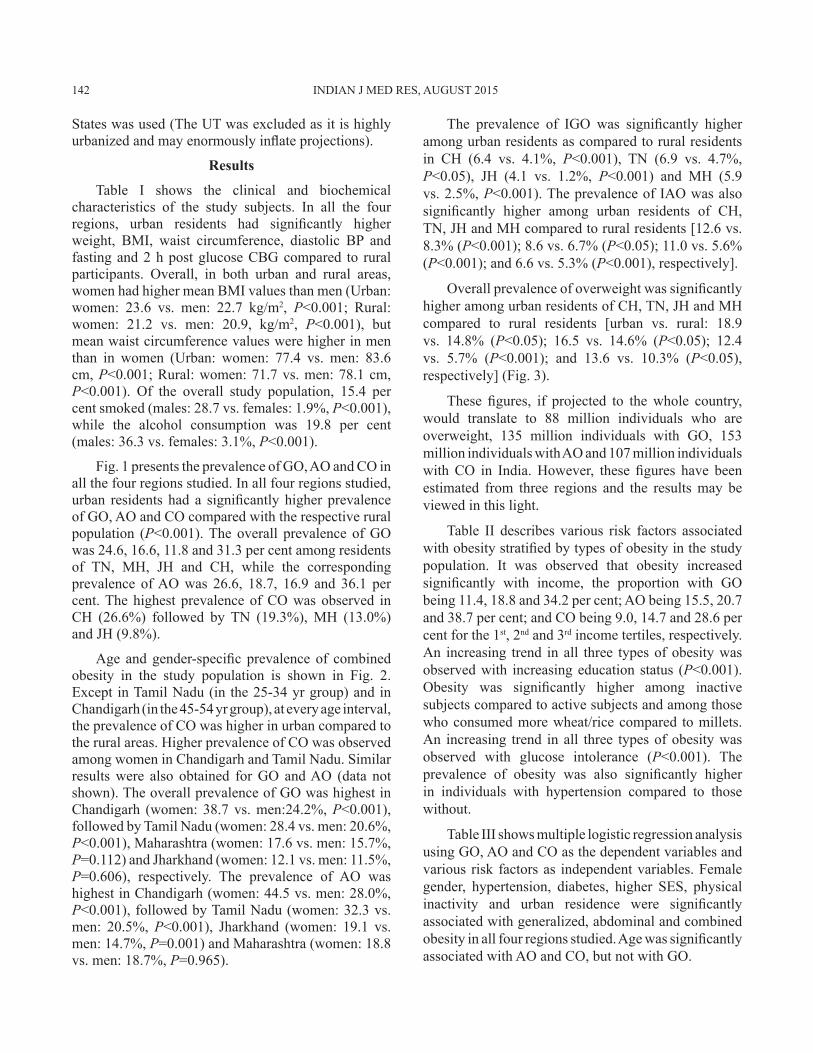
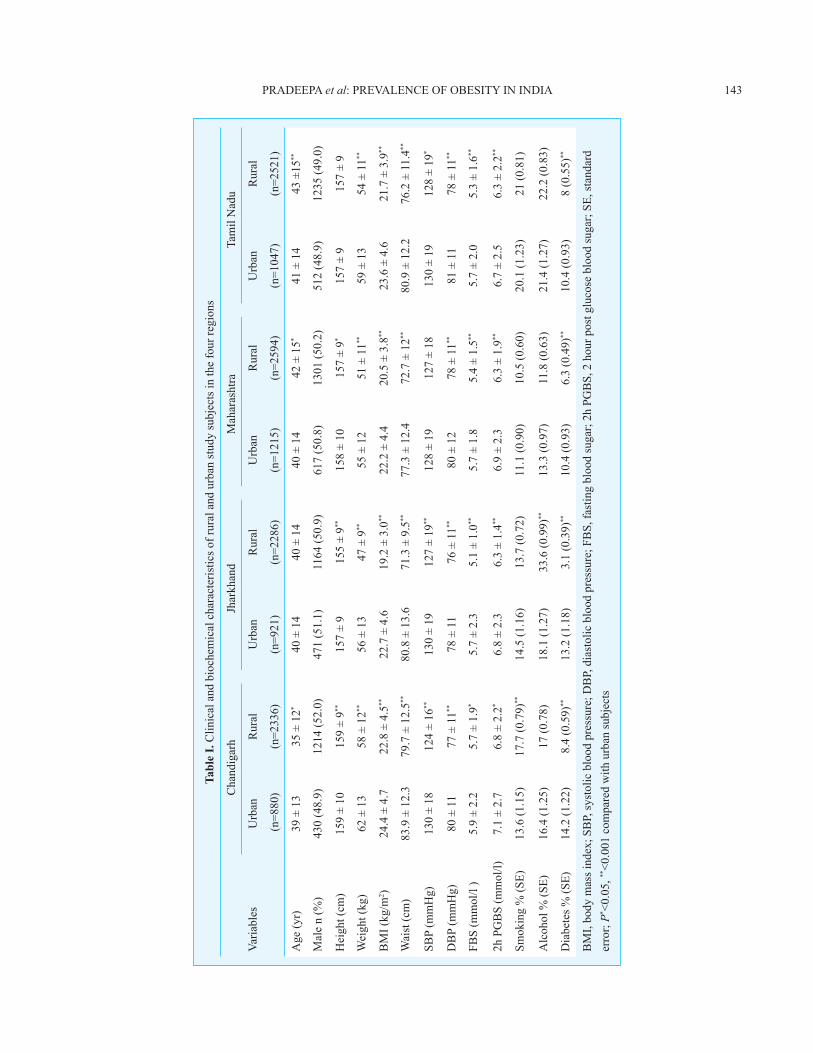
Table i shows the clinical and biochemical characteristics of the study subjects. in all the four regions, urban residents had significantly higher weight, bmi, waist circumference, diastolic bp and fasting and 2 h post glucose cbG compared to rural participants. Overall, in both urban and rural areas, women had higher mean bmi values than men (Urban: women: 23.6 vs. men: 22.7 kg/m2, P<0.001; rural: women: 21.2 vs. men: 20.9, kg/m2, P<0.001), but mean waist circumference values were higher in men than in women (Urban: women: 77.4 vs. men: 83.6 cm, P<0.001; rural: women: 71.7 vs. men: 78.1 cm, P<0.001). Of the overall study population, 15.4 per cent smoked (males: 28.7 vs. females: 1.9%, P<0.001), while the alcohol consumption was 19.8 per cent (males: 36.3 vs. females: 3.1%, P<0.001).
Fig. 1 presents the prevalence of GO, aO and cO in all the four regions studied. in all four regions studied, urban residents had a significantly higher prevalence of GO, aO and cO compared with the respective rural population (P<0.001). The overall prevalence of GO was 24.6, 16.6, 11.8 and 31.3 per cent among residents of Tn, mH, JH and cH, while the corresponding prevalence of aO was 26.6, 18.7, 16.9 and 36.1 per cent. The highest prevalence of cO was observed in cH (26.6%) followed by Tn (19.3%), mH (13.0%) and JH (9.8%).
age and gender-specific prevalence of combined obesity in the study population is shown in Fig. 2. Except in Tamil nadu (in the 25-34 yr group) and in chandigarh (in the 45-54 yr group), at every age interval, the prevalence of cO was higher in urban compared to the rural areas. Higher prevalence of cO was observed among women in chandigarh and Tamil nadu. similar results were also obtained for GO and aO (data not shown). The overall prevalence of GO was highest in chandigarh (women: 38.7 vs. men:24.2%, P<0.001), followed by Tamil nadu (women: 28.4 vs. men: 20.6%, P<0.001), maharashtra (women: 17.6 vs. men: 15.7%, P=0.112) and Jharkhand (women: 12.1 vs. men: 11.5%, P=0.606), respectively. The prevalence of aO was highest in chandigarh (women: 44.5 vs. men: 28.0%, P<0.001), followed by Tamil nadu (women: 32.3 vs. men: 20.5%, P<0.001), Jharkhand (women: 19.1 vs. men: 14.7%, P=0.001) and maharashtra (women: 18.8 vs. men: 18.7%, P=0.965).
The prevalence of IGO was significantly higher among urban residents as compared to rural residents in cH (6.4 vs. 4.1%, P<0.001), Tn (6.9 vs. 4.7%, P<0.05), JH (4.1 vs. 1.2%, P<0.001) and mH (5.9 vs. 2.5%, P<0.001). The prevalence of iaO was also significantly higher among urban residents of CH, Tn, JH and mH compared to rural residents [12.6 vs. 8.3% (P<0.001); 8.6 vs. 6.7% (P<0.05); 11.0 vs. 5.6% (P<0.001); and 6.6 vs. 5.3% (P<0.001), respectively].
Overall prevalence of overweight was significantly higher among urban residents of cH, Tn, JH and mH compared to rural residents [urban vs. rural: 18.9 vs. 14.8% (P<0.05); 16.5 vs. 14.6% (P<0.05); 12.4 vs. 5.7% (P<0.001); and 13.6 vs. 10.3% (P<0.05), respectively] (Fig. 3).
These figures, if projected to the whole country, would translate to 88 million individuals who are overweight, 135 million individuals with GO, 153 million individuals with aO and 107 million individuals with CO in India. However, these figures have been estimated from three regions and the results may be viewed in this light.
Table ii describes various risk factors associated with obesity stratified by types of obesity in the study population. it was observed that obesity increased significantly with income, the proportion with GO being 11.4, 18.8 and 34.2 per cent; aO being 15.5, 20.7 and 38.7 per cent; and cO being 9.0, 14.7 and 28.6 per cent for the 1st, 2nd and 3rd income tertiles, respectively. an increasing trend in all three types of obesity was observed with increasing education status (P<0.001). Obesity was significantly higher among inactive subjects compared to active subjects and among those who consumed more wheat/rice compared to millets. an increasing trend in all three types of obesity was observed with glucose intolerance (P<0.001). The prevalence of obesity was also significantly higher in individuals with hypertension compared to those without.
Table iii shows multiple logistic regression analysis using GO, aO and cO as the dependent variables and various risk factors as independent variables. Female gender, hypertension, diabetes, higher sEs, physical inactivity and urban residence were significantly associated with generalized, abdominal and combined obesity in all four regions studied. Age was significantly associated with aO and cO, but not with GO.
142 indian J mEd rEs, aUGUsT 2015
pradEEpa et al: prEVaLEncE OF ObEsiTy in india 143
Tabl
e I.
clin
ical
and
bio
chem
ical
cha
ract
eris
tics o
f rur
al a
nd u
rban
stud
y su
bjec
ts in
the
four
regi
ons
cha
ndig
arh
Jhar
khan
dm
ahar
asht
raTa
mil
nad
u
Varia
bles
Urb
anr
ural
Urb
anr
ural
Urb
anr
ural
Urb
anr
ural
(n=8
80)
(n=2
336)
(n=9
21)
(n=2
286)
(n=1
215)
(n=2
594)
(n=1
047)
(n=2
521)
age
(yr)
39 ±
13
35 ±
12*
40 ±
14
40 ±
14
40 ±
14
42 ±
15*
41 ±
14
43 ±
15**
mal
e n
(%)
430
(48.
9)12
14 (5
2.0)
471
(51.
1)11
64 (5
0.9)
617
(50.
8)13
01 (5
0.2)
512
(48.
9)12
35 (4
9.0)
Hei
ght (
cm)
159
± 10
159
± 9**
157
± 9
155
± 9**
158
± 10
157
± 9*
157
± 9
157
± 9
Wei
ght (
kg)
62 ±
13
58 ±
12**
56 ±
13
47 ±
9**
55 ±
12
51 ±
11**
59 ±
13
54 ±
11**
bm
i (kg
/m2 )
24.4
± 4
.722
.8 ±
4.5
**22
.7 ±
4.6
19.2
± 3
.0**
22.2
± 4
.420
.5 ±
3.8
**23
.6 ±
4.6
21.7
± 3
.9**
Wai
st (c
m)
83.9
± 1
2.3
79.7
± 1
2.5**
80.8
± 1
3.6
71.3
± 9
.5**
77.3
± 1
2.4
72.7
± 1
2**80
.9 ±
12.
276
.2 ±
11.
4**
sbp
(mm
Hg)
130
± 18
124
± 16
**13
0 ±
1912
7 ±
19**
128
± 19
127
± 18
130
± 19
128
± 19
*
db
p (m
mH
g)80
± 1
177
± 1
1**78
± 1
176
± 1
1**80
± 1
278
± 1
1**81
± 1
178
± 1
1**
Fbs
(mm
ol/l
)5.
9 ±
2.2
5.7
± 1.
9*5.
7 ±
2.3
5.1
± 1.
0**5.
7 ±
1.8
5.4
± 1.
5**5.
7 ±
2.0
5.3
± 1.
6**
2h p
Gb
s (m
mol
/l)7.
1 ±
2.7
6.8
± 2.
2*6.
8 ±
2.3
6.3
± 1.
4**6.
9 ±
2.3
6.3
± 1.
9**6.
7 ±
2.5
6.3
± 2.
2**
smok
ing
% (s
E)13
.6 (1
.15)
17.7
(0.7
9)**
14.5
(1.1
6)13
.7 (0
.72)
11.1
(0.9
0)10
.5 (0
.60)
20.1
(1.2
3)21
(0.8
1)
alc
ohol
% (s
E)16
.4 (1
.25)
17 (0
.78)
18.1
(1.2
7)33
.6 (0
.99)
**13
.3 (0
.97)
11.8
(0.6
3)21
.4 (1
.27)
22.2
(0.8
3)
dia
bete
s % (s
E)14
.2 (1
.22)
8.4
(0.5
9)**
13.2
(1.1
8)3.
1 (0
.39)
**10
.4 (0
.93)
6.3
(0.4
9)**
10.4
(0.9
3)8
(0.5
5)**
bm
i, bo
dy m
ass i
ndex
; sb
p, sy
stol
ic b
lood
pre
ssur
e; d
bp,
dia
stol
ic b
lood
pre
ssur
e; F
bs,
fast
ing
bloo
d su
gar;
2h p
Gb
s, 2
hou
r pos
t glu
cose
blo
od su
gar;
sE, s
tand
ard
erro
r; P* <
0.05
, **<0
.001
com
pare
d w
ith u
rban
subj
ects
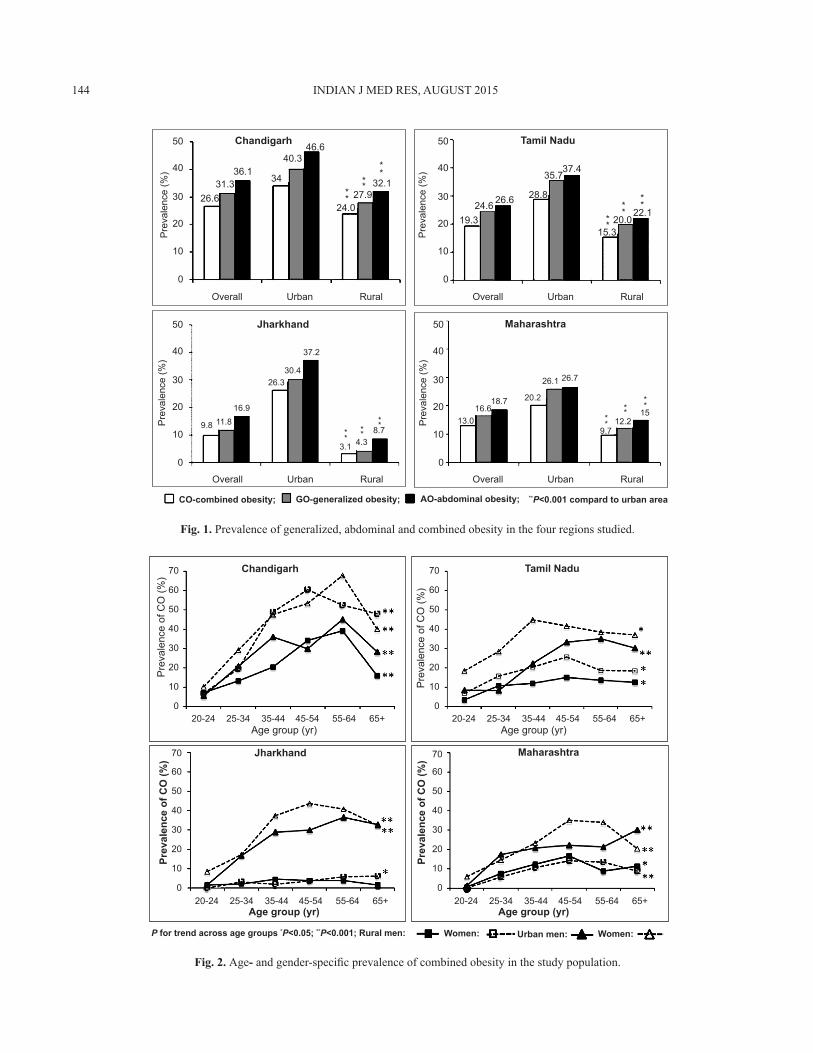
Fig. 1. prevalence of generalized, abdominal and combined obesity in the four regions studied.
Chandigarh
26.6
9.8 11.816.9
26.330.4
37.2
3.1 4.3**
**** 8.7
16.618.7 20.2
26.1 26.7
9.712.2*
* ****
1513.0
0 0
19.324.6 26.6 28.8
35.737.4
15.320.0
22.1
10 10
20 20
Pre
vale
nce
(%)
Pre
vale
nce
(%)
Pre
vale
nce
(%)
Pre
vale
nce
(%)
Overall Overall
OverallOverall
CO-combined obesity; GO-generalized obesity; AO-abdominal obesity; **P<0.001 compard to urban area
Urban Urban
UrbanUrban
Rural Rural
RuralRural
30 30
40 40
50 50
0
10
20
30
40
50
0
10
20
30
40
50
31.336.1
34
40.346.6
24.027.9
32.1**
**
****
****
Jharkhand Maharashtra
Tamil Nadu
Fig. 2. age- and gender-specific prevalence of combined obesity in the study population.
144 indian J mEd rEs, aUGUsT 2015
Chandigarh
Age group (yr)
Age group (yr)
Prev
alen
ce o
f CO
(%)
Prev
alen
ce o
f CO
(%)
Pre
vale
nce
of C
O (%
)
Pre
vale
nce
of C
O (%
)
Age group (yr)
Age group (yr)
Jharkhand Maharashtra
0 0
00
20-24 20-24
20-2420-24
25-34 25-34
25-3425-34
35-44 35-44
35-4435-44
45-54 45-54
45-5445-54
55-64 55-64
55-6455-64
65+ 65+
65+65+
10 10
1010
20 20
2020
30 30
3030
40 40
4040
50 50
5050
60 60
6060
70 70
7070
Tamil Nadu
P for trend across age groups *P<0.05; **P<0.001; Rural men: Women: Women:Urban men:
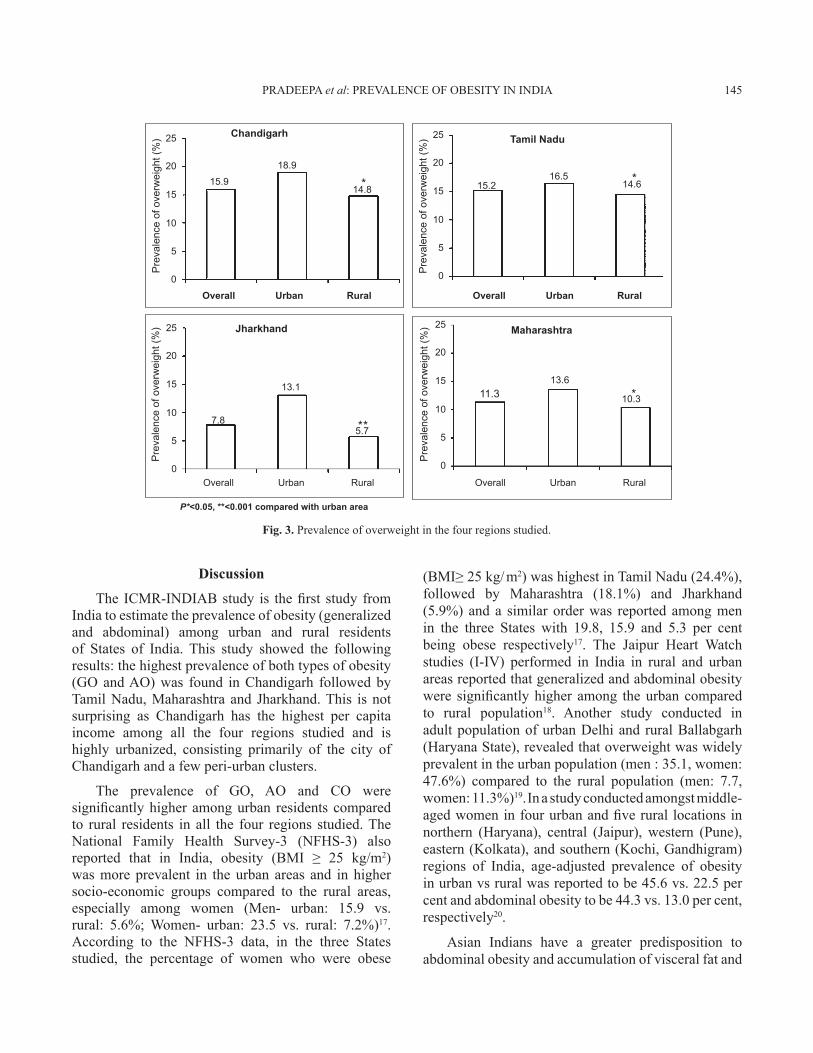
Fig. 3. prevalence of overweight in the four regions studied.
Discussion
The ICMR-INDIAB study is the first study from india to estimate the prevalence of obesity (generalized and abdominal) among urban and rural residents of states of india. This study showed the following results: the highest prevalence of both types of obesity (GO and aO) was found in chandigarh followed by Tamil nadu, maharashtra and Jharkhand. This is not surprising as chandigarh has the highest per capita income among all the four regions studied and is highly urbanized, consisting primarily of the city of chandigarh and a few peri-urban clusters.
The prevalence of GO, aO and cO were significantly higher among urban residents compared to rural residents in all the four regions studied. The national Family Health survey-3 (nFHs-3) also reported that in India, obesity (BMI ≥ 25 kg/m2) was more prevalent in the urban areas and in higher socio-economic groups compared to the rural areas, especially among women (men- urban: 15.9 vs. rural: 5.6%; Women- urban: 23.5 vs. rural: 7.2%)17. according to the nFHs-3 data, in the three states studied, the percentage of women who were obese
(BMI≥ 25 kg/ m2) was highest in Tamil nadu (24.4%), followed by maharashtra (18.1%) and Jharkhand (5.9%) and a similar order was reported among men in the three states with 19.8, 15.9 and 5.3 per cent being obese respectively17. The Jaipur Heart Watch studies (i-iV) performed in india in rural and urban areas reported that generalized and abdominal obesity were significantly higher among the urban compared to rural population18. another study conducted in adult population of urban delhi and rural ballabgarh (Haryana state), revealed that overweight was widely prevalent in the urban population (men : 35.1, women: 47.6%) compared to the rural population (men: 7.7, women: 11.3%)19. in a study conducted amongst middle-aged women in four urban and five rural locations in northern (Haryana), central (Jaipur), western (pune), eastern (Kolkata), and southern (Kochi, Gandhigram) regions of india, age-adjusted prevalence of obesity in urban vs rural was reported to be 45.6 vs. 22.5 per cent and abdominal obesity to be 44.3 vs. 13.0 per cent, respectively20.
asian indians have a greater predisposition to abdominal obesity and accumulation of visceral fat and
pradEEpa et al: prEVaLEncE OF ObEsiTy in india 145
Overall Overall
OverallOverall
Urban Urban
UrbanUrban
Rural Rural
RuralRural
Chandigarh
Pre
vale
nce
of o
verw
eigh
t (%
)
Pre
vale
nce
of o
verw
eigh
t (%
)P
reva
lenc
e of
ove
rwei
ght (
%)
Pre
vale
nce
of o
verw
eigh
t (%
)Tamil Nadu
MaharashtraJharkhand
0
0 0
0
15.9
7.8
13.1
5.7
11.313.6
10.3
18.9
14.8 15.216.5
14.6
5
5 5
5
10
10 10
10
15
15 15
15
20
20 20
20
25
25 25
25
P*<0.05, **<0.001 compared with urban area
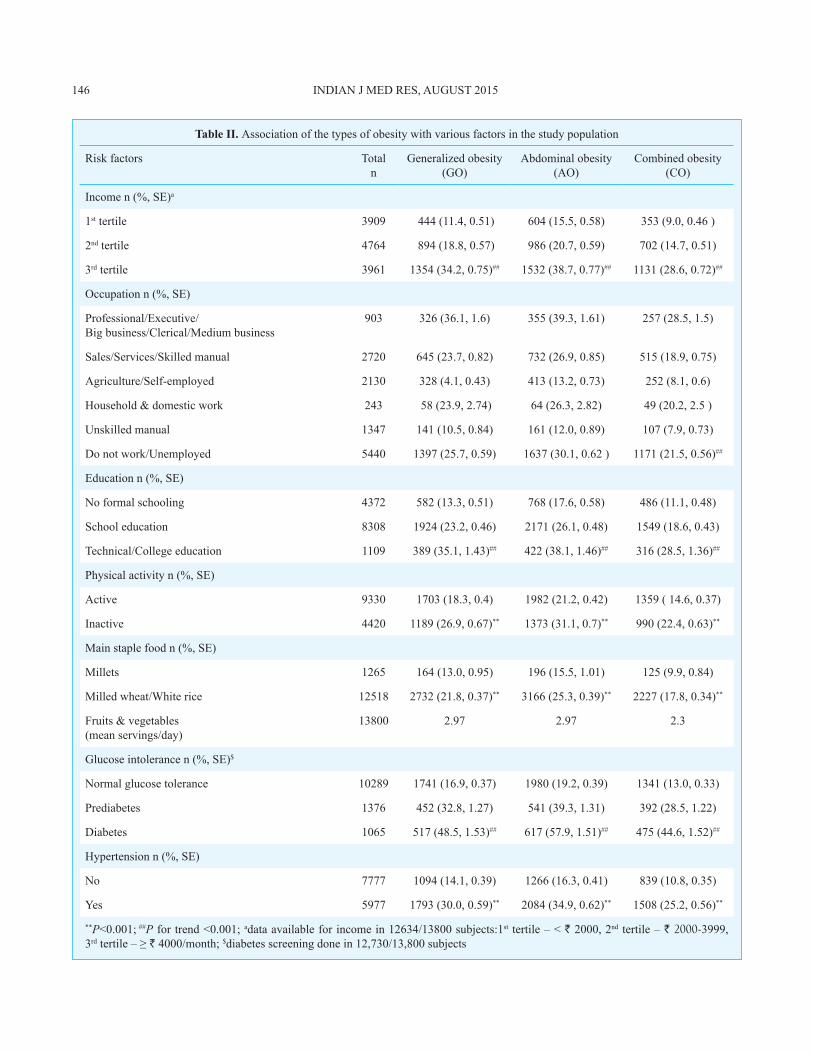
Table II. association of the types of obesity with various factors in the study population
risk factors Totaln
Generalized obesity (GO)
abdominal obesity (aO)
combined obesity (cO)
income n (%, sE)a
1st tertile 3909 444 (11.4, 0.51) 604 (15.5, 0.58) 353 (9.0, 0.46 )
2nd tertile 4764 894 (18.8, 0.57) 986 (20.7, 0.59) 702 (14.7, 0.51)
3rd tertile 3961 1354 (34.2, 0.75)## 1532 (38.7, 0.77)## 1131 (28.6, 0.72)##
Occupation n (%, sE)
professional/Executive/big business/clerical/medium business
903 326 (36.1, 1.6) 355 (39.3, 1.61) 257 (28.5, 1.5)
sales/services/skilled manual 2720 645 (23.7, 0.82) 732 (26.9, 0.85) 515 (18.9, 0.75)
agriculture/self-employed 2130 328 (4.1, 0.43) 413 (13.2, 0.73) 252 (8.1, 0.6)
Household & domestic work 243 58 (23.9, 2.74) 64 (26.3, 2.82) 49 (20.2, 2.5 )
Unskilled manual 1347 141 (10.5, 0.84) 161 (12.0, 0.89) 107 (7.9, 0.73)
do not work/Unemployed 5440 1397 (25.7, 0.59) 1637 (30.1, 0.62 ) 1171 (21.5, 0.56)##
Education n (%, sE)
no formal schooling 4372 582 (13.3, 0.51) 768 (17.6, 0.58) 486 (11.1, 0.48)
school education 8308 1924 (23.2, 0.46) 2171 (26.1, 0.48) 1549 (18.6, 0.43)
Technical/college education 1109 389 (35.1, 1.43)## 422 (38.1, 1.46)## 316 (28.5, 1.36)##
physical activity n (%, sE)
active 9330 1703 (18.3, 0.4) 1982 (21.2, 0.42) 1359 ( 14.6, 0.37)
inactive 4420 1189 (26.9, 0.67)** 1373 (31.1, 0.7)** 990 (22.4, 0.63)**
main staple food n (%, sE)
millets 1265 164 (13.0, 0.95) 196 (15.5, 1.01) 125 (9.9, 0.84)
milled wheat/White rice 12518 2732 (21.8, 0.37)** 3166 (25.3, 0.39)** 2227 (17.8, 0.34)**
Fruits & vegetables(mean servings/day)
13800 2.97 2.97 2.3
Glucose intolerance n (%, sE)$
normal glucose tolerance 10289 1741 (16.9, 0.37) 1980 (19.2, 0.39) 1341 (13.0, 0.33)
prediabetes 1376 452 (32.8, 1.27) 541 (39.3, 1.31) 392 (28.5, 1.22)
diabetes 1065 517 (48.5, 1.53)## 617 (57.9, 1.51)## 475 (44.6, 1.52)##
Hypertension n (%, sE)
no 7777 1094 (14.1, 0.39) 1266 (16.3, 0.41) 839 (10.8, 0.35)
yes 5977 1793 (30.0, 0.59)** 2084 (34.9, 0.62)** 1508 (25.2, 0.56)**
**P<0.001; ##P for trend <0.001; adata available for income in 12634/13800 subjects:1st tertile – < ` 2000, 2nd tertile – ` 2000-3999, 3rd tertile – ≥ ` 4000/month; $diabetes screening done in 12,730/13,800 subjects
146 indian J mEd rEs, aUGUsT 2015
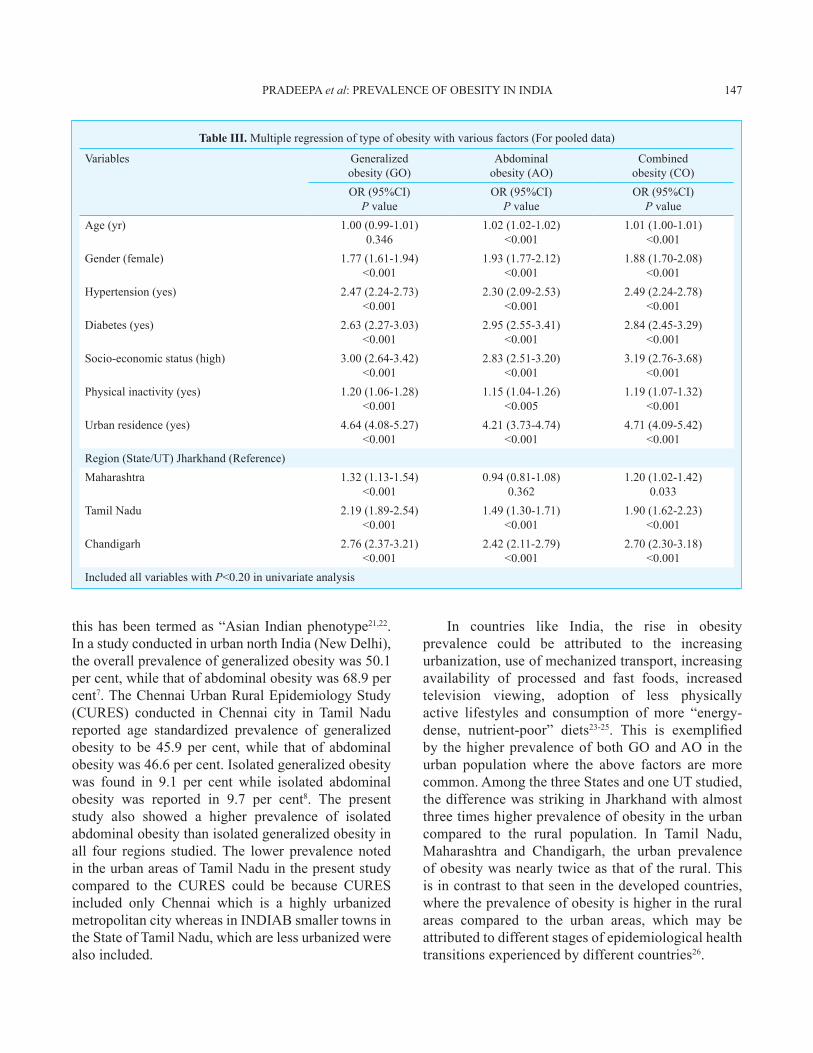
Table III. multiple regression of type of obesity with various factors (For pooled data)
Variables Generalized obesity (GO)
abdominalobesity (aO)
combinedobesity (cO)
Or (95%ci) P value
Or (95%ci) P value
Or (95%ci) P value
age (yr) 1.00 (0.99-1.01)0.346
1.02 (1.02-1.02)<0.001
1.01 (1.00-1.01)<0.001
Gender (female) 1.77 (1.61-1.94) <0.001
1.93 (1.77-2.12) <0.001
1.88 (1.70-2.08) <0.001
Hypertension (yes) 2.47 (2.24-2.73) <0.001
2.30 (2.09-2.53) <0.001
2.49 (2.24-2.78) <0.001
diabetes (yes) 2.63 (2.27-3.03) <0.001
2.95 (2.55-3.41) <0.001
2.84 (2.45-3.29) <0.001
socio-economic status (high) 3.00 (2.64-3.42) <0.001
2.83 (2.51-3.20) <0.001
3.19 (2.76-3.68) <0.001
physical inactivity (yes) 1.20 (1.06-1.28)<0.001
1.15 (1.04-1.26) <0.005
1.19 (1.07-1.32) <0.001
Urban residence (yes) 4.64 (4.08-5.27) <0.001
4.21 (3.73-4.74) <0.001
4.71 (4.09-5.42) <0.001
region (state/UT) Jharkhand (reference)maharashtra 1.32 (1.13-1.54)
<0.0010.94 (0.81-1.08)
0.3621.20 (1.02-1.42)
0.033Tamil nadu 2.19 (1.89-2.54)
<0.0011.49 (1.30-1.71)
<0.0011.90 (1.62-2.23)
<0.001chandigarh 2.76 (2.37-3.21)
<0.0012.42 (2.11-2.79)
<0.0012.70 (2.30-3.18)
<0.001included all variables with P<0.20 in univariate analysis
this has been termed as “asian indian phenotype21,22. in a study conducted in urban north india (new delhi), the overall prevalence of generalized obesity was 50.1 per cent, while that of abdominal obesity was 68.9 per cent7. The chennai Urban rural Epidemiology study (cUrEs) conducted in chennai city in Tamil nadu reported age standardized prevalence of generalized obesity to be 45.9 per cent, while that of abdominal obesity was 46.6 per cent. isolated generalized obesity was found in 9.1 per cent while isolated abdominal obesity was reported in 9.7 per cent8. The present study also showed a higher prevalence of isolated abdominal obesity than isolated generalized obesity in all four regions studied. The lower prevalence noted in the urban areas of Tamil nadu in the present study compared to the cUrEs could be because cUrEs included only chennai which is a highly urbanized metropolitan city whereas in indiab smaller towns in the state of Tamil nadu, which are less urbanized were also included.
in countries like india, the rise in obesity prevalence could be attributed to the increasing urbanization, use of mechanized transport, increasing availability of processed and fast foods, increased television viewing, adoption of less physically active lifestyles and consumption of more “energy-dense, nutrient-poor” diets23-25. This is exemplified by the higher prevalence of both GO and aO in the urban population where the above factors are more common. among the three states and one UT studied, the difference was striking in Jharkhand with almost three times higher prevalence of obesity in the urban compared to the rural population. in Tamil nadu, maharashtra and chandigarh, the urban prevalence of obesity was nearly twice as that of the rural. This is in contrast to that seen in the developed countries, where the prevalence of obesity is higher in the rural areas compared to the urban areas, which may be attributed to different stages of epidemiological health transitions experienced by different countries26.
pradEEpa et al: prEVaLEncE OF ObEsiTy in india 147
nearly 70 per cent of india’s population resides in rural areas. Even a small increase in prevalence of obesity in rural areas could lead to a huge increase in the number of obese individuals in india. The present study showed a marked increase in bmi values in the rural areas compared to those reported in an earlier study by ramachandran et al27 in rural south india. The increase in prevalence of obesity among the rural population may be due to rapid changes in lifestyle in rural areas.
it is noteworthy that the alcohol consumption in the rural areas of Jharkhand is almost double that in urban areas (33.6 vs. 18.1%). This is partly because the alcohol consumption was significantly higher in women in rural Jharkhand compared to the other regions. However, the reported alcohol consumption was also higher among men in Jharkhand when compared to the other regions (rural women : Jharkhand-16.2, chandigarh- 0.0, maharashtra-0.4, Tamil nadu- 0.5%; and in rural men: Jharkhand- 50.4, chandigarh- 32.8, maharashtra- 23.2, Tamil nadu- 44.8%). This may be due to the large tribal population in rural Jharkhand where alcohol intake is more culturally accepted even among women28. However, this does not seem to have affected the prevalence of obesity in an adverse manner as the prevalence of GO, aO and cO were lowest in Jharkhand.
many studies in india have reported higher prevalence of obesity among women20,22,29-32. in a study conducted in four urban and five rural locations in india among women aged 35-70 yr, the age-adjusted prevalence of obesity (BMI ≥ 25 kg/m2) in urban and rural areas was 45.6 and 22.5 per cent, respectively20. The nFHs-3 data which studied urban and rural residents (all women aged 15-49 and all men aged 15-54) in 28 states of india and the national capital Territory of delhi during the year 2005-2006, also showed a higher prevalence of overweight (BMI ≥ 25-29.9 kg/m2) and obesity (BMI ≥ 30 kg/m2) among females than males in all the states of india17. The prevalence of obesity observed in women in the three states included in our study was similar to that observed in nFHs-3, with the highest prevalence in Tamil nadu (indiab: 24.6 vs. nFHs-3: 20.9%), followed by maharashtra (indiab: 16.6 vs. nFHs-3: 14.5%) and Jharkhand (indiab: 11.8 vs. nFHs-3: 5.4%). The prevalence of obesity among indian women has increased from 10.6 per cent (nFHs-2 in 1998-1999) to 12.6 per cent (nFHs-3 in 2005-2006), i.e. an increase by 24.52 per cent in a 7 year period33.
Our study shows that it has now increased to 24.1 per cent representing a further increase by 91.3 per cent in a 5 year period and, on the whole, an increase by 127.4 per cent over a 12 year period. as obesity, particularly in young women, can have important consequences like infertility and development of polycystic ovary syndrome (PCOS), this is of great significance34. Higher prevalence of obesity in young women is also worrisome because it may increase the prevalence of gestational diabetes, type 2 diabetes, hypertension and cardiovascular disease later in the life.
The strengths of this study were that the study sample was truly representative of the regions studied in terms of geography, socio-economic status and population size and the sample size was large (n=13,800). This study was perhaps the first to look at the prevalence of GO, aO and cO by studying four regions of the country. Also, for the first time, data on the prevalence of GO, aO and cO have been obtained in urban as well as rural areas, in these states of the country.
The study also had a few limitations. First, the cross-sectional nature of the design did not allow for cause-effect relationships to be made. a second limitation was that the projections made here for obesity for the country as a whole were based on data in the three states only; these may be regarded as interim and may need to be revised after the entire study is completed.
in summary, our study showed that the prevalence of obesity (generalized and abdominal) was higher in india now compared to earlier studies. The prevalence of abdominal obesity was higher than the generalized obesity and urban residents had a higher prevalence of both forms of obesity than the rural residents. This study is of significance because it shows large increases in prevalence of obesity not only in urban areas but also in rural areas in india. With further urbanization, changing lifestyle and behaviour we may expect further increase in the incidence and prevalence of obesity in india.
Acknowledgment The authors acknowledge the indian council of medical Research, New Delhi, for the financial support for the study and the icmr-indiab Expert Group for their valuable suggestions and scientific inputs. They also thank the ICMR-INDIAB Quality Managers, Quality Supervisors and the field team for smooth conduct of the study and the participants for their cooperation. This is the third paper from the icmr-indiab study (icmr –indiab -3).
conflicts of interest: none.
148 indian J mEd rEs, aUGUsT 2015
ReferencesWorld He1. alth Organization (WHO). Obesity: preventing and managing the global epidemic. report of a WHO consultation. World Health Organ Tech Rep Ser 2000; 894 : i-xii, 1-253. World Health Organization (WHO). World Health statistics 2. 2012. Geneva: WHO; 2012. available from: http://www.who.int/gho/publications/world_health_statistics/EN_WHS2012_Full.pdf, accessed on november 28, 2012. James WpT, Jackson-Leach r, ni mhurchu c, Kalamara E, 3. shayeghi m, rigby nJ, et al. Overweight and obesity (high body mass index). in: Ezzati m, Lopez ad, rodgers a, murray cJL, editors. Comparative quantification of health risks: global and regional burden of disease attributable to selected major risk factors. vol i. Geneva: World Health Organization; 2004. p. 497-596.Flegal Km, Kit bK, Orpana H, Graubard bi. association of 4. all-cause mortality with overweight and obesity using standard body mass index categories: a systematic review and meta-analysis. JAMA 2013; 309 : 71-82. World Health Organization (WHO). Global health risks: 5. mortality and burden of disease attributable to selected major risks. Geneva: switzerland, WHO; 2009. available from: http://www.who.int/healthinfo/global_burden_disease/GlobalHealthRisks_report_full.pdf, accessed on February 3, 2014.mohan V, deepa r. Obesity & abdominal obesity in asian 6. indians. Indian J Med Res 2006; 123 : 593-6.bhardwaj s, misra a, misra r, Goel K, bhatt sp, rastogi 7. KV, et al. High prevalence of abdominal, intra-abdominal and subcutaneous adiposity and clustering of risk factors among urban asian indians in north india. PLoS One 2011; 6 : e24362. deepa m, Farooq s, deepa r, manjula d, mohan V. prevalence 8. and significance of generalized and central body obesity in an urban asian indian population in chennai, india (cUrEs: 47). Eur J Clin Nutr 2009; 63 : 259-67.misra a, Khurana L. Obesity and the metabolic syndrome 9. in developing countries. J Clin Endocrinol Metab 2008; 93 (11 suppl 1): s9-30. anjana rm, pradeepa r, deepa m, datta m, sudha V, 10. Unnikrishnan r, et al. The indian council of medical research-india diabetes (icmr-indiab) study: methodological details. J Diabetes Sci Technol 2011; 5 : 906-14.sTEp wise approach to surveillance (sTEps). available from: 11. http://www.who.int/chp/steps/manual/en/index.html, accessed on november 28, 2012.Harrison GG, buskirk Er, Lindsay carter Er, Johnston 12. FE, Lohman TG, pollock mL, et al. skinfold thickness and measurement technique. in: Lohman TG, roche aF, martorell r, editors. Anthropometric standardization reference manual. champaign, iL: Human Kinetics books; 1988. p. 55-70.T13. he Asia Pacific perspective : redefining obesity and its treatment. Regional Office for the Western Pacific (WPRO), World Health Organization. international association for the study of Obesity and the international Obesity Task Force:
st Leonards, australia; Health communications australia pty Limited; 2000. p. 22-9.World Health Organization (WHO). international diabetes 14. Federation. Definition and diagnosis of diabetes mellitus and intermediate hyperglycemia; report of a WHO/idF consultation. Geneva: WHO; 2006.chobanian aV, bakris GL, black Hr, cushman Wc, Green 15. La, izzo JL Jr, et al; national Heart, Lung, and blood institute Joint national committee on prevention, detection, Evaluation, and Treatment of High blood pressure; national High blood pressure Education program coordinating committee. The seventh report of the Joint national committee on prevention, detection, Evaluation and Treatment of High blood pressure: the Jnc 7 report. JAMA 2003; 289 : 2560-72. 16. Population projections for India and States 2001-2026. report of the technical group on population projections constituted by the national commission on population. new delhi: india; Office of the Registrar General & Census Commissioner; 2006. p. 140-247.international institute for population sciences (iips) 17. and macro international. National Family Health Survey (NFHS-3), 2005-06: India: vol. i. mumbai: iips; 2007.Gupta r, Gupta Vp, bhagat n, rastogi p, sarna m, prakash 18. H, et al. Obesity is major determinant of coronary risk factors in india: Jaipur Heart Watch studies. Indian Heart J 2008; 60 : 26-33.reddy Ks, prabhakaran d, shah p, shah b. differences in 19. body mass index and waist: hip ratios in north indian rural and urban populations. Obes Rev 2002; 3 : 197-202.pandey rm, Gupta r, misra a, misra p, singh V, agrawal a, 20. et al. determinants of urban-rural differences in cardiovascular risk factors in middle-aged women in india: a cross-sectional study. Int J Cardiol 2013; 163 : 157-62. Joshi sr. metabolic syndrome - emerging clusters of the 21. indian phenotype. J Assoc Physicians India 2003; 51 : 445-6.deepa r, sandeep s, mohan V. abdominal obesity, visceral 22. fat and type 2 diabetes- asian indian phenotype. in: mohan V, rao GHr, editors. Type 2 diabetes in South Asians: epidemiology, risk factors and prevention. new delhi, india: Jaypee brothers medical publishers (p) Ltd; 2006. p. 138-52.World Health Organization (WHO). 23. Diet, nutrition and the prevention of chronic diseases. report of a joint WHO/FaO expert consultation. World Health Organ Tech Rep Series 2003; 916 : i-viii.bell ac, Ge K, popkin bm. The road to obesity or the path 24. to prevention: motorized transportation and obesity in china. Obes Res 2002; 10 : 277-83.misra a, singhal n, Khurana L. Obesity, the metabolic 25. syndrome, and type 2 diabetes in developing countries: role of dietary fats and oils. J Am Coll Nutr 2010; 29 (suppl 3) : 289s-301s.befort ca, nazir n, perri mG. prevalence of obesity among 26. adults from rural and urban areas of the United States: findings from nHanEs (2005-2008). J Rural Health 2012; 28 : 392-7. ramachandran a, snehalatha c, dharmaraj d, Viswanathan 27. m. prevalence of glucose intolerance in asian indians. Urban-
pradEEpa et al: prEVaLEncE OF ObEsiTy in india 149
rural difference and significance of upper body adiposity. Diabetes Care 1992; 15 : 1348-55. maiti s, Unisa s, agrawal pK. Health care and health among 28. tribal women in Jharkhand: a situational analysis. Stud Tribes Tribals 2005; 3 : 37-46.misra a, pandey rm, devi Jr, sharma r,Vikram nK, Khanna 29. n. High prevalence of diabetes, obesity and dyslipidaemia in urban slum population in northern india. Int J Obes Relat Metab Disord 2001; 25 : 1722-9.Zargar aH, masoodi sr, Laway ba, Khan aK, Wani ai, bashir 30. mi, et al. prevalence of obesity in adults: an epidemiological study from Kashmir valley of indian subcontinent. J Assoc Physicians India 2000; 48 : 1170-4.
shukla Hc, Gupta pc, mehta Hc, Hebert Jr. descriptive 31. epidemiology of body mass index of an urban adult population in western india. J Epidemiol Community Health 2002; 56 : 876-80.singh rb, pella d, mechirova V, Kartikey K, demeester 32. F, Tomar rs, et al; Five city study Group. prevalence of obesity, physical inactivity and undernutrition, a triple burden of diseases during transition in a developing economy. The Five city study Group. Acta Cardiol 2007; 62 : 119-27. Garg c, Khan sa, ansari sH, Garg m. prevalence of obesity 33. in indian women. Obes Rev 2010; 11 : 105-8. pettigrew r, Hamilton-Fairley d. Obesity and female 34. reproductive function. Br Med Bull 1997; 53 : 341-58.
Reprint requests: dr V. mohan, madras diabetes research Foundation & dr mohan’s diabetes specialities centre, WHO collaborating centre for noncommunicable diseases, prevention & control & idF centre for Education, 4, conran smith road, Gopalapuram, chennai 600 086, Tamil nadu, india
e-mail: [email protected]
150 indian J mEd rEs, aUGUsT 2015


![Adipose Tissue Dysfunction as Determinant of Obesity ......fat accumulation in human is the increased visceral/intra-abdominal fat accumulation, associated with abdominal obesity [23]](https://img.pdfslide.net/doc/110x75/60af1f3f5208f406dd7a5bf3/adipose-tissue-dysfunction-as-determinant-of-obesity-fat-accumulation-in.jpg)


![New adipokines linked to obesity and obesity-related diseases · Abdominal fat accumulation has been shown to play essential role in the development of metabolic syndrome [1]. The](https://img.pdfslide.net/doc/110x75/60f78fe1eb25944f774514f5/new-adipokines-linked-to-obesity-and-obesity-related-abdominal-fat-accumulation.jpg)