Embed Size (px)
Citation preview
RESEARCH ARTICLE Open Access
Prevalence of GMC performanceassessments in the United Kingdom: aretrospective cohort analysis by country ofmedical qualificationL. Mehdizadeh1, H. W. W. Potts2*, A. Sturrock1 and J. Dacre3
Abstract
Background: The demographics of doctors working in the UK are changing. The United Kingdom (UK) has votedto leave the European Union (EU) and there is heightened political discourse around the world about the impact ofmigration on healthcare services. Previous work suggests that foreign trained doctors perform worse than UKgraduates in postgraduate medical examinations. We analysed the prevalence by country of primary medicalqualification of doctors who were required to take an assessment by the General Medical Council (GMC) because ofperformance concerns.
Methods: This was a retrospective cohort analysis of data routinely collected by the GMC. We compared doctorswho had a GMC performance assessment between 1996 and 2013 with the medical register in the same period.The outcome measures were numbers experiencing performance assessments by country or region of medicalqualification.
Results: The rate of performance assessment varied significantly by place of medical qualification and by year;χ2(17) = 188, p < 0.0001, pseudo-R2 = 15%. Doctors who trained outside of the UK, including those trained in theEuropean Economic Area (EEA), were more likely to have a performance assessment than UK trained doctors, withthe exception of South African trained doctors.
Conclusions: The rate of performance assessment varies significantly by place of medical qualification. This is thefirst study to explore the risk of performance assessment by individual places of medical qualification. Whileconcern has largely focused on the competence of non-EEA, International Medical Graduates, we discussimplications for how to ensure European trained doctors are fit to practise before their medical licence in the UK isgranted. Further research is needed to investigate whether these country effects hold true when controlling forfactors like doctors’ sex, age, length of time working in the UK, and English language skills. This will allow evidence-based decisions to be made around the regulatory environment the UK should adopt once it leaves the EU.Patients should be reassured that the vast majority of all doctors working in the UK are competent.
Keywords: Primary medical qualification, General Medical Council, Performance assessment, Cohort study, Brexit
* Correspondence: [email protected] Institute of Health Informatics, 222 Euston Road, London NW1 2DA, UKFull list of author information is available at the end of the article
© The Author(s). 2017 Open Access This article is distributed under the terms of the Creative Commons Attribution 4.0International License (http://creativecommons.org/licenses/by/4.0/), which permits unrestricted use, distribution, andreproduction in any medium, provided you give appropriate credit to the original author(s) and the source, provide a link tothe Creative Commons license, and indicate if changes were made. The Creative Commons Public Domain Dedication waiver(http://creativecommons.org/publicdomain/zero/1.0/) applies to the data made available in this article, unless otherwise stated.
Mehdizadeh et al. BMC Medical Education (2017) 17:67 DOI 10.1186/s12909-017-0903-6
BackgroundThe demographics of United Kingdom (UK) doctors hasbeen changing in recent years and may change furtherfollowing a referendum decision to leave the EuropeanUnion (EU) [1]. We are in a period of heightened polit-ical discourse about immigration and supranationaltrade agreements across the developed world, with manyimplications for health services. The migration of doc-tors from low and middle income countries to high in-come countries in North America and Western Europeis well documented [2–4]. Political rhetoric has raisedconcerns for immigrant doctors in, for example, theUnited States [5–7]. With developed countries oftendependent on healthcare professionals who trainedabroad [8], the question of how to assess qualificationsfrom another country is significant. Healthcare servicesneed to ensure that staff are competent and that mecha-nisms to ensure this are transparent to the public. Atpresent, in the UK, doctors who qualified in the rest ofthe EU, the wider European Economic Area (EEA) or informer EEA member Switzerland can practise withoutfurther assessment of their clinical skills. As shorthand,we refer to these below as EEA doctors. Those trainedelsewhere must pass the Professional and Linguistic As-sessments Board (PLAB) test before practising: we referto these non-EEA, international medical graduates asIMGs. See Table 1 for a summary. The regulatory con-text in the future is as yet unknown [9, 10].There has been a dramatic change in the pattern of
non-UK trained doctors joining the medical register inrecent years. A higher proportion of graduates from theEEA, particularly Spain and Greece, joined the medicalregister compared to IMGs [5]. Historically, the propor-tion of doctors in the UK who were IMGs was alwayshigher than EEA doctors. While EEA doctors only repre-sented a tenth of the total medical population in 2013,
their proportional increase is likely to be due to the eco-nomic downturn in southern Europe and the expansionof the EEA [6]. Similar trends have been noted else-where, including Germany [11] and Ireland [2]. Mean-while, changes to the UK’s immigration policy in 2010made it more difficult for IMGs to get an employmentvisa, perhaps explaining the decrease in the proportionjoining the register [12].The General Medical Council (GMC) are the UK’s
medical regulatory body responsible for protecting, pro-moting and maintaining the health and safety of thepublic. As part of this role, the GMC can investigate thefitness to practise of doctors working in the UK aboutwhich they receive complaints to ensure proper stan-dards in medical practice are upheld. Where the con-cerns relate to an aspect of the doctor’s performance(such as a basic lack of knowledge, poor clinical judge-ment, inappropriate prescribing, tendency to use out-dated techniques or poor record keeping), they may berequired to take a performance assessment. A perform-ance assessment may form one part of a wider investiga-tion into a doctor’s fitness to practise.The GMC holds data on all doctors who have under-
gone performance assessment as part of a Fitness toPractise investigation. Doctors under performance as-sessment usually undergo a peer review and test of com-petence [13, 14]. The test of competence is used toidentify potential gaps in a doctor’s knowledge base and/or their clinical skills. This includes a written knowledgetest using Single Best Answer format and an ObjectiveStructured Clinical Examination closely tailored to thedoctor’s grade, speciality and clinical work. The marksachieved by the doctor under investigation are comparedto the range of marks achieved by a comparison groupof doctors who have volunteered to take a similar test inthe same specialty [15]. Trained investigators at the
Table 1 UK licensing arrangements (while the UK is a member of the European Union)
Shorthand usedin this paper
Category and notes Countries (listed by population size) Licensing arrangements fordoctors working in the UK
UK doctors UK: current member of EU andEEA; due to leave EU; EEAmembership plans unknown
UK Can practise in the UK if qualifiedin one of these countries
EEA doctors Remainder of the European Union;all also in the EEA
Germany, France, Italy, Spain, Poland, Romania,Netherlands, Belgium, Greece, Czech Rep.,Portugal, Sweden, Hungary, Austria, Bulgaria,Denmark, Finland, Slovakia, Ireland, Croatia,Lithuania, Slovenia, Latvia, Estonia, Cyprus,Luxembourg, Malta
Remainder of the EEA; not inthe EU
Norway, Iceland, Liechtenstein
Former EEA member Switzerland
Internationalmedicalgraduates (IMGs)
Rest of the world Rest of the world Required to pass the Professionaland Linguistic Assessments Board(PLAB) test
Mehdizadeh et al. BMC Medical Education (2017) 17:67 Page 2 of 12
GMC use all of the above aspects of a performance as-sessment to reach a judgement about a doctor’s fitnessto practise. These data are collated from the LRMP andportfolios of each doctor that contains their personal in-formation, qualifications and details around their em-ployment history and clinical work.While the UK relies on foreign trained doctors to fill
shortages in the health service [8], their clinical perform-ance has been the subject of concern in recent years, ar-guably unfairly [16]. Poorer performance of IMGs inpostgraduate examinations in the UK has been reportedin numerous studies when compared to UK graduates[17, 18]. We also know that IMGs are more likely to becomplained about to the GMC and receive more severedisciplinary action than other doctors in Fitness to Prac-tise investigations [19, 20]. However concern has alsogrown around the performance of European trained doc-tors [20, 21]. This has been highlighted by high profilecases such as the German-trained doctor who killed apatient during his first locum shift in the UK, and aBosnian-trained obstetrician who caused the death of anew-born baby [22]. Evidence shows these are not iso-lated incidents. One study analysed results on part oneof the Royal College of Anaesthetists examination andproduced a list of countries of primary medical qualifica-tion (PMQ) that performed worse than UK graduates.While graduates from Egypt, Iraq and Pakistan per-formed worse, so did graduates from certain Europeancountries [23]. GMC statistics also report that men whograduated from a European medical school are at greaterrisk of being complained about to and/or disciplined bythe GMC [19]. In GMC Fitness to Practise hearings be-tween 2009 and 2012, higher proportions of EEA doc-tors were found to be impaired in their performancecompared to IMGs and UK graduates [24–27]. Further,an earlier study that analysed erasures and suspensionsfrom the List of Registered Medical Practitioners(LRMP) by country of medical qualification, found thatEuropean countries made up half of the top 20 countriesthat were more likely than the UK to have their gradu-ates be erased or suspended by the GMC [28].We note that this contrasts with the situation in the
US where a recent study found that patients treated byinternational graduates had lower mortality than patientscared for by US graduates [29] and international gradu-ates perform better in some exams [30].
Aim and purpose of studyGiven the recent and likely forthcoming changes to theUK’s medical register and the increasing concern aroundthe performance of non-UK medical graduates, we com-pared the demographics of the UK’s medical registerwith doctors who had undertaken a performance assess-ment with the GMC to determine whether country of
training predicts performance assessments and, if so,whether this might be explained by other factors. We fo-cussed on the prevalence of GMC performance assess-ments by country of PMQ. Data made available by theGMC allowed us to control for some additional factorsand examine performance in more detail than previousstudies.
MethodsThis was a retrospective cohort analysis of data routinelycollected by the GMC.We compared two sets of data:
1) a cohort of doctors who had a performanceassessment between 1996 and 2013.
2) the medical register (LRMP) between 1996 and2014.
Performance assessment data was only available up to2013, but LRMP data was additionally available for 2014.The cohorts were compared according to: sex, countryand year of primary medical qualification, specialty andage.
VariablesThe data on sex was complete for both cohorts. In orderto plot trends over time, we analysed the year the GMCreceived an enquiry about each doctor; this date markedthe start of their performance investigation. There were29 cases for which the enquiry year was missing. Wealso analysed the medical register at each year end.Data was available for the country and year doctors
gained their PMQ from. Data was also recorded on spe-cialty and age band.We did not have data on the outcome for those under
performance investigation. Investigations take some timeto complete and many were not complete at the time ofdata collection. From other GMC data, we know thatamong individuals who complete tests of competence,over half receive some kind of sanction, with roughlyequal numbers being cleared without sanction or volun-tarily withdrawing from the register [31].
Data analysisWe analysed the demographics of the two cohorts bycomparing frequency data. We focused our analysis ondoctors’ PMQ country, initially in the context of changesto the medical register over time. We then comparedthe rates of performance assessments over time by PMQcountry using negative binomial regression. This allowsus to consider country differences while adjusting forthe significant changes in the rate of assessments overtime.
Mehdizadeh et al. BMC Medical Education (2017) 17:67 Page 3 of 12
ResultsComparing performance assessment cases with medicalregisterWe compared the population of doctors under perform-ance assessment with doctors who were on the medicalregister. We show descriptive statistics in order to pro-vide due context for the analysis by country of training.Results for the earliest (1996) and latest (2014) years inthe data are shown in Table 1. Men and black minorityethnic doctors were over represented as compared tothe medical register. More than 80% of doctors underperformance assessment were above 40 years old, ascompared to the medical register where a large propor-tion of doctors are under 40. A significantly higher num-ber of surgeons and general practitioners had aperformance assessment as compared to the proportionlisted on the medical register as of 2014 (Table 2).
Comparing PMQ between performance assessment casesand medical registerDoctors on the medical register in 2014, the most recentyear of the data, received their PMQ from 149 differentstates or territories. Doctors under performance assess-ment from1996 to 2013 qualified from 58 states or terri-tories. Table 3 shows the 25 countries with the mostperformance assessments. Doctors on the medical regis-ter in 2014 most frequently graduated from the UK,India and Pakistan. The highest number of performanceassessments was also conducted on UK, Indian andPakistan graduates (Table 3).
Changes to the medical register over timeIt was necessary to place the performance assessmentdata in the context of changes that have happened to themedical register between 1996 and 2013. The rate of as-sessments depends on a denominator, the number ofdoctors trained in different countries, that has beenchanging rapidly. We summarise these changes inTable 4 and compared them to the proportion of per-formance assessments that have been conducted on doc-tors qualifying in the same regions. This gave us a senseof which places of qualification are over and underrepre-sented in the GMC’s performance assessments whencompared to the medical register. Based on the dataavailable, we decided to analyse the data for the follow-ing 16 countries and categories:
I). the UKII). the ten countries with the highest numbers of
registered doctors in 2014III).the ten countries with highest number of
performance assessments (which adds Bangladesh,Iraq and Sri Lanka in addition to the above)
IV).European Union (EU) 2004 accession states as ablock, i.e. countries that joined the EU in 2004,namely Cyprus, Czech Republic, Estonia, Hungary,Latvia, Lithuania, Malta, Poland, Slovakia, andSlovenia
V). a combined category for all other current EEAstates not otherwise covered plus Switzerland (i.e.,countries excluded from the Professional andLinguistics Assessment Board examination)
VI).rest of the world (ROW)
Small numbers prevented us from considering othercountries in detail.The total number of UK trained doctors has in-
creased on the medical register by 31% since 1996(from 125,486 to 164,691, Table 4). For other coun-tries, the largest absolute increase is Indian-traineddoctors, up 12,361(97%), with the largest fall beingAustralian-trained, down to 2868 (from 4834 in 1996
Table 2 Comparing demographics of doctors under GMC’sperformance assessment with UK medical register betweenyears 1996–2014
Doctors underperformanceassessmentbetween 1996and 2013
Doctors onmedicalregister in1996
Doctors onmedicalregister in2014
Sex M 919 (83%) 125,980 (69%) 148,562 (56%)
F 192 (17%) 56,570 (31%) 118,597 (44%)
Ethnicity
White 450 (41%) 72,909 (40%) 139,177 (52%)
Black minority ethnic 661 (59%) 19,419 (11%) 78,285 (29%)
Unknown 0 90,229 (49%) 49,697 (19%)
Age
21–30 17 (2%) 30,600 (17%) 42,790 (16%)
31–40 109 (10%) 47,422 (26%) 80,839 (30%)
41–50 257 (23%) 33,846 (19%) 67,322 (25%)
51–60 322 (29%) 20,893 (11%) 46,223 (17%)
61–70 208 (19%) 16,121 (9%) 19,733 (7%)
71–80 32 (3%) 8,087 (4%) 4,965 (2%)
81+ n/a 1,557 (<1%) 1,210 (<1%)
Unknown 163 (15%) 24,031 (13%) 4,077 (2%)
Specialty
Acute medicine 67 (6%) 4,441 (14%) 13,187 (9%)
Medicine 134 (12%) 10,311 (33%) 29,872 (20%)
Surgery 202 (18%) 7,063 (23%) 19,319 (13%)
Psychiatry 49 (4%) 3,581 (12%) 9,365 (6%)
GP 493 (44%) a n/a 65,127 (44%)
Other 20 (2%) 5,634 (18%) 11,088 (7%)
Unspecified 146 (13%) 0 0
TOTAL 1111 31,030 147,958a GP register only began in 2006
Mehdizadeh et al. BMC Medical Education (2017) 17:67 Page 4 of 12
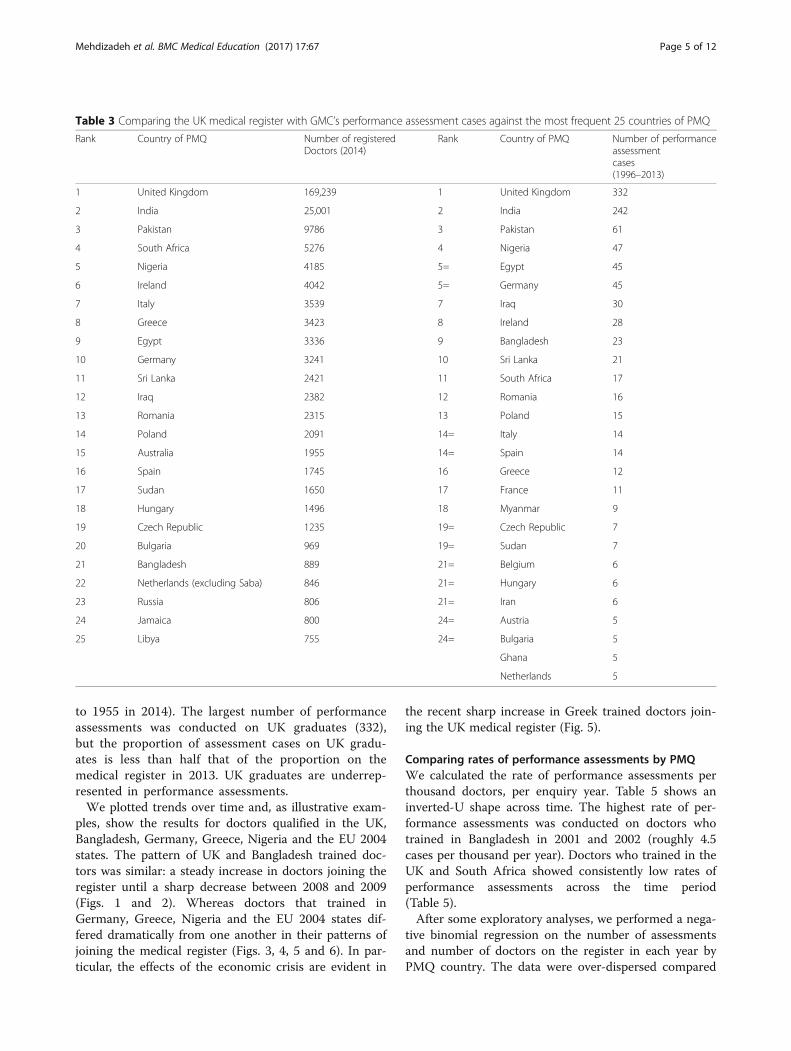
to 1955 in 2014). The largest number of performanceassessments was conducted on UK graduates (332),but the proportion of assessment cases on UK gradu-ates is less than half that of the proportion on themedical register in 2013. UK graduates are underrep-resented in performance assessments.We plotted trends over time and, as illustrative exam-
ples, show the results for doctors qualified in the UK,Bangladesh, Germany, Greece, Nigeria and the EU 2004states. The pattern of UK and Bangladesh trained doc-tors was similar: a steady increase in doctors joining theregister until a sharp decrease between 2008 and 2009(Figs. 1 and 2). Whereas doctors that trained inGermany, Greece, Nigeria and the EU 2004 states dif-fered dramatically from one another in their patterns ofjoining the medical register (Figs. 3, 4, 5 and 6). In par-ticular, the effects of the economic crisis are evident in
the recent sharp increase in Greek trained doctors join-ing the UK medical register (Fig. 5).
Comparing rates of performance assessments by PMQWe calculated the rate of performance assessments perthousand doctors, per enquiry year. Table 5 shows aninverted-U shape across time. The highest rate of per-formance assessments was conducted on doctors whotrained in Bangladesh in 2001 and 2002 (roughly 4.5cases per thousand per year). Doctors who trained in theUK and South Africa showed consistently low rates ofperformance assessments across the time period(Table 5).After some exploratory analyses, we performed a nega-
tive binomial regression on the number of assessmentsand number of doctors on the register in each year byPMQ country. The data were over-dispersed compared
Table 3 Comparing the UK medical register with GMC’s performance assessment cases against the most frequent 25 countries of PMQ
Rank Country of PMQ Number of registeredDoctors (2014)
Rank Country of PMQ Number of performanceassessmentcases(1996–2013)
1 United Kingdom 169,239 1 United Kingdom 332
2 India 25,001 2 India 242
3 Pakistan 9786 3 Pakistan 61
4 South Africa 5276 4 Nigeria 47
5 Nigeria 4185 5= Egypt 45
6 Ireland 4042 5= Germany 45
7 Italy 3539 7 Iraq 30
8 Greece 3423 8 Ireland 28
9 Egypt 3336 9 Bangladesh 23
10 Germany 3241 10 Sri Lanka 21
11 Sri Lanka 2421 11 South Africa 17
12 Iraq 2382 12 Romania 16
13 Romania 2315 13 Poland 15
14 Poland 2091 14= Italy 14
15 Australia 1955 14= Spain 14
16 Spain 1745 16 Greece 12
17 Sudan 1650 17 France 11
18 Hungary 1496 18 Myanmar 9
19 Czech Republic 1235 19= Czech Republic 7
20 Bulgaria 969 19= Sudan 7
21 Bangladesh 889 21= Belgium 6
22 Netherlands (excluding Saba) 846 21= Hungary 6
23 Russia 806 21= Iran 6
24 Jamaica 800 24= Austria 5
25 Libya 755 24= Bulgaria 5
Ghana 5
Netherlands 5
Mehdizadeh et al. BMC Medical Education (2017) 17:67 Page 5 of 12
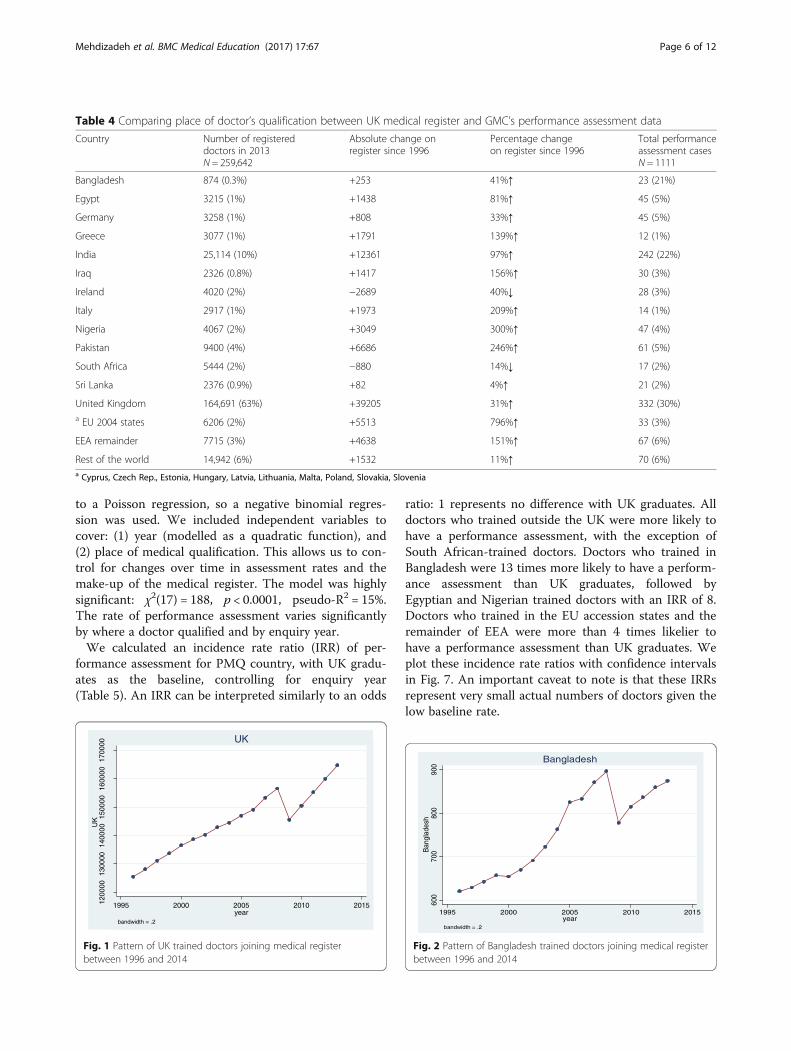
to a Poisson regression, so a negative binomial regres-sion was used. We included independent variables tocover: (1) year (modelled as a quadratic function), and(2) place of medical qualification. This allows us to con-trol for changes over time in assessment rates and themake-up of the medical register. The model was highlysignificant: χ2(17) = 188, p < 0.0001, pseudo-R2 = 15%.The rate of performance assessment varies significantlyby where a doctor qualified and by enquiry year.We calculated an incidence rate ratio (IRR) of per-
formance assessment for PMQ country, with UK gradu-ates as the baseline, controlling for enquiry year(Table 5). An IRR can be interpreted similarly to an odds
ratio: 1 represents no difference with UK graduates. Alldoctors who trained outside the UK were more likely tohave a performance assessment, with the exception ofSouth African-trained doctors. Doctors who trained inBangladesh were 13 times more likely to have a perform-ance assessment than UK graduates, followed byEgyptian and Nigerian trained doctors with an IRR of 8.Doctors who trained in the EU accession states and theremainder of EEA were more than 4 times likelier tohave a performance assessment than UK graduates. Weplot these incidence rate ratios with confidence intervalsin Fig. 7. An important caveat to note is that these IRRsrepresent very small actual numbers of doctors given thelow baseline rate.
Table 4 Comparing place of doctor’s qualification between UK medical register and GMC’s performance assessment data
Country Number of registereddoctors in 2013N = 259,642
Absolute change onregister since 1996
Percentage changeon register since 1996
Total performanceassessment casesN = 1111
Bangladesh 874 (0.3%) +253 41%↑ 23 (21%)
Egypt 3215 (1%) +1438 81%↑ 45 (5%)
Germany 3258 (1%) +808 33%↑ 45 (5%)
Greece 3077 (1%) +1791 139%↑ 12 (1%)
India 25,114 (10%) +12361 97%↑ 242 (22%)
Iraq 2326 (0.8%) +1417 156%↑ 30 (3%)
Ireland 4020 (2%) −2689 40%↓ 28 (3%)
Italy 2917 (1%) +1973 209%↑ 14 (1%)
Nigeria 4067 (2%) +3049 300%↑ 47 (4%)
Pakistan 9400 (4%) +6686 246%↑ 61 (5%)
South Africa 5444 (2%) −880 14%↓ 17 (2%)
Sri Lanka 2376 (0.9%) +82 4%↑ 21 (2%)
United Kingdom 164,691 (63%) +39205 31%↑ 332 (30%)a EU 2004 states 6206 (2%) +5513 796%↑ 33 (3%)
EEA remainder 7715 (3%) +4638 151%↑ 67 (6%)
Rest of the world 14,942 (6%) +1532 11%↑ 70 (6%)a Cyprus, Czech Rep., Estonia, Hungary, Latvia, Lithuania, Malta, Poland, Slovakia, Slovenia
1200
0013
0000
1400
0015
0000
1600
0017
0000
UK
1995 2000 2005 2010 2015year
bandwidth = .2
UK
Fig. 1 Pattern of UK trained doctors joining medical registerbetween 1996 and 2014
600
700
800
900
Ban
glad
esh
1995 2000 2005 2010 2015year
bandwidth = .2
Bangladesh
Fig. 2 Pattern of Bangladesh trained doctors joining medical registerbetween 1996 and 2014
Mehdizadeh et al. BMC Medical Education (2017) 17:67 Page 6 of 12
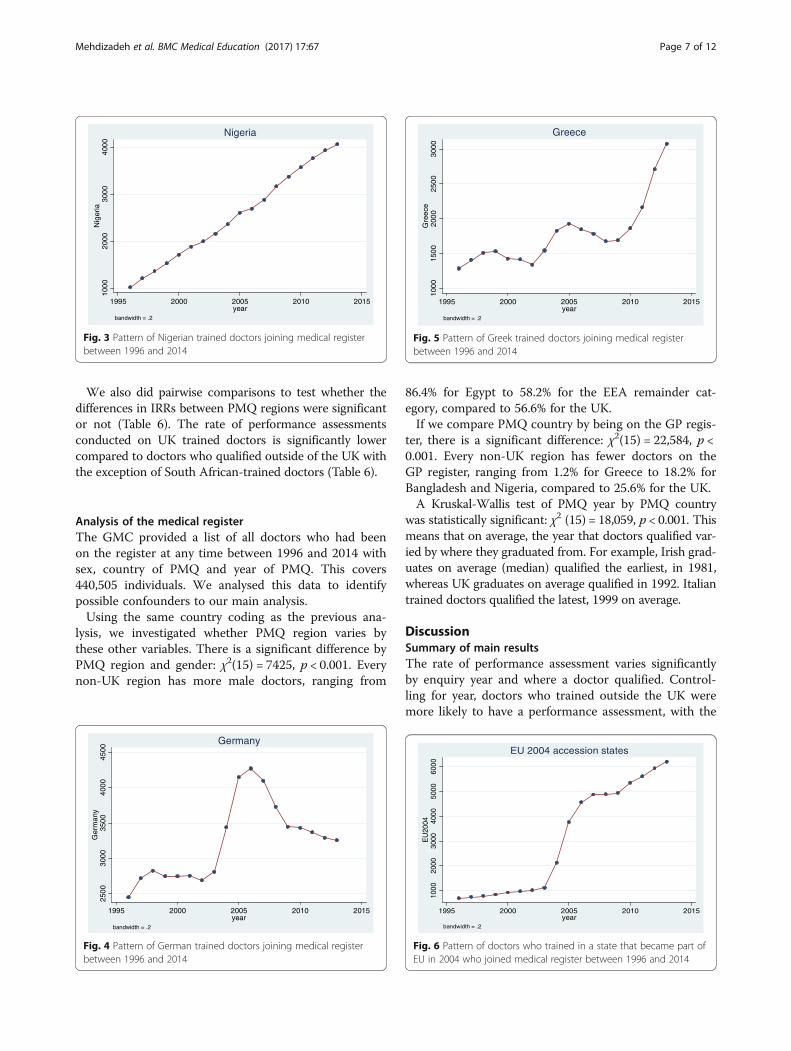
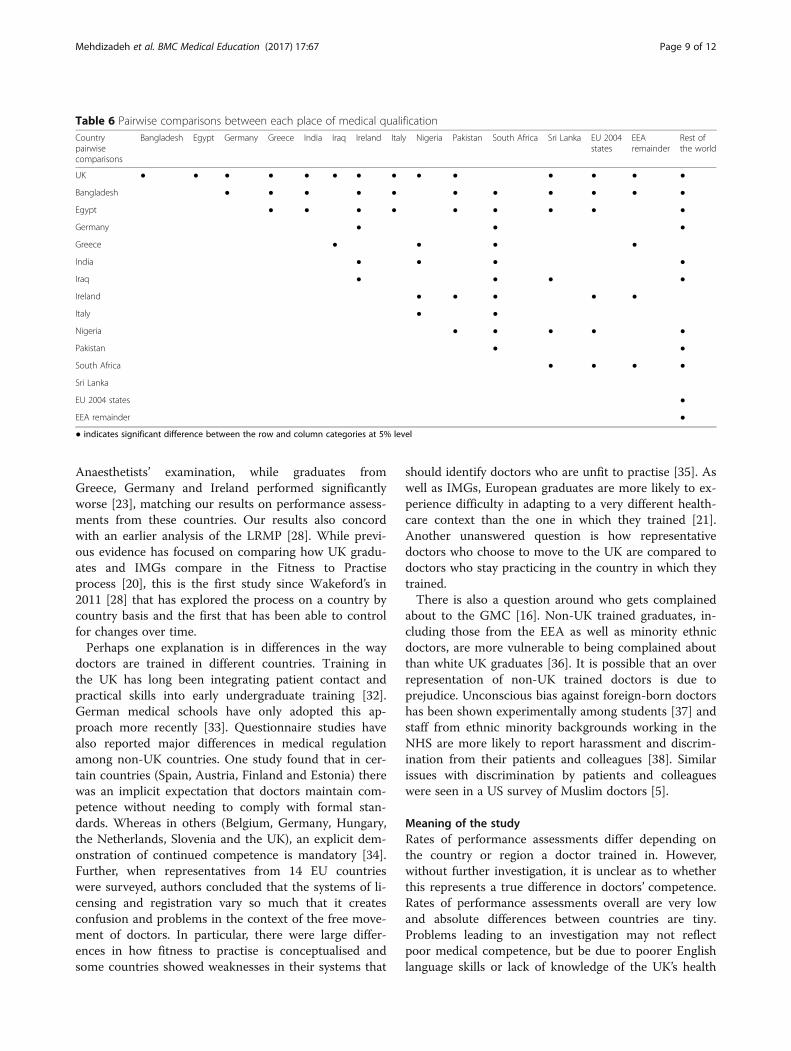
We also did pairwise comparisons to test whether thedifferences in IRRs between PMQ regions were significantor not (Table 6). The rate of performance assessmentsconducted on UK trained doctors is significantly lowercompared to doctors who qualified outside of the UK withthe exception of South African-trained doctors (Table 6).
Analysis of the medical registerThe GMC provided a list of all doctors who had beenon the register at any time between 1996 and 2014 withsex, country of PMQ and year of PMQ. This covers440,505 individuals. We analysed this data to identifypossible confounders to our main analysis.Using the same country coding as the previous ana-
lysis, we investigated whether PMQ region varies bythese other variables. There is a significant difference byPMQ region and gender: χ2(15) = 7425, p < 0.001. Everynon-UK region has more male doctors, ranging from
86.4% for Egypt to 58.2% for the EEA remainder cat-egory, compared to 56.6% for the UK.If we compare PMQ country by being on the GP regis-
ter, there is a significant difference: χ2(15) = 22,584, p <0.001. Every non-UK region has fewer doctors on theGP register, ranging from 1.2% for Greece to 18.2% forBangladesh and Nigeria, compared to 25.6% for the UK.A Kruskal-Wallis test of PMQ year by PMQ country
was statistically significant: χ2 (15) = 18,059, p < 0.001. Thismeans that on average, the year that doctors qualified var-ied by where they graduated from. For example, Irish grad-uates on average (median) qualified the earliest, in 1981,whereas UK graduates on average qualified in 1992. Italiantrained doctors qualified the latest, 1999 on average.
DiscussionSummary of main resultsThe rate of performance assessment varies significantlyby enquiry year and where a doctor qualified. Control-ling for year, doctors who trained outside the UK weremore likely to have a performance assessment, with the
1000
2000
3000
4000
Nig
eria
1995 2000 2005 2010 2015year
bandwidth = .2
Nigeria
Fig. 3 Pattern of Nigerian trained doctors joining medical registerbetween 1996 and 2014
2500
3000
3500
4000
4500
Ger
man
y
1995 2000 2005 2010 2015year
bandwidth = .2
Germany
Fig. 4 Pattern of German trained doctors joining medical registerbetween 1996 and 2014
1000
1500
2000
2500
3000
Gre
ece
1995 2000 2005 2010 2015year
bandwidth = .2
Greece
Fig. 5 Pattern of Greek trained doctors joining medical registerbetween 1996 and 2014
1000
2000
3000
4000
5000
6000
EU
2004
1995 2000 2005 2010 2015year
bandwidth = .2
EU 2004 accession states
Fig. 6 Pattern of doctors who trained in a state that became part ofEU in 2004 who joined medical register between 1996 and 2014
Mehdizadeh et al. BMC Medical Education (2017) 17:67 Page 7 of 12
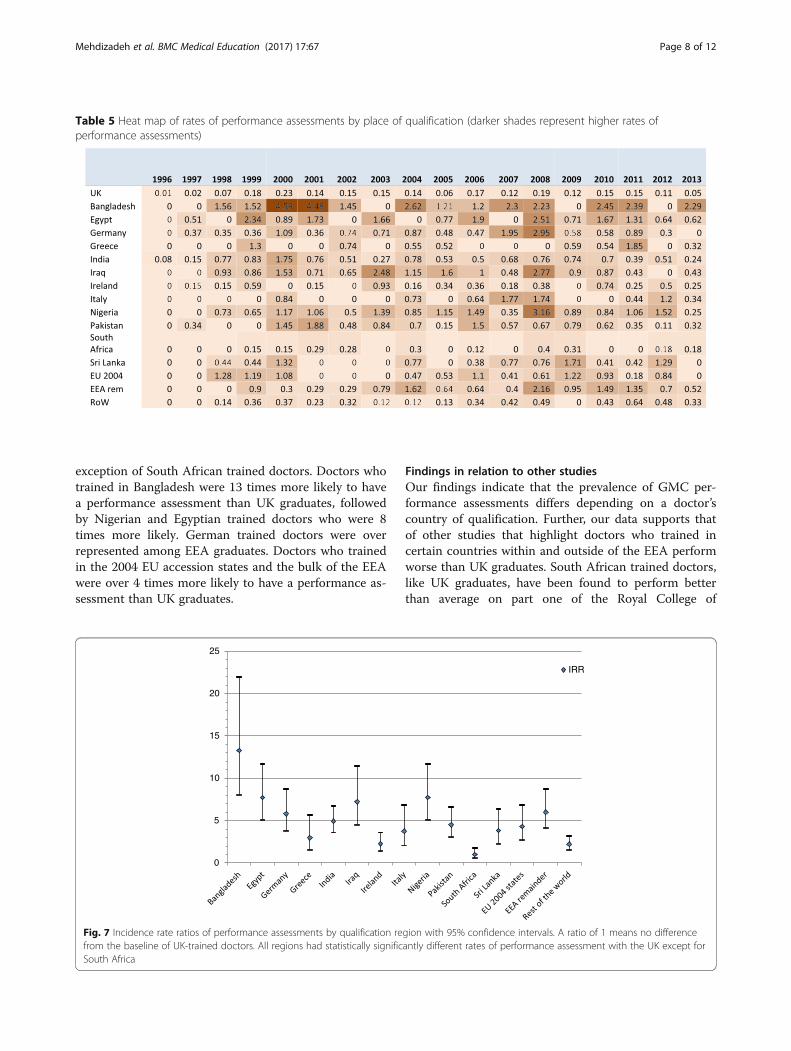
exception of South African trained doctors. Doctors whotrained in Bangladesh were 13 times more likely to havea performance assessment than UK graduates, followedby Nigerian and Egyptian trained doctors who were 8times more likely. German trained doctors were overrepresented among EEA graduates. Doctors who trainedin the 2004 EU accession states and the bulk of the EEAwere over 4 times more likely to have a performance as-sessment than UK graduates.
Findings in relation to other studiesOur findings indicate that the prevalence of GMC per-formance assessments differs depending on a doctor’scountry of qualification. Further, our data supports thatof other studies that highlight doctors who trained incertain countries within and outside of the EEA performworse than UK graduates. South African trained doctors,like UK graduates, have been found to perform betterthan average on part one of the Royal College of
Table 5 Heat map of rates of performance assessments by place of qualification (darker shades represent higher rates ofperformance assessments)
0
5
10
15
20
25
IRR
Fig. 7 Incidence rate ratios of performance assessments by qualification region with 95% confidence intervals. A ratio of 1 means no differencefrom the baseline of UK-trained doctors. All regions had statistically significantly different rates of performance assessment with the UK except forSouth Africa
Mehdizadeh et al. BMC Medical Education (2017) 17:67 Page 8 of 12
Anaesthetists’ examination, while graduates fromGreece, Germany and Ireland performed significantlyworse [23], matching our results on performance assess-ments from these countries. Our results also concordwith an earlier analysis of the LRMP [28]. While previ-ous evidence has focused on comparing how UK gradu-ates and IMGs compare in the Fitness to Practiseprocess [20], this is the first study since Wakeford’s in2011 [28] that has explored the process on a country bycountry basis and the first that has been able to controlfor changes over time.Perhaps one explanation is in differences in the way
doctors are trained in different countries. Training inthe UK has long been integrating patient contact andpractical skills into early undergraduate training [32].German medical schools have only adopted this ap-proach more recently [33]. Questionnaire studies havealso reported major differences in medical regulationamong non-UK countries. One study found that in cer-tain countries (Spain, Austria, Finland and Estonia) therewas an implicit expectation that doctors maintain com-petence without needing to comply with formal stan-dards. Whereas in others (Belgium, Germany, Hungary,the Netherlands, Slovenia and the UK), an explicit dem-onstration of continued competence is mandatory [34].Further, when representatives from 14 EU countrieswere surveyed, authors concluded that the systems of li-censing and registration vary so much that it createsconfusion and problems in the context of the free move-ment of doctors. In particular, there were large differ-ences in how fitness to practise is conceptualised andsome countries showed weaknesses in their systems that
should identify doctors who are unfit to practise [35]. Aswell as IMGs, European graduates are more likely to ex-perience difficulty in adapting to a very different health-care context than the one in which they trained [21].Another unanswered question is how representativedoctors who choose to move to the UK are compared todoctors who stay practicing in the country in which theytrained.There is also a question around who gets complained
about to the GMC [16]. Non-UK trained graduates, in-cluding those from the EEA as well as minority ethnicdoctors, are more vulnerable to being complained aboutthan white UK graduates [36]. It is possible that an overrepresentation of non-UK trained doctors is due toprejudice. Unconscious bias against foreign-born doctorshas been shown experimentally among students [37] andstaff from ethnic minority backgrounds working in theNHS are more likely to report harassment and discrim-ination from their patients and colleagues [38]. Similarissues with discrimination by patients and colleagueswere seen in a US survey of Muslim doctors [5].
Meaning of the studyRates of performance assessments differ depending onthe country or region a doctor trained in. However,without further investigation, it is unclear as to whetherthis represents a true difference in doctors’ competence.Rates of performance assessments overall are very lowand absolute differences between countries are tiny.Problems leading to an investigation may not reflectpoor medical competence, but be due to poorer Englishlanguage skills or lack of knowledge of the UK’s health
Table 6 Pairwise comparisons between each place of medical qualificationCountrypairwisecomparisons
Bangladesh Egypt Germany Greece India Iraq Ireland Italy Nigeria Pakistan South Africa Sri Lanka EU 2004states
EEAremainder
Rest ofthe world
UK ● ● ● ● ● ● ● ● ● ● ● ● ● ●
Bangladesh ● ● ● ● ● ● ● ● ● ● ●
Egypt ● ● ● ● ● ● ● ● ●
Germany ● ● ●
Greece ● ● ● ●
India ● ● ● ●
Iraq ● ● ● ●
Ireland ● ● ● ● ●
Italy ● ●
Nigeria ● ● ● ● ●
Pakistan ● ●
South Africa ● ● ● ●
Sri Lanka
EU 2004 states ●
EEA remainder ●
● indicates significant difference between the row and column categories at 5% level
Mehdizadeh et al. BMC Medical Education (2017) 17:67 Page 9 of 12
service. Performance investigation is not a reflection ofpoor performance alone but also of complaints patterns,which could indicate prejudice in the system.Our findings suggest concern not only with IMGs but
also European-trained doctors given that they were signifi-cantly more likely to have a GMC performance assess-ment than doctors trained in the UK, South Africa andour “rest of the world” category. One qualitative studyfound that European trained doctors reported similar diffi-culties to IMGs when adapting to practising medicine inthe UK’s healthcare setting and medical regulatory system[39]. European law has prevented the selective testing ofdoctors trained in an EEA country that is different to howUK trained doctors are tested. There is currently nomandatory assessment process to check the competenceof EEA medical graduates before their UK medical licenceis granted, although we note that EEA graduates who havenot done the PLAB broadly did no worse than IMGs whohave done the PLAB. The GMC is going to introduce amedical licensing assessment that will be mandatory forUK graduates and IMGs prior to their registration. It wasunlikely that the elements of this planned assessmentcould have been enforced on European graduates givenEuropean laws around free movement [19, 40]. Currently,the GMC can only seek evidence of sufficient Englishlanguage skills in European graduates and can refuse togrant a licence to practise where this is not provided [41].All this may change in a post-Brexit regulatory environ-ment that is yet to be determined. Further analysis of thistopic is needed rapidly to inform decision making.We also note that not all overseas trained doctors
were more likely to have a performance assessment.South African trained doctors were no more likely tohave a performance assessment than UK trained doctors.While there were too few Hong Kong trained doctors toinclude separately in the main analysis—their numbershave decreased from 2730 to 614 between 1996 and2013—we note none had a performance assessment.Therefore it is a matter of further investigation as towhy doctors from certain countries or regions might bemore at risk than others of being investigated by theGMC due to performance concerns.
Strengths and weaknesses of the studyThis is the first study to explore whether place of medicalqualification on a country by country basis affects the like-lihood of having a GMC performance assessment. Weurge caution in the interpretation of our findings. It is nottrue that all doctors who qualified outside the UK aremore likely to have a GMC performance assessment andthose doctors who have an investigation for performanceconcerns represent a tiny minority of overseas traineddoctors. While the incidence rate ratios appear large forsome PMQ countries, the number of doctors investigated
for each PMQ country is low and absolute differences be-tween countries are tiny. The results are further compli-cated because a performance investigation is not areflection of poor performance alone but also of who getscomplained about and how severe the complaint is. A pro-portion of doctors under performance investigation arefound to be fit to practise. It is also likely that some doc-tors may show performance concerns but that they are be-ing managed locally and do not meet the GMC’sthreshold for an investigation. To unpack these factors re-quires data that we did not have on referral patterns byPMQ country or final outcome of the investigation.We know that doctors’ sex [42] and age [43] affect per-
formance and those factors vary by where a doctortrained in our analysis of the register data. We also knowthat complaints vary by specialty, which also varies bywhere a doctor trained. We have not been able to adjustfor these confounders. Therefore differences betweenPMQ countries may be explainable in terms of the doc-tors who trained in a particular country having a differ-ent profile in terms of sex, age and specialty.
ConclusionsFrom 1996 to 2013, doctors that trained outside of theUK, including EEA countries, had significantly higherrates of GMC performance assessments than UK-traineddoctors. The reasons for this are unclear without furtherinvestigation. Poor performance can manifest itself inmany forms some of which include poor clinical know-ledge, English language skills and a misunderstanding ofpatient’s culture or the UK’s healthcare settings. Factorssuch as sex, age and specialty of doctors are likely to beconfounding variables. If differences persisted after con-trolling for these factors, it could reflect true differences incompetency, standards of medical training and/or certifi-cation between different countries, or it could reflect dif-ferent treatment of this group by society and employers[16]. Whether differences by country of training reflectdifferences in the ability of some doctors, or biases in sys-tems of performance evaluation, this is an importantphenomenon that further research needs to explain.There may be implications for transnational agreements
on freedom of movement of healthcare professionals, andfor what testing is required by national governments of in-dividuals trained elsewhere. With the UK having to nego-tiate new arrangements after exiting the EU, suchquestions have become more urgent. Research in the UKcan also inform the situation in other countries facingsimilar political, economic and social pressures. In themeantime, patients should be reassured that the vast ma-jority of doctors working in the UK, irrespective of wherethey trained, are competent, and indeed highly skilled.Further, the NHS could not function without foreign-trained doctors or other healthcare professionals.
Mehdizadeh et al. BMC Medical Education (2017) 17:67 Page 10 of 12
AbbreviationsEEA: European Economic Area; EU: European Union; GMC: General MedicalCouncil; IMG: International Medical Graduate; IRR: Incidence rate ratio;LRMP: List of Registered Medical Practitioners; NHS: National Health Service;PLAB: Professional and Linguistics Assessments Board; PMQ: Primary medicalqualification; ROW: Rest of the world; UK: United Kingdom
FundingThis study was funded by the UK’s medical regulator, the GMC. Theyprovided the data and approved the manuscript’s final version for journalsubmission.
Availability of data and materialsDue to our confidentiality agreement with the GMC, no additional data ormaterials are available.
Authors’ contributionsAll authors contributed to the study’s design. LM and HWWP performed thedata analysis and LM wrote the first draft of the manuscript. All authorscontributed to the revised draft manuscripts and approved its final version.
Competing interestsAll authors have completed the Unified Competing Interest form atwww.icmje.org/coi_disclosure.pdf (available on request from thecorresponding author) and declare that LM, AS and JD work on a long-termresearch project within UCL that is externally funded by the GMC, whosupported this work. HWWP acts as an external consultant for this researchcollaboration between UCL and the GMC.
Consent for publicationNot applicable.
Ethics approval and consent to participateThe study received ethical approval from UCL Research Ethics Committee, ref6281/001. Data was made available by the GMC; consent from individualswas not sought.
Publisher’s NoteSpringer Nature remains neutral with regard to jurisdictional claims inpublished maps and institutional affiliations.
Author details1University College London Medical School, Royal Free Hospital, room GF/664, Hampstead, London NW3 2PF, UK. 2UCL Institute of Health Informatics,222 Euston Road, London NW1 2DA, UK. 3Royal College of Physicians, 11 StAndrews Place, Regent’s Park, London NW1 4LE, UK.
Received: 1 July 2016 Accepted: 15 March 2017
References1. Appleby J. Healthcare and the EU: Brexit, Bremain … or Brundecided? BMJ.
2016;353:i2328.2. Bidwell P, Humphries N, Dicker P, Thomas S, Normand C, Brugha R. The
national and international implications of a decade of doctor migration inthe Irish context. Health Policy. 2013;110(1):29–38.
3. Gilnos I. Going beyond numbers: A typology of health professional mobilityinside and outside the European Union. Policy Society. 2014;33(1):25–37.
4. Aluttis C, Bishaw T, Frank MW. The workforce for health in a globalized context –global shortages and international migration. Glob Health Action. 2014;7:23611.
5. Padela AI, Adam H, Ahmad M, Hosseinian Z, Curlin F. Religious identity andworkplace discrimination: A national survey of American Muslim physicians.AJOB Empirical Bioethics 2015. DOI: 10.1080/23294515.2015.1111271
6. Sun LH. American Muslim doctors feel greater scrutiny, even patients’suspicions. The Washington Post, 11 December 2015. https://www.washingtonpost.com/news/to-your-health/wp/2015/12/11/american-muslim-doctors-feel-greater-scrutiny-even-patients-suspicions/. Accessed 21 Mar 2017.
7. Tobias AJ. Group including Cleveland doctors organizing protest march overDonald Trump’s Muslim rhetoric during Republican National Convention.Cleveland.com, 20 May 2016, http://www.cleveland.com/rnc-2016/index.ssf/2016/05/group_of_cleveland_physicians.html. Accessed 21 Mar 2017.
8. Godlee F, Abbasi K, Gulland A, Coombes R. Why doctors should vote toremain in the EU on 23 June. BMJ. 2016;353:i3302.
9. Gulland A. What would the NHS look like if the UK left the EU? BMJ. 2016;353:i3027.
10. Gulland A. Brexit plan has few details on securing health workers fromabroad. BMJ. 2017;356:j614.
11. Klein J. Migration of Central Eastern European Physicians to Germany: AnEmpirical Description of the Field. In: Pilati M, Sheikh H, Sperotti F, Tilly C,editors. How Global Migration Changes the Workforce Diversity Equation.Newcastle upon Tyne: Cambridge Scholars Publishing; 2015. p. 101–25.
12. General Medical Council. The State of Medical Education and Practice in theUK. 2013.
13. Sturrock A, Conlon L, Hatch D, Dacre J. The GMC’s Tests of Competence -what happens now? Clin Teach. 2006;3(1):9–12.
14. Sales D, Sturrock A, Boursicot K, Dacre J. Blueprinting for clinicalperformance deficiencies – Lessons and principles from the General MedicalCouncil’s fitness to practise procedures. Med Teach. 2010;32:e111–4.
15. Dacre J, Potts HWW, Sales D, Spencer H, Sturrock A. The development of anew method of knowledge assessment: Tailoring a test to a doctor’s area ofpractice. Acad Med. 2009;84(8):1003–7.
16. Esmail A, Simpson J. International medical graduates and quality of care.BMJ. 2017;356:j574.
17. Esmail A, Roberts C. Academic performance of ethnic minority candidatesand discrimination in the MRCGP examinations between 2010 and 2012:Analysis of data. BMJ. 2013;347:f5662.
18. McManus IC, Wakeford R. PLAB and UK graduates’ performance onMRCP(UK) and MRCGP examinations: data linkage study. BMJ. 2014;348:g2621.
19. General Medical Council. The State of Medical Education and Practice in theUK. 2014.
20. Humphrey C, Hickman S, Gulliford MC. Place of medical qualification andoutcomes of UK General Medical Council “fitness to practise” process:cohort study. BMJ. 2011;340:d1817.
21. Legido-Quidley H, Salibab V, McKee M. Exploring the experiences of EUqualified doctors working in the United Kingdom: A qualitative study.Health Policy. 2015;119:494–502.
22. Dyer O. Registrar who used excessive force in forceps delivery is struck offthe medical register. BMJ. 2008;336(7651):983.
23. Watmough S, Bowhay A. An evaluation of the impact of country of primarymedical qualification on performance in the UK Royal College ofAnaesthetists’ examinations. Med Teach. 2011;33:938–40.
24. General Medical Council. Primary Medical Qualification. FTP Fact Sheet.2009.
25. General Medical Council. Primary Medical Qualification. FTP Fact Sheet.2010.
26. General Medical Council. Primary Medical Qualification. FTP Fact Sheet.2011.
27. General Medical Council. Primary Medical Qualification. FTP Fact Sheet.2012.
28. Wakeford R. Who gets struck off? BMJ. 2011;343:d7842. doi:10.1136/bmj.d7842.
29. Tsugawa Y, Jena AB, Orav EJ, Jha AK. Quality of care delivered by generalinternists in US hospitals who graduated from foreign versus US medicalschools: observational study. BMJ. 2017;356:j273.
30. Garibaldi RA, Subhiyah R, Moore ME, Waxman H. The In-TrainingExamination in Internal Medicine: An analysis of resident performance overtime. Ann Intern Med. 2002;137(6):505–10.
31. GMC 2014: Council GM. Guidance on making decisions on voluntary erasureapplications. GMC. 2014. http://www.gmc-uk.org/voluntary_erasure_guidance.pdf_25416412.pdf. Accessed 05/01/2017 2017
32. Harden R. The integration ladder: a tool for curriculum planning andevaluation. Med Educ. 2000;34:551–7.
33. Chenot JF. Undergraduate medical education in Germany. GMS GermanMed Sci. 2009;7:Doc02.
34. Sole M, Dimitra P, Risso-Gill I, Doring N, Busse R, McKee M, Legido-QuigleyH. How do medical doctors in the European Union demonstrate that theycontinue to meet criteria for registration and licencing? Clin Med. 2014;14(6):633–9.
35. Kovacs E, Schmidt AE, Szocska G, Busse R, McKee M, Legido-Quigley H.Licensing procedures and registration of medical doctors in the EuropeanUnion. Clin Med. 2014;14(3):229–38.
Mehdizadeh et al. BMC Medical Education (2017) 17:67 Page 11 of 12
36. General Medical council. The State of Medical Education and Practice in theUK. 2015.
37. Louis WR, Lalonde RN, Esses VM. Bias against foreign-born or foreign-traineddoctors: experimental evidence. Med Educ. 2010;44:1241–7. doi:10.1111/j.1365-2923.2010.03769.x.
38. NHS England. NHS Workforce Race Equality Standard: 2015 Data AnalysisReport for NHS Trusts. NHS Equality and Diversity Council. 2016. https://www.england.nhs.uk/wp-content/uploads/2014/10/WRES-Data-Analysis-Report.pdf. Accessed 21 Mar 2017.
39. Slowther A, Lewando Hundt GA, Purkis J, Taylor R. Experiences of non-UK-qualified doctors working within the UK regulatory: a qualitative study. J RSoc Med. 2012;105:157–65. doi:10.1258/jrsm.2011.110256.
40. Gulland A. GMC proposes single test for all doctors wishing to work in UK.BMJ. 2015;350:h3094.
41. Rimmer A. Language tests for EU doctors set to start in June. BMJ Careers.2014. http://careers.bmj.com/careers/advice/Language_tests_for_EU_doctors_set_to_start_in_June. Accessed 21 Mar 2017.
42. Unwin E, Woolf K, Wadlow C, Potts HWW, Dacre J. Sex differences inmedico-legal action against doctors: a systematic review and meta-analysis.BMC Med. 2015;13:172. doi:10.1186/s12916-015-0413-5.
43. Mehdizadeh L, Sturrock A, Dacre J. Are the General Medical Council’s Testsof Competence fair to long standing doctors? A retrospective cohort study.BMC Med Educ. 2015;15:80. doi:10.1186/s12909-015-0362-x.
• We accept pre-submission inquiries
• Our selector tool helps you to find the most relevant journal
• We provide round the clock customer support
• Convenient online submission
• Thorough peer review
• Inclusion in PubMed and all major indexing services
• Maximum visibility for your research
Submit your manuscript atwww.biomedcentral.com/submit
Submit your next manuscript to BioMed Central and we will help you at every step:
Mehdizadeh et al. BMC Medical Education (2017) 17:67 Page 12 of 12