Embed Size (px)
Citation preview

Prevalence of Hearing Impairment by Gender andAudiometric Configuration: Results from the NationalHealth and Nutrition Examination Survey(1999–2004) and the Keokuk County Rural HealthStudy (1994–1998)DOI: 10.3766/jaaa.19.9.3
Lindsay Ciletti*
Gregory A. Flamme*
Abstract
Purpose: This study describes the most common audiometric configurations and the prevalence of
these configurations among adults (ages 20 to 69) in the noninstitutionalized population of the UnitedStates and in a sample of residents of a rural county in Iowa.
Research Design: This was a cross-sectional population-based study.
Study Sample: Estimates generalizing to the noninstitutionalized population of the United States werebased on National Health and Nutrition Examination Survey (NHANES) data collected from 2819
women and 2525 men between 1999 and 2004. Estimates from the rural county were based on KeokukCounty Rural Health Study (KCRHS) data collected from 892 women and 750 men between 1994 and
1998.
Data Collection and Analysis: Cluster analyses (k-means) were used to divide participants into groups
including maximally similar bilateral air conduction audiograms. Separate cluster analyses were
conducted for each gender. For NHANES data, prevalence and error estimates were obtained usingsample weights intended to provide data generalizing to the noninstitutionalized population of the United
States within this age range.
Results: The hierarchical structure of audiometric configurations revealed that approximately 25% of
women and 50% of men aged 20 to 69 in the noninstitutionalized population of the United States werebest described by a configuration consistent with a marked hearing impairment in at least one
frequency. Hearing impairments were more common among participants in the KCRHS. Gently slopingconfigurations of hearing impairment were dominant among women, while configurations featuring a
greater slope were dominant among men. There was a greater variety of audiometric configurations inmen than women.
Conclusions: In addition to their descriptive value, these data can be used to inform future studies ofrisk factors and progression of hearing loss, and to improve the generalizability of studies involving
rehabilitative options for people with hearing impairment.
Key Words: Hearing impairment classification, epidemiology, NHANES, prevalence, public health
statistics, pure tone audiometry, rural health, sex distribution
Abbreviations: BD 5 bulge depth; HTL 5 hearing threshold level; KCRHS 5 Keokuk County RuralHealth Study; NHANES 5 National Health and Nutrition Examination Survey
Gregory A. Flamme, Department of Speech Pathology and Audiology, Western Michigan University, 1903 W. Michigan Ave., Kalamazoo, MI49008; Phone: 269-387-8067; Fax: 269-387-8044; E-mail: [email protected]
Portions of this article were presented at the American Auditory Society Annual Meeting, March 4, 2007, Scottsdale, AZ.
*Department of Speech Pathology and Audiology, Western Michigan University
J Am Acad Audiol 19:672–685 (2008)
672

Sumario
Proposito: Este estudio describe las configuraciones audiometricas mas comunes y la prevalencia deestas configuraciones entre adultos (edades de 20 a 69 anos) en la poblacion no institucionalizada de
los Estados Unidos y en una muestra de residentes del area rural de Iowa.
Diseno de la Investigacion: Este fue un estudio de corte transversal basado en la poblacion.
Muestra del Estudio: Los resultados que establecen generalizacion en relacion con la poblacion no
institucionalizada de los Estados Unidos se basaron en los datos de la Encuesta Nacional paraExaminar Salud y Nutricion (NHANES), colectados de 2819 mujeres y 2525 hombres entre 1999 y el
2004. Los estimados de la comunidad rural se basaron en los datos del Estudio de Salud Rural delCondado de Keokuk (KCRHS), colectados de 892 mujeres y 750 hombres entre 1994 y 1998.
Recoleccion y Analisis de los Datos: Se uso analisis de agrupaciones (medianas k) para dividir los
participantes en grupos, incluyendo los audiogramas de conduccion aerea mas similares
bilateralmente. Se condujeron estudio separados de agrupacion para cada genero. Para los datosdel NHANES, se obtuvieron estimados de prevalencia y error usando ponderaciones de muestra con la
intencion de generalizarlo a la poblacion no institucionalizada de los Estados Unidos en este rango deedades.
Resultados: La estructura jerarquica de las configuraciones audiometricas revelo que aproximada-
mente 25% de las mujeres y 50% de los hombres en edades entre los 20 y los 69, en la poblacion noinstitucionalizada de los Estados Unidos quedo mejor descrita por una configuracion consistente con
una trastorno auditivo marcado, en al menos una frecuencia. Los trastornos auditivos fueron mascomunes entre los participantes en el KCRHS. Las configuraciones audiometricas con pendientes
suaves fueron predominantes entre las mujeres, mientras que aquellas configuraciones mostrandocaıdas con mayor pendiente dominaron entre los hombres. Existio una mayor variedad de
configuraciones audiometricas entre los hombres que en las mujeres.
Conclusiones: Ademas de los valores descriptivos, estos datos pueden ser utilizados para
documentar estudios futuros de factores de riesgo y progresion de la hipoacusia, y para mejorar losaspectos de generalizacion de estudios incluyendo opciones de rehabilitacion para personas con
trastornos auditivos.
Palabras Clave: Clasificacion de trastornos auditivos, epidemiologıa, NHANES, prevalencia,estadısticas de salud publica, audiometrıa de tonos puros, salud rural, distribucion por sexo
Abreviaturas: BD 5 profundidad del bulto; HTL 5 nivel umbrales de audicion; KCRHS 5 Estudio de
Salud Rural del Condado de Keokuk; NHANES 5 Encuesta Nacional para Examinar Salud y Nutricion
This study was motivated by a desire to better
know the hearing status of the general popula-
tion in terms of audiometric configuration.
Clinicians and researchers are aware that a listener’s
audiometric configuration influences the real-life con-
sequences and the availability of rehabilitative options.
But there is little or no research describing the
configurations present in unscreened populations.
Most research on the epidemiology of hearing loss
involves the use of pure tone threshold distributions at
individual frequencies or averaged pure tone thresh-
olds. Despite their usefulness in the identification of
hearing impairment trends over time, threshold data
at individual frequencies and average thresholds can
obscure differences among listeners that have impor-
tant implications pertaining to etiology and rehabili-
tation.
Two approaches have been used to classify individ-
uals based on audiometric configuration. In one
approach, the investigators identify the classes of
configurations expected to describe the population
and assign data from each case to a configuration
based on their similarity to the nearest class (Brockett
and Schow, 2001; Pittman and Stelmachowicz, 2003;
Hederstierna et al, 2007). Studies using this approach
have tended to limit the number of configurations to
eight or fewer, and any reported configuration preva-
lence data have not been based on samples of
unscreened populations. The largest such study (Pitt-
man and Stelmachowicz, 2003) classified the audio-
grams of six-year-old children and 60-year-old adults
into sloping, rising, flat, U-shaped, tent-shaped, and
one additional category, to which participants were
assigned in the case that their audiometric configura-
tion did not fit any other class. The operational
definitions of the sloping and rising configurations
were based on a 20 dB difference between the
thresholds at 0.25 and 8 kHz. A configuration was
defined as flat when all thresholds were present within
a 20 dB range. U-shaped and tent-shaped were
identified by the presence of at least one threshold
between 0.5 and 4 kHz that was 20 dB different from
the worse or better threshold, respectively, at 0.25 or
8 kHz. Results from the Pittman and Stelmachowicz
Prevalence of Audiometric Configurations/Ciletti and Flamme
673

(2003) study revealed that 73% of the adult partici-
pants in that study were best described as having
either sloping or U-shaped configurations.
The approach of applying configuration definitions
developed a priori yields results with an appealing
simplicity. However, this approach may not be the
most productive if one’s intent is to describe the
characteristics of an unscreened population. For
example, adults in the Pittman and Stelmachowicz
study were predominantly assigned to the sloping
configuration (50%), but many hearing losses differing
in audiometric shape and degree would fit within this
classification even though the causes, needs, and
problems in daily life faced by these individuals would
likely be different. In addition, subclasses of audio-
metric configurations must be identified manually via
the addition of new definitions post hoc.
An alternative approach to the identification of the
principal audiometric configurations in a population
involves examining audiometric patterns and grouping
similar configurations without first specifying the
audiometric configurations of interest. This analytic
strategy, which uses a family of techniques called
cluster analysis, is particularly useful when the
existing literature provides little information about
the variety of patterns present in the data (Waller, et
al, 1998). In order to identify the typical amplification
needs of children with hearing impairment enrolled in
special education schools in Hong Kong, Yuen and
McPherson (2002) used a k-means cluster analysis
technique to divide a group of over 200 schoolchildren
into five groups, each having different amplification
needs.
Cluster analysis is an iterative method by which
each case in a sample is assigned membership in the
group that most closely matches the data profile of that
case. The k-means approach to cluster analysis can be
used to organize audiometric data into groups, or
clusters. Each resulting cluster is represented by the
audiometric configuration that best represents the
subsample.
The purpose of the current study was to describe and
estimate the prevalence of the predominant audiomet-
ric configurations present in unscreened adult popula-
tions and to examine the extent to which the
prevalence of each configuration differed between the
two sources of data used in this study. Analyses were
stratified by gender to account for differences in results
between men and women. Gender differences in the
severity and prevalence of hearing loss have been
identified in prior research (e.g., Borchgrevink et al,
2005), and prior research on gender-related differences
in audiometric slope among the elderly revealed a
trend toward more gently sloping audiometric shapes
among women (Jerger et al, 1993). We felt it was
important that systematic gender-based differences
were not obscured by analyses of data collapsed across
gender.
The two sources of data for the present study were
the National Health and Nutrition Examination
Survey (NHANES) and the Keokuk County Rural
Health Study (KCRHS). The NHANES dataset was
selected because it produced results that generalize to
the noninstitutionalized U.S. population, after rele-
vant aspects of the NHANES study design have been
taken into account (National Center for Health
Statistics, 2006). NHANES is an ongoing national
survey conducted in two-year cycles to determine the
health status of noninstitutionalized U.S. residents.
Individuals invited to participate in the NHANES were
selected based on a complex multistage probability
sample involving multiple levels of stratification and
sampling groups. The sampling frame used in
NHANES divided the United States into communities
and then further divided the communities into neigh-
borhoods based on most recent census information.
Households were randomly selected from the selected
neighborhoods and participants were chosen from
randomly selected households. All household members
were interviewed, but not all were selected to partic-
ipate. The NHANES data include sampling weights,
which relate to the degree of influence each participant
has on resulting estimates of health status in the
population. Many health domains are assessed in the
NHANES, but comprehensive data are not obtained
from all participants. For example, audiometry data
were obtained on only a subset of NHANES partici-
pants.
The KCRHS is an ongoing 20-year prospective cohort
study designed to examine the health and consequenc-
es of injuries in a rural population. The KCRHS
dataset was chosen because it is a large-scale study
wherein comprehensive data are obtained on all
participants. Approximately 25% of the U.S. popula-
tion resides in a rural area (Hewitt, 1989). The rates of
hearing impairment among residents of rural areas
may not be well represented by the national estimates
produced using the NHANES data because greater
exposure to noise and other potential risk factors for
hearing impairment can be expected in rural popula-
tions, where most participants engage in farming at
some point in their lives (Merchant et al, 2002). The
differences between prevalence estimates from
NHANES and KCRHS data help identify the types of
audiometric configurations that are more or less
affected by the risk factor profiles that are more
commonly found among residents of rural areas.
Participants in the KCRHS came from a rural Iowa
county with a total population of approximately 11,000
(U.S. Census Bureau, 2007) where no town population
exceeded 2,500 at the time the study began in the early
1990s. The KCRHS included participants (aged 8 to 92
Journal of the American Academy of Audiology/Volume 19, Number 9, 2008
674

years) from whom data are collected every five years.
Data were collected via interviews, medical tests, and
environmental assessments of homes and farms. The
majority of the participants in the KCRHS have
engaged in farming at some point in life (Merchant et
al, 2002). There is a high prevalence of hearing loss
among KCRHS participants (Flamme et al, 2005).
Households were the primary sampling unit in the
KCRHS, and farm households were sampled at a
greater probability than town and rural nonfarm
households to provide better estimates of farm-related
health issues. Further details regarding the KCRHS
can be found in Merchant et al (2002).
METHOD
Participants
Data from 3711 women and 3275 men participating
in the National Health and Nutrition Examination
Survey (NHANES) and the Keokuk County Rural
Health Study (KCRHS) were used in this retrospective
study. NHANES data from three two-year cycles
(1999–2004) were used in the current study. These
de-identified data are available to the public via the
National Center for Health Statistics Data Warehouse
Web site (http://www.cdc.gov/nchs/datawh.htm). Au-
diometric thresholds were collected from a subsample
of participants (2819 women and 2525 men), aged 20–
69, during medical examinations that included blood
chemistry, blood pressure, vision exam, cardiovascular
fitness, and questionnaires about diet, depression, and
work history (National Center for Health Statistics,
2001).
KCRHS data from participants aged 18 years and
older (892 women and 750 men) were included in these
analyses. De-identified data were obtained from the
Keokuk County Rural Health Study group at the
University of Iowa College of Public Health. Relative to
NHANES, there were fewer young adults and more
middle-aged and elderly adults in the KCRHS sample.
This demographic trend is consistent with other rural
areas in the United States (U.S. Census Bureau, 2007).
In addition, participants in the KCRHS had greater
high school graduation rates than participants in
NHANES.
Instrumentation
Review of the operations manuals provided by the
National Center for Health Statistics revealed that
audiometric testing in NHANES was conducted at 0.5,
1, 2, 3, 4, 6, and 8 kHz using an Interacoustics Model
AD226 audiometer with TDH 39 supra-aural ear-
phones or Etymotic EarTone 3A insert earphones,
which were used with participants judged by the tester
to have a high likelihood of ear canal collapse if tested
with supra-aural earphones. Testing was conducted
inside a sound booth in a Mobile Examination Center.
Ambient noise levels in the sound suite were suffi-
ciently low to permit testing to 0 dB hearing threshold
level (HTL) (re: ANSI S3.1-1991 [American National
Standards Institute {ANSI}, 1991]). Threshold testing
was conducted down to 210 dB HTL. Calibration was
conducted using reference values designed for
NHANES that deviated 21 dB from the ANSI S3.6
(ANSI, 1996) standards at 3 and 6 kHz.
Audiometric testing in KCRHS was conducted at the
same frequencies in a single-walled sound suite using
the Maico Model 800 audiometer and TDH 39 supra-
aural earphones. Ambient noise levels in the sound
suite were sufficiently low to permit testing to 0 dB
HTL (re: ANSI S3.1-1991 [ANSI, 1991]). Stimulus
calibration was completed in accordance with ANSI
S3.6 (ANSI, 1989).
Data Analyses
Derivation of Audiometric Configurations
If responses to audiometric stimuli could not be
obtained at the maximum output of the audiometer, a
proxy threshold one audiometric step greater than
the upper limit of the audiometer was substituted for
the missing value. Gender-stratified iterative k-
means cluster analyses were conducted using SPSS
14.0. Data from both ears were included within each
analysis so that asymmetries could be identified. Root
mean square error between the cluster centers and
participant thresholds across frequencies were used
to indicate the accuracy with which each cluster
center matched the participants’ configurations. Plots
of each participant’s audiogram relative to the
associated cluster center were examined by the
investigators to determine the nature of any observed
inaccuracy.
After participants were assigned to a cluster in each
solution, differences between cluster centers were
calculated to determine whether all clusters extracted
in a solution were substantially different from one
another. A substantial difference was operationally
defined as a 10 dB or greater difference between each
cluster center for at least one frequency in at least one
ear. The number of clusters, k, was increased incre-
mentally until a pair of nearly identical clusters was
identified or until a maximum of 20 clusters was
extracted.
Audiometric Configuration Labels
Cluster centers were labeled to describe the location
of low to mid frequency thresholds (0.5–2 kHz) and
Prevalence of Audiometric Configurations/Ciletti and Flamme
675

worst threshold in the frequencies above this range.
Low to mid frequency thresholds were labeled using
letters A–G where A # 15 dB, B 5 16–30 dB, C 5 31–
45 dB, D 5 46–60 dB, E 5 61–75 dB, F 5 76–90 dB,
and G . 90 dB. In cases where the cluster centers
resided in two categories, the category containing two
of three cluster centers was used. The threshold at
1 kHz was used if all three cluster centers were in
different categories. Each letter was then followed by
the worst threshold at frequencies above 2 kHz.
Symmetric audiometric configurations (i.e., configura-
tions wherein bilateral differences between cluster
centers were less than 10 dB) were labeled based on
the bilateral average while asymmetric cluster centers
were labeled separately with the left ear labeled first.
Definitions were used to identify audiometric con-
figurations that contained a bulge or were notched.
Bulge was defined using a definition adapted from
Dobie (2005). In this study, 8 kHz was included in the
definition of bulge depth (BD), BD 5 PTA2346 2 PTA18.
(PTA 5 pure tone average.) Configurations with BD
$5 dB in the mean values were classified as a bulge.
Notched configurations were defined as having a poorer
threshold at 3, 4, or 6 kHz with an improvement $10 dB
at 8 kHz.
Prevalence Estimates
For NHANES data, sample weights for the audiom-
etry portion of each two-year cycle of the NHANES
were used to derive the prevalence estimate; as a
result, prevalence estimates generalize to the nonin-
stitutionalized U.S. population in the age range of 20 to
69 years. No sample weights were used with KCRHS
data.
RESULTS
Clusters and cluster centers representing typical
audiometric configurations were identified for
both genders together and for each gender separately.
Estimates of the prevalence of each audiometric
configuration within each configuration are presented
below.
Audiometric Configurations
Preliminary analyses revealed that men and women
tended toward different audiometric configurations,
and this underlying gender-related difference may
obscure important differences in subsequent analyses
associated with sequelae, risk factors, and progression
of hearing impairment. The following analyses were
conducted for each gender separately.
Women
Nine configurations described audiometric data from
women. Six configurations were symmetric (Figure 1)
while two were asymmetric (Figure 2). One configura-
tion was identified but not analyzed further due to a
small unweighted sample size (n 5 3). Tabular
representations of the data in these figures and
additional technical information are presented in
Appendix 1. One (asymmetric) configuration was
extracted but not analyzed further due to the small
number of participants (n 5 3) best described by this
configuration. Mean thresholds of 25 dB HTL or better
between 0.5 and 4 kHz were present in most symmet-
ric configurations. The prevalence of configurations
with mean thresholds #25 dB HTL (A11 and A22) was
Figure 1. Panel A represents symmetric configuration cluster centers for women. Panel B represents prevalence of each configurationwithin the NHANES and KCRHS data sets on a logarithmic axis. Error bars represent the 95% confidence interval for the percentage.
Journal of the American Academy of Audiology/Volume 19, Number 9, 2008
676

greater in NHANES (75.4%) than KCRHS (59.6%).
Gradually sloping configurations were more prevalent
among rural women (29.4%) than in NHANES (13.2%).
Rural women were more likely to be represented by
configuration A22 (30.9%) than configuration A11
(28.7%), and the prevalence rates for configurations
A11 and A22 were higher among participants fromNHANES (40.3% and 35.1%, respectively) than women
in the KCRHS sample.
Three configurations (A48, B66, and D84) tended to
gradually slope across all frequencies but varied in
severity.1 The A48 configuration featured normal
thresholds up to 2 kHz and a moderate sloping
impairment above 2 kHz. Women best described by
configuration B66 tended to have a slight to mildimpairment below 2 kHz and a moderately severe
impairment at 6 and 8 kHz. Participants described by
configuration D84 tended to have a moderate to severe
gently sloping impairment. Women were more likely to
be represented by configuration A48 (8.7% NHANES,
14.4% KCRHS) than configuration B66 or D84. The
prevalence of configuration B66 and D84 in NHANES
data was less than five percent, while 15% ofparticipants in KCRHS were members of these
configurations.
One configuration (B29) was generally flat. Mean
thresholds in configuration B29 were consistent with a
slight to mild impairment in all frequencies. The
prevalence of configuration B29 was 9 and 8% for
NHANES and for KCRHS participants, respectively.
Women were represented by two asymmetric config-urations, B40:D82 and C69:B35 (Figure 2). These
configurations were bilateral mirrors of one another
with respect to magnitude and shape. That is, the
audiometric shape for the left ear in the B40:D82
configuration was similar to the shape for the right ear
in the C69:B35 configuration, and the right ear in the
B40:D82 configuration was similar to the shape for the
left ear in the C69:B35 configuration. Thus, configu-
rations B40:D82 and C69:B35 had similar audiometric
shapes but differed with respect to the most affected
ear. Participants described by these configurationstended to have a moderate to severe impairment for
the most affected ear and a slight to mild impairment
for the least affected ear. The combined prevalence of
these configurations was less than 2%.
To simplify discussion of these results, a hierarchical
structure (Figure 3) of configuration shapes and
severity was developed by grouping together clusters
with similar audiometric shapes. Prevalence definedon these bases revealed that 25% of the U.S. population
aged 20 to 69 was best described by a configuration
corresponding to a marked hearing impairment in at
least one ear at one or more frequency. This rate was
greater in the KCRHS sample (40%). In both data sets,
the predominant configurations associated with a
hearing impairment were characterized by either a
gentle slope (13% in US; 29% in KCRHS) or anegligible slope (approximately 9% in both data sets).
Men
The maximum planned number of configurations (k
5 20) was needed to describe the data from men.
Twelve configurations were bilaterally symmetric
(Figure 4) and eight were asymmetric (Figure 5).Appendix 2 includes the associated tabular represen-
tations and additional technical information. One
configuration was extracted but not examined further
due to a small unweighted sample (n 5 1). In contrast
Figure 2. Panel A represents asymmetric cluster centers for women. X 5 left ear; circles 5 right ear. A different line style was used foreach configuration. Panel B represents the percent prevalence of the configuration within the NHANES and KCRHS data sets. Errorbars represent the 95% confidence interval for the percentage.
Prevalence of Audiometric Configurations/Ciletti and Flamme
677

Figure 4. Panels A and C represent symmetric configuration cluster centers for men. Panels B and D represent the prevalence of eachconfiguration within the NHANES and KCRHS data sets. Error bars represent the 95% confidence interval for the percentage.
Figure 3. Hierarchical organization of audiometric configurations among women. Audiometric configurations shown in Figures 1 and2 were grouped according to similarity in shape. Numbers in regular text represent percent prevalence estimates from NHANES data;numbers in parentheses represent percent prevalence estimates from KCRHS data.
Journal of the American Academy of Audiology/Volume 19, Number 9, 2008
678
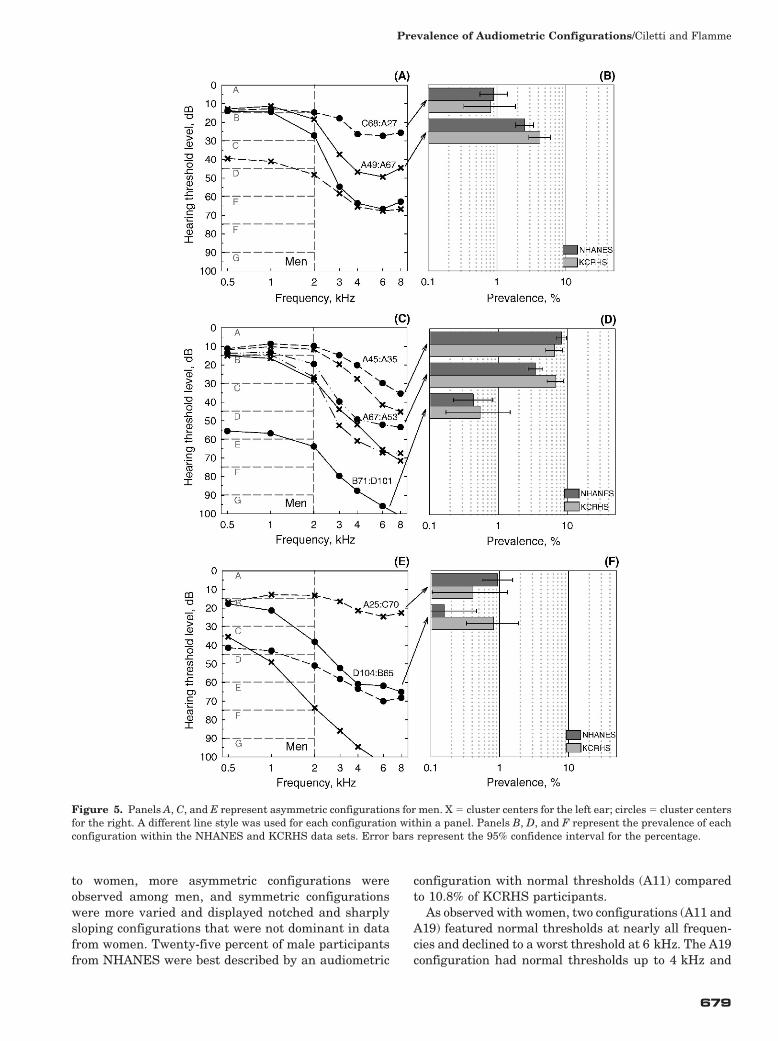
to women, more asymmetric configurations were
observed among men, and symmetric configurations
were more varied and displayed notched and sharplysloping configurations that were not dominant in data
from women. Twenty-five percent of male participants
from NHANES were best described by an audiometric
configuration with normal thresholds (A11) compared
to 10.8% of KCRHS participants.
As observed with women, two configurations (A11 andA19) featured normal thresholds at nearly all frequen-
cies and declined to a worst threshold at 6 kHz. The A19
configuration had normal thresholds up to 4 kHz and
Figure 5. Panels A, C, and E represent asymmetric configurations for men. X 5 cluster centers for the left ear; circles 5 cluster centersfor the right. A different line style was used for each configuration within a panel. Panels B, D, and F represent the prevalence of eachconfiguration within the NHANES and KCRHS data sets. Error bars represent the 95% confidence interval for the percentage.
Prevalence of Audiometric Configurations/Ciletti and Flamme
679

was consistent with a slight impairment above 4 kHz.
Half of the participants from NHANES were represent-
ed by either configuration A11 or A19, but less than 25%
of KCRHS participants were represented by those two
configurations. Within these configurations, A11 was
more likely to include NHANES participants (25.4%),
and KCRHS participants were more likely to be
represented by configuration A19 (13.8%).
Two notched configurations (A33 and A47) were
observed among men. Men best described by configu-
ration A33 tended to have normal thresholds to 2 kHz
and a mild notched impairment at 4 kHz. Those
described by configuration A47 featured normal
thresholds up to 1 kHz and a moderate notched
impairment at 4 kHz. Both data sets were more likely
to be represented by configuration A33 (8.2%
NHANES, 11.1% KCRHS) than configuration A47
(4.4% NHANES, 10.8% KCRHS). Participants de-
scribed using notched configurations were almost twice
as prevalent in the KCRHS sample.
Two configurations (A59 and B82) featured thresholds
that sharply declined above 2 kHz. The A59 configura-
tion described participants that tended to have normal
thresholds up to 2 kHz and a moderately severe sloping
impairment above 2 kHz. The B82 configuration was
consistent with a slight impairment below 2 kHz and a
profound sloping impairment above 2 kHz. The preva-
lence of the configuration A59 (5.8% NHANES, 6.5%
KCRHS) and configuration B82 (3.3% NHANES, 5.1%
KCRHS) was also greater among rural men.
Two configurations (B74 and B91) featured thresh-
olds that sharply declined above 1 kHz. Men repre-
sented by configuration B74 tended to have a slight to
severe sharply sloping impairment, and those de-
scribed by configuration B91 had a mild to profound
impairment. KCRHS participants were three times
more likely than NHANES to be members of configu-
ration B74 (2.1% NHANES, 7.7% KCRHS) or config-
uration B91 (0.8% NHANES, 3.7% KCRHS).
Two configurations (C55 and D78) featured
thresholds that declined gently across frequencies.
The C55 configuration was consistent with a mild to
moderate impairment where the D78 configuration
was consistent with a moderate to severe impair-
ment. Rural men were more likely to demonstrate
gently sloping impairments. The combined C55 and
D78 configurations represented less than 2% of
NHANES participants and less than 7% of KCRHS
participants.
One symmetric configuration (E109) had thresholds
at more than one frequency greater than 100 dB HTL.
Participants described by configuration E109 tended to
have a moderate impairment below 2 kHz and a
profound impairment above 2 kHz. Less than 1% of
participants from both data sets were represented by
this configuration.
One configuration (B26) featured a somewhat flat
audiometric shape. NHANES and KCRHS participants
described by configuration B26 tended to have a slight
to mild impairment. Less than 10% of men from both
data sets were represented by configuration B26.
Seven configurations were asymmetric. Six of these
consisted of three pairs of bilaterally mirrored config-
urations. Participants best described by the remaining
configuration, A45:A35, tended to have a mild to
moderate sloping impairment above 3 kHz in the left
ear and a mild impairment for frequencies above 3 kHz
in right ear. The two configurations, A49:A67 and
A67:A53, were mirror images of each other wherein a
moderate to moderately severe sloping impairment
was typically found above 2 kHz in the most affected
ear, while a mild to moderate sloping impairment for
frequencies above 2 kHz was typical for the least
affected ear. Configuration C68:A27 and A25:C70
represented another mirrored pair wherein a moderate
to moderately severe sloping impairment was typically
observed in the most affected ear and mild high
frequency impairment was observed in the least
affected ear. A third mirrored pair was represented
by configuration B71:D101 and configuration
D104:B65, which typically featured a precipitous mild
to profound impairment in the most affected ear and a
slight to moderately severe impairment in the least
affected ear. Men in the KCRHS sample were more
likely to be described by an asymmetric configuration
(16.7% NHANES, 20.0% KCRHS).
When examined from within a hierarchical structure
(Figure 6), 50% of the U.S. population aged 20 to 69
was best described by an audiometric configuration
consistent with a mild impairment or worse in at least
one ear at one or more frequencies. The predominant
hearing loss configuration is characterized by a
substantial slope or bilateral asymmetry. Together,
these two configurations have a 42% prevalence rate
nationwide (65% in the KCRHS sample). The predom-
inant configurations are bilaterally symmetric with a
notched or bulging shape, and the notched configura-
tion with greater impairment on the left side (A45:A35)
is the most common asymmetric shape. Bilaterally
mirrored pairs of configurations were also common,
occurring with varying severity in 9% of the U.S.
population (13% in the KCRHS sample). Marked
impairments at 500 Hz were observed in less than
1.5% of the U.S. population, and this rate was greater
in the KCRHS sample (7%).
DISCUSSION
The most common audiometric configurations and
estimates of the prevalence of each configuration
in the adult population were identified in this study.
Although no prior studies of the distribution of
Journal of the American Academy of Audiology/Volume 19, Number 9, 2008
680

audiometric configurations in the general population
were available for comparison, our results confirm and
expand upon prior studies that found a high preva-
lence of hearing impairment in the general population
and a higher prevalence of hearing impairment among
women (e.g., Davis, 1995; Cruickshanks et al, 1998;
Borchgrevink et al, 2005; Flamme et al, 2005; Chia et
al, 2007).
Our results are somewhat different from prior
studies (e.g., Yuen and McPherson, 2002; Pittman
and Stelmachowicz, 2003; Hederstierna et al, 2007).
Study designs using audiometric configurations that
were defined a priori (e.g., Pittman and Stelmacho-
wicz, 2003; Hederstierna et al, 2007) showed a
substantial prevalence of tent-shaped configurations
(i.e., configurations wherein a frequency region with
better sensitivity in the middle frequencies is sur-
rounded by regions of poorer sensitivity in the high and
low frequencies). This kind of configuration was found
in approximately 13% of the participants in Pittman
and Stelmachowicz (2003) but was not prominent in
the current study. The configurations identified by
Yuen and McPherson (2002) indicated a much greater
prevalence of severe hearing impairments than were
identified in the NHANES data from the current study.
These differences were expected because neither study
employed a sampling strategy likely to represent the
general population. For example, the participants in
the Pittman and Stelmachowicz study were drawn
from the audiological database at the Boys Town
National Research Hospital, which is a facility that
can be expected to draw uncommon clinical cases, and
the Hederstierna et al (2007) study included data from
only women near the age of menopause.
Prevalence Differences across Datasets
There was a general trend toward increased pre-
valence of hearing impairment in the KCRHS
sample. Among women, the main differences between
Figure 6. Hierarchical organization of audiometric configurations among men. Details are identical to those in Figure 3.
Prevalence of Audiometric Configurations/Ciletti and Flamme
681

prevalence estimates derived from the NHANES and
KCRHS data sets were observed in the gently sloping
class of configurations, wherein the greatest differenc-
es were seen in gently sloping configurations B66 and
D84, respectively. Prevalences of these configurations
were four to ten times greater within the KCRHS
sample.
For men, the prevalence of configurations with a
substantial slope was greater in the KCRHS sample
(Figure 6). This difference was primarily located in the
subclasses of configurations characterized by notched
or bulged audiometric shape, wherein the prevalence
rates were two to three times higher, respectively. The
rate of bilaterally mirrored asymmetric configurations
was also about 1.5 times greater in the KCRHS
sample. The analyses reported in the current study
cannot identify the risk factors associated with these
differences. However, notched and bulging configura-
tions are commonly associated with excess noise
exposure (Dobie, 2005), so it seems that this difference
might be associated with greater lifetime exposure to
risk factors for hearing impairment in rural areas (e.g.,
Holt et al, 1993; Beckett et al, 2000; Depczynski et al,
2005; Solecki, 2006).
Gender-Related Differences in
Audiometric Configurations
Rates of hearing impairment among men were twice
as great as among women. There was also an increase
in the variety of configurations among men. Roughly
25% of the U.S. female population aged 20 to 69, and
50% of the corresponding male population, can be
expected to have pure tone thresholds most accurately
described by a configuration with a marked hearing
impairment at more than one frequency (Figures 3 and
6). Notched and sharply sloping configurations were
not identified among women but were common among
men. The increased variety among men is likely due to
the increased number and magnitude of exposures to
occupational and nonoccupational risk factors for
hearing impairment (e.g., Stewart et al, 2001; Schmu-
ziger et al, 2006; Kurmis and Apps, 2007). It is
interesting to note, however, that the prevalence of
configurations with negligible slope was similar for
women and men (7% and 9%, respectively).
One in four (25%) men in the 20–69 year age group
was best described by configurations with notched or
bulged shape, and 17% were best described by
configurations with substantial asymmetry. Many of
these asymmetric configurations could be paired with a
complementary configuration with the most affected
ear on the opposite side. For example, configurations
A25:C70 and C68:A27 feature nearly identical config-
urations with respect to the least- or most-affected
ears, but the right ear was the most affected in the
former configuration and the left ear was the most
affected in the latter.
Biases and Limitations
Weighting of individual NHANES participant data
permits generalization to the noninstitutionalized U.S.
population aged 20–69 years. However, considerable
uncertainty is associated with estimates for more severe
hearing loss configurations due to the rarity with which
these are observed in the general population. Readers
are encouraged to examine carefully the confidence
intervals surrounding all prevalence estimates. Config-
urations having prevalence estimates with excessive
confidence intervals (e.g., configuration D84 for women
and configuration E109 for men) should be interpreted
as provisional indicators of a heterogeneous group that
is only grossly represented by the audiometric configu-
ration identified in this study.
In both data sets, audiometric thresholds in the
range of normal sensitivity may have been biased
toward poorer thresholds. Thresholds better than 0 dB
HTL are not uncommon among otologically normal
listeners (ANSI S3.44-1996 [ANSI, 1996]), but the
methods used in NHANES and the KCRHS were not
optimized to detect these cases. Threshold testing in
NHANES was conducted down to 210 dB HTL, but
ambient noise levels were only known to permit testing
down to 0 dB HTL (re: ANSI S3.1 [ANSI, 1991]). Thus
it remains possible that thresholds of 0 dB HTL or
better included in the NHANES raw data may by
overestimated due to the effects of masking from
ambient noise. Testing in the KCRHS was not
conducted below 0 dB HTL, so reported thresholds of
0 dB HTL may not represent a listener’s best thresh-
old. Based on the typical spectrum of ambient noise
and the attenuation characteristics of audiometric
earphones, we speculate that the predominant effect
of these biases would be limited to configurations with
mean low frequency thresholds in the normal range,
which includes configurations A11, A22, and A48 for
women, and configurations A11, A19, A33, A47, and
A59 for men. Low frequency thresholds for the people
best described by these configurations may be better
than indicated by the mean data presented in this
paper.
There is also a possibility that the supra-aural type
of earphones used in this study may have caused ear
canal collapse in some participants. Within the
subpopulation seeking audiometric testing in a hospi-
tal in the 1960s, an approximate 3–5% rate of collapsed
canals was observed, and this condition lead to a
characteristic audiometric configuration with a 5–
10 dB notch in air conduction thresholds, typically at
2 kHz (Hildyard and Valentine, 1962). No configura-
tion with a notch centered at 2 kHz was observed in
Journal of the American Academy of Audiology/Volume 19, Number 9, 2008
682

this study, so we do not regard the possibility of ear
canal collapse under supra-aural earphones to be a
source of bias for the central tendencies of the
audiometric configurations identified here. However,
occasional undetected cases of ear canal collapse might
have inflated the variance of thresholds within each
configuration.
Suggestions for Further Research
Some audiometric configurations identified in the
current study may be associated with specific classes of
exogenous or endogenous risk factors. For example,
notched and bulging configurations can be expected to
be associated predominantly with excess noise expo-
sure. It is also plausible that some of the asymmetric
configurations may be associated with exposure to
nearby sound sources because of the greater magni-
tude and frequency range of interaural level differenc-
es associated with these sound sources (Brungart and
Rabinowitz, 1999). Such analyses may also help
explain the substantial gender-related difference in
typical audiometric configurations observed in this
study. Exogenous risk factors recommended for inclu-
sion are exposure to excess noise and toxicants such as
organic solvents (e.g., Morata et al, 1997). Potential
endogenous factors include otosclerosis, which is more
prevalent among women (Sakihara and Parving,
1999), and cardiovascular disease, which is more
strongly related to low frequency hearing status among
women (Gates et al, 1993).
Some rare audiometric configurations are not de-
scribed with enough accuracy. Analyses involving
larger samples of the general population are required
to provide more precise estimates of the variety and
prevalence of these configurations.
The identification and estimation of the prevalence
of audiometric configurations should be considered an
entry point toward arguably more important informa-
tion. Knowledge of the risk factors, progression, and
the determination of the need for and effectiveness of
rehabilitative options as a function of audiometric
configuration could inform the efforts of clinicians and
researchers seeking to find ways to prevent and
reduce the negative consequences of hearing impair-
ment.
The prevalence differences between overall U.S.
population and the KCRHS sample of the rural
population are difficult to interpret. People living in
rural areas can be expected to accrue greater exposure
to many risk factors for hearing impairment. In
addition, there is a demographic trend toward migra-
tion out of rural areas, which results in a greater
proportion of older people residing in these areas
(Larson, 2006). The results of the current study
indicate that the prevalence of many audiometric
configurations is greater in the KCRHS sample than
the U.S. average, but the reasons for this difference
remain unclear. Further research is needed to describe
the role played by age, excess noise, ototoxic exposures,
and other prognostic factors in the prevalence differ-
ences between NHANES and the KCRHS.
CONCLUSION
Approximately 25% of noninstitutionalized women
in the United States aged 20 to 69 and 50% of
corresponding men have audiometric configurations
best described as having a marked hearing impair-
ment at one or more frequency. More diversity of
configurations was observed among men, and the
audiometric slope among men was generally steeper.
Approximately 25% of men had audiometric configu-
rations that were best described with a notched or
bulging shape. The prevalence of configurations con-
sistent with a marked hearing impairment was greater
within the data from the Keokuk County Rural Health
Study.
These results have considerable epidemiologic
value for clinicians and researchers wishing to deter-
mine how common a given configuration is in the
general population. The results could also facilitate
the optimization of rehabilitative technologies to
meet the needs of large numbers of people with
hearing impairments who do not currently use hear-
ing aids. In addition, these results are a starting point
for epidemiological studies concerning the progression
of and risk factors for specific hearing loss configura-
tions.
Acknowledgments. The authors would like to thank Leon
F. Burmeister, Beth Henning, Kevin M. Kelly, James A.
Merchant, Jill Moore, Wayne T. Sanderson, Diana Sertterh,
Ann M. Stromquist, Naomi Tucker, Ann Yeoman, and Craig
Zwerling for conducting the Keokuk County Rural Health
Study and providing some of the data used in this study. We
also thank James M. Hillenbrand and Robert Dobie for their
comments on an earlier revision of this manuscript.
NOTE
1. At each frequency, labels for the degree of impairment (re:Clark, 1981) were used. Thus, thresholds in the range of 210–15 dB HTL are labeled normal, 16–25 slight, 26–40 mild, 41–55 moderate, 56–70 moderately severe, 71–90 severe, and .90profound. Use of these terms was intended to simplifydescription of the audiometric configurations in terms of themagnitude of impairment rather than the effect of theimpairment on the listener.
REFERENCES
American National Standards Institute. (1989) Specifications forAudiometers (ANSI S3.6 -1989). New York: American NationalStandards Institute.
Prevalence of Audiometric Configurations/Ciletti and Flamme
683

American National Standards Institute. (1991) Maximum Per-missible Ambient Noise Levels for Audiometric Test Rooms (ANSIS3.1 -1991). New York: American National Standards Institute.
American National Standards Institute. (1996) American Na-tional Standard Determination of Occupational Noise Exposureand Estimation of Noise-Induced Hearing Impairment (ANSIS3.44 -1996). New York: American National Standards Institute.
American National Standards Institute. (1996) Specifications forAudiometers (ANSI S3.6 -1996). New York: American NationalStandards Institute.
Beckett WS, Chamberlain D, Hallman E, May J, Hwang S-A,Gomez M, Eberly S, Cox C, Stark A. (2000) Hearing conservationfor farmers: source apportionment of occupational and environ-mental factors contributing to hearing loss. J Occup Environ Med42(8):806–813.
Borchgrevink HM, Tambs K, Hoffman HJ. (2005) The Nord-Trondelag Norway audiometric survey 1996–1998: unscreenedthresholds and prevalence of hearing impairment for adults . 20years. Noise Health 7:1–15.
Brockett J, Schow RL. (2001) Web site profiles common hearingloss patterns and outcome measures. Hear J 54(8):20.
Brungart DS, Rabinowitz WM. (1999) Auditory localization ofnearby sound sources. Head related transfer functions. J AcoustSoc Am 106:1465–1479.
Chia E–M, Wang JJ, Rochtchina E, Cumming RR, Newall P,Mitchell P. (2007) Hearing impairment and health-relatedquality of life: the Blue Mountains hearing study. Ear Hear 28:187–195.
Clark JG. (1981) Uses and abuses of hearing loss classification.ASHA 23(7):493–500.
Cruickshanks K, Wiley T, Tweed B, Klein B, Klein R, Mares-Perlman J, Nondahl D. (1998) The prevalence of hearing loss inolder adults in Beaver Dam, Wisconsin: the epidemiology ofhearing loss study. Am J Epidemiol 148:879–886.
Davis A. (1995) Hearing in Adults. London: Whurr.
Depczynski J, Franklin RC, Challinor K, Williams W, Fragar LJ.(2005) Farm noise emissions during common agriculturalactivities. J Agric Saf Health 11:325–334.
Dobie RA. (2005) Estimated noise-induced permanent thresholdshift from audiometric shape: the ISO-1999 model. Ear Hear 26:630–635.
Flamme GA, Mudipalli VR, Reynolds SJ, Kelly KM, StromquistAM, Zwerling C, Burmeister LF, Peng S, Merchant JA. (2005)Prevalence of hearing impairment in a rural Midwestern cohort:estimates from the Keokuk County Health Study, 1994 to 1998.Ear Hear 26(3):350–360.
Gates GA, Cobb JL, D’Agostino RB, Wolf PA. (1993) The relationof hearing in the elderly to the presence of cardiovascular diseaseand cardiovascular risk factors. Arch Otolaryngol Head NeckSurg 119(2):156–161.
Hederstierna C, Hultcrantz M, Collins A, Rosenhall U. (2007)Hearing in women at menopause. Prevalence of hearing loss,audiometric configuration and relation to hormone replacementtherapy. Acta Otolaryngol 127:149–155.
Hewitt M. (1989) Defining ‘‘Rural’’ Areas: Impact on Health CarePolicy and Research. Staff report from the Congressional Office ofTechnology Assessment. National Technical Information Serviceproduct PB89224646. Washington, DC: Health Program, Office ofTechnology Assessment, Congress of the United States.
Hildyard VH, Valentine MA. (1962) Collapse of the ear canalduring audiometry: a further report. Arch Otolaryngol 75:422–423.
Holt JJ, Broste SK, Hansen DA. (1993) Noise exposure in therural setting. Laryngoscope 103:258–262.
Jerger J, Chmiel R, Stach B, Spretnjak M. (1993) Gender affectsaudiometric shape in presbyacusis. J Am Acad Audiol 4:42–49.
Kurmis AP, Apps SA. (2007) Occupationally-acquired noise-induced hearing loss: a senseless workplace hazard. Int J OccupMed Environ Health 20:127–136.
Larson A. (2006) Rural health’s demographic destiny. RuralRemote Health 6(2):551.
Merchant JA, Stromquist AM, Kelly KM, Zwerling C, ReynoldsSJ, Burmeister LF. (2002) Chronic disease and injury in anagricultural county: the Keokuk County Rural Health CohortStudy. J Rural Health 18:521–535.
Morata TC, Fiorini AC, Fischer FM, Colacioppo S, WallingfordKM, Krieg E, Dunn DE, Gozzoli L, Padrao MA, Cesar C. (1997)Toluene-induced hearing loss among rotogravure printing work-ers. Scand J Work Environ Health 23:289–298.
National Center for Health Statistics. (2001) National Healthand Nutrition Examination Survey: Audiometry/ TympanometryProcedures Manual. http://www.cdc.gov/nchs/data/nhanes/au.pdf.
National Center for Health Statistics. (2006) Welcome SurveyParticipant! http://www.cdc.gov/nhanes/.
Pittman AL, Stelmachowicz PG. (2003) Hearing loss in childrenand adults: audiometric configuration, asymmetry, and progres-sion. Ear Hear 24:198–205.
Sakihara Y, Parving A. (1999) Clinical otosclerosis, prevalenceestimates, and spontaneous progress. Acta Otolaryngol 119:468–472.
Schmuziger N, Patscheke J, Probst R. (2006) Hearing innonprofessional pop/rock musicians. Ear Hear 27:321–330.
Solecki L. (2006) Characteristics of annual exposure to noiseamong private farmers on family farms of mixed-productionprofile. Ann Agric Environ Med 13:113–118.
Stewart M, Konkle DF, Simpson TH. (2001) The effect ofrecreational gunfire noise on hearing in workers exposed tooccupational noise. Ear Nose Throat J 80(1):32–34, 36, 38–40.
U.S. Census Bureau. (2007) Matrices PCT12 and P13. In: Census2000 Summary File 1. http://www.census.gov.
Waller NG, Kaiser HA, Illian JB, Manry M. (1998) A comparisonof the classification capabilities of the 1-dimensional Kohonenneural network with two partitioning and three hierarchicalcluster analysis algorithms. Psychometrika 63(1):5–22.
Yuen KCP, McPherson B. (2002) Audiometric configurations ofhearing impairment in Hong Kong: implications for amplifica-tion. Disabil Rehabil 24:904–913.
Journal of the American Academy of Audiology/Volume 19, Number 9, 2008
684

Appendix 2. Cluster Center Means and Standard Deviations for EachAudiometric Configuration among Men
Clusters
n RMS error
Ear
0.5 kHz 1 kHz 2 kHz 3 kHz 4 kHz 6 kHz 8 kHz
NHANES KCRHS mean SD mean SD mean SD mean SD mean SD mean SD mean SD mean SD
A11 584 80 6 2 Both 7 5 4 5 4 5 4 5 6 6 11 7 7 6
A19 599 102 7 2 Both 10 6 8 5 8 5 10 5 14 6 19 7 18 7
A33 196 82 9 2 Both 9 5 8 4 11 6 22 8 33 8 28 8 18 8
A47 122 80 10 2 Both 12 7 13 8 20 11 42 9 47 8 39 10 30 10
A59 145 48 10 3 Both 13 7 13 7 15 8 24 8 38 9 53 10 60 12
B26 176 24 9 3 Both 20 7 20 7 22 8 22 8 24 7 26 8 25 9
B74 60 57 10 2 Both 17 7 20 8 45 10 63 7 68 8 74 8 72 10
B82 76 38 11 3 Both 17 8 16 7 21 9 48 14 68 11 80 10 82 10
B91 30 27 11 3 Both 21 9 29 10 58 11 76 9 85 9 91 8 90 10
C55 31 20 13 4 Both 35 13 41 11 46 13 49 10 52 10 55 10 54 14
D78 31 26 11 4 Both 39 14 48 11 59 10 65 7 69 7 77 8 78 10
E109 13 6 15 4 Both 55 18 64 15 81 9 95 12 100 10 107 11 109 13
A25:C70 22 3 15 3 Left 17 11 13 11 13 10 16 9 21 14 25 12 23 15
Right 41 20 43 19 51 18 58 17 63 17 70 13 68 18
A45:A35 204 48 10 3 Left 12 8 10 8 12 8 20 10 28 13 41 15 45 12
Right 11 7 9 6 10 7 15 9 20 9 30 11 35 14
A49:A67 64 31 11 3 Left 13 7 11 7 18 10 37 14 47 13 49 12 45 16
Right 14 8 14 8 27 15 55 13 64 11 67 13 63 13
A67:A53 98 50 10 3 Left 15 7 14 8 27 13 53 11 61 11 67 11 67 11
Right 14 8 13 8 20 10 40 14 49 12 52 12 53 14
B71:D101 13 4 15 4 Left 15 9 16 7 28 12 44 17 52 17 66 13 71 11
Right 56 20 57 14 64 13 80 23 88 21 96 17 101 14
C68:A27 27 6 14 3 Left 40 20 41 20 48 19 58 15 65 14 67 11 67 14
Right 14 9 13 7 15 11 18 13 26 15 27 14 26 16
D104:B65 5 6 13 4 Left 35 16 49 17 74 15 86 16 95 17 104 11 101 13
Right 18 8 21 11 38 19 52 16 61 13 62 10 65 12
Note: Configuration G105:G75 was not included due to small unweighted sample size (n 5 1).
Appendix 1. Cluster Center Means and Standard Deviations for EachAudiometric Configuration among Women
Clusters
n RMS error
Ear
0.5 kHz 1 kHz 2 kHz 3 kHz 4 kHz 6 kHz 8 kHz
NHANES KCRHS mean SD mean SD mean SD mean SD mean SD mean SD mean SD mean SD
A11 1116 254 6 2 Both 7 5 4 4 5 5 3 5 5 5 11 6 8 6
A22 949 273 7 2 Both 12 6 9 5 9 5 10 5 13 6 22 7 19 7
A48 258 127 10 3 Both 14 7 11 6 14 7 18 8 24 9 39 10 48 10
B29 282 72 10 3 Both 22 9 20 8 22 8 22 7 25 9 29 8 28 9
B66 123 99 11 3 Both 24 10 25 10 31 10 39 10 46 10 60 11 66 12
D84 14 34 16 6 Both 50 17 55 15 61 13 63 11 69 13 82 14 84 12
B40:D82 19 15 16 5 Left 19 14 16 11 19 11 21 12 26 15 37 16 40 20
Right 51 23 52 18 57 17 62 15 69 16 80 18 82 19
C69:B35 42 10 15 5 Left 42 21 42 19 46 18 51 14 59 15 69 18 66 20
Right 20 10 17 12 17 11 20 11 23 13 30 14 35 15
Note: Configuration G125:D125 was not included due to small unweighted sample size (n 5 3).
Prevalence of Audiometric Configurations/Ciletti and Flamme
685