Embed Size (px)
Citation preview

Preventing disease
Promoting and protecting health
Preventing disease, promoting and protecting health
Food and Nutrition Surveillance
Christine Bocage
Sr. Technical Officer, Food Security and Nutrition
Caribbean Public Health Agency (CARPHA)
Presented at the 12th Meeting of Caribbean National Epidemiologists and Laboratory Directors
Hyatt Regency, POS Trinidad, September 17-19, 2014
Preventing disease, promoting and protecting health
Food and Nutrition Surveillance• Food and nutrition information is needed for immediate,
medium and long term decision-making relating to a country’shealth, nutritional needs, hunger, agricultural policies andprogrammes.
• This information needs to be prompt so serious consequencesof ill health will not remain unchecked and become prevalent.In many Caribbean countries, data that have been collectedrarely becomes health or nutrition information.
• What is needed are efficient Food and Nutrition Surveillance Systems
Preventing disease, promoting and protecting health
What is Food and Nutrition Surveillance?
• Food and Nutrition Surveillance is the systematic andcontinuous collection, analysis, interpretation andreporting of food and nutrition data.
• This definition denotes:
(a) monitoring the type and supply of foods at variouspoints along the food chain to see and remove obstaclesor snags quickly enough; and
(a) monitoring the nutritional status of groups at risk tofind out when and where the problems occur in orderto manage these problems.
Food and Nutrition Surveillance
Preventing disease, promoting and protecting health
Why are we concerned?
• Childhood obesity epidemic
• In 2010 prevalence of overweight children<5years was estimated at 42 million: close to 35million of those lived in developing countries.
• In the Caribbean obesity in <5 age group(Pre-school children) doubled over thepast decade
Preventing disease, promoting and protecting health
2010
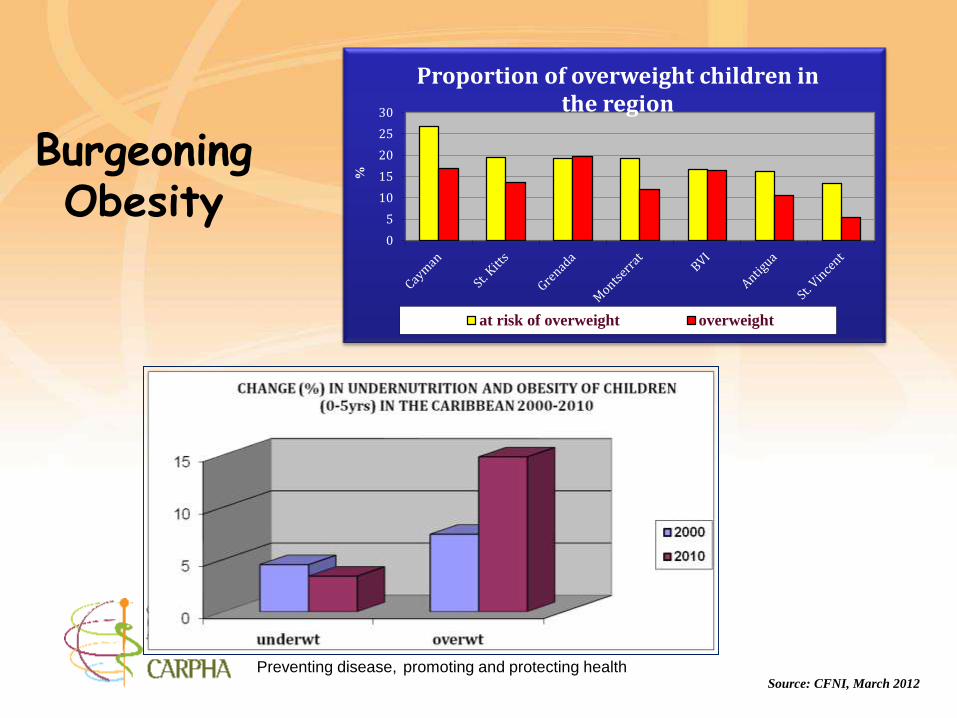
Source: CFNI, March 2012
Burgeoning Obesity
0
5
10
15
20
25
30
%
Proportion of overweight children in the region
at risk of overweight overweight
Preventing disease, promoting and protecting health
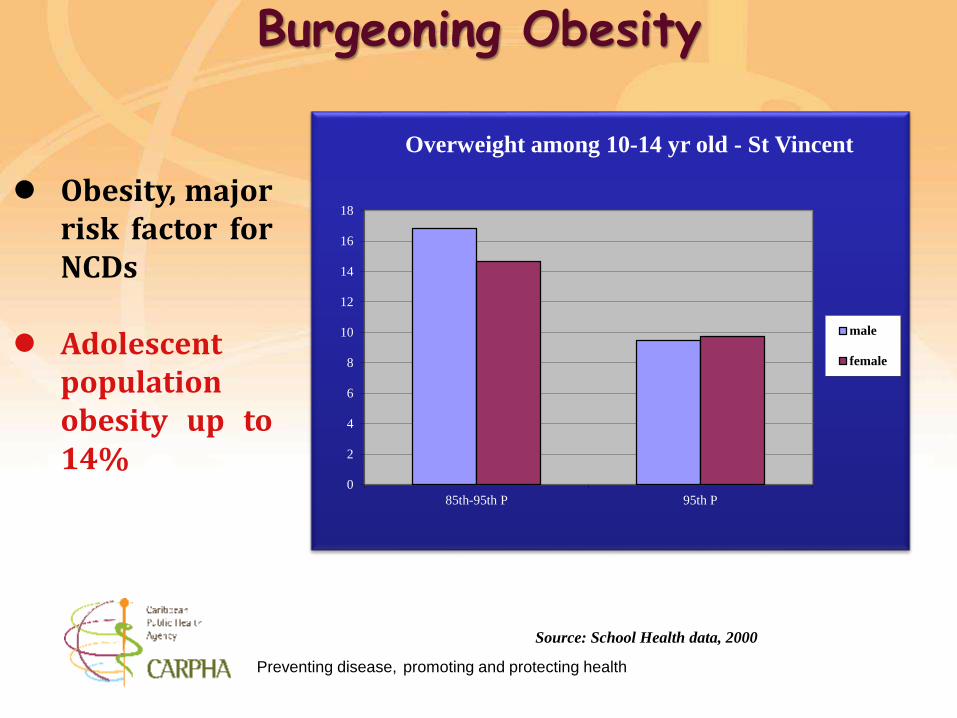
Source: School Health data, 2000
Obesity, majorrisk factor forNCDs
Adolescentpopulationobesity up to14%
Burgeoning Obesity
0
2
4
6
8
10
12
14
16
18
85th-95th P 95th P
Overweight among 10-14 yr old - St Vincent
male
female
Preventing disease, promoting and protecting health
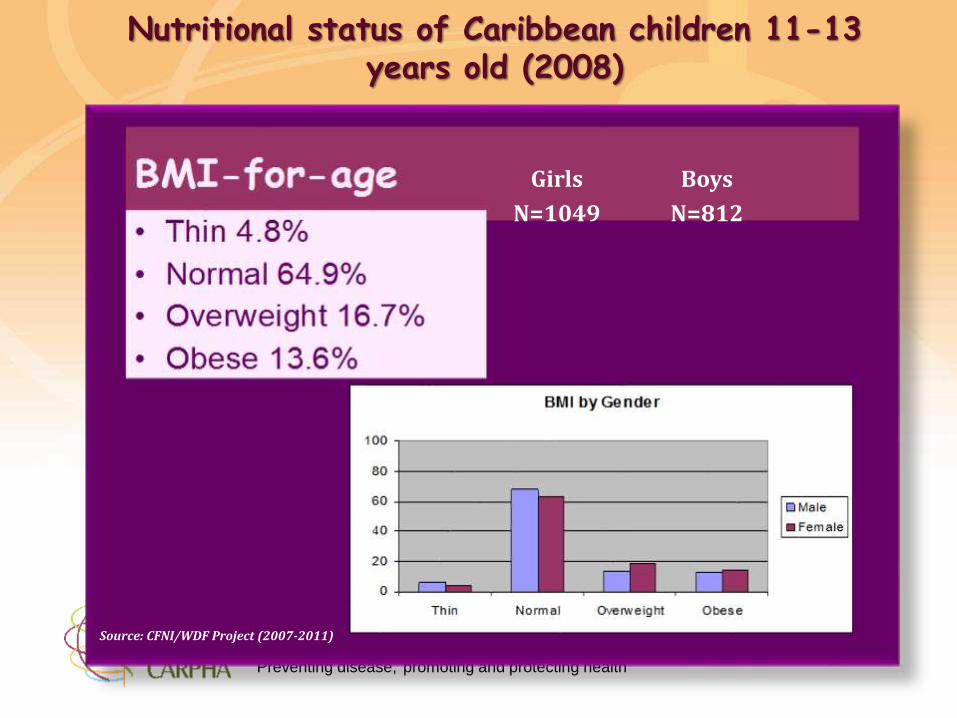
Boys
N=812
Girls
N=1049
Source: CFNI/WDF Project (2007-2011)
Nutritional status of Caribbean children 11-13 years old (2008)
Preventing disease, promoting and protecting health
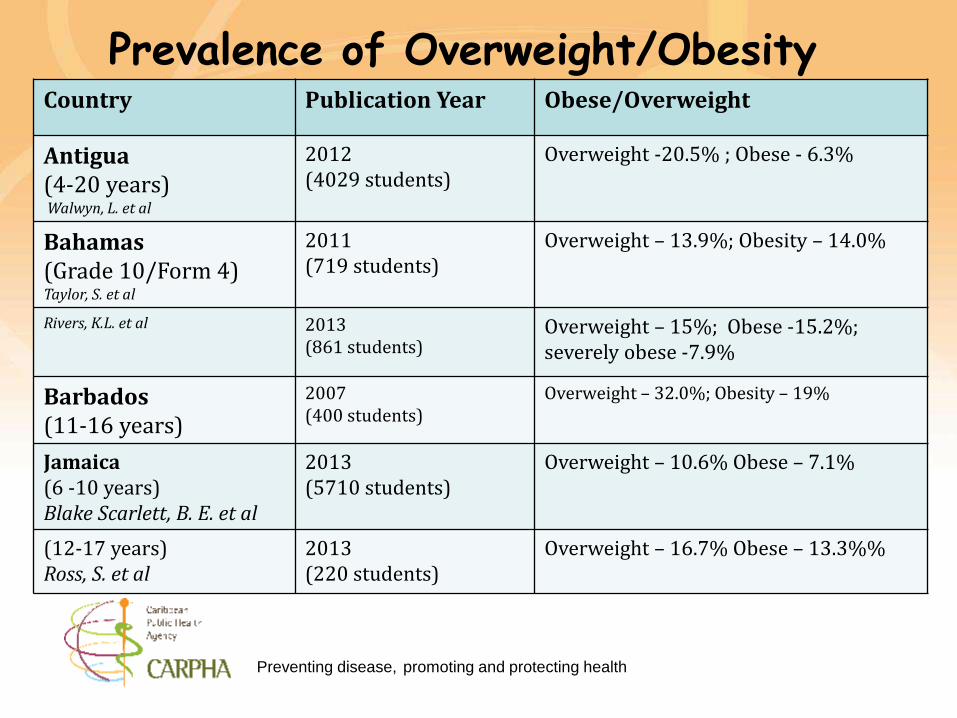
Prevalence of Overweight/ObesityCountry Publication Year Obese/Overweight
Antigua(4-20 years)Walwyn, L. et al
2012(4029 students)
Overweight -20.5% ; Obese - 6.3%
Bahamas(Grade 10/Form 4) Taylor, S. et al
2011(719 students)
Overweight – 13.9%; Obesity – 14.0%
Rivers, K.L. et al 2013(861 students)
Overweight – 15%; Obese -15.2%;severely obese -7.9%
Barbados(11-16 years)
2007(400 students)
Overweight – 32.0%; Obesity – 19%
Jamaica(6 -10 years) Blake Scarlett, B. E. et al
2013(5710 students)
Overweight – 10.6% Obese – 7.1%
(12-17 years)Ross, S. et al
2013(220 students)
Overweight – 16.7% Obese – 13.3%%
Preventing disease, promoting and protecting health
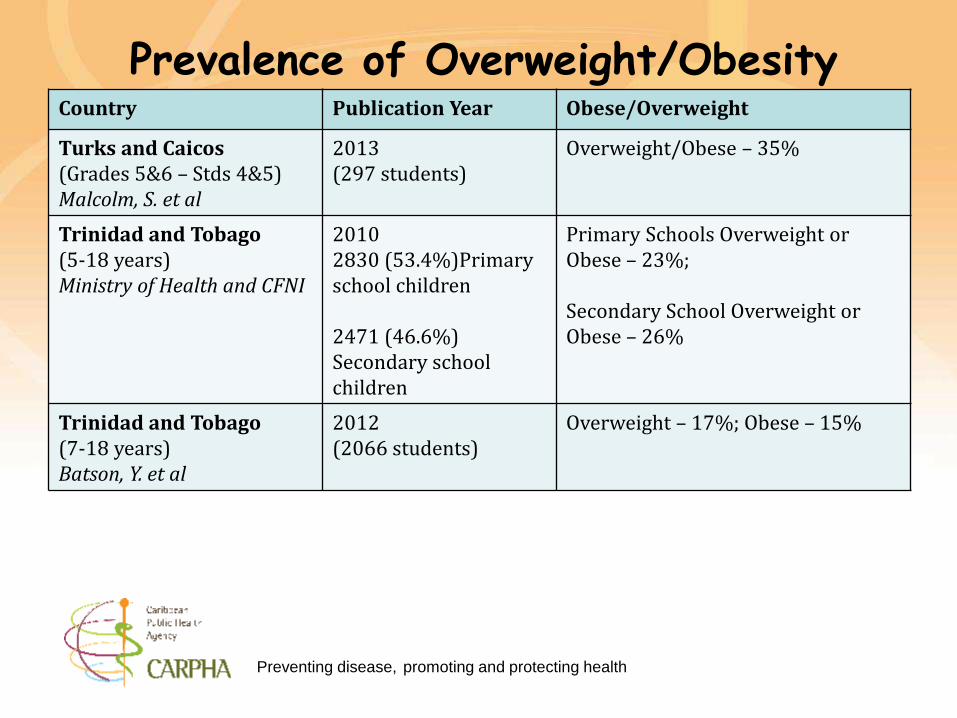
Prevalence of Overweight/ObesityCountry Publication Year Obese/Overweight
Turks and Caicos(Grades 5&6 – Stds 4&5)Malcolm, S. et al
2013(297 students)
Overweight/Obese – 35%
Trinidad and Tobago(5-18 years)Ministry of Health and CFNI
20102830 (53.4%)Primary school children
2471 (46.6%) Secondary school children
Primary Schools Overweight or Obese – 23%;
Secondary School Overweight or Obese – 26%
Trinidad and Tobago(7-18 years)Batson, Y. et al
2012(2066 students)
Overweight – 17%; Obese – 15%
Preventing disease, promoting and protecting health
Preventing disease, promoting and protecting health
• At present we cannot make a definitive statement on thenutritional status of the populations of the region. We haveperiodic surveys (MICS; SLC; Poverty Assessments; GSHS(Global School Based Student Health Survey; STEPS Survey)but not surveillance data.
• Many countries collect some data and analyse while others donot: what is collected is sometimes piecemeal and may onlyfocus on the under 5 and children at entry to and exit fromPrimary School.
• There is rarely any data management system.
Food and Nutrition Surveillance
Preventing disease, promoting and protecting health
Food and Nutrition Surveillance is also important todocument milestones in the achievement of the NCD GlobalTargets as well as initiatives such as:
• Millennium Development Goals (8 Goals; 21 targets and 60indicators)
• Goal 1: Eradicate extreme poverty and hunger
• Goal 2: Achieve universal primary education
• Goal 3: Promote gender equality and empower women
• Goal 4: Reduce child mortality
• Goal 5: Improve maternal health
• Goal 6: Combat HIV/AIDS, malaria and other diseases
• Goal 7: Ensure environmental sustainability
• Goal 8: Develop a Global Partnership for Development
• The Port of Spain Declaration
• The UN High Level Meeting; to name a few.
Food and Nutrition Surveillance
Preventing disease, promoting and protecting health
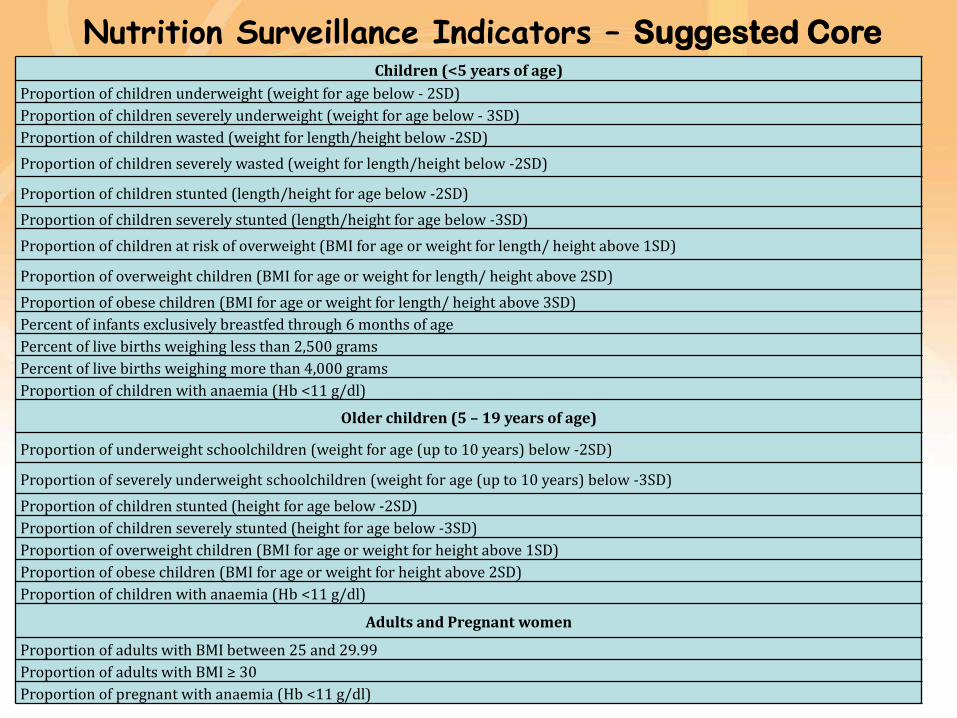
Indicators:
• These should be defined in practical terms and the most usefuland effective indicators selected.
• The following are suggested core and minimum corenutrition indicators that should be collected and reported onby all the countries.
• Some are already being measured in countries. However, thesystem needs to focus on the analysis and reporting of theseindicators.
Food and Nutrition Surveillance
Preventing disease, promoting and protecting health
Children (<5 years of age)
Proportion of children underweight (weight for age below - 2SD)
Proportion of children severely underweight (weight for age below - 3SD)
Proportion of children wasted (weight for length/height below -2SD)
Proportion of children severely wasted (weight for length/height below -2SD)
Proportion of children stunted (length/height for age below -2SD)
Proportion of children severely stunted (length/height for age below -3SD)
Proportion of children at risk of overweight (BMI for age or weight for length/ height above 1SD)
Proportion of overweight children (BMI for age or weight for length/ height above 2SD)
Proportion of obese children (BMI for age or weight for length/ height above 3SD)
Percent of infants exclusively breastfed through 6 months of age
Percent of live births weighing less than 2,500 grams
Percent of live births weighing more than 4,000 grams
Proportion of children with anaemia (Hb <11 g/dl)
Older children (5 – 19 years of age)
Proportion of underweight schoolchildren (weight for age (up to 10 years) below -2SD)
Proportion of severely underweight schoolchildren (weight for age (up to 10 years) below -3SD)
Proportion of children stunted (height for age below -2SD)
Proportion of children severely stunted (height for age below -3SD)
Proportion of overweight children (BMI for age or weight for height above 1SD)
Proportion of obese children (BMI for age or weight for height above 2SD)
Proportion of children with anaemia (Hb <11 g/dl)
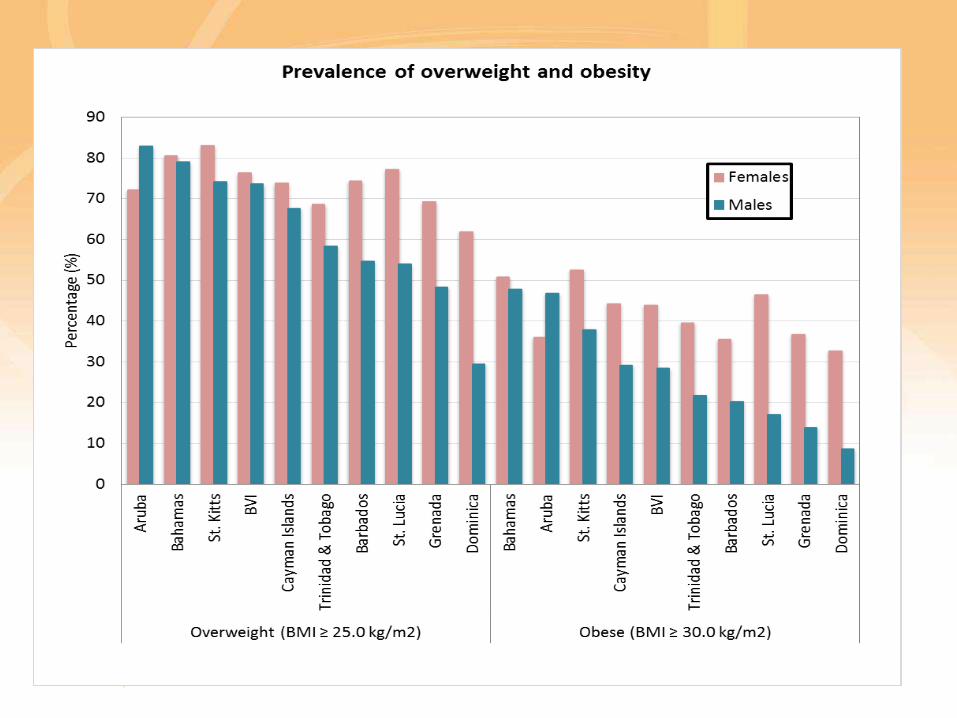
Adults and Pregnant women
Proportion of adults with BMI between 25 and 29.99
Proportion of adults with BMI ≥ 30
Proportion of pregnant with anaemia (Hb <11 g/dl)
Nutrition Surveillance Indicators – Suggested Core
Preventing disease, promoting and protecting health
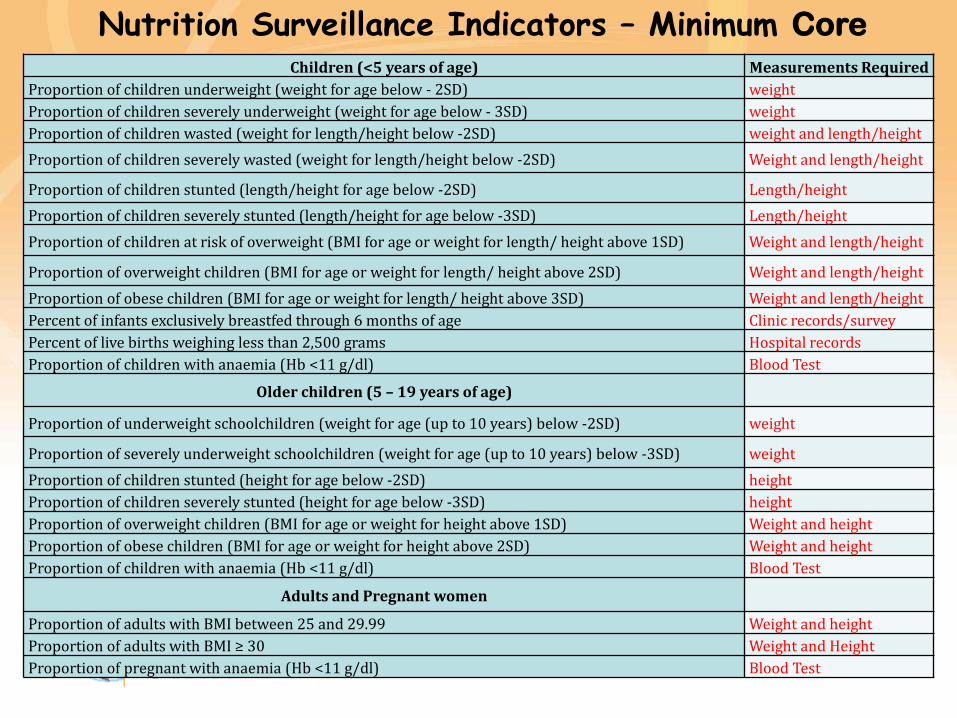
Nutrition Surveillance Indicators – Minimum Core
Children (<5 years of age) Measurements Required
Proportion of children underweight (weight for age below - 2SD) weight
Proportion of children severely underweight (weight for age below - 3SD) weight
Proportion of children wasted (weight for length/height below -2SD) weight and length/height
Proportion of children severely wasted (weight for length/height below -2SD) Weight and length/height
Proportion of children stunted (length/height for age below -2SD) Length/height
Proportion of children severely stunted (length/height for age below -3SD) Length/height
Proportion of children at risk of overweight (BMI for age or weight for length/ height above 1SD) Weight and length/height
Proportion of overweight children (BMI for age or weight for length/ height above 2SD) Weight and length/height
Proportion of obese children (BMI for age or weight for length/ height above 3SD) Weight and length/height
Percent of infants exclusively breastfed through 6 months of age Clinic records/survey
Percent of live births weighing less than 2,500 grams Hospital records
Proportion of children with anaemia (Hb <11 g/dl) Blood Test
Older children (5 – 19 years of age)
Proportion of underweight schoolchildren (weight for age (up to 10 years) below -2SD) weight
Proportion of severely underweight schoolchildren (weight for age (up to 10 years) below -3SD) weight
Proportion of children stunted (height for age below -2SD) height
Proportion of children severely stunted (height for age below -3SD) height
Proportion of overweight children (BMI for age or weight for height above 1SD) Weight and height
Proportion of obese children (BMI for age or weight for height above 2SD) Weight and height
Proportion of children with anaemia (Hb <11 g/dl) Blood Test
Adults and Pregnant women
Proportion of adults with BMI between 25 and 29.99 Weight and height
Proportion of adults with BMI ≥ 30 Weight and Height
Proportion of pregnant with anaemia (Hb <11 g/dl) Blood Test
Preventing disease, promoting and protecting health
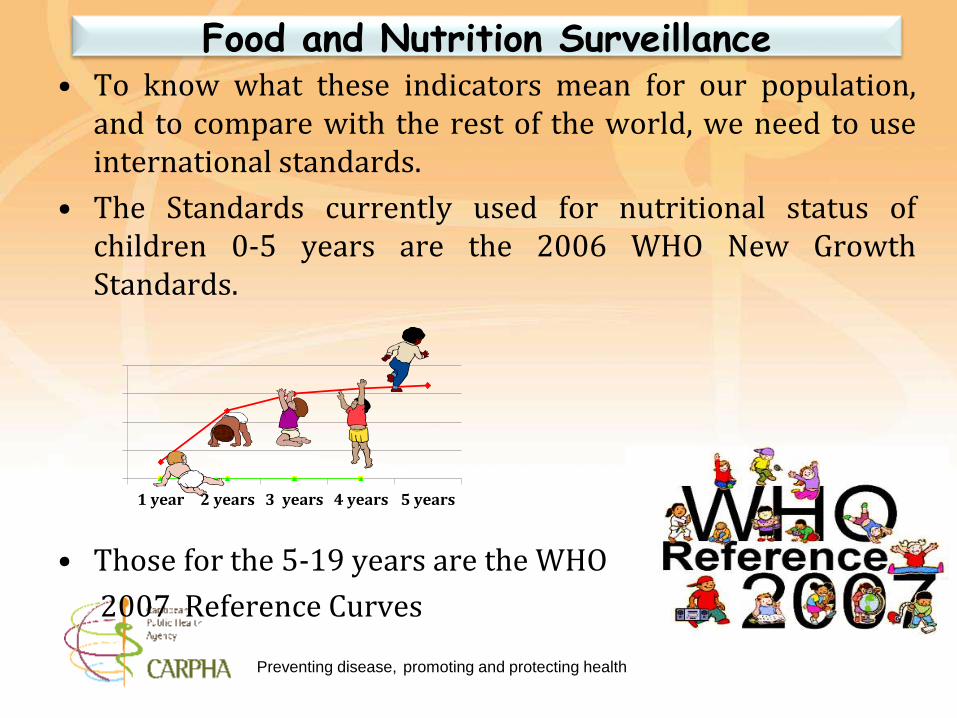
• To know what these indicators mean for our population,and to compare with the rest of the world, we need to useinternational standards.
• The Standards currently used for nutritional status ofchildren 0-5 years are the 2006 WHO New GrowthStandards.
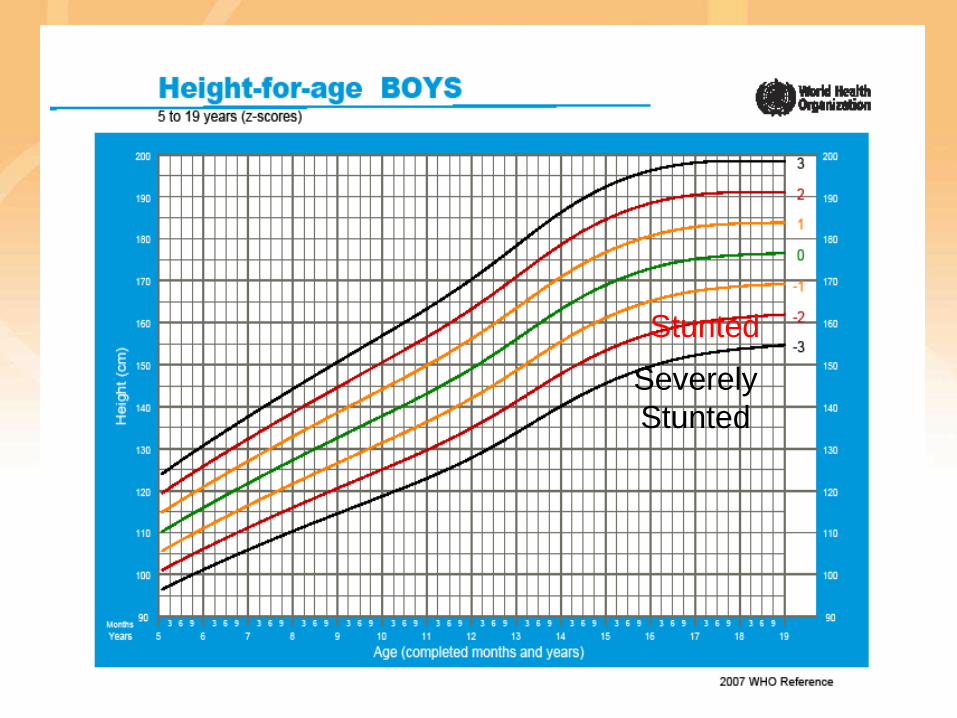
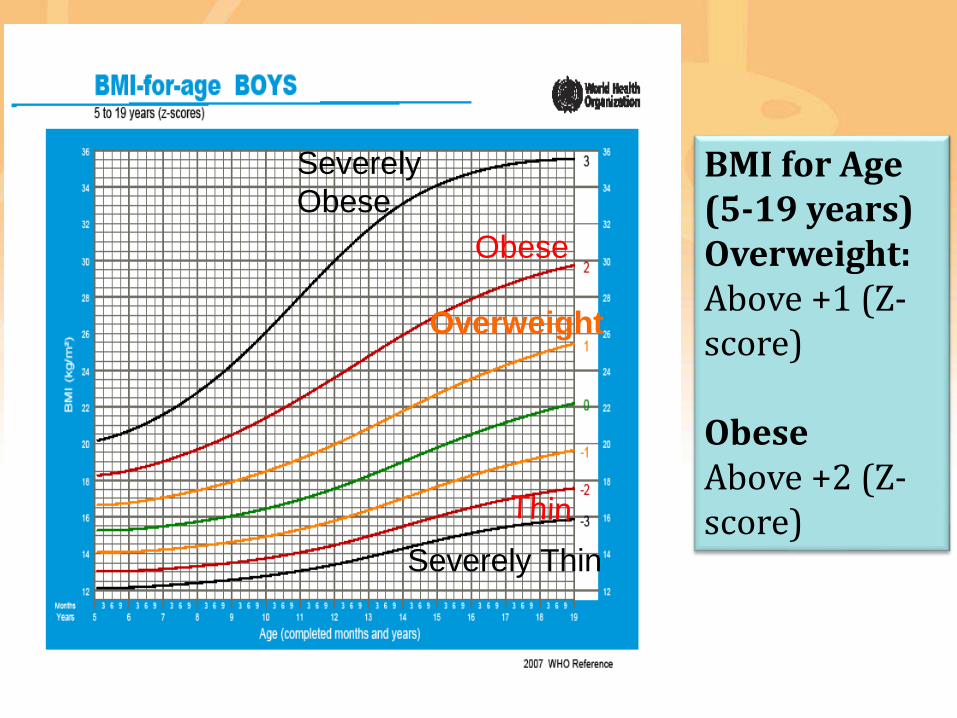
• Those for the 5-19 years are the WHO
2007 Reference Curves
Food and Nutrition Surveillance
1 year 2 years 3 years 4 years 5 years
Preventing disease, promoting and protecting health
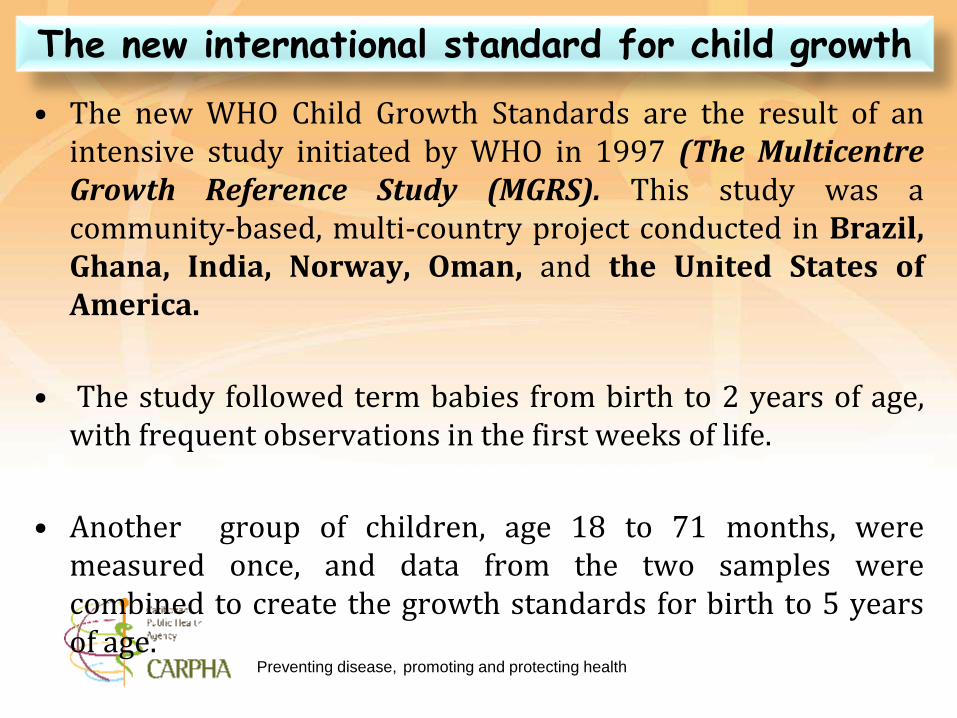
• The new WHO Child Growth Standards are the result of anintensive study initiated by WHO in 1997 (The MulticentreGrowth Reference Study (MGRS). This study was acommunity-based, multi-country project conducted in Brazil,Ghana, India, Norway, Oman, and the United States ofAmerica.
• The study followed term babies from birth to 2 years of age,with frequent observations in the first weeks of life.
• Another group of children, age 18 to 71 months, weremeasured once, and data from the two samples werecombined to create the growth standards for birth to 5 yearsof age.
The new international standard for child growth
Preventing disease, promoting and protecting health
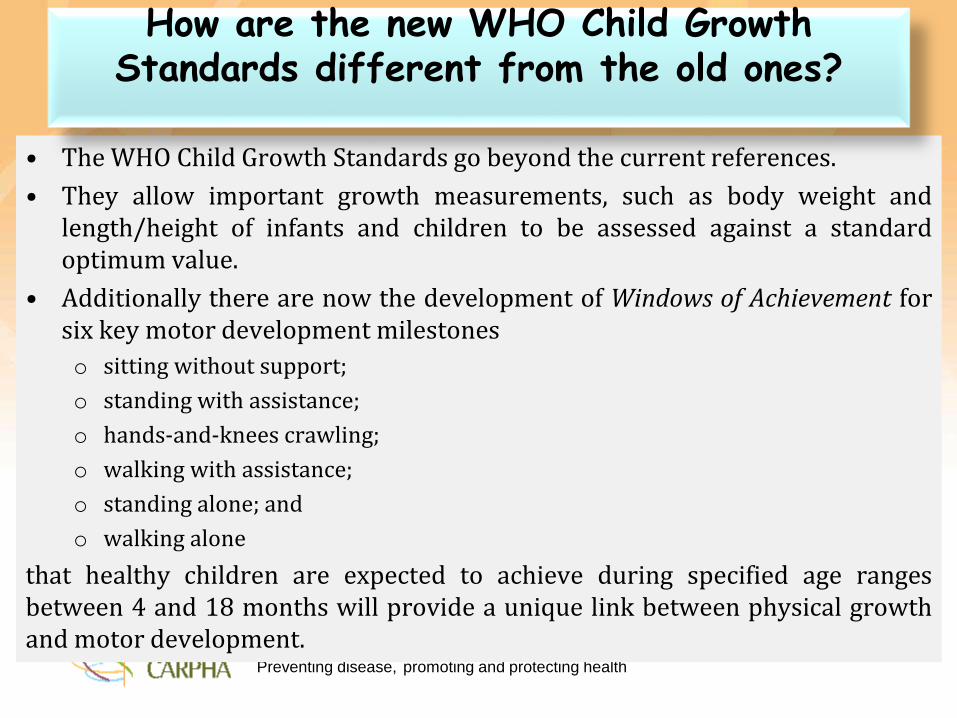
• The WHO Child Growth Standards go beyond the current references.
• They allow important growth measurements, such as body weight andlength/height of infants and children to be assessed against a standardoptimum value.
• Additionally there are now the development of Windows of Achievement forsix key motor development milestones
o sitting without support;
o standing with assistance;
o hands-and-knees crawling;
o walking with assistance;
o standing alone; and
o walking alone
that healthy children are expected to achieve during specified age rangesbetween 4 and 18 months will provide a unique link between physical growthand motor development.
How are the new WHO Child Growth Standards different from the old ones?
Preventing disease, promoting and protecting health
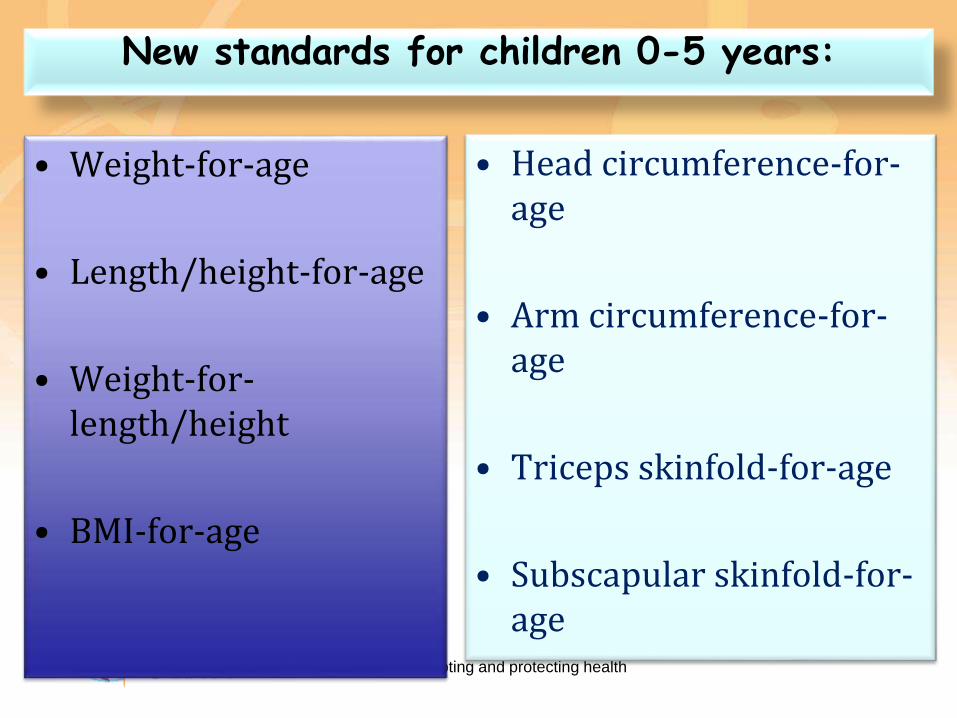
New standards for children 0-5 years:
• Weight-for-age
• Length/height-for-age
• Weight-for-length/height
• BMI-for-age
• Head circumference-for-age
• Arm circumference-for-age
• Triceps skinfold-for-age
• Subscapular skinfold-for-age
Preventing disease, promoting and protecting health
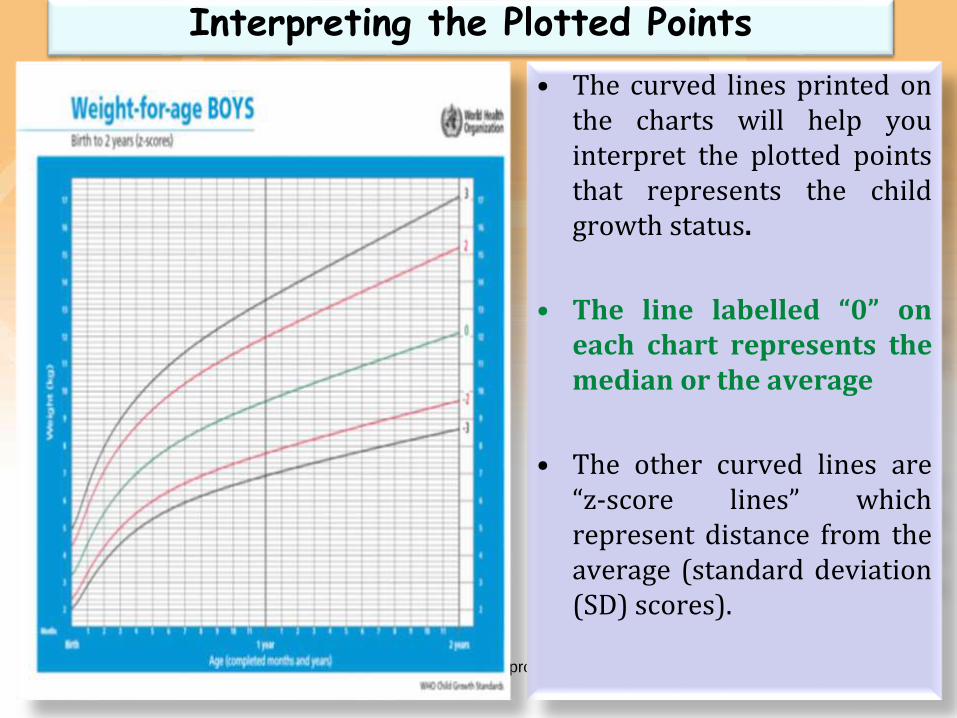
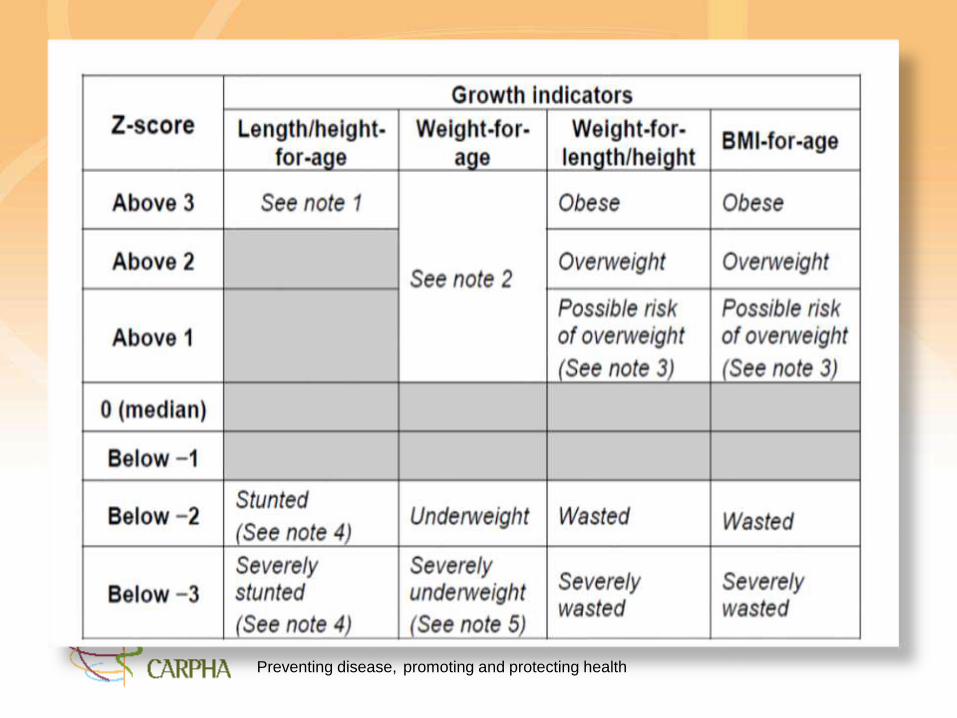
Interpreting the Plotted Points
• The curved lines printed onthe charts will help youinterpret the plotted pointsthat represents the childgrowth status.
• The line labelled “0” oneach chart represents themedian or the average
• The other curved lines are“z-score lines” whichrepresent distance from theaverage (standard deviation(SD) scores).
Preventing disease, promoting and protecting health
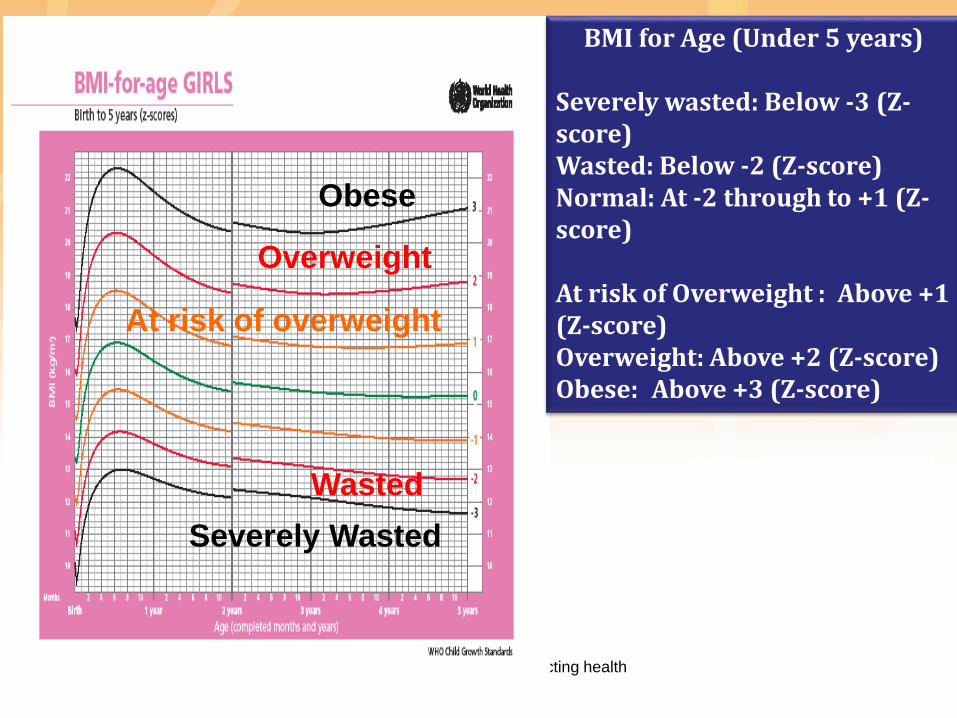
At risk of overweight
Overweight
Obese
Wasted
Severely Wasted
BMI for Age (Under 5 years)
Severely wasted: Below -3 (Z-score)Wasted: Below -2 (Z-score)Normal: At -2 through to +1 (Z-score)
At risk of Overweight : Above +1 (Z-score)Overweight: Above +2 (Z-score)Obese: Above +3 (Z-score)
Preventing disease, promoting and protecting health
Preventing disease, promoting and protecting health
Stunted
Severely
Stunted
Preventing disease, promoting and protecting health
Overweight
Obese
Severely Thin
Severely
ObeseBMI for Age (5-19 years)Overweight:Above +1 (Z-score)
ObeseAbove +2 (Z-score)
Preventing disease, promoting and protecting health
To assist countries the former CFNI and now continued by CARPHA workedwith member states to:
• revise their Child Clinic Records and Take Home Records in keeping withthe 2006 WHO Growth Standards
• Monitor the growth and development of children. The goal of growthmonitoring and promotion (GMP) in early childhood is to improve andmaintain the health and nutrition of young children. GMP involves the use ofinformation on the physical growth of children to counsel and guidemothers/fathers to make informed decisions on follow-up care.Supervision, including the periodic assessments of health workers’performance, and in-service training are important aspects of GMPprogrammes.
• They are needed to ensure that correct techniques of weighing and chartingare maintained and the quality of the counselling process is enhanced andsustained.
Nutrition Surveillance
Preventing disease, promoting and protecting health
Comparison
CDC 2000 and WHO 2006 Growth
Standards
Preventing disease, promoting and protecting health
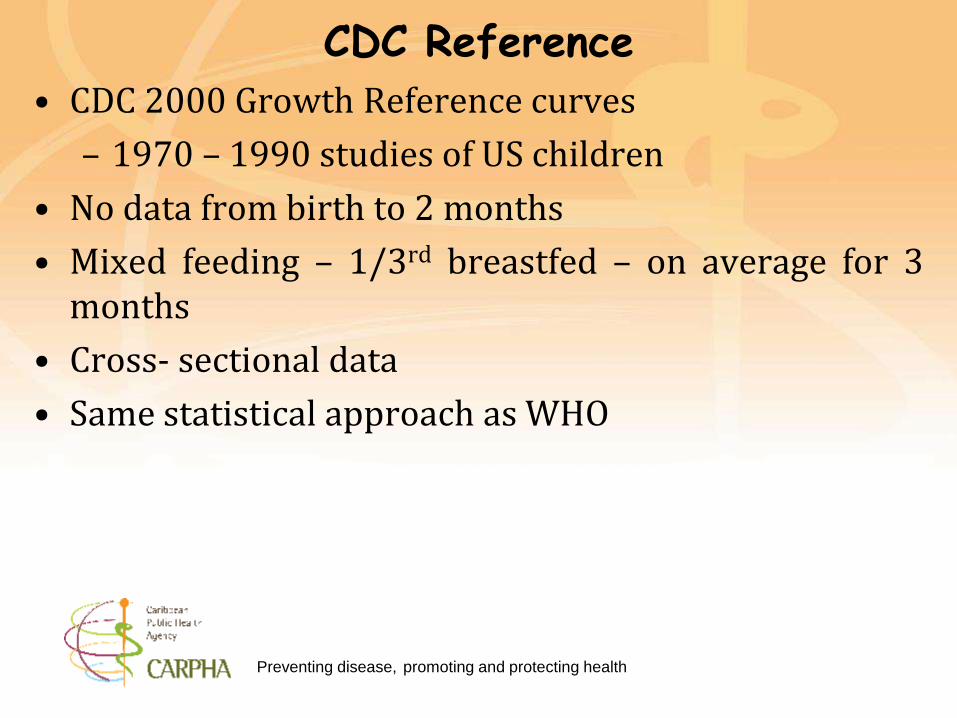
CDC Reference• CDC 2000 Growth Reference curves
– 1970 – 1990 studies of US children
• No data from birth to 2 months
• Mixed feeding – 1/3rd breastfed – on average for 3months
• Cross- sectional data
• Same statistical approach as WHO
Preventing disease, promoting and protecting health
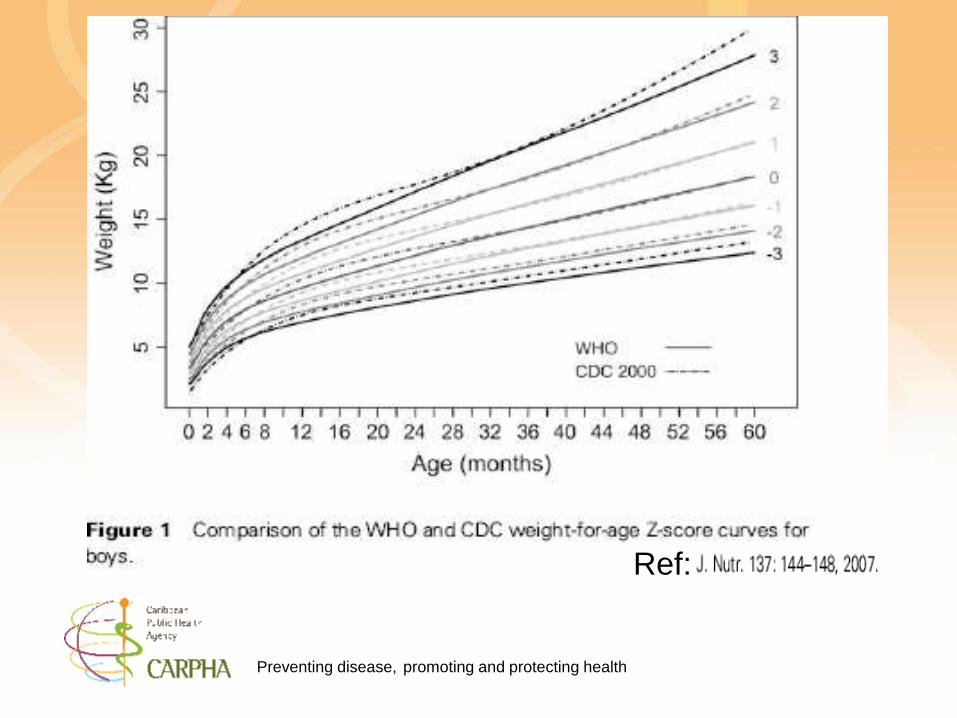
Ref:
Preventing disease, promoting and protecting health
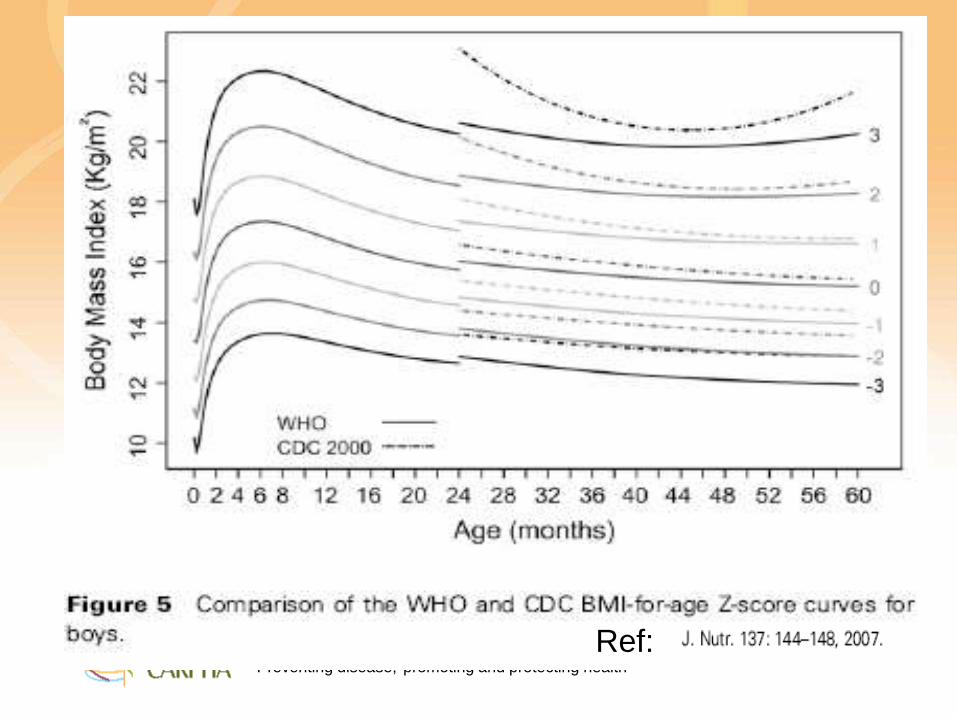
Ref:
Preventing disease, promoting and protecting health31
Differences between the NCHS
1978 and the WHO 2006 growth
curves
Preventing disease, promoting and protecting health
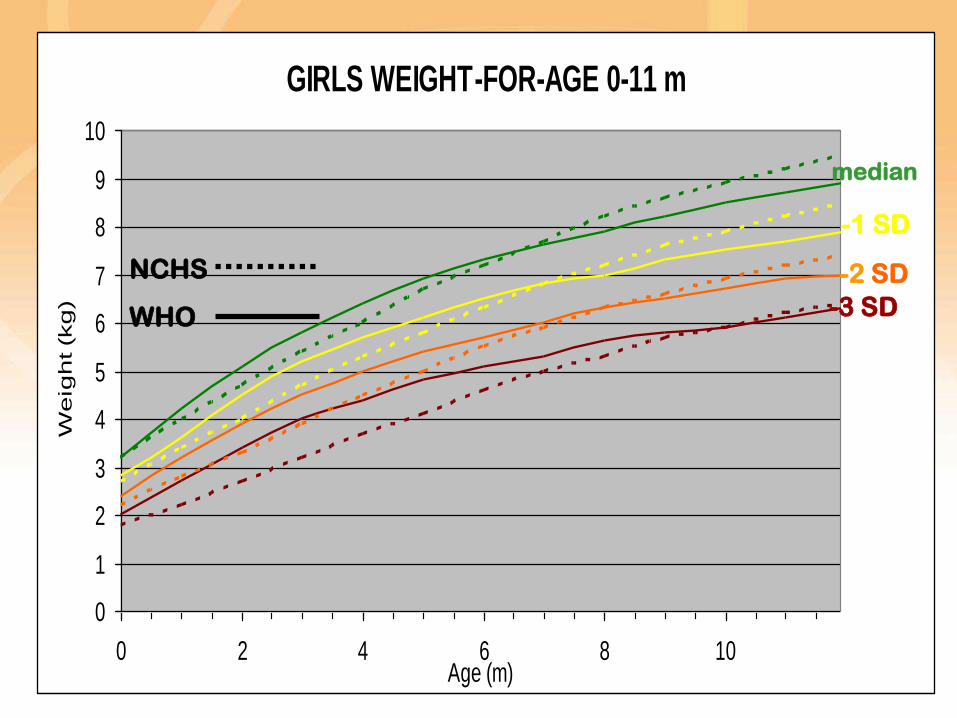
GIRLS WEIGHT-FOR-AGE 0-11 m
0
1
2
3
4
5
6
7
8
9
10
0 2 4 6 8 10Age (m)
We
igh
t (k
g)
NCHS
WHO
median
-1 SD
-2 SD
-3 SD
Preventing disease, promoting and protecting health
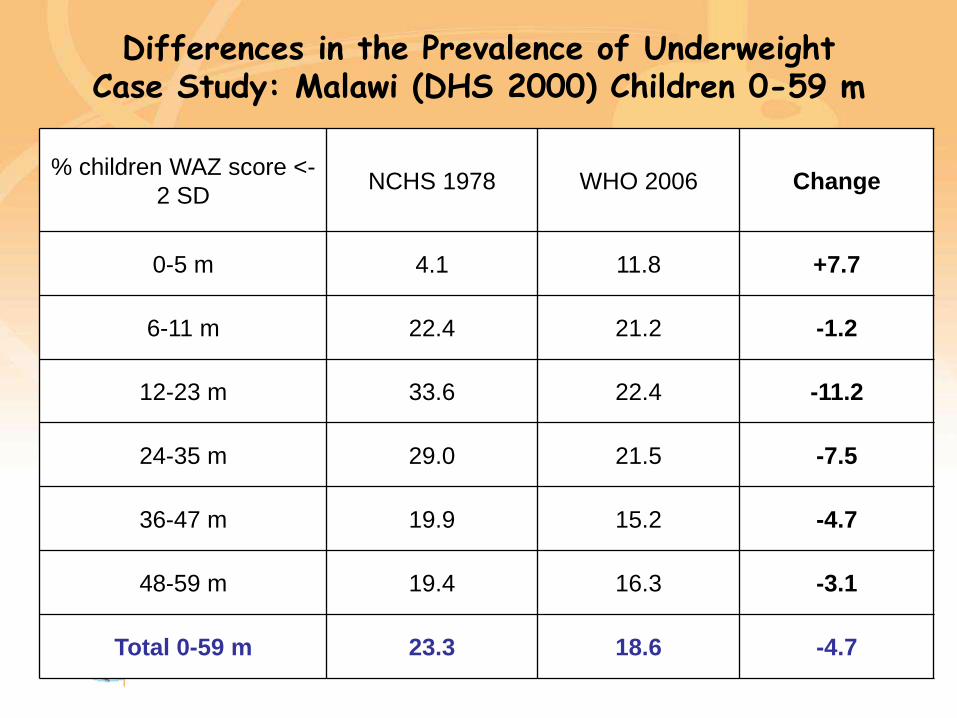
Differences in the Prevalence of Underweight Case Study: Malawi (DHS 2000) Children 0-59 m
% children WAZ score <-
2 SDNCHS 1978 WHO 2006 Change
0-5 m 4.1 11.8 +7.7
6-11 m 22.4 21.2 -1.2
12-23 m 33.6 22.4 -11.2
24-35 m 29.0 21.5 -7.5
36-47 m 19.9 15.2 -4.7
48-59 m 19.4 16.3 -3.1
Total 0-59 m 23.3 18.6 -4.7
Preventing disease, promoting and protecting health
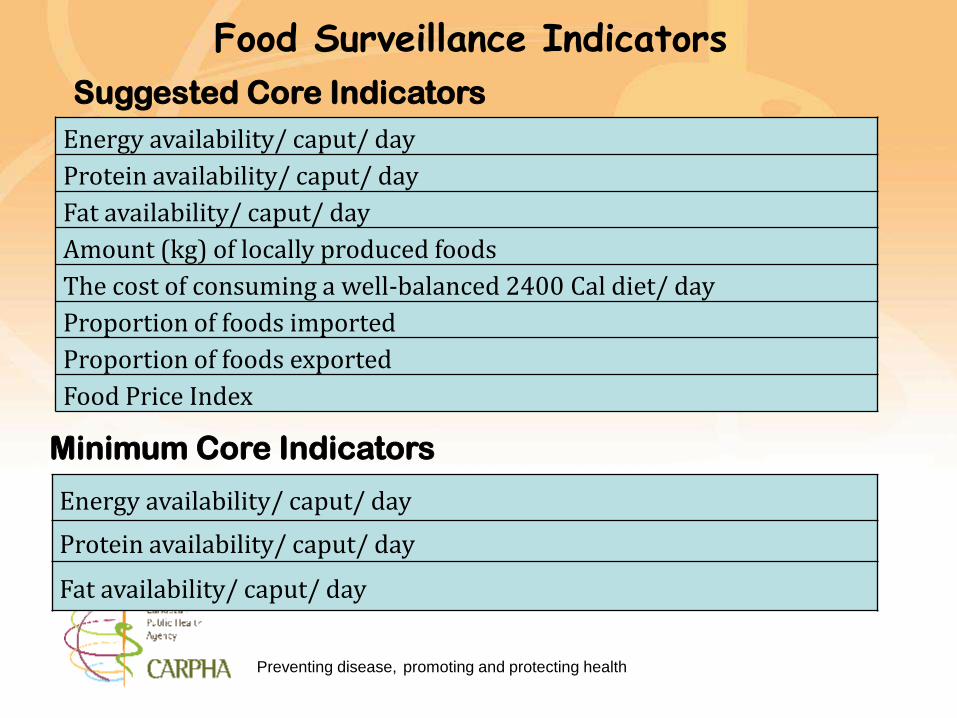
Food Surveillance Indicators
Energy availability/ caput/ day
Protein availability/ caput/ day
Fat availability/ caput/ day
Energy availability/ caput/ day
Protein availability/ caput/ day
Fat availability/ caput/ day
Amount (kg) of locally produced foods
The cost of consuming a well-balanced 2400 Cal diet/ day
Proportion of foods imported
Proportion of foods exported
Food Price Index
Suggested Core Indicators
Minimum Core Indicators
Preventing disease, promoting and protecting health
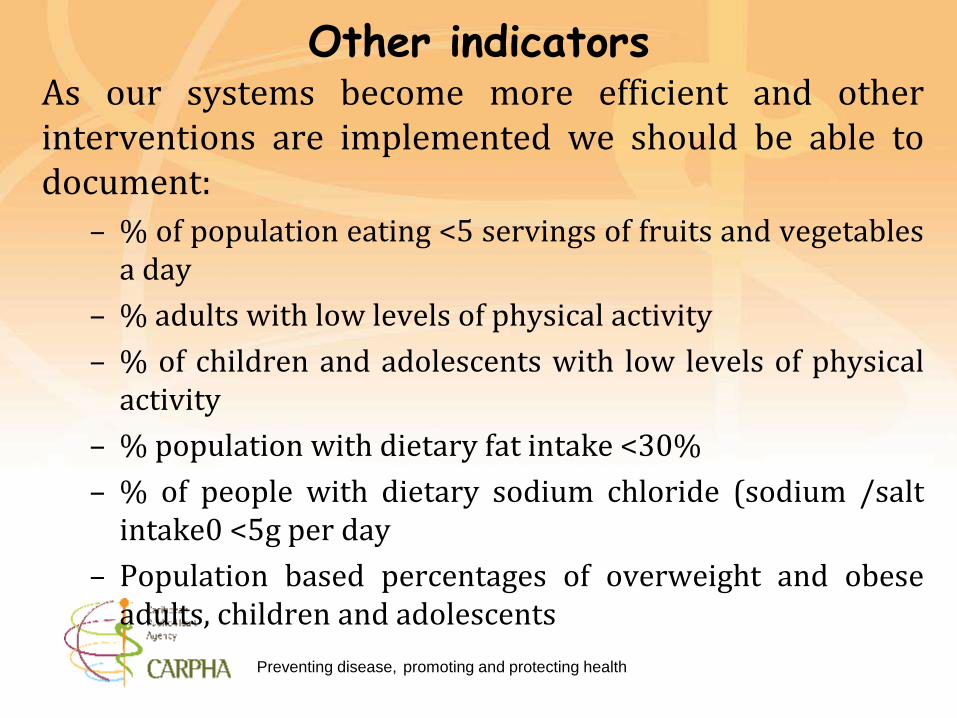
Other indicators As our systems become more efficient and otherinterventions are implemented we should be able todocument:
– % of population eating <5 servings of fruits and vegetablesa day
– % adults with low levels of physical activity
– % of children and adolescents with low levels of physicalactivity
– % population with dietary fat intake <30%
– % of people with dietary sodium chloride (sodium /saltintake0 <5g per day
– Population based percentages of overweight and obeseadults, children and adolescents
Preventing disease, promoting and protecting health
• For the FNSS to function effectively appropriatemanagerial and physical structures need to bestrengthened or put in place.
• Data entry should not be an end in itself.
• The information system should be adequately managed.
Food and Nutrition Surveillance
Preventing disease, promoting and protecting health
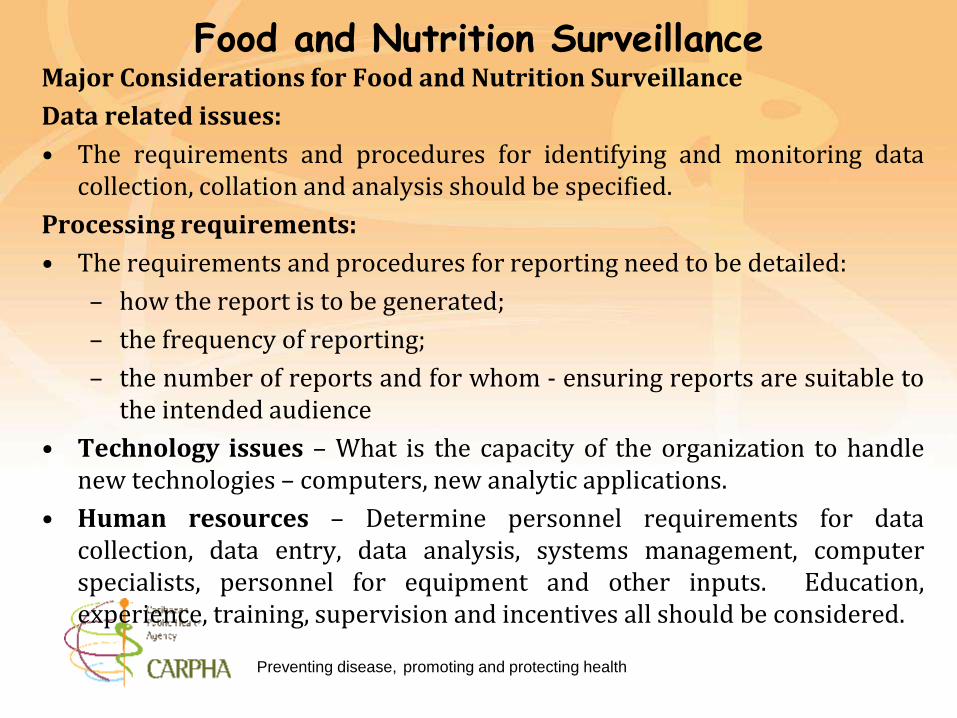
Major Considerations for Food and Nutrition Surveillance
Data related issues:
• The requirements and procedures for identifying and monitoring datacollection, collation and analysis should be specified.
Processing requirements:
• The requirements and procedures for reporting need to be detailed:
– how the report is to be generated;
– the frequency of reporting;
– the number of reports and for whom - ensuring reports are suitable tothe intended audience
• Technology issues – What is the capacity of the organization to handlenew technologies – computers, new analytic applications.
• Human resources – Determine personnel requirements for datacollection, data entry, data analysis, systems management, computerspecialists, personnel for equipment and other inputs. Education,experience, training, supervision and incentives all should be considered.
Food and Nutrition Surveillance