Embed Size (px)
Citation preview
Published: August 29, 2011
r 2011 American Chemical Society 19274 dx.doi.org/10.1021/jp206052t | J. Phys. Chem. C 2011, 115, 19274–19279
ARTICLE
pubs.acs.org/JPCC
Preventing Dye Aggregation on ZnO by Adding Water in theDye-Sensitization ProcessRebecka Sch€olin,† María Quintana,‡ Erik M. J. Johansson,§ Maria Hahlin,† Tannia Marinado,‡
Anders Hagfeldt,§ and H�akan Rensmo*,†
†Department of Physics and Astronomy,Molecular and CondensedMatter Physics, Uppsala University, Box 516, SE-751 20 Uppsala, Sweden‡Inorganic Chemistry, Center of Molecular Devices, Chemical Science and Engineering, Royal Institute of Technology,SE-100 44 Stockholm, Sweden§Department of Physical and Analytical Chemistry, Uppsala University, Box 259, SE-751 05 Uppsala, Sweden
’ INTRODUCTION
Dye-sensitized solar cells are widely studied as an alternative toconventional solar cells.1 A mesoporous film of a semiconductorsensitized with a dye together with an electrolyte and a back con-tact forms the complete solar cell.
The most common semiconductor material is TiO2, butothers are also of interest, where ZnO is one of the best candidates.A similar energy position of the conduction band and a similarband gap as TiO2
2 has been the principal motivation. Eventhough ZnO possess higher electron mobility and larger flex-ibility concerning different structural morphologies3 (i.e., nanoparticles, nano rods, nano wires) it is still not performing as goodas TiO2 in dye senstitized solar cells.
Several dyes have been used for sensitized ZnO electrodes,e.g., eosin Y,4,5 mercurochrome,6 squaraine,7 organic,8 and Ruthe-nium dyes, N719 being a common dye for ZnO dye-sensitizedsolar cells.3,9 Earlier studies using Ru-dyes and ZnO show adecrease in solar cell performance with increasing immersingtime of the ZnO electrodes in the dye bath for ruthenium dyes.10�14
According to these studies, the dye sensitization process on ZnOelectrodes entails a small amount of Zn2+ ions dissolving into thedye bath, with a subsequent surface aggregation of the dye andZn2+ ions occurring. Formation of aggregates on ZnO has alsobeen observed for organic dyes15 and indoline dyes.16 In general,when such aggregates are present on the working electrode, thecell performance is low. Hence, to understand how dyeaggregation takes place in the sensitization process, and learnhow to avoid it, are crucial aspects to achieve efficient ZnOsolar cells. Approaches to avoid dye aggregation have been theaddition of coadsorbents in the dye bath17 or modification ofthe dye molecule.18,19
In this paper we study the dependence of water for dyeaggregation on ZnO electrodes using the ruthenium dyesN719 and Z-907, the first being soluble in water while the latteris not. Earlier studies of TiO2 shows that water can affect thebonding behavior to the mesoporous electrode20 and also thesolar cell performance.21�24 For ZnO, it has been showed that wateraffect the growth rate and the crystallinity of the nanocrystals.25
Some basic measurement techniques has been used in thisstudy to characterize the function of the solar cells, e.g., incidentphoton to current conversion efficiency (IPCE), current�voltage (IV), absorption measurements, and intensity modulatedphotocurrent and photovoltage spectroscopy. However, themain focus of the characterization is effects on surface electronicand molecular structures. The work therefore contains a moredetailed study of the electronic energy levels and the molecularorientation relative to the oxide surface, using photoelectronspectroscopy (PES) techniques.
’EXPERIMENTAL SECTION
Preparation of ZnO Films. ZnO films were prepared from aZnO colloid with a ZnO particle size of 20 nm, presented inearlier publications.26,27 Transparent nanostructured ZnO elec-trodes were obtained by depositing the colloid onto conductingglass substrates (TEC8, Pilkington) by doctor blading, followedby heating in oven at 400 �C for 1 h. Film thickness wasdetermined by profilometry. To match the requirements for
Received: June 27, 2011Revised: August 23, 2011
ABSTRACT: ZnO based dye-sensitized solar cells have been studiedusing N719 and Z-907 as sensitizing dyes, with and without includingwater to the dye solution. The solar cells have been characterized withphotoelectric measurements and the interface between the dye and theZnO surface has been studied using photoelectron spectroscopy. It wasshown that water in the dye solution greatly reduces surface dyeaggregation and thereby enhances the solar cell performance for N719.For Z-907 where no sign of dye aggregation could be found, the presenceof water had minor effect on the surface structure and solar cellperformance.
19275 dx.doi.org/10.1021/jp206052t |J. Phys. Chem. C 2011, 115, 19274–19279
The Journal of Physical Chemistry C ARTICLE
the photoelectron spectroscopy measurements, the ZnO filmshad to be limited in thickness and were made 3.5 μm thick.Dye Sensitization and Solar Cell Assembly. The ZnO
electrodes were left overnight (15 h) in dye baths consisting of0.5 mM cis-diisothiocyanato-bis(2,20-bipyridyl-4,40-dicarboxylato)ruthenium(II) bis(tetrabutylammonium) (N719) solved in etha-nol or ethanol/water at a volume ratio of 1:1 and 0.15 mMcis-disothiocyanato-(2,20-bipyridyl-4,40-dicarboxylic acid)-(2,20-bipyridyl-4,40-dinonyl) ruthenium(II) (Z-907) solved in aceto-nitrile/tertbutanol at a volume ration of 1:1 or acetonitrile/tertbutanol/water at a volume ratio of 1:1:2. The dyes werepurchased from Solaronix. The dyed electrodes were rinsed withethanol and dried in air. Absorption measurements were per-formed before the cells were assembled with a platinized con-ducting glass counter electrode using a 50 μm thick thermoplasticframe (Surlyn 1702). The electrolytes were inserted into the cellthrough holes in the counter electrode and the electrolytecomposition was as follows: 0.1 M LiI, 0.6 M tetrabutyl ammo-nium iodide (TBAI), 0.5 M 4-tert butylpyridine (4-TBP), and0.1 M I2 in 3-methoxypropionitrile (MPN). The complete cellwas then sealed with thermoplastic (Surlyn 1702).For photoelectron spectroscopy analysis, a shorter sensitiza-
tion time of 10 min was also used for comparison. The dyeconcentrations and solvents were the same as described aboveexcept that a dye concentration of 0.3 mM were used for Z-907for short sensitization time and for longer time when no waterwas included in the solution. The dye coverage of Z-907 will beshown not to be affected by this difference in concentration.Characterization Methods. The setups for recording inci-
dent photon to current conversion efficiency (IPCE) spectra andIV curves under simulated sunlight consist of a Keithley 2400source/meter as a current meter and a xenon arc lamp (300 WCermax, ILCTechnology), followed by a 1/8mmonochromator(CVI Digikrom CM 110) as a light source, and has beendescribed in more detail elsewhere.2 The absorbance spectra ofthe dye-sensitized semiconductor films were measured with anabsorption spectrometer (Perkin-Elmer, Lambda 750). Correc-tion for scattering was made by subtracting the absorbance of theunsensitized electrodes.The electronic transport in the ZnO solar cells was studied,
using intensity modulated white light LED and measuring thephotovoltage or the photocurrent response. The method hasbeen described in more detail earlier.28
Photoelectron spectroscopy measurements were carried outon the sensitized ZnO electrodes at beamline I411 at the Swedishnational synchrotron facility MAX-lab, in Lund.29 The beamlinewas equipped with a Scienta R4000 WAL electron analyzer. Theelectron take off angle was 70�, and the electron take off directionwas collinear with the e-vector of the incident photon beam.Quantitative measurements of the amounts of elements at the
surface was performed with the in house ESCA300 spectrometerwhich is using Al Kα X-rays (1487 eV) and is calibrated for crosssection and analyzer transmission.30
All photoelectron spectroscopy spectra are energy calibratedrelative theN 1s peak arising from the bipyridyl nitrogen, and thispeak is set to binding energy 400 eV. The spectra are intensitycalibrated using the Ru 3d peak if not stated otherwise.
’RESULTS AND DISCUSSION
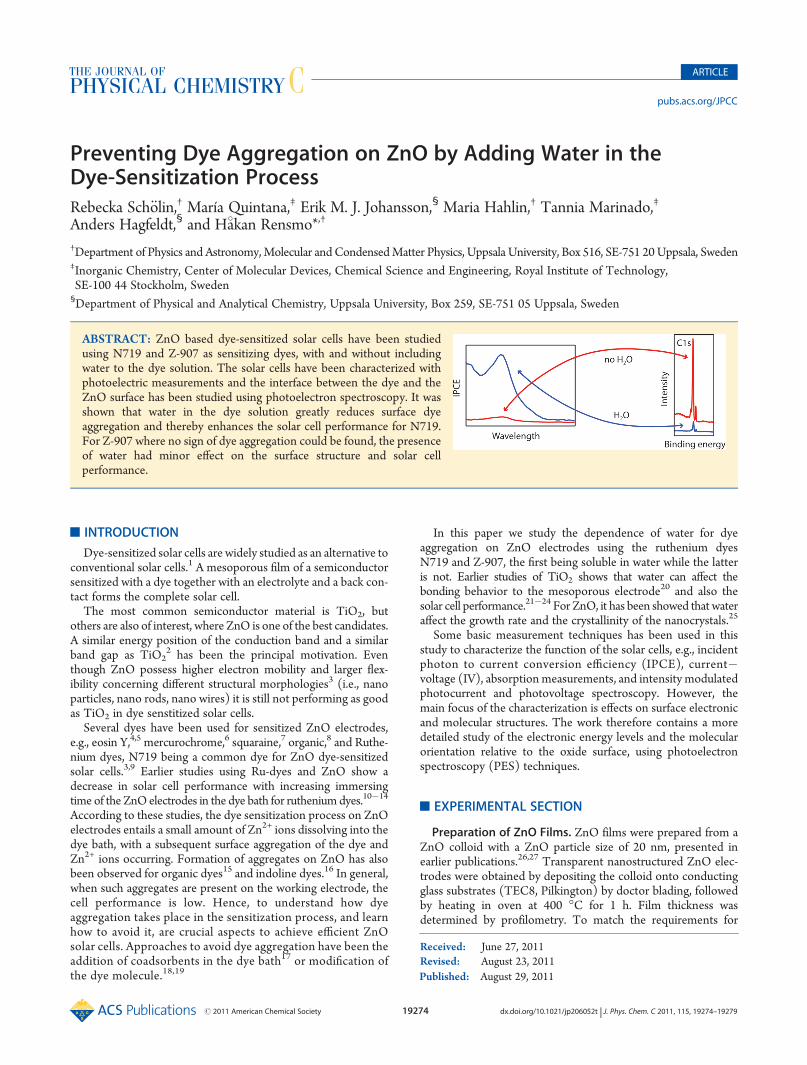
Solar Cell Characterization. The plotted IV curves arepresented in Figure 1 and the corresponding IV data are shown
in Table 1, η being the overall efficiency, Voc the open circuitvoltage, Isc the short circuit current and FF the fill factor. As canbe seen in Table 1, for ZnO/N719, the solar cell efficiencyincreases greatly when using water in the dye solution. The opencircuit voltage and the short circuit current is also increased. ForZnO/Z-907 there is also increased short circuit current withwater in the dye solution, but since the open circuit voltage at thesame time decreases, the efficiency remains the same.Incident photon to current conversion efficiency (IPCE) can
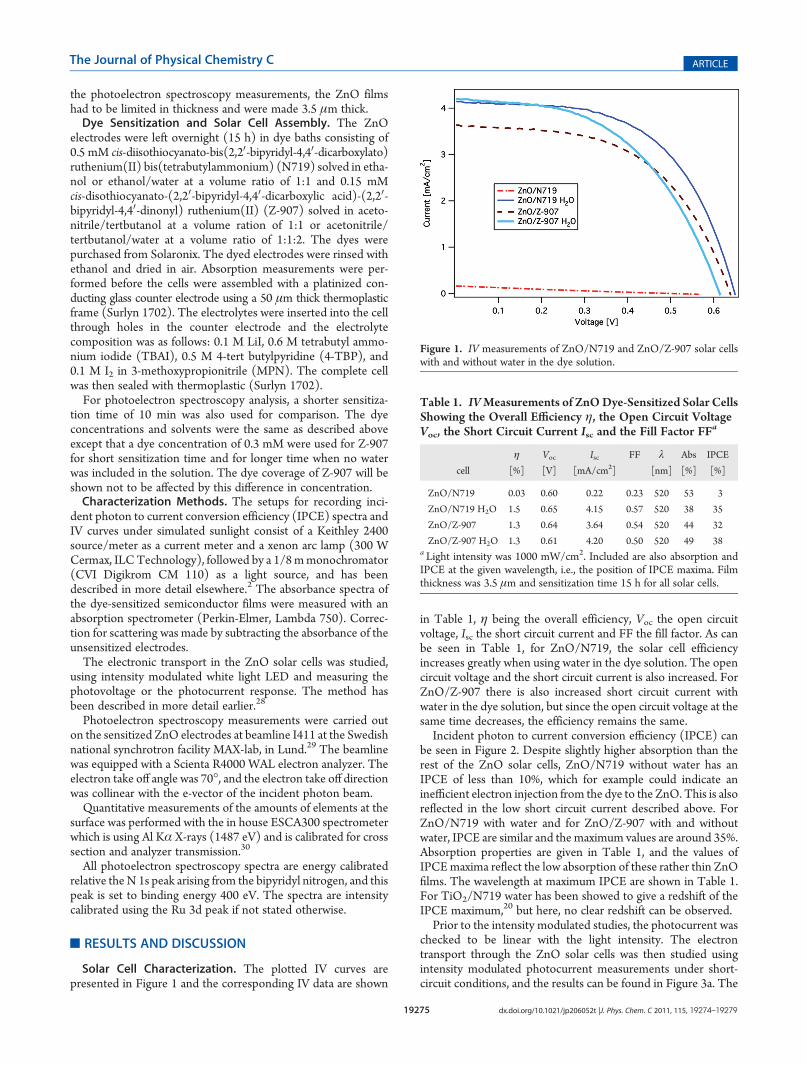
be seen in Figure 2. Despite slightly higher absorption than therest of the ZnO solar cells, ZnO/N719 without water has anIPCE of less than 10%, which for example could indicate aninefficient electron injection from the dye to the ZnO. This is alsoreflected in the low short circuit current described above. ForZnO/N719 with water and for ZnO/Z-907 with and withoutwater, IPCE are similar and the maximum values are around 35%.Absorption properties are given in Table 1, and the values ofIPCEmaxima reflect the low absorption of these rather thin ZnOfilms. The wavelength at maximum IPCE are shown in Table 1.For TiO2/N719 water has been showed to give a redshift of theIPCE maximum,20 but here, no clear redshift can be observed.Prior to the intensity modulated studies, the photocurrent was
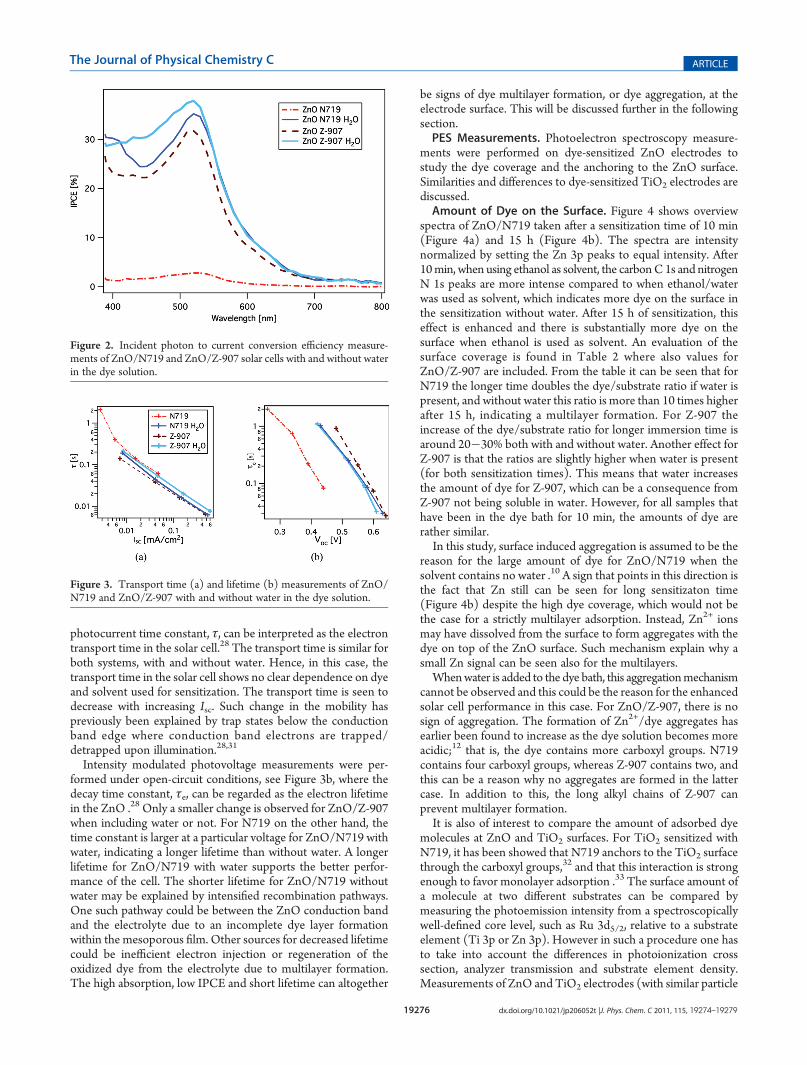
checked to be linear with the light intensity. The electrontransport through the ZnO solar cells was then studied usingintensity modulated photocurrent measurements under short-circuit conditions, and the results can be found in Figure 3a. The
Table 1. IVMeasurements of ZnODye-Sensitized Solar CellsShowing the Overall Efficiency η, the Open Circuit VoltageVoc, the Short Circuit Current Isc and the Fill Factor FFa
cell
η
[%]
Voc[V]
Isc[mA/cm2]
FF λ
[nm]
Abs
[%]
IPCE
[%]
ZnO/N719 0.03 0.60 0.22 0.23 520 53 3
ZnO/N719 H2O 1.5 0.65 4.15 0.57 520 38 35
ZnO/Z-907 1.3 0.64 3.64 0.54 520 44 32
ZnO/Z-907 H2O 1.3 0.61 4.20 0.50 520 49 38a Light intensity was 1000 mW/cm2. Included are also absorption andIPCE at the given wavelength, i.e., the position of IPCE maxima. Filmthickness was 3.5 μm and sensitization time 15 h for all solar cells.
Figure 1. IV measurements of ZnO/N719 and ZnO/Z-907 solar cellswith and without water in the dye solution.
19276 dx.doi.org/10.1021/jp206052t |J. Phys. Chem. C 2011, 115, 19274–19279
The Journal of Physical Chemistry C ARTICLE
photocurrent time constant, τ, can be interpreted as the electrontransport time in the solar cell.28 The transport time is similar forboth systems, with and without water. Hence, in this case, thetransport time in the solar cell shows no clear dependence on dyeand solvent used for sensitization. The transport time is seen todecrease with increasing Isc. Such change in the mobility haspreviously been explained by trap states below the conductionband edge where conduction band electrons are trapped/detrapped upon illumination.28,31
Intensity modulated photovoltage measurements were per-formed under open-circuit conditions, see Figure 3b, where thedecay time constant, τe, can be regarded as the electron lifetimein the ZnO .28 Only a smaller change is observed for ZnO/Z-907when including water or not. For N719 on the other hand, thetime constant is larger at a particular voltage for ZnO/N719 withwater, indicating a longer lifetime than without water. A longerlifetime for ZnO/N719 with water supports the better perfor-mance of the cell. The shorter lifetime for ZnO/N719 withoutwater may be explained by intensified recombination pathways.One such pathway could be between the ZnO conduction bandand the electrolyte due to an incomplete dye layer formationwithin the mesoporous film. Other sources for decreased lifetimecould be inefficient electron injection or regeneration of theoxidized dye from the electrolyte due to multilayer formation.The high absorption, low IPCE and short lifetime can altogether
be signs of dye multilayer formation, or dye aggregation, at theelectrode surface. This will be discussed further in the followingsection.PES Measurements. Photoelectron spectroscopy measure-
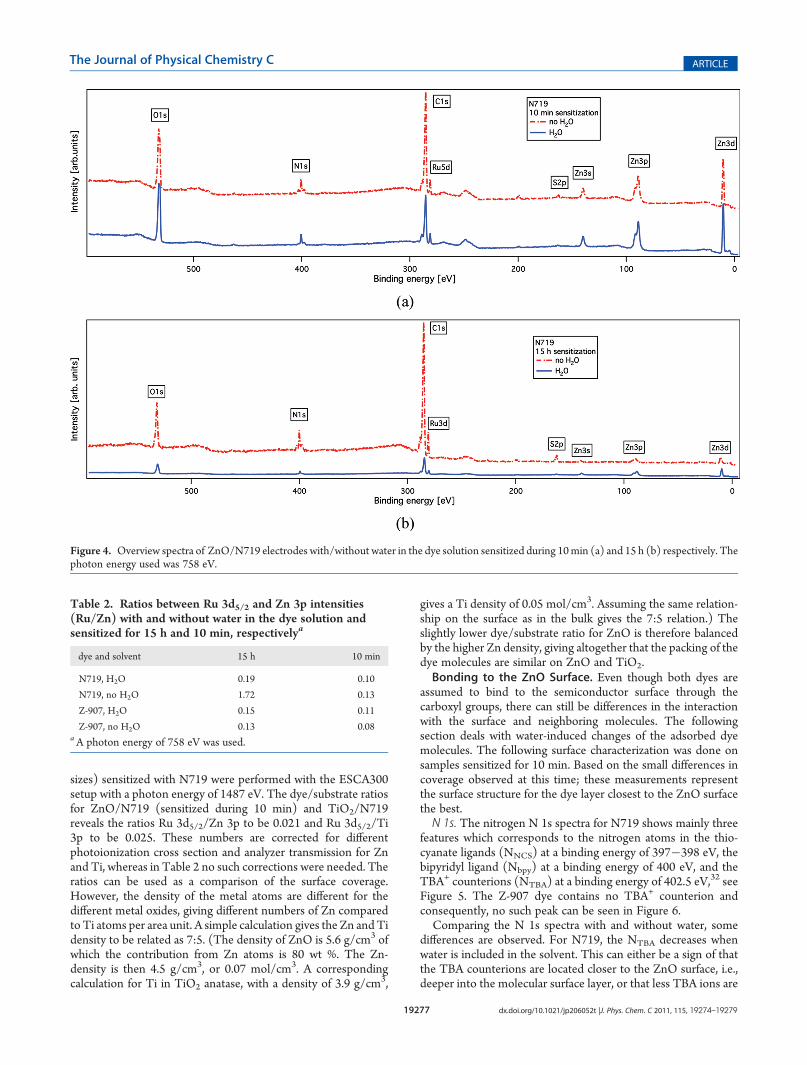
ments were performed on dye-sensitized ZnO electrodes tostudy the dye coverage and the anchoring to the ZnO surface.Similarities and differences to dye-sensitized TiO2 electrodes arediscussed.Amount of Dye on the Surface. Figure 4 shows overview
spectra of ZnO/N719 taken after a sensitization time of 10 min(Figure 4a) and 15 h (Figure 4b). The spectra are intensitynormalized by setting the Zn 3p peaks to equal intensity. After10min, when using ethanol as solvent, the carbonC 1s and nitrogenN 1s peaks are more intense compared to when ethanol/waterwas used as solvent, which indicates more dye on the surface inthe sensitization without water. After 15 h of sensitization, thiseffect is enhanced and there is substantially more dye on thesurface when ethanol is used as solvent. An evaluation of thesurface coverage is found in Table 2 where also values forZnO/Z-907 are included. From the table it can be seen that forN719 the longer time doubles the dye/substrate ratio if water ispresent, and without water this ratio is more than 10 times higherafter 15 h, indicating a multilayer formation. For Z-907 theincrease of the dye/substrate ratio for longer immersion time isaround 20�30% both with and without water. Another effect forZ-907 is that the ratios are slightly higher when water is present(for both sensitization times). This means that water increasesthe amount of dye for Z-907, which can be a consequence fromZ-907 not being soluble in water. However, for all samples thathave been in the dye bath for 10 min, the amounts of dye arerather similar.In this study, surface induced aggregation is assumed to be the
reason for the large amount of dye for ZnO/N719 when thesolvent contains no water .10 A sign that points in this direction isthe fact that Zn still can be seen for long sensitizaton time(Figure 4b) despite the high dye coverage, which would not bethe case for a strictly multilayer adsorption. Instead, Zn2+ ionsmay have dissolved from the surface to form aggregates with thedye on top of the ZnO surface. Such mechanism explain why asmall Zn signal can be seen also for the multilayers.Whenwater is added to the dye bath, this aggregationmechanism
cannot be observed and this could be the reason for the enhancedsolar cell performance in this case. For ZnO/Z-907, there is nosign of aggregation. The formation of Zn2+/dye aggregates hasearlier been found to increase as the dye solution becomes moreacidic;12 that is, the dye contains more carboxyl groups. N719contains four carboxyl groups, whereas Z-907 contains two, andthis can be a reason why no aggregates are formed in the lattercase. In addition to this, the long alkyl chains of Z-907 canprevent multilayer formation.It is also of interest to compare the amount of adsorbed dye
molecules at ZnO and TiO2 surfaces. For TiO2 sensitized withN719, it has been showed that N719 anchors to the TiO2 surfacethrough the carboxyl groups,32 and that this interaction is strongenough to favor monolayer adsorption .33 The surface amount ofa molecule at two different substrates can be compared bymeasuring the photoemission intensity from a spectroscopicallywell-defined core level, such as Ru 3d5/2, relative to a substrateelement (Ti 3p or Zn 3p). However in such a procedure one hasto take into account the differences in photoionization crosssection, analyzer transmission and substrate element density.Measurements of ZnO and TiO2 electrodes (with similar particle
Figure 3. Transport time (a) and lifetime (b) measurements of ZnO/N719 and ZnO/Z-907 with and without water in the dye solution.
Figure 2. Incident photon to current conversion efficiency measure-ments of ZnO/N719 and ZnO/Z-907 solar cells with and without waterin the dye solution.
19277 dx.doi.org/10.1021/jp206052t |J. Phys. Chem. C 2011, 115, 19274–19279
The Journal of Physical Chemistry C ARTICLE
sizes) sensitized with N719 were performed with the ESCA300setup with a photon energy of 1487 eV. The dye/substrate ratiosfor ZnO/N719 (sensitized during 10 min) and TiO2/N719reveals the ratios Ru 3d5/2/Zn 3p to be 0.021 and Ru 3d5/2/Ti3p to be 0.025. These numbers are corrected for differentphotoionization cross section and analyzer transmission for Znand Ti, whereas in Table 2 no such corrections were needed. Theratios can be used as a comparison of the surface coverage.However, the density of the metal atoms are different for thedifferent metal oxides, giving different numbers of Zn comparedto Ti atoms per area unit. A simple calculation gives the Zn and Tidensity to be related as 7:5. (The density of ZnO is 5.6 g/cm3 ofwhich the contribution from Zn atoms is 80 wt %. The Zn-density is then 4.5 g/cm3, or 0.07 mol/cm3. A correspondingcalculation for Ti in TiO2 anatase, with a density of 3.9 g/cm3,
gives a Ti density of 0.05 mol/cm3. Assuming the same relation-ship on the surface as in the bulk gives the 7:5 relation.) Theslightly lower dye/substrate ratio for ZnO is therefore balancedby the higher Zn density, giving altogether that the packing of thedye molecules are similar on ZnO and TiO2.Bonding to the ZnO Surface. Even though both dyes are
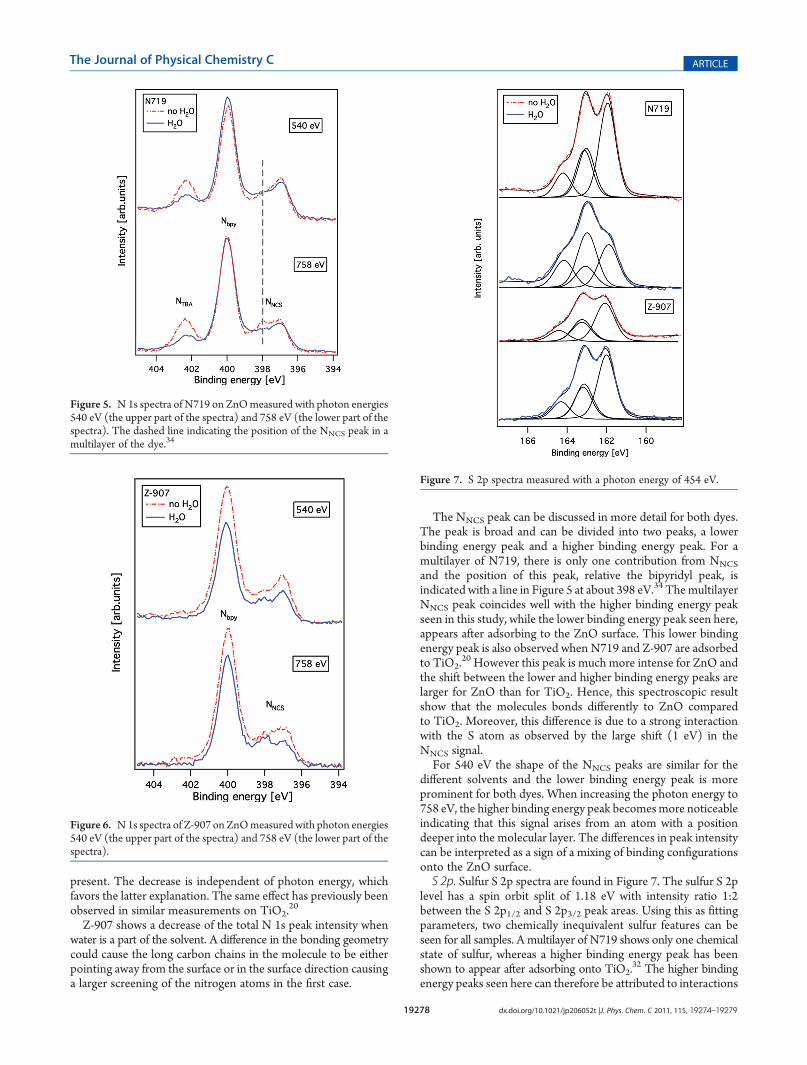
assumed to bind to the semiconductor surface through thecarboxyl groups, there can still be differences in the interactionwith the surface and neighboring molecules. The followingsection deals with water-induced changes of the adsorbed dyemolecules. The following surface characterization was done onsamples sensitized for 10 min. Based on the small differences incoverage observed at this time; these measurements representthe surface structure for the dye layer closest to the ZnO surfacethe best.N 1s. The nitrogen N 1s spectra for N719 shows mainly three
features which corresponds to the nitrogen atoms in the thio-cyanate ligands (NNCS) at a binding energy of 397�398 eV, thebipyridyl ligand (Nbpy) at a binding energy of 400 eV, and theTBA+ counterions (NTBA) at a binding energy of 402.5 eV,
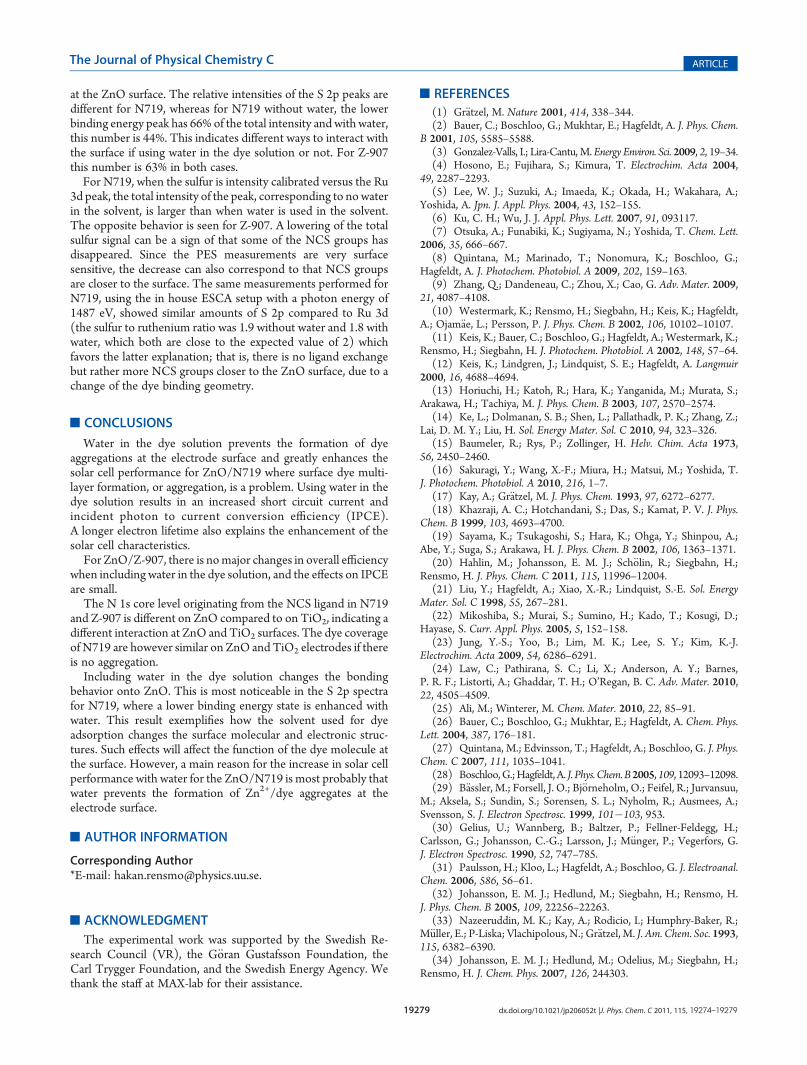
32 seeFigure 5. The Z-907 dye contains no TBA+ counterion andconsequently, no such peak can be seen in Figure 6.Comparing the N 1s spectra with and without water, some
differences are observed. For N719, the NTBA decreases whenwater is included in the solvent. This can either be a sign of thatthe TBA counterions are located closer to the ZnO surface, i.e.,deeper into the molecular surface layer, or that less TBA ions are
Figure 4. Overview spectra of ZnO/N719 electrodes with/without water in the dye solution sensitized during 10min (a) and 15 h (b) respectively. Thephoton energy used was 758 eV.
Table 2. Ratios between Ru 3d5/2 and Zn 3p intensities(Ru/Zn) with and without water in the dye solution andsensitized for 15 h and 10 min, respectivelya
dye and solvent 15 h 10 min
N719, H2O 0.19 0.10
N719, no H2O 1.72 0.13
Z-907, H2O 0.15 0.11
Z-907, no H2O 0.13 0.08aA photon energy of 758 eV was used.
19278 dx.doi.org/10.1021/jp206052t |J. Phys. Chem. C 2011, 115, 19274–19279
The Journal of Physical Chemistry C ARTICLE
present. The decrease is independent of photon energy, whichfavors the latter explanation. The same effect has previously beenobserved in similar measurements on TiO2.
20
Z-907 shows a decrease of the total N 1s peak intensity whenwater is a part of the solvent. A difference in the bonding geometrycould cause the long carbon chains in the molecule to be eitherpointing away from the surface or in the surface direction causinga larger screening of the nitrogen atoms in the first case.
The NNCS peak can be discussed in more detail for both dyes.The peak is broad and can be divided into two peaks, a lowerbinding energy peak and a higher binding energy peak. For amultilayer of N719, there is only one contribution from NNCS
and the position of this peak, relative the bipyridyl peak, isindicated with a line in Figure 5 at about 398 eV.34 ThemultilayerNNCS peak coincides well with the higher binding energy peakseen in this study, while the lower binding energy peak seen here,appears after adsorbing to the ZnO surface. This lower bindingenergy peak is also observed when N719 and Z-907 are adsorbedto TiO2.
20 However this peak is much more intense for ZnO andthe shift between the lower and higher binding energy peaks arelarger for ZnO than for TiO2. Hence, this spectroscopic resultshow that the molecules bonds differently to ZnO comparedto TiO2. Moreover, this difference is due to a strong interactionwith the S atom as observed by the large shift (1 eV) in theNNCS signal.For 540 eV the shape of the NNCS peaks are similar for the
different solvents and the lower binding energy peak is moreprominent for both dyes. When increasing the photon energy to758 eV, the higher binding energy peak becomesmore noticeableindicating that this signal arises from an atom with a positiondeeper into the molecular layer. The differences in peak intensitycan be interpreted as a sign of a mixing of binding configurationsonto the ZnO surface.S 2p. Sulfur S 2p spectra are found in Figure 7. The sulfur S 2p
level has a spin orbit split of 1.18 eV with intensity ratio 1:2between the S 2p1/2 and S 2p3/2 peak areas. Using this as fittingparameters, two chemically inequivalent sulfur features can beseen for all samples. A multilayer of N719 shows only one chemicalstate of sulfur, whereas a higher binding energy peak has beenshown to appear after adsorbing onto TiO2.
32 The higher bindingenergy peaks seen here can therefore be attributed to interactions
Figure 7. S 2p spectra measured with a photon energy of 454 eV.
Figure 5. N1s spectra of N719 on ZnOmeasured with photon energies540 eV (the upper part of the spectra) and 758 eV (the lower part of thespectra). The dashed line indicating the position of the NNCS peak in amultilayer of the dye.34
Figure 6. N1s spectra of Z-907 on ZnOmeasured with photon energies540 eV (the upper part of the spectra) and 758 eV (the lower part of thespectra).
19279 dx.doi.org/10.1021/jp206052t |J. Phys. Chem. C 2011, 115, 19274–19279
The Journal of Physical Chemistry C ARTICLE
at the ZnO surface. The relative intensities of the S 2p peaks aredifferent for N719, whereas for N719 without water, the lowerbinding energy peak has 66% of the total intensity andwith water,this number is 44%. This indicates different ways to interact withthe surface if using water in the dye solution or not. For Z-907this number is 63% in both cases.For N719, when the sulfur is intensity calibrated versus the Ru
3d peak, the total intensity of the peak, corresponding to nowaterin the solvent, is larger than when water is used in the solvent.The opposite behavior is seen for Z-907. A lowering of the totalsulfur signal can be a sign of that some of the NCS groups hasdisappeared. Since the PES measurements are very surfacesensitive, the decrease can also correspond to that NCS groupsare closer to the surface. The same measurements performed forN719, using the in house ESCA setup with a photon energy of1487 eV, showed similar amounts of S 2p compared to Ru 3d(the sulfur to ruthenium ratio was 1.9 without water and 1.8 withwater, which both are close to the expected value of 2) whichfavors the latter explanation; that is, there is no ligand exchangebut rather more NCS groups closer to the ZnO surface, due to achange of the dye binding geometry.
’CONCLUSIONS
Water in the dye solution prevents the formation of dyeaggregations at the electrode surface and greatly enhances thesolar cell performance for ZnO/N719 where surface dye multi-layer formation, or aggregation, is a problem. Using water in thedye solution results in an increased short circuit current andincident photon to current conversion efficiency (IPCE).A longer electron lifetime also explains the enhancement of thesolar cell characteristics.
For ZnO/Z-907, there is nomajor changes in overall efficiencywhen including water in the dye solution, and the effects on IPCEare small.
The N 1s core level originating from the NCS ligand in N719and Z-907 is different on ZnO compared to on TiO2, indicating adifferent interaction at ZnO and TiO2 surfaces. The dye coverageof N719 are however similar on ZnO and TiO2 electrodes if thereis no aggregation.
Including water in the dye solution changes the bondingbehavior onto ZnO. This is most noticeable in the S 2p spectrafor N719, where a lower binding energy state is enhanced withwater. This result exemplifies how the solvent used for dyeadsorption changes the surface molecular and electronic struc-tures. Such effects will affect the function of the dye molecule atthe surface. However, a main reason for the increase in solar cellperformance with water for the ZnO/N719 is most probably thatwater prevents the formation of Zn2+/dye aggregates at theelectrode surface.
’AUTHOR INFORMATION
Corresponding Author*E-mail: [email protected].
’ACKNOWLEDGMENT
The experimental work was supported by the Swedish Re-search Council (VR), the G€oran Gustafsson Foundation, theCarl Trygger Foundation, and the Swedish Energy Agency. Wethank the staff at MAX-lab for their assistance.
’REFERENCES
(1) Gr€atzel, M. Nature 2001, 414, 338–344.(2) Bauer, C.; Boschloo, G.; Mukhtar, E.; Hagfeldt, A. J. Phys. Chem.
B 2001, 105, 5585–5588.(3) Gonzalez-Valls, I.; Lira-Cantu,M.Energy Environ. Sci. 2009, 2, 19–34.(4) Hosono, E.; Fujihara, S.; Kimura, T. Electrochim. Acta 2004,
49, 2287–2293.(5) Lee, W. J.; Suzuki, A.; Imaeda, K.; Okada, H.; Wakahara, A.;
Yoshida, A. Jpn. J. Appl. Phys. 2004, 43, 152–155.(6) Ku, C. H.; Wu, J. J. Appl. Phys. Lett. 2007, 91, 093117.(7) Otsuka, A.; Funabiki, K.; Sugiyama, N.; Yoshida, T. Chem. Lett.
2006, 35, 666–667.(8) Quintana, M.; Marinado, T.; Nonomura, K.; Boschloo, G.;
Hagfeldt, A. J. Photochem. Photobiol. A 2009, 202, 159–163.(9) Zhang, Q.; Dandeneau, C.; Zhou, X.; Cao, G. Adv. Mater. 2009,
21, 4087–4108.(10) Westermark, K.; Rensmo, H.; Siegbahn, H.; Keis, K.; Hagfeldt,
A.; Ojam€ae, L.; Persson, P. J. Phys. Chem. B 2002, 106, 10102–10107.(11) Keis, K.; Bauer, C.; Boschloo, G.; Hagfeldt, A.; Westermark, K.;
Rensmo, H.; Siegbahn, H. J. Photochem. Photobiol. A 2002, 148, 57–64.(12) Keis, K.; Lindgren, J.; Lindquist, S. E.; Hagfeldt, A. Langmuir
2000, 16, 4688–4694.(13) Horiuchi, H.; Katoh, R.; Hara, K.; Yanganida, M.; Murata, S.;
Arakawa, H.; Tachiya, M. J. Phys. Chem. B 2003, 107, 2570–2574.(14) Ke, L.; Dolmanan, S. B.; Shen, L.; Pallathadk, P. K.; Zhang, Z.;
Lai, D. M. Y.; Liu, H. Sol. Energy Mater. Sol. C 2010, 94, 323–326.(15) Baumeler, R.; Rys, P.; Zollinger, H. Helv. Chim. Acta 1973,
56, 2450–2460.(16) Sakuragi, Y.; Wang, X.-F.; Miura, H.; Matsui, M.; Yoshida, T.
J. Photochem. Photobiol. A 2010, 216, 1–7.(17) Kay, A.; Gr€atzel, M. J. Phys. Chem. 1993, 97, 6272–6277.(18) Khazraji, A. C.; Hotchandani, S.; Das, S.; Kamat, P. V. J. Phys.
Chem. B 1999, 103, 4693–4700.(19) Sayama, K.; Tsukagoshi, S.; Hara, K.; Ohga, Y.; Shinpou, A.;
Abe, Y.; Suga, S.; Arakawa, H. J. Phys. Chem. B 2002, 106, 1363–1371.(20) Hahlin, M.; Johansson, E. M. J.; Sch€olin, R.; Siegbahn, H.;
Rensmo, H. J. Phys. Chem. C 2011, 115, 11996–12004.(21) Liu, Y.; Hagfeldt, A.; Xiao, X.-R.; Lindquist, S.-E. Sol. Energy
Mater. Sol. C 1998, 55, 267–281.(22) Mikoshiba, S.; Murai, S.; Sumino, H.; Kado, T.; Kosugi, D.;
Hayase, S. Curr. Appl. Phys. 2005, 5, 152–158.(23) Jung, Y.-S.; Yoo, B.; Lim, M. K.; Lee, S. Y.; Kim, K.-J.
Electrochim. Acta 2009, 54, 6286–6291.(24) Law, C.; Pathirana, S. C.; Li, X.; Anderson, A. Y.; Barnes,
P. R. F.; Listorti, A.; Ghaddar, T. H.; O’Regan, B. C. Adv. Mater. 2010,22, 4505–4509.
(25) Ali, M.; Winterer, M. Chem. Mater. 2010, 22, 85–91.(26) Bauer, C.; Boschloo, G.; Mukhtar, E.; Hagfeldt, A. Chem. Phys.
Lett. 2004, 387, 176–181.(27) Quintana, M.; Edvinsson, T.; Hagfeldt, A.; Boschloo, G. J. Phys.
Chem. C 2007, 111, 1035–1041.(28) Boschloo,G.;Hagfeldt, A. J. Phys. Chem.B2005,109, 12093–12098.(29) B€assler, M.; Forsell, J. O.; Bj€orneholm, O.; Feifel, R.; Jurvansuu,
M.; Aksela, S.; Sundin, S.; Sorensen, S. L.; Nyholm, R.; Ausmees, A.;Svensson, S. J. Electron Spectrosc. 1999, 101�103, 953.
(30) Gelius, U.; Wannberg, B.; Baltzer, P.; Fellner-Feldegg, H.;Carlsson, G.; Johansson, C.-G.; Larsson, J.; M€unger, P.; Vegerfors, G.J. Electron Spectrosc. 1990, 52, 747–785.
(31) Paulsson, H.; Kloo, L.; Hagfeldt, A.; Boschloo, G. J. Electroanal.Chem. 2006, 586, 56–61.
(32) Johansson, E. M. J.; Hedlund, M.; Siegbahn, H.; Rensmo, H.J. Phys. Chem. B 2005, 109, 22256–22263.
(33) Nazeeruddin, M. K.; Kay, A.; Rodicio, I.; Humphry-Baker, R.;M€uller, E.; P-Liska; Vlachipolous, N.; Gr€atzel, M. J. Am. Chem. Soc. 1993,115, 6382–6390.
(34) Johansson, E. M. J.; Hedlund, M.; Odelius, M.; Siegbahn, H.;Rensmo, H. J. Chem. Phys. 2007, 126, 244303.


![A natural dye, Niram improves atopic dermatitis through down … · 2014. 12. 15. · (SE)-11-009]. Mice were sacrificed with CO2 inhalation. 2.9. Sensitization with DNFB For active](https://img.pdfslide.net/doc/110x75/6145252734130627ed50cc61/a-natural-dye-niram-improves-atopic-dermatitis-through-down-2014-12-15-se-11-009.jpg)