Embed Size (px)
Citation preview
Nicholas ReuterCenter for Substance Abuse Treatment
Substance Abuse Mental Health Services AdministrationU.S. Department of Health & Human Services
Preventing Prescription Drug Abuse
Harold Rogers Prescription Drug
Monitoring Program –National Meeting – June 9, 2011
2
Overview
Substance Abuse Trends in the U.S.
• Illicit Drugs
• Prescription Drugs– Abuse
– Diversion
– Consequences, Mortality
Initiatives to Address Rx Drug Abuse
• Prescription Drug Monitoring Programs
• Prescriber/Consumer Education/Training
• SBIRT, PCSS
• Integrating PDMP and EHR
3
2009 NSDUH Highlights
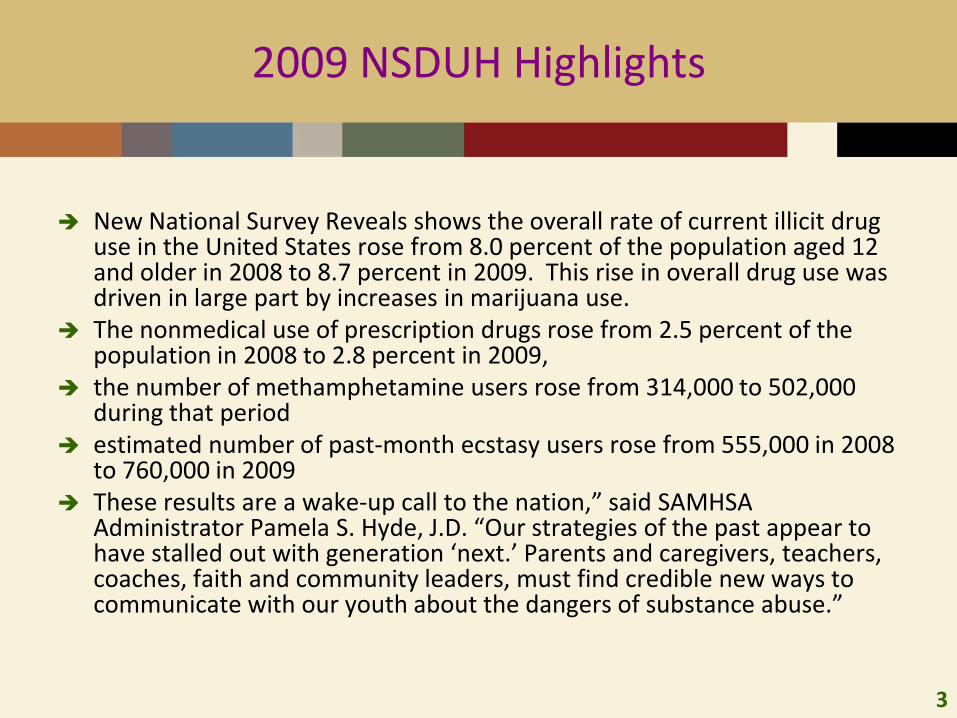
New National Survey Reveals shows the overall rate of current illicit drug use in the United States rose from 8.0 percent of the population aged 12 and older in 2008 to 8.7 percent in 2009. This rise in overall drug use was driven in large part by increases in marijuana use.
The nonmedical use of prescription drugs rose from 2.5 percent of the population in 2008 to 2.8 percent in 2009,
the number of methamphetamine users rose from 314,000 to 502,000 during that period
estimated number of past-month ecstasy users rose from 555,000 in 2008 to 760,000 in 2009
These results are a wake-up call to the nation,” said SAMHSA Administrator Pamela S. Hyde, J.D. “Our strategies of the past appear to have stalled out with generation ‘next.’ Parents and caregivers, teachers, coaches, faith and community leaders, must find credible new ways to communicate with our youth about the dangers of substance abuse.”
4
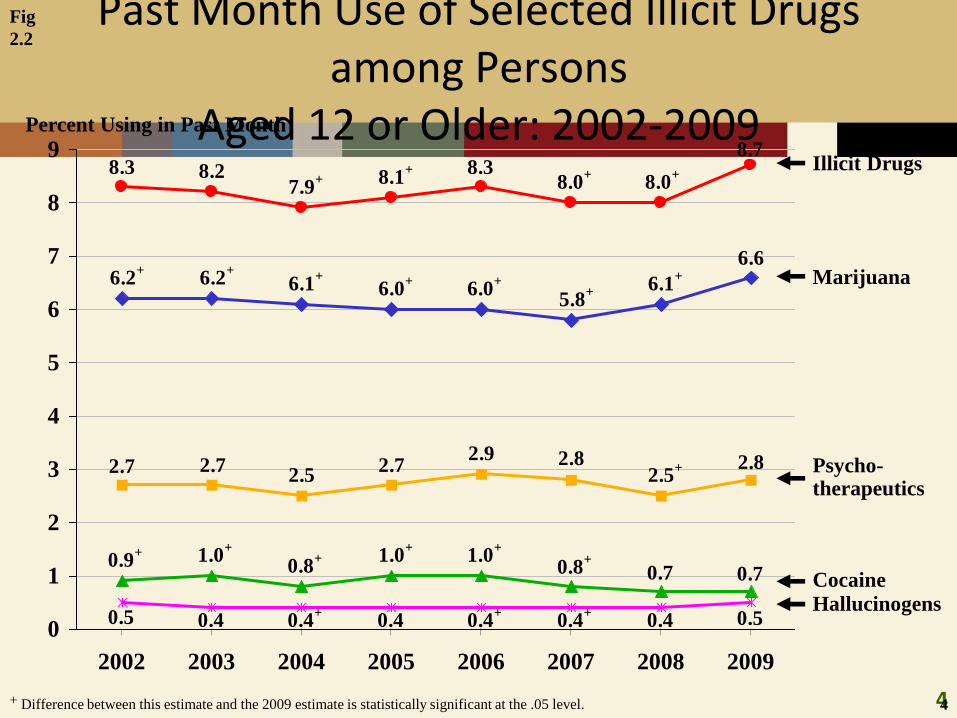
Past Month Use of Selected Illicit Drugs among Persons
Aged 12 or Older: 2002-2009
Fig
2.2
8.7
8.0+
8.0+8.3
8.1+
7.9+8.28.3
6.6
6.1+
5.8+6.0
+6.0
+6.1+6.2
+6.2
+
2.82.5
+2.82.9
2.72.5
2.72.7
0.70.70.8+1.0
+1.0
+
0.8+1.0
+0.9
+
0.50.40.4+
0.4+
0.40.4+
0.40.50
1
2
3
4
5
6
7
8
9
2002 2003 2004 2005 2006 2007 2008 2009
Illicit Drugs
Marijuana
Cocaine
Hallucinogens
Psycho-therapeutics
Percent Using in Past Month
4+ Difference between this estimate and the 2009 estimate is statistically significant at the .05 level.
5
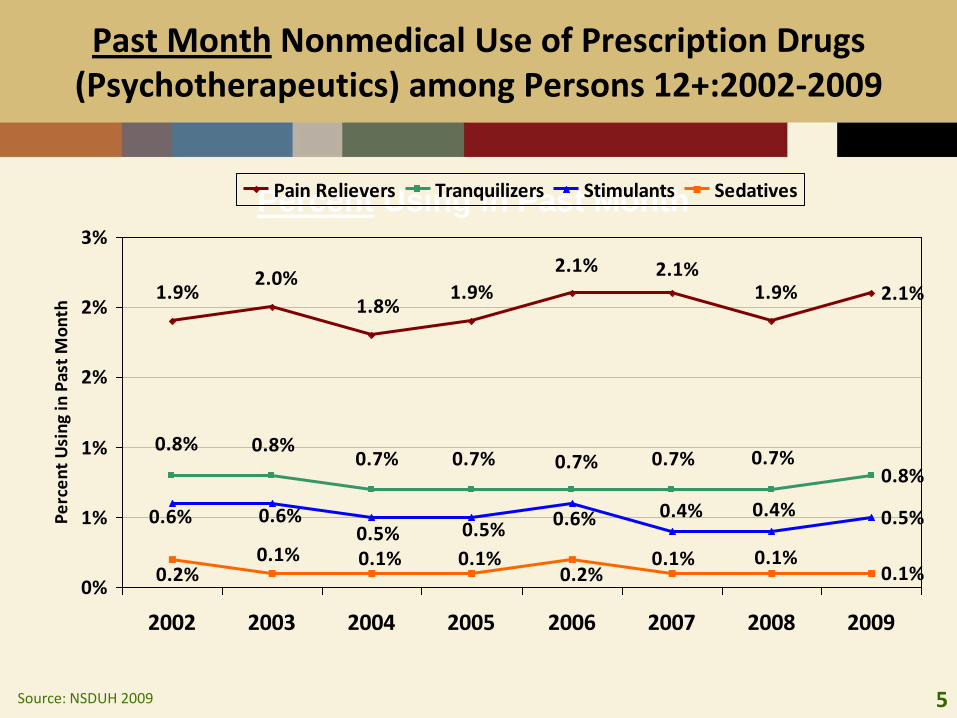
Past Month Nonmedical Use of Prescription Drugs (Psychotherapeutics) among Persons 12+:2002-2009
Percent Using in Past Month
Source: NSDUH 2009
2.1%
0.8%
0.5%
0.1%
1.9%2.1%2.1%
1.9%1.8%
2.0%1.9%
0.7%0.7%0.7%0.7%0.7%0.8%0.8%
0.4%0.4%0.6%0.5%0.5%
0.6%0.6%
0.1%0.1%0.2%
0.1%0.1%0.1%0.2%
0%
1%
1%
2%
2%
3%
2002 2003 2004 2005 2006 2007 2008 2009
Pe
rce
nt
Usi
ng
in P
ast
Mo
nth
Pain Relievers Tranquilizers Stimulants Sedatives
6
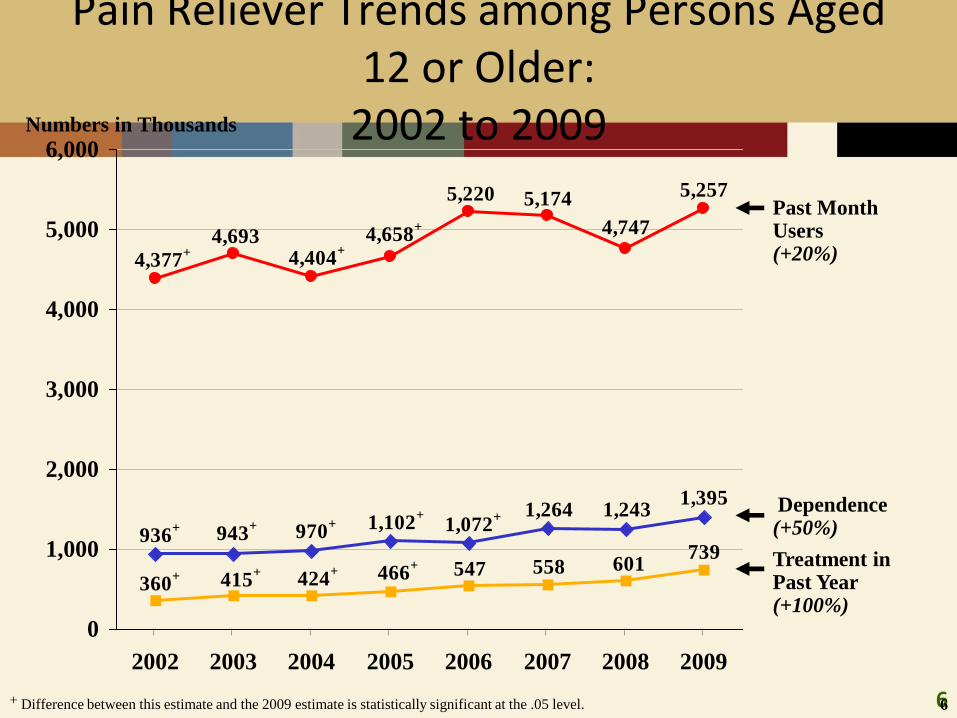
Pain Reliever Trends among Persons Aged 12 or Older:
2002 to 20095,257
4,747
5,1745,220
4,693 4,658+
4,404+
4,377+
1,264 1,2431,395
1,072+1,102
+
970+
943+
936+
547 558 601739
466+
424+
415+
360+
0
1,000
2,000
3,000
4,000
5,000
6,000
2002 2003 2004 2005 2006 2007 2008 2009
Past Month Users (+20%)
Dependence (+50%)
Treatment in Past Year (+100%)
Numbers in Thousands
6+ Difference between this estimate and the 2009 estimate is statistically significant at the .05 level.
7
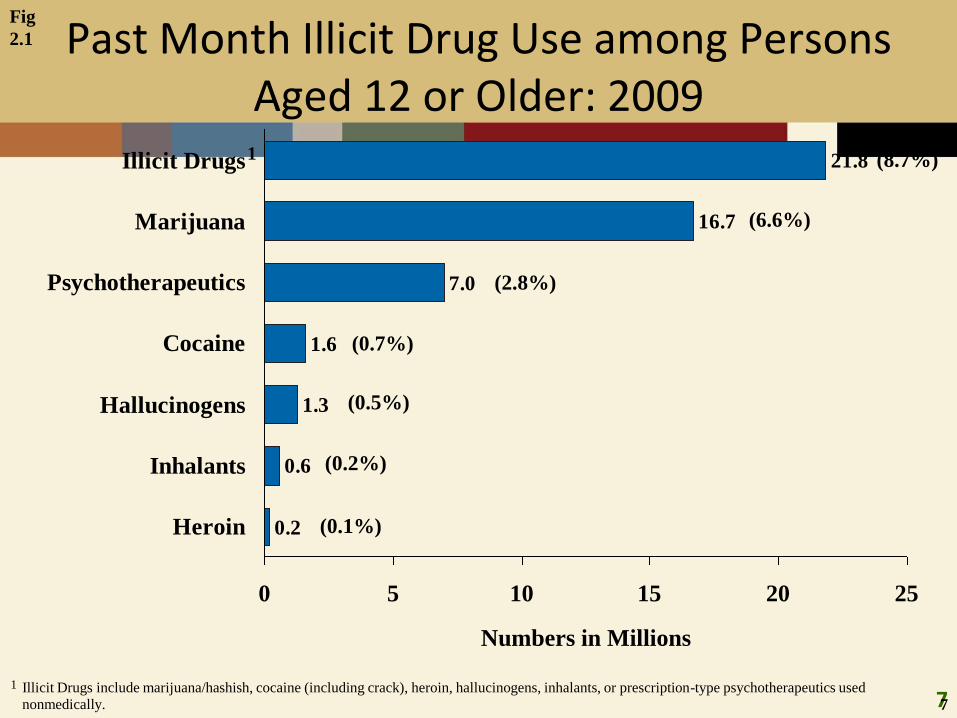
Past Month Illicit Drug Use among Persons Aged 12 or Older: 2009
Fig
2.1
Numbers in Millions
0.2
0.6
1.3
1.6
7.0
16.7
21.8
0 5 10 15 20 25
Heroin
Inhalants
Hallucinogens
Cocaine
Psychotherapeutics
Marijuana
Illicit Drugs1
7
1 Illicit Drugs include marijuana/hashish, cocaine (including crack), heroin, hallucinogens, inhalants, or prescription-type psychotherapeutics used
nonmedically.
(8.7%)
(6.6%)
(2.8%)
(0.7%)
(0.5%)
(0.2%)
(0.1%)
8
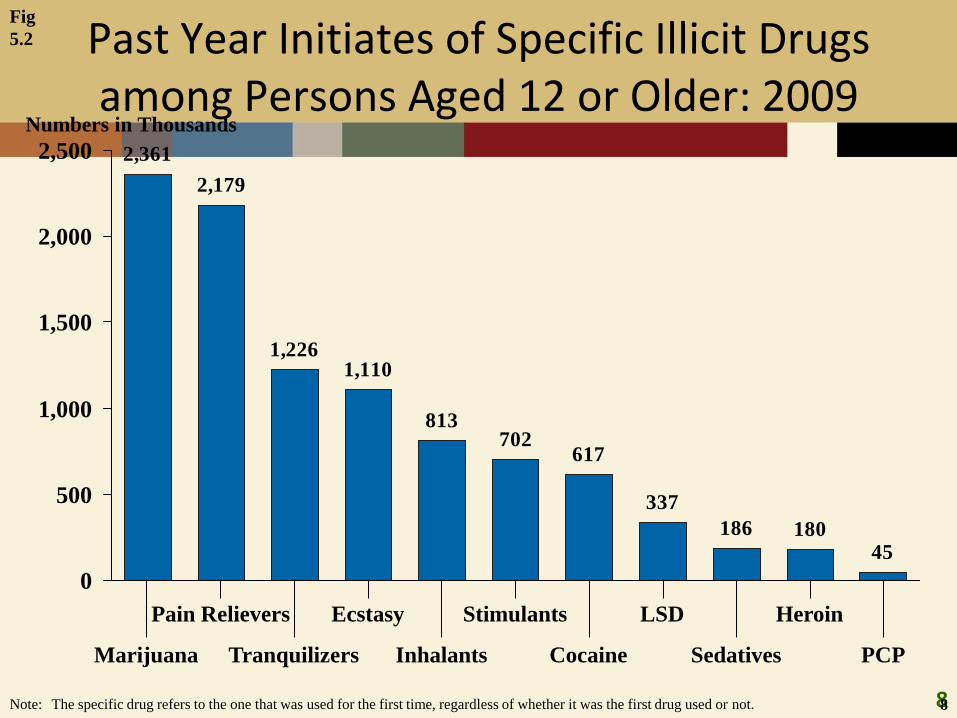
Past Year Initiates of Specific Illicit Drugs among Persons Aged 12 or Older: 2009
2,361
2,179
1,2261,110
813702
617
337
186 18045
0
500
1,000
1,500
2,000
2,500
Fig
5.2
8
Numbers in Thousands
Marijuana
Pain Relievers
Tranquilizers
Ecstasy
Inhalants
Stimulants
Cocaine
LSD
Sedatives
Heroin
PCP
Note: The specific drug refers to the one that was used for the first time, regardless of whether it was the first drug used or not.
9
Redesigning NSDUH
NSDUH redesign is now expected to occur in 2015.
The nonmedical use definition will be essentially the same, but different questions are being tested.
The major shift is a focus on past year use of the specific drugs, instead of the current/lifetime approach,
and a process to regularly update the drugs included.
10
DAWN ED 2009
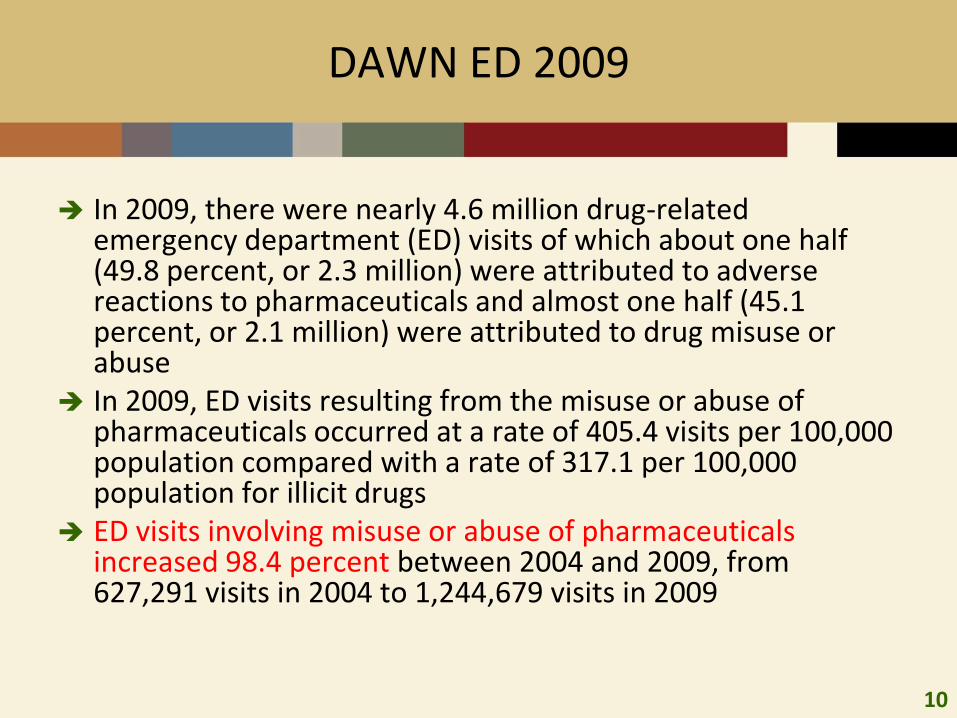
In 2009, there were nearly 4.6 million drug-related emergency department (ED) visits of which about one half (49.8 percent, or 2.3 million) were attributed to adverse reactions to pharmaceuticals and almost one half (45.1 percent, or 2.1 million) were attributed to drug misuse or abuse
In 2009, ED visits resulting from the misuse or abuse of pharmaceuticals occurred at a rate of 405.4 visits per 100,000 population compared with a rate of 317.1 per 100,000 population for illicit drugs
ED visits involving misuse or abuse of pharmaceuticals increased 98.4 percent between 2004 and 2009, from 627,291 visits in 2004 to 1,244,679 visits in 2009
11
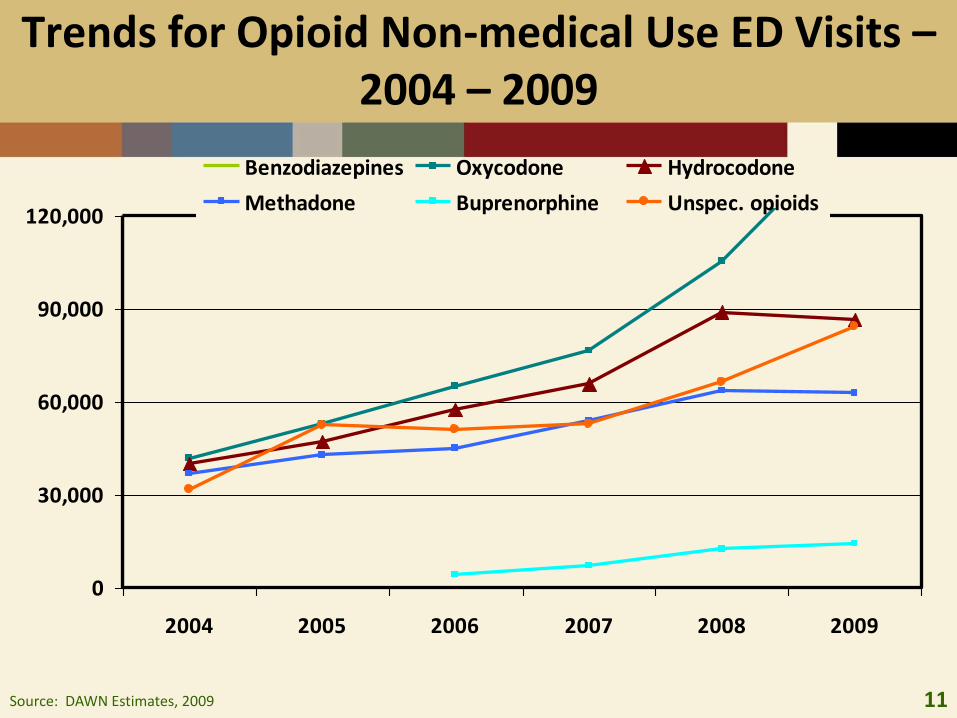
Trends for Opioid Non-medical Use ED Visits –2004 – 2009
0
30,000
60,000
90,000
120,000
2004 2005 2006 2007 2008 2009
Benzodiazepines Oxycodone Hydrocodone
Methadone Buprenorphine Unspec. opioids
Source: DAWN Estimates, 2009
12
TEDS Rx Pain Reliever Admissions1998-2008
Substance abuse treatment admissions reporting primary pain reliever abuse increased from 18,300 in 1998 (1.1 percent of all admissions) to approximately 105,680 (5.6 percent) in 2008
Admissions for primary abuse of prescription pain relievers in 2008 were more than 3 times as likely as those in 1998 to be aged 18 to 24 (26.5 vs. 7.5 percent)
Admissions for primary pain reliever abuse in 2008 were more likely than those in 1998 to be unemployed (41.1 vs. 28.6 percent)
The percentage of primary pain reliever admissions with a co-occurring psychiatric disorder increased from 19.4 percent in 1998 to 38.6 percent in 2008
13
Prescription Drugs and Overdose Deaths
14
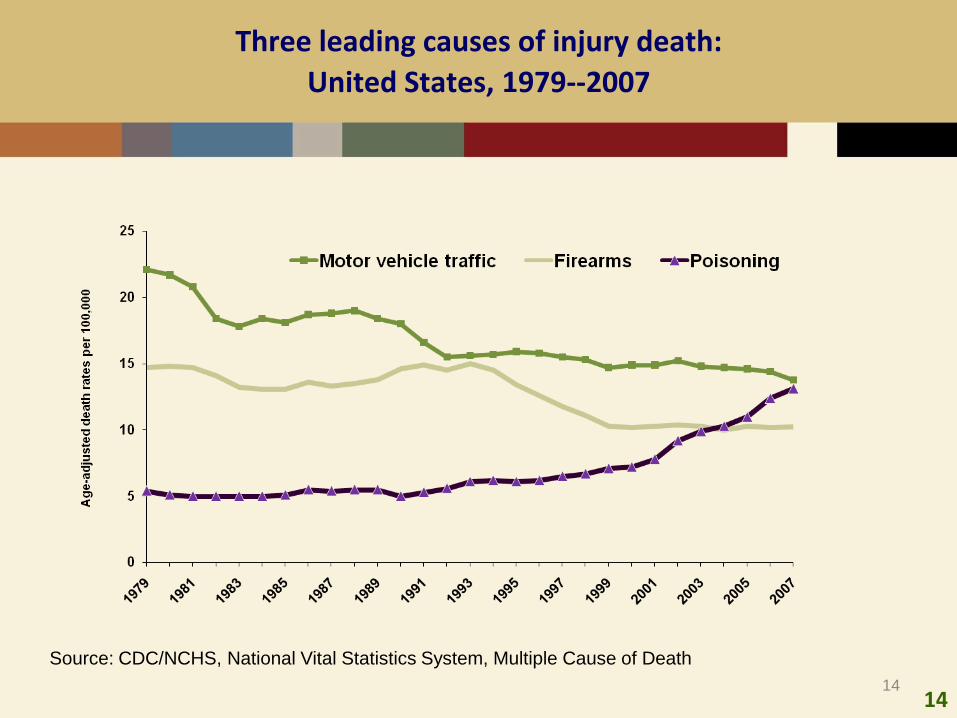
Three leading causes of injury death:
United States, 1979--2007
14
Source: CDC/NCHS, National Vital Statistics System, Multiple Cause of Death
15
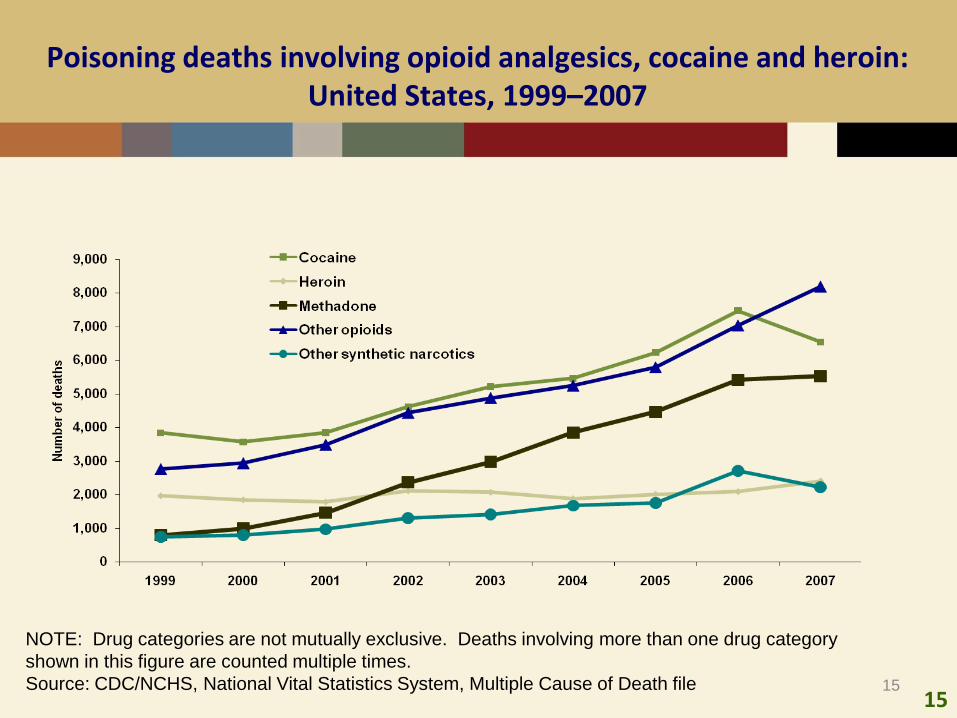
Poisoning deaths involving opioid analgesics, cocaine and heroin: United States, 1999–2007
15
NOTE: Drug categories are not mutually exclusive. Deaths involving more than one drug category
shown in this figure are counted multiple times.
Source: CDC/NCHS, National Vital Statistics System, Multiple Cause of Death file
16
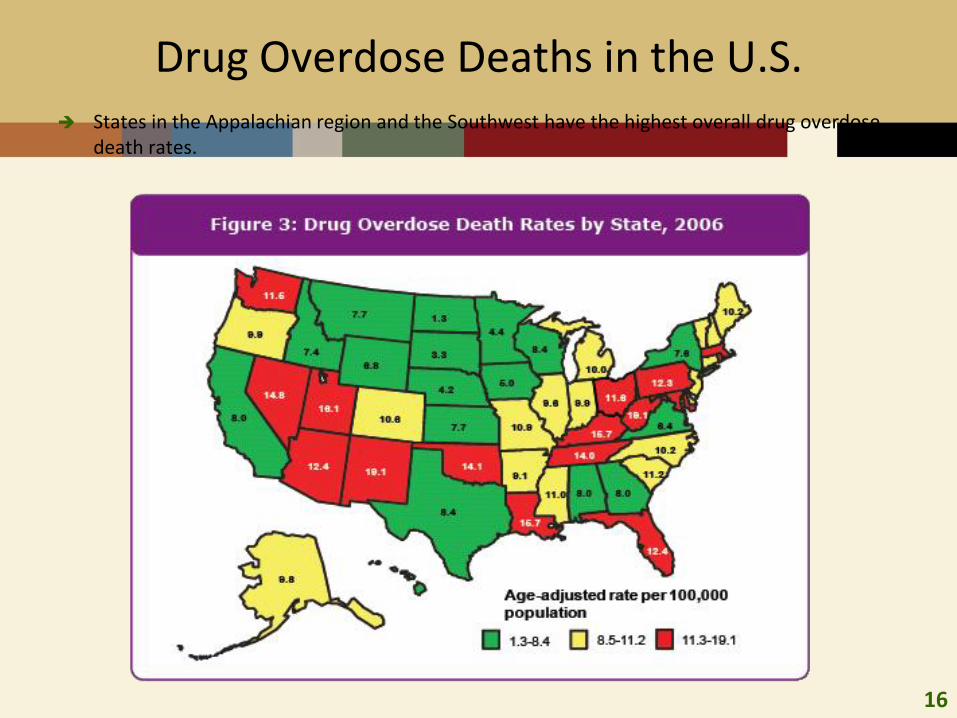
Drug Overdose Deaths in the U.S. States in the Appalachian region and the Southwest have the highest overall drug overdose
death rates.
17
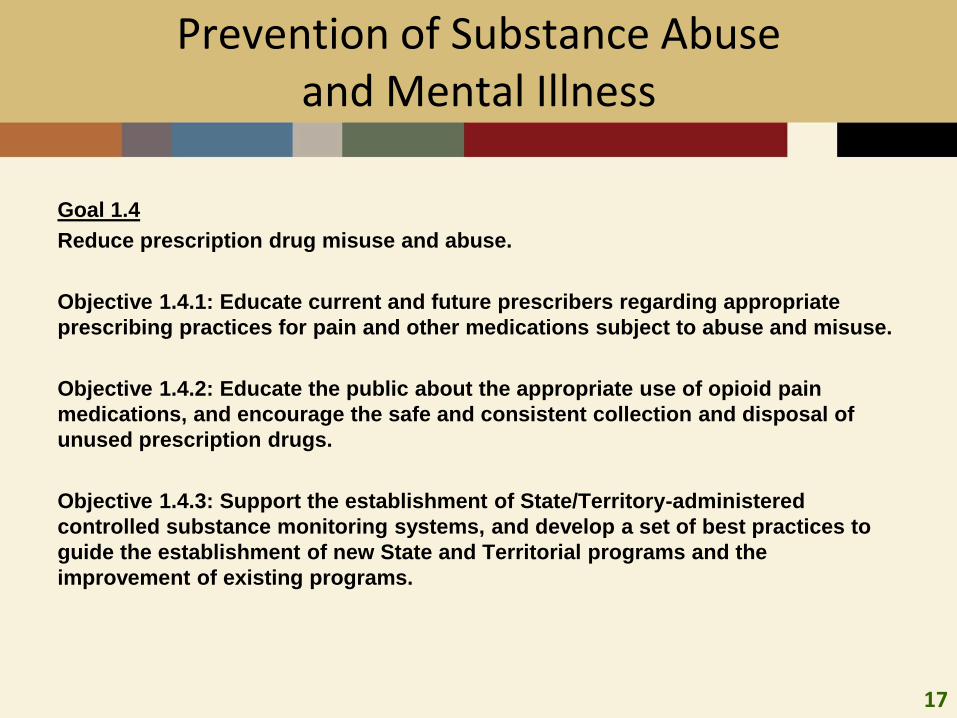
Prevention of Substance Abuseand Mental Illness
Goal 1.4
Reduce prescription drug misuse and abuse.
Objective 1.4.1: Educate current and future prescribers regarding appropriate
prescribing practices for pain and other medications subject to abuse and misuse.
Objective 1.4.2: Educate the public about the appropriate use of opioid pain
medications, and encourage the safe and consistent collection and disposal of
unused prescription drugs.
Objective 1.4.3: Support the establishment of State/Territory-administered
controlled substance monitoring systems, and develop a set of best practices to
guide the establishment of new State and Territorial programs and the
improvement of existing programs.
18
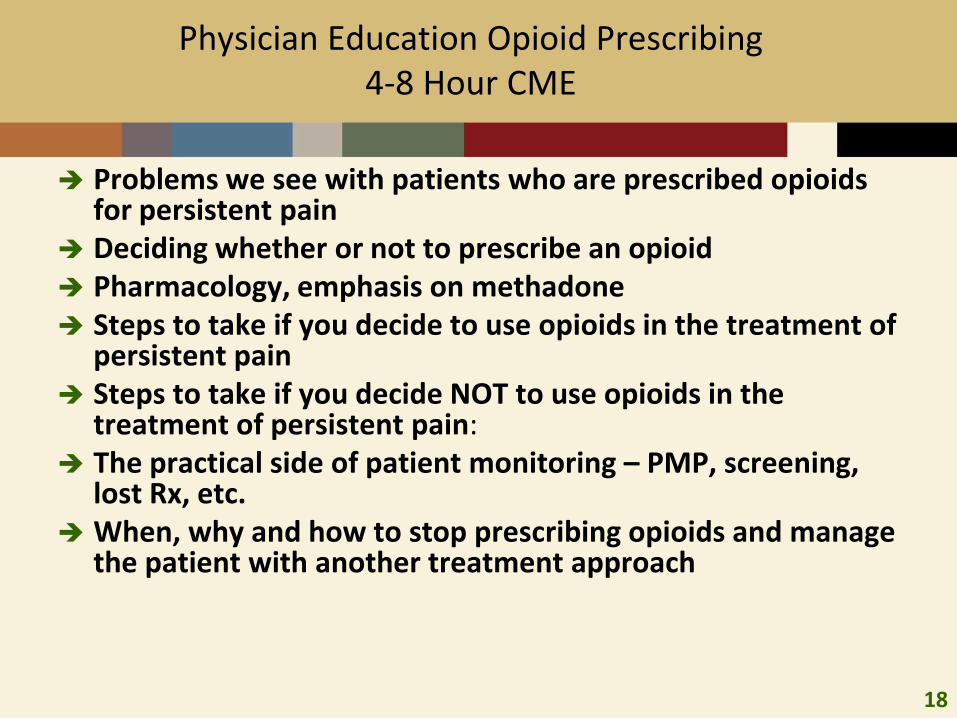
Physician Education Opioid Prescribing4-8 Hour CME
Problems we see with patients who are prescribed opioids for persistent pain
Deciding whether or not to prescribe an opioid Pharmacology, emphasis on methadone Steps to take if you decide to use opioids in the treatment of
persistent pain Steps to take if you decide NOT to use opioids in the
treatment of persistent pain: The practical side of patient monitoring – PMP, screening,
lost Rx, etc. When, why and how to stop prescribing opioids and manage
the patient with another treatment approach
19
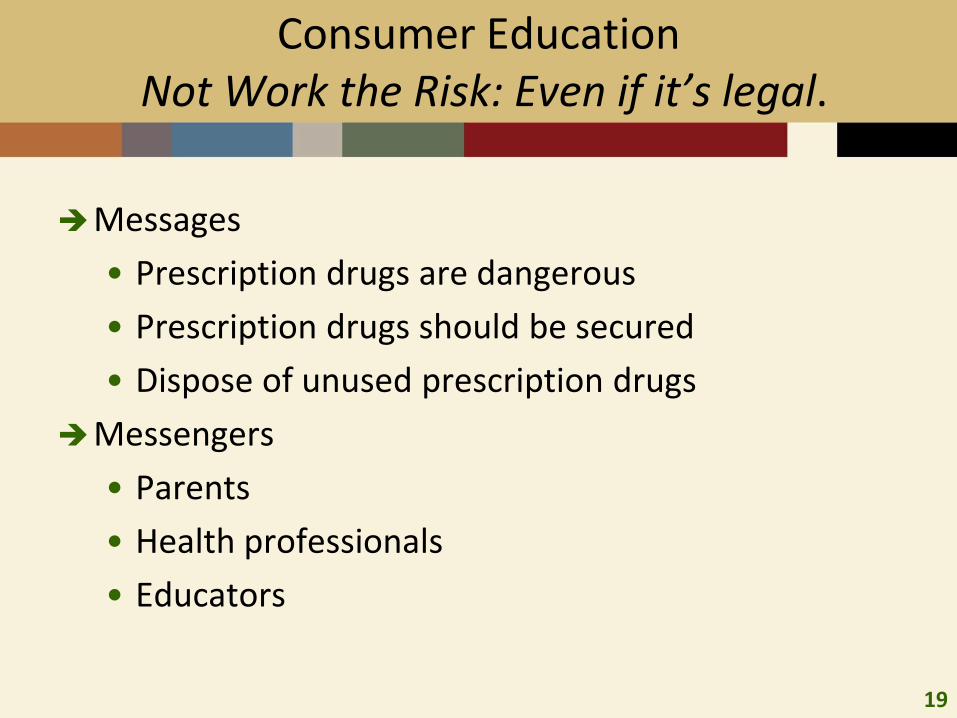
Consumer EducationNot Work the Risk: Even if it’s legal.
Messages
• Prescription drugs are dangerous
• Prescription drugs should be secured
• Dispose of unused prescription drugs
Messengers
• Parents
• Health professionals
• Educators
20
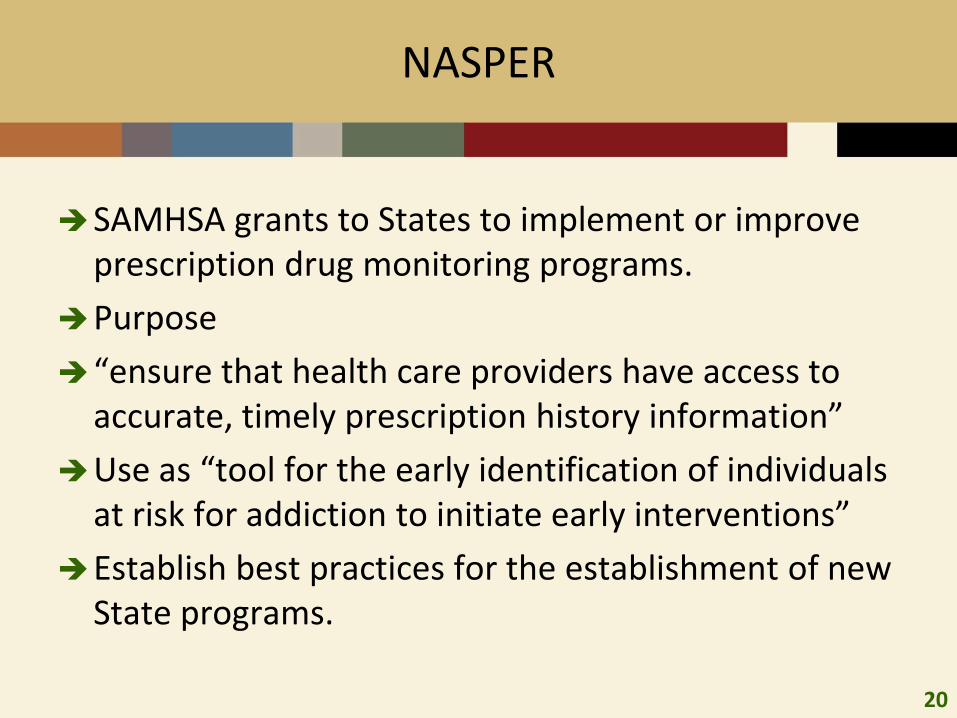
NASPER
SAMHSA grants to States to implement or improve prescription drug monitoring programs.
Purpose
“ensure that health care providers have access to accurate, timely prescription history information”
Use as “tool for the early identification of individuals at risk for addiction to initiate early interventions”
Establish best practices for the establishment of new State programs.
21
NASPER 2011
RFA did not introduce new requirements.
Increased flexibility for authenticating accounts.
22
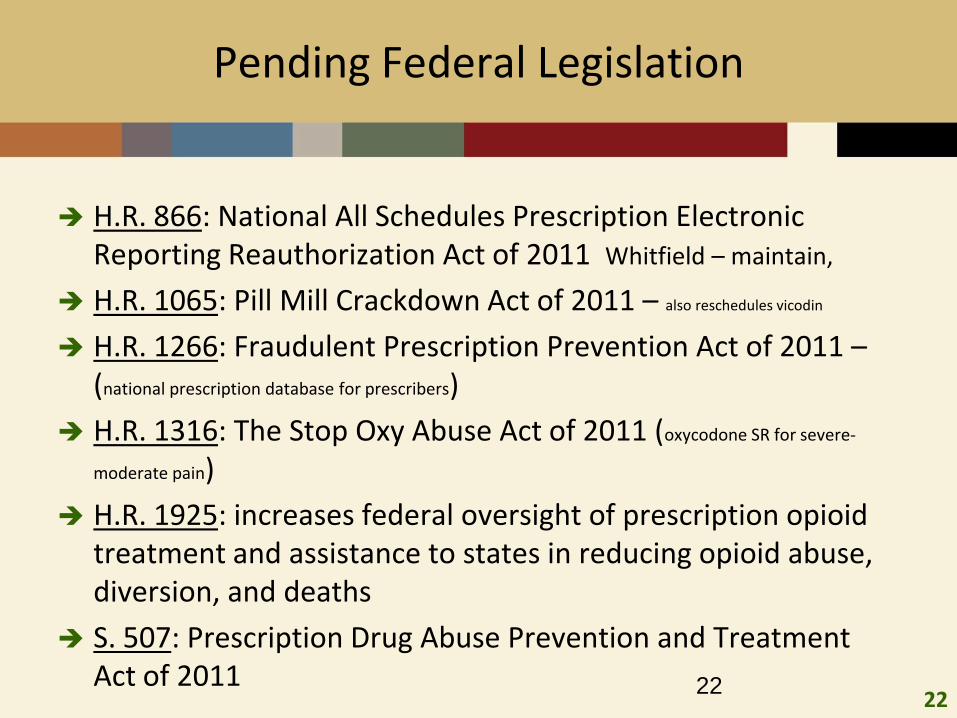
Pending Federal Legislation
H.R. 866: National All Schedules Prescription Electronic Reporting Reauthorization Act of 2011 Whitfield – maintain,
H.R. 1065: Pill Mill Crackdown Act of 2011 – also reschedules vicodin
H.R. 1266: Fraudulent Prescription Prevention Act of 2011 –(national prescription database for prescribers)
H.R. 1316: The Stop Oxy Abuse Act of 2011 (oxycodone SR for severe-
moderate pain)
H.R. 1925: increases federal oversight of prescription opioid treatment and assistance to states in reducing opioid abuse, diversion, and deaths
S. 507: Prescription Drug Abuse Prevention and Treatment Act of 2011 22
23
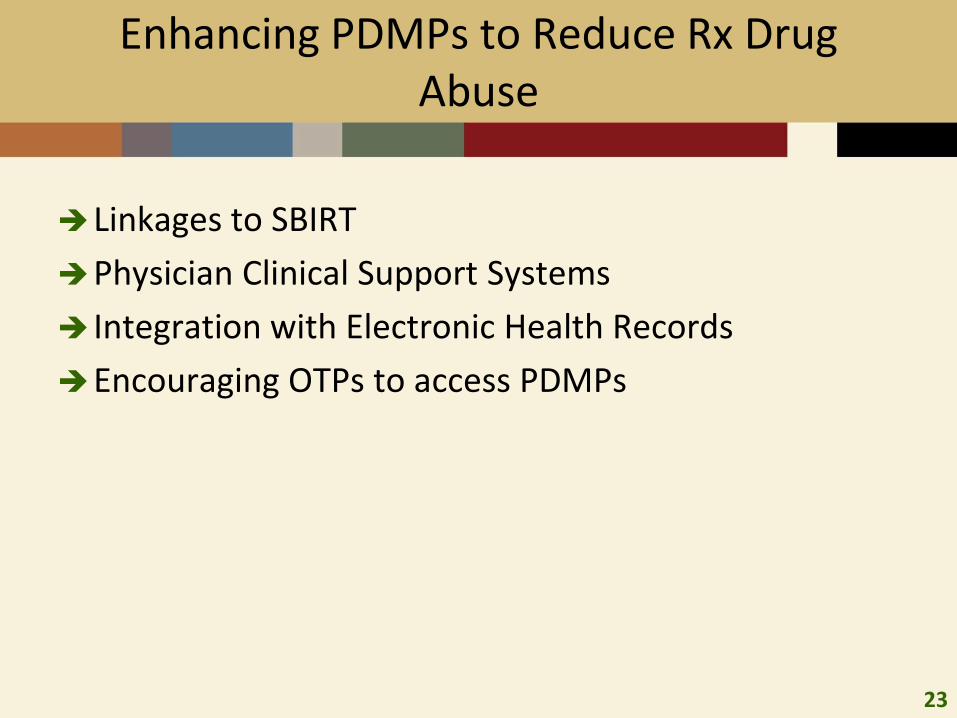
Enhancing PDMPs to Reduce Rx Drug Abuse
Linkages to SBIRT
Physician Clinical Support Systems
Integration with Electronic Health Records
Encouraging OTPs to access PDMPs
24
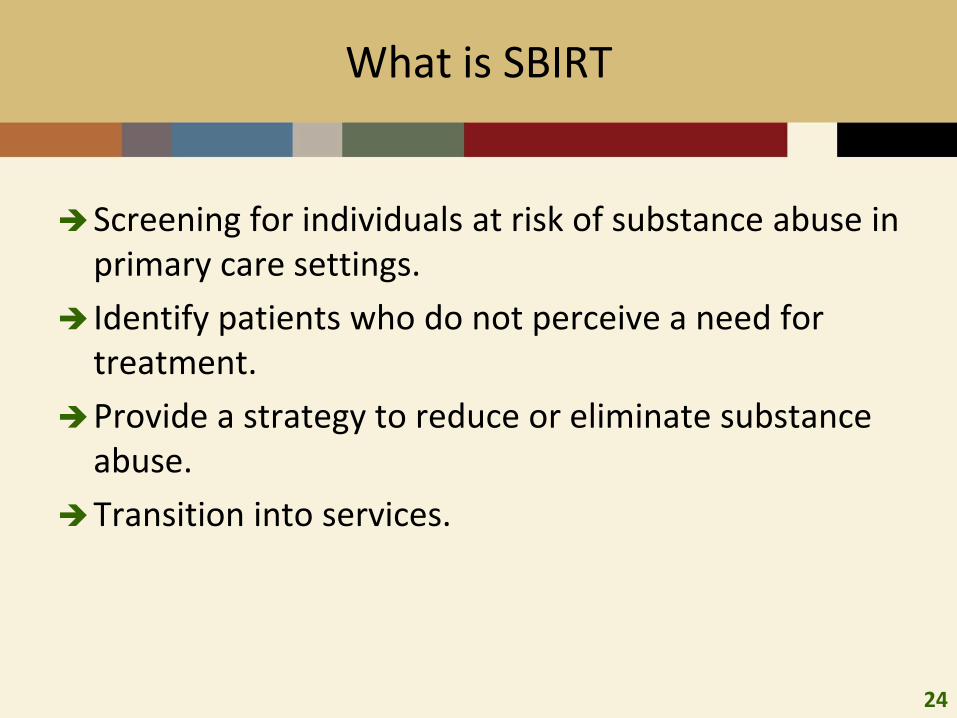
What is SBIRT
Screening for individuals at risk of substance abuse in primary care settings.
Identify patients who do not perceive a need for treatment.
Provide a strategy to reduce or eliminate substance abuse.
Transition into services.
25
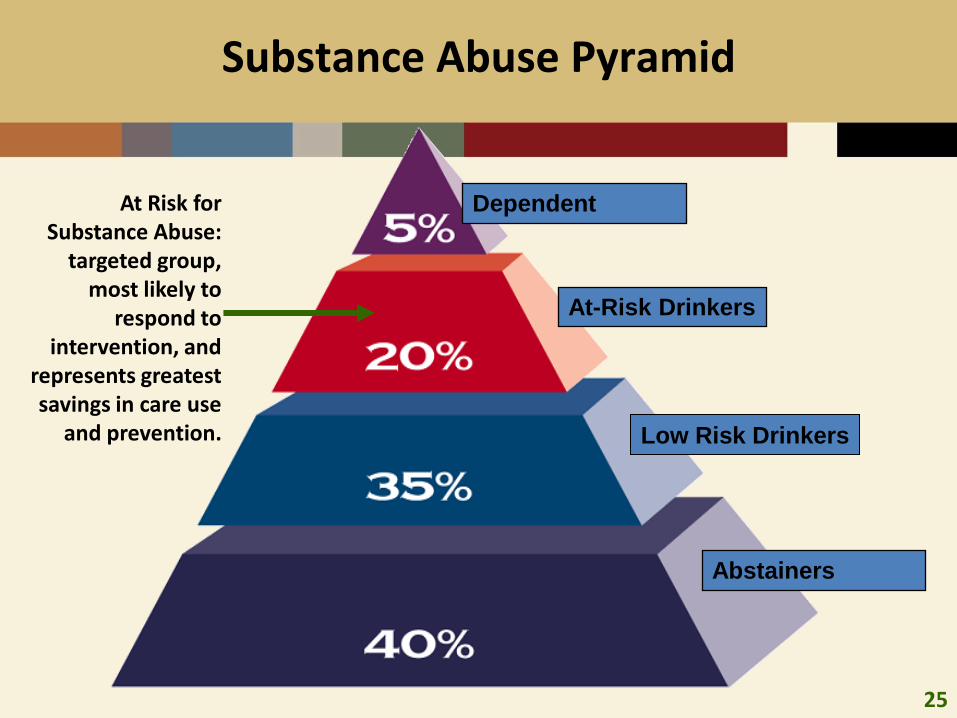
Substance Abuse Pyramid
Dependent
At-Risk Drinkers
Low Risk Drinkers
Abstainers
At Risk for Substance Abuse:
targeted group, most likely to
respond to intervention, and
represents greatest savings in care use
and prevention.
26
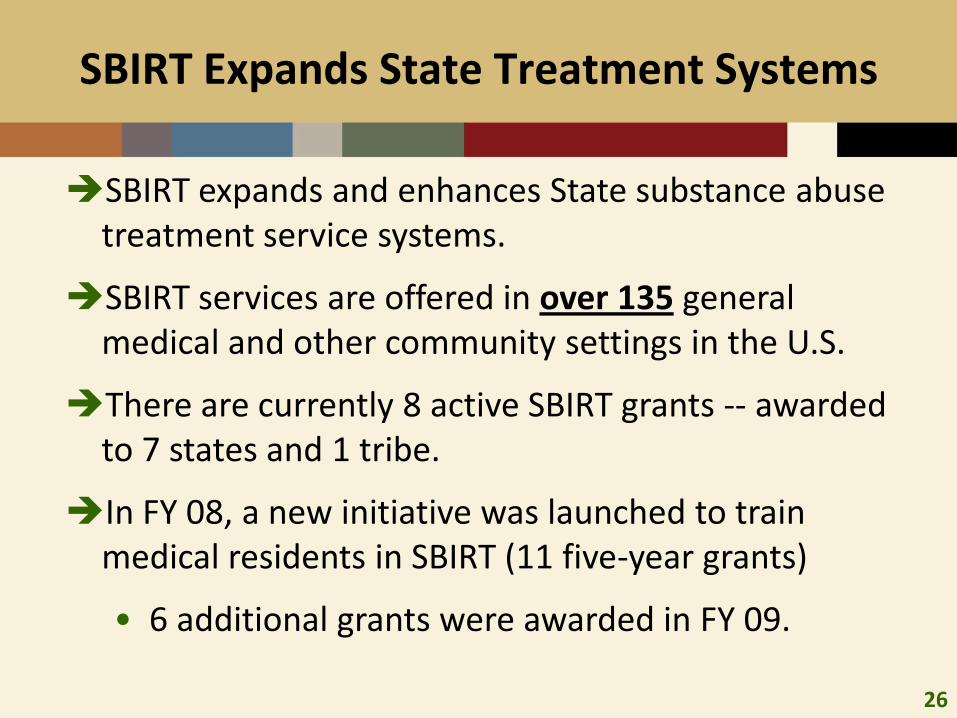
SBIRT Expands State Treatment Systems
SBIRT expands and enhances State substance abuse treatment service systems.
SBIRT services are offered in over 135 general medical and other community settings in the U.S.
There are currently 8 active SBIRT grants -- awarded to 7 states and 1 tribe.
In FY 08, a new initiative was launched to train medical residents in SBIRT (11 five-year grants)
• 6 additional grants were awarded in FY 09.
27
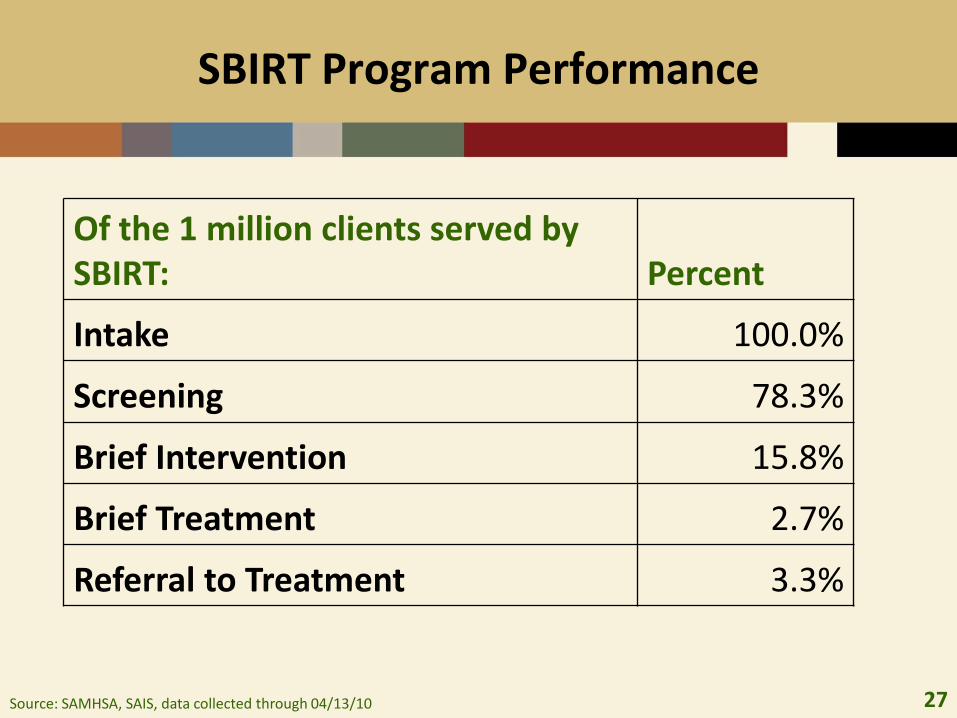
SBIRT Program Performance
Of the 1 million clients served by SBIRT: Percent
Intake 100.0%
Screening 78.3%
Brief Intervention 15.8%
Brief Treatment 2.7%
Referral to Treatment 3.3%
Source: SAMHSA, SAIS, data collected through 04/13/10
28
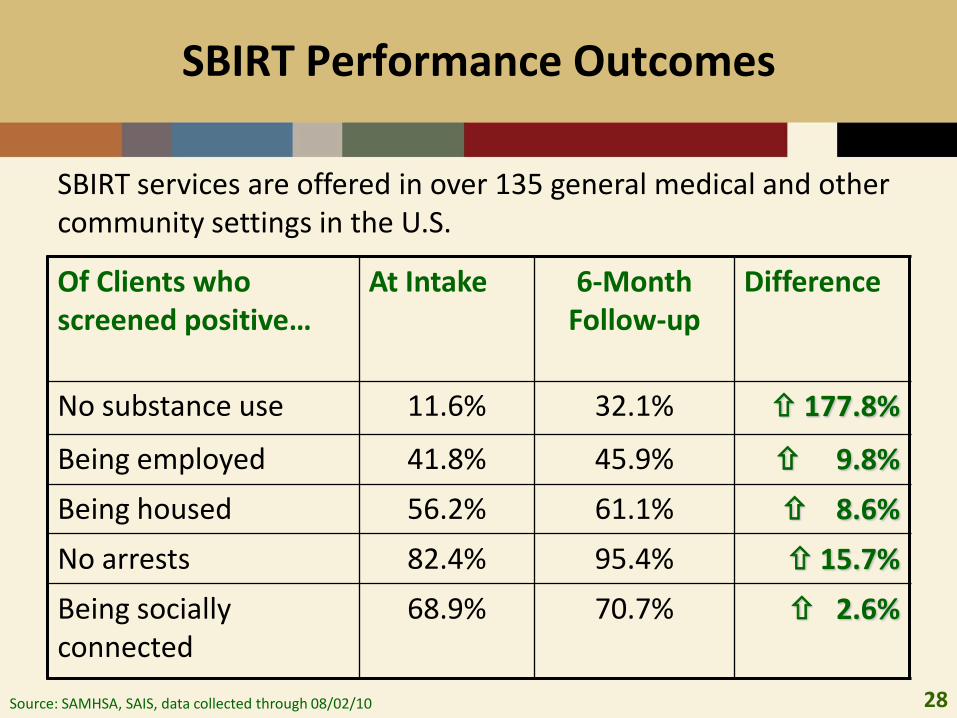
SBIRT Performance Outcomes
Source: SAMHSA, SAIS, data collected through 08/02/10
Of Clients who screened positive…
At Intake 6-Month Follow-up
Difference
No substance use 11.6% 32.1% 177.8%
Being employed 41.8% 45.9% 9.8%
Being housed 56.2% 61.1% 8.6%
No arrests 82.4% 95.4% 15.7%
Being socially connected
68.9% 70.7% 2.6%
SBIRT services are offered in over 135 general medical and other community settings in the U.S.
29
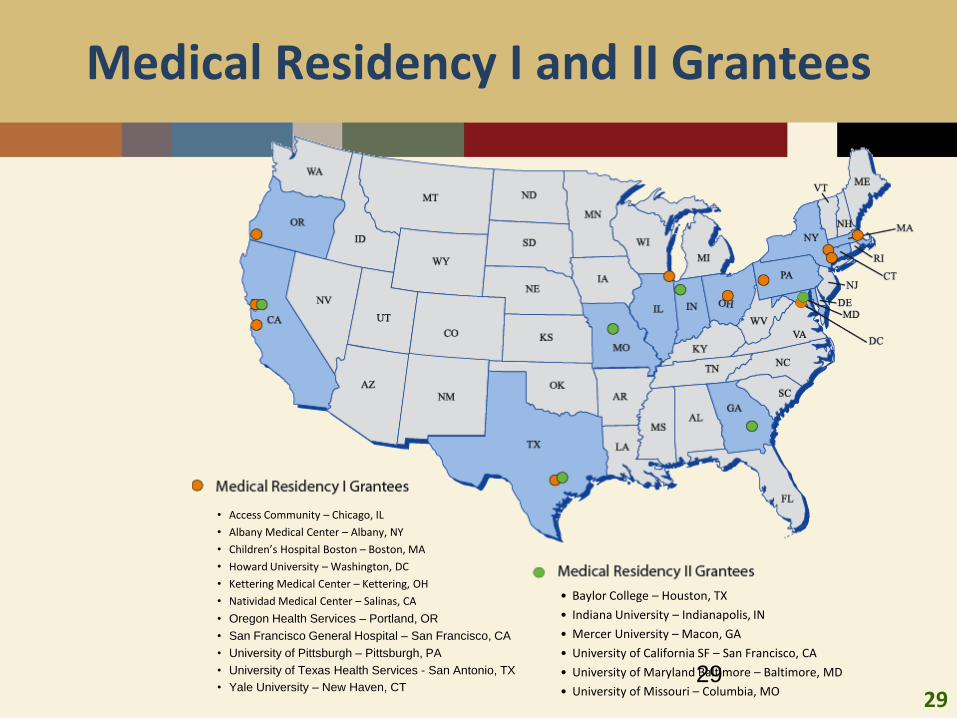
Medical Residency I and II Grantees
• Access Community – Chicago, IL
• Albany Medical Center – Albany, NY
• Children’s Hospital Boston – Boston, MA
• Howard University – Washington, DC
• Kettering Medical Center – Kettering, OH
• Natividad Medical Center – Salinas, CA
• Oregon Health Services – Portland, OR
• San Francisco General Hospital – San Francisco, CA
• University of Pittsburgh – Pittsburgh, PA
• University of Texas Health Services - San Antonio, TX
• Yale University – New Haven, CT29
• Baylor College – Houston, TX
• Indiana University – Indianapolis, IN
• Mercer University – Macon, GA
• University of California SF – San Francisco, CA
• University of Maryland Baltimore – Baltimore, MD
• University of Missouri – Columbia, MO
30
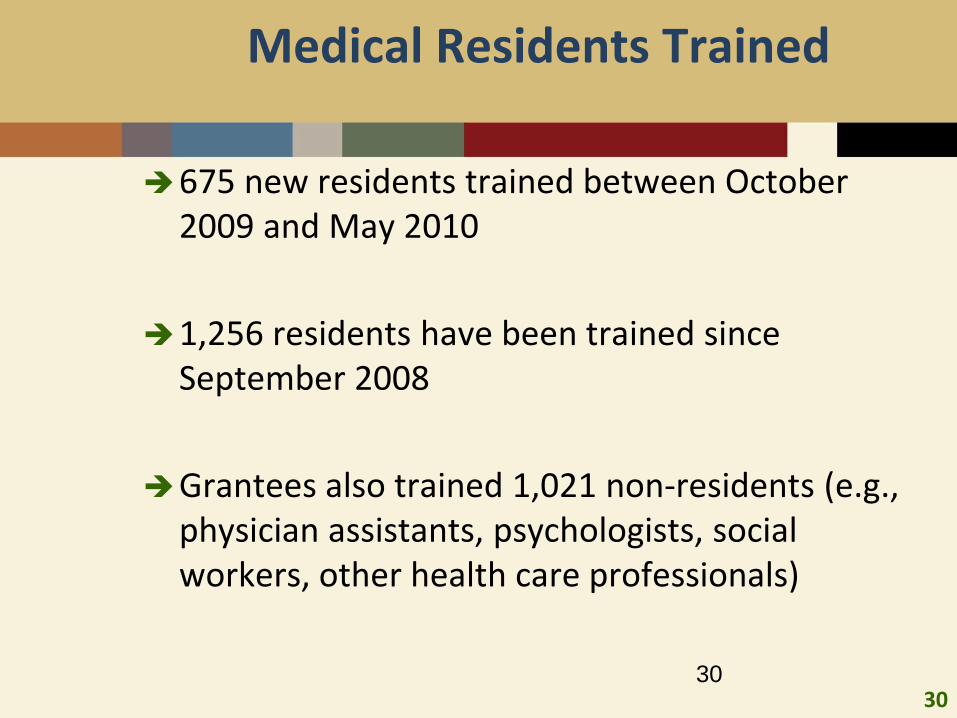
Medical Residents Trained
675 new residents trained between October 2009 and May 2010
1,256 residents have been trained since September 2008
Grantees also trained 1,021 non-residents (e.g., physician assistants, psychologists, social workers, other health care professionals)
30
31
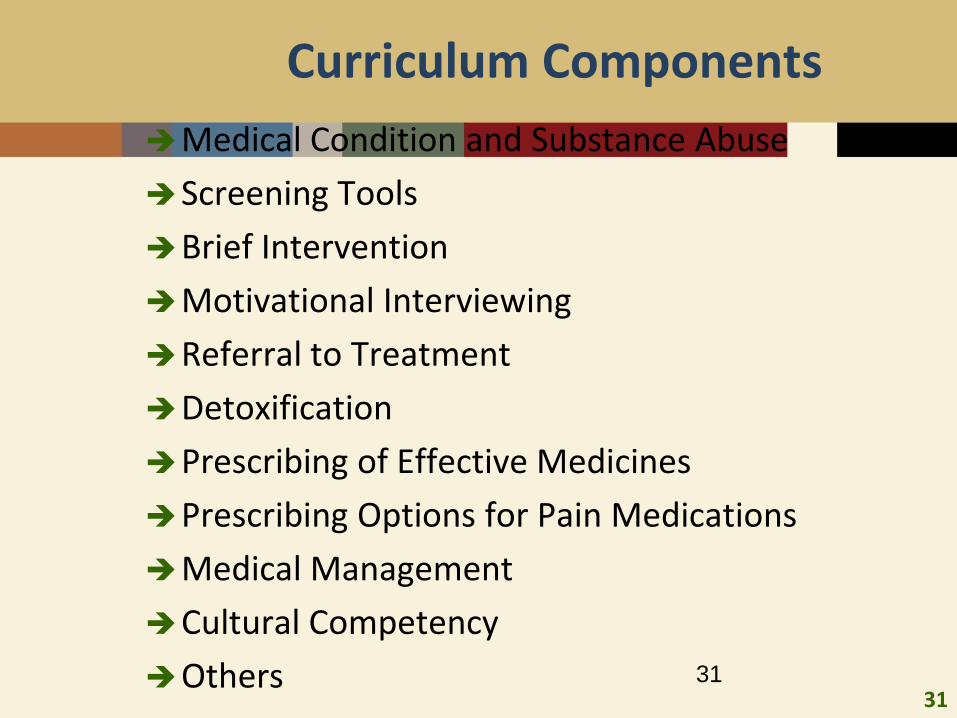
Curriculum Components
Medical Condition and Substance Abuse
Screening Tools
Brief Intervention
Motivational Interviewing
Referral to Treatment
Detoxification
Prescribing of Effective Medicines
Prescribing Options for Pain Medications
Medical Management
Cultural Competency
Others 31
32
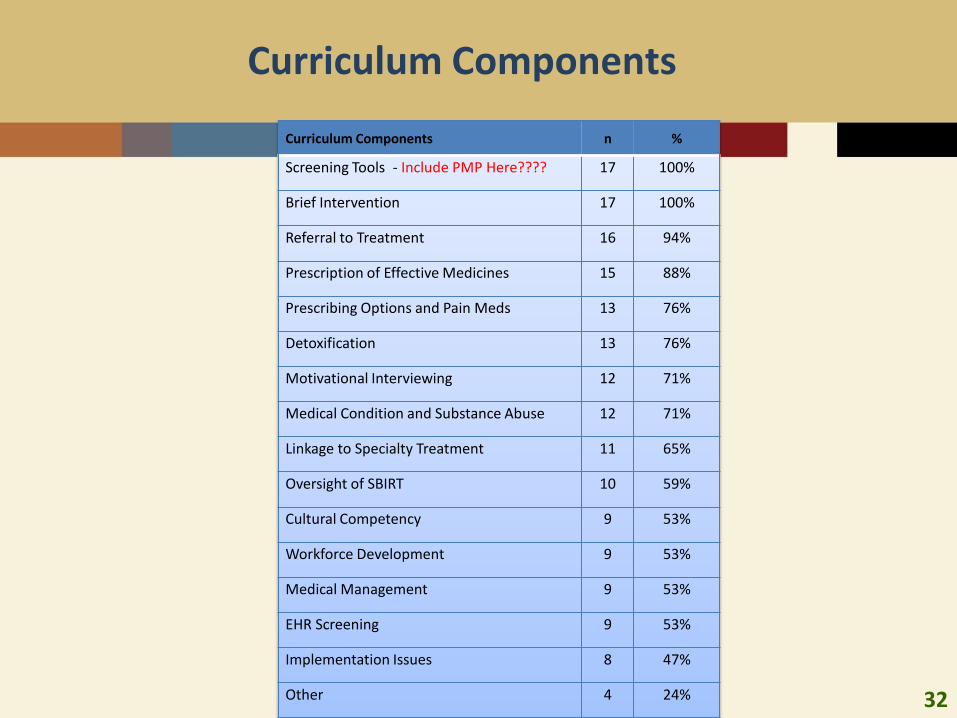
Curriculum Components
Curriculum Components n %
Screening Tools - Include PMP Here???? 17 100%
Brief Intervention 17 100%
Referral to Treatment 16 94%
Prescription of Effective Medicines 15 88%
Prescribing Options and Pain Meds 13 76%
Detoxification 13 76%
Motivational Interviewing 12 71%
Medical Condition and Substance Abuse 12 71%
Linkage to Specialty Treatment 11 65%
Oversight of SBIRT 10 59%
Cultural Competency 9 53%
Workforce Development 9 53%
Medical Management 9 53%
EHR Screening 9 53%
Implementation Issues 8 47%
Other 4 24%
33
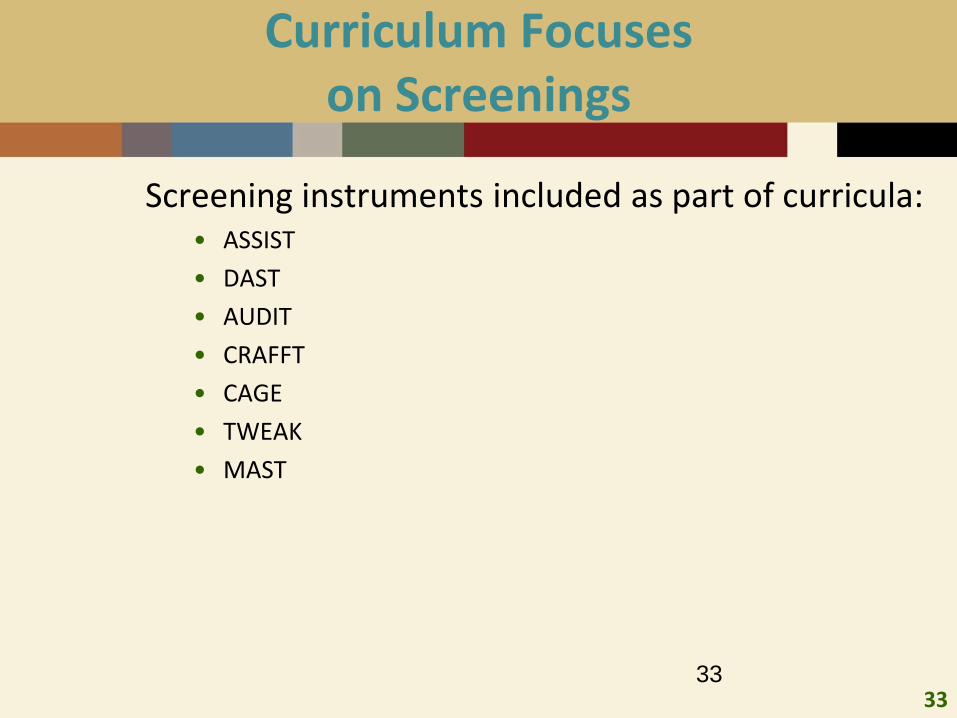
Curriculum Focuses on Screenings
Screening instruments included as part of curricula:• ASSIST
• DAST
• AUDIT
• CRAFFT
• CAGE
• TWEAK
• MAST
33
34
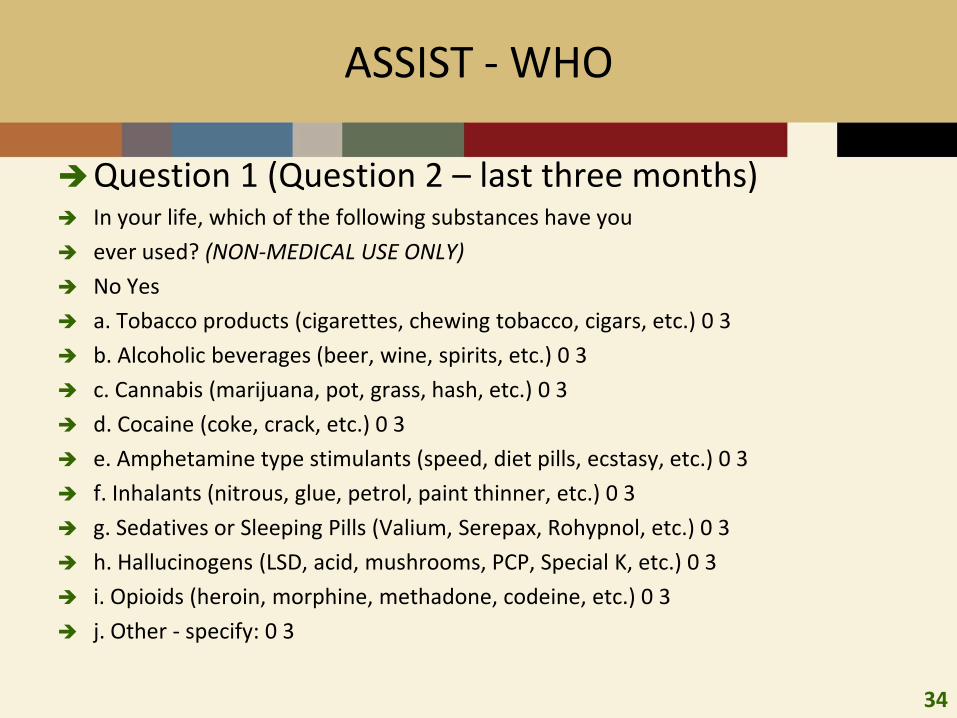
ASSIST - WHO
Question 1 (Question 2 – last three months) In your life, which of the following substances have you
ever used? (NON-MEDICAL USE ONLY)
No Yes
a. Tobacco products (cigarettes, chewing tobacco, cigars, etc.) 0 3
b. Alcoholic beverages (beer, wine, spirits, etc.) 0 3
c. Cannabis (marijuana, pot, grass, hash, etc.) 0 3
d. Cocaine (coke, crack, etc.) 0 3
e. Amphetamine type stimulants (speed, diet pills, ecstasy, etc.) 0 3
f. Inhalants (nitrous, glue, petrol, paint thinner, etc.) 0 3
g. Sedatives or Sleeping Pills (Valium, Serepax, Rohypnol, etc.) 0 3
h. Hallucinogens (LSD, acid, mushrooms, PCP, Special K, etc.) 0 3
i. Opioids (heroin, morphine, methadone, codeine, etc.) 0 3
j. Other - specify: 0 3
35
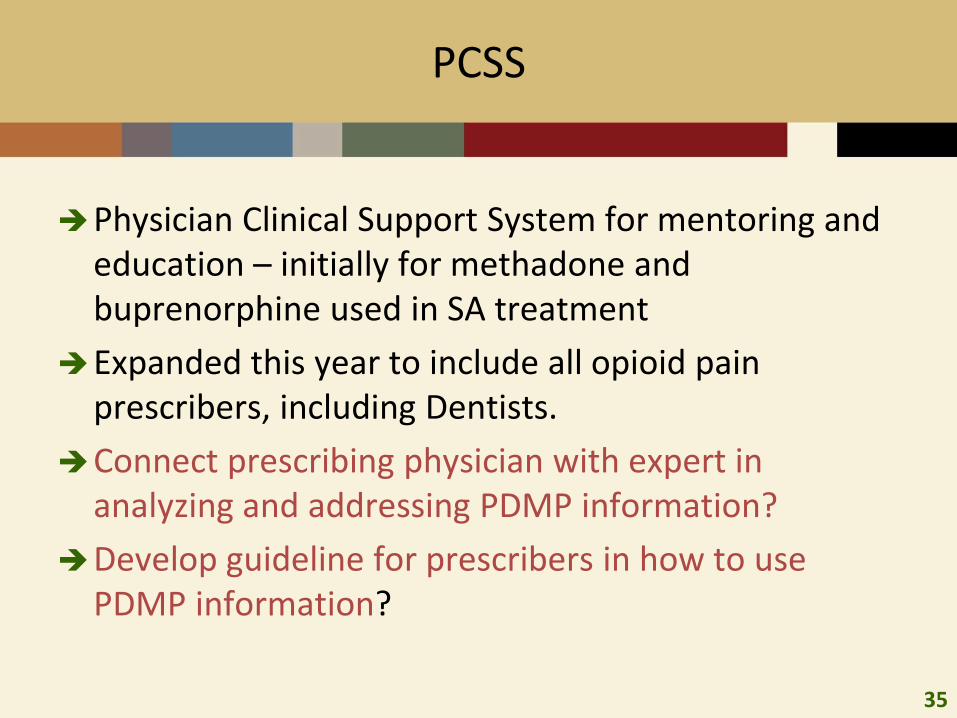
PCSS
Physician Clinical Support System for mentoring and education – initially for methadone and buprenorphine used in SA treatment
Expanded this year to include all opioid pain prescribers, including Dentists.
Connect prescribing physician with expert in analyzing and addressing PDMP information?
Develop guideline for prescribers in how to use PDMP information?
36
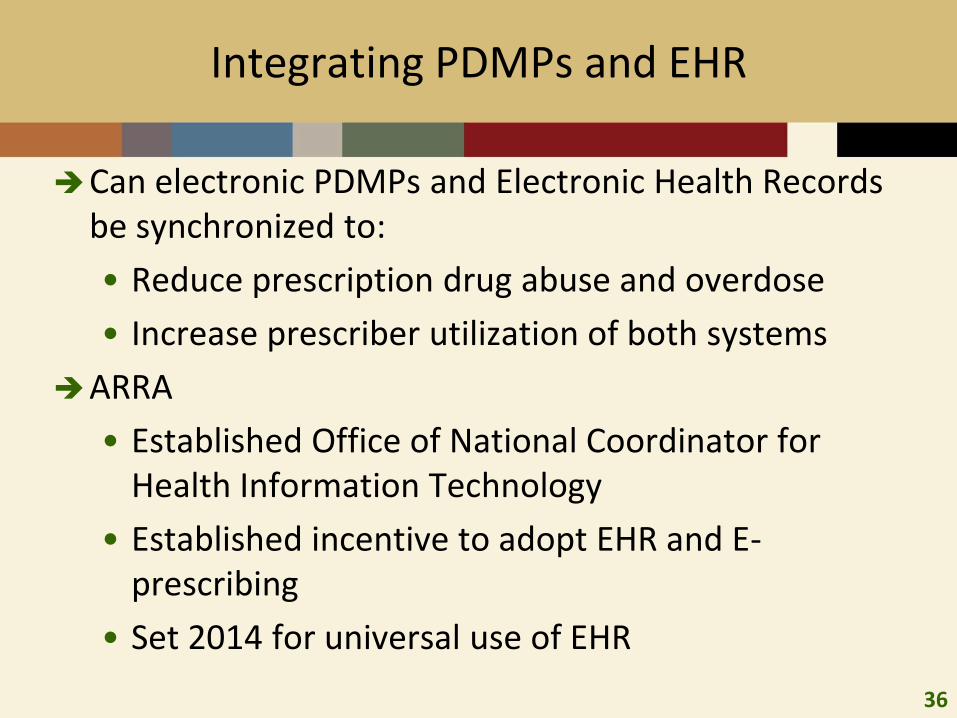
Integrating PDMPs and EHR
Can electronic PDMPs and Electronic Health Records be synchronized to:
• Reduce prescription drug abuse and overdose
• Increase prescriber utilization of both systems
ARRA
• Established Office of National Coordinator for Health Information Technology
• Established incentive to adopt EHR and E-prescribing
• Set 2014 for universal use of EHR
37
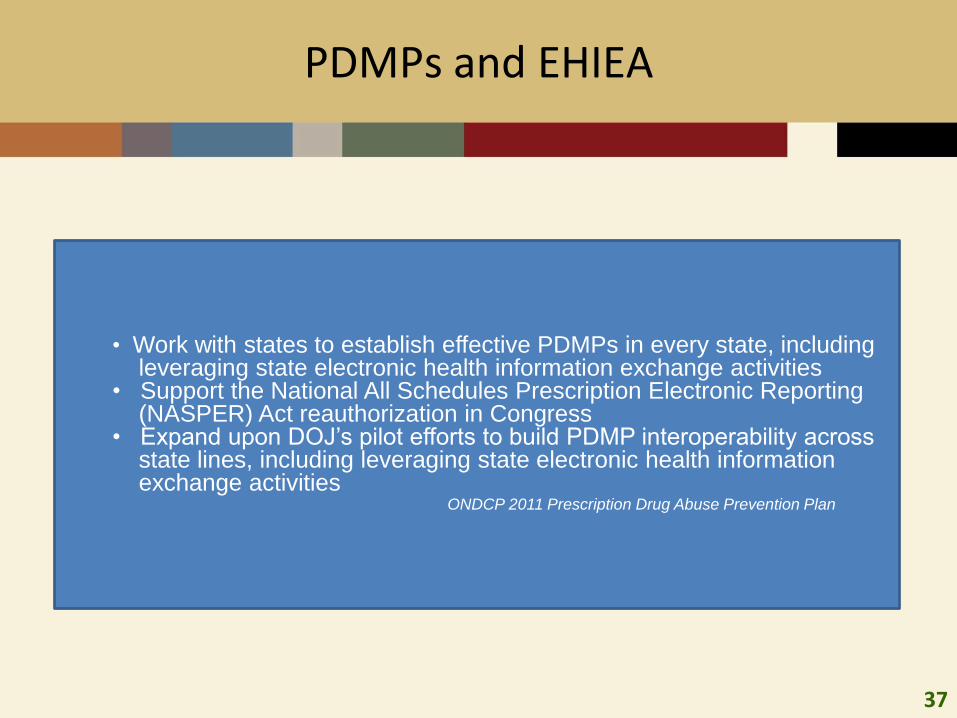
PDMPs and EHIEA
• Work with states to establish effective PDMPs in every state, including leveraging state electronic health information exchange activities
• Support the National All Schedules Prescription Electronic Reporting(NASPER) Act reauthorization in Congress
• Expand upon DOJ’s pilot efforts to build PDMP interoperability acrossstate lines, including leveraging state electronic health information exchange activities
ONDCP 2011 Prescription Drug Abuse Prevention Plan
38
EHR and NASPER
NASPER Envisioned –
“applications shall include… an agreement to adopt health information interoperability standards…”
39
Goals of Integration
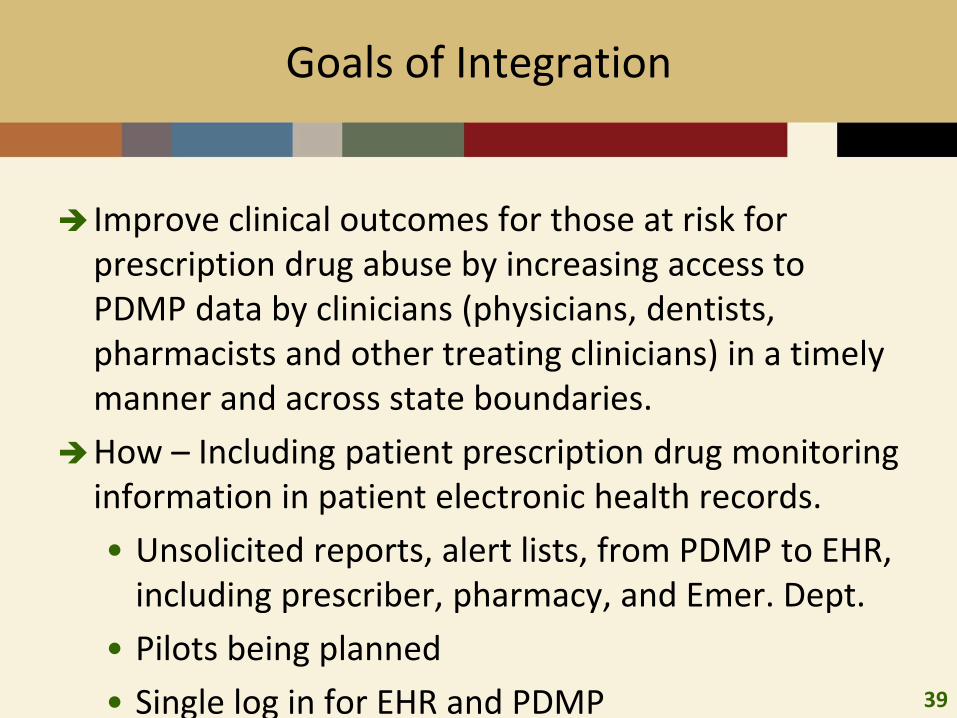
Improve clinical outcomes for those at risk for prescription drug abuse by increasing access to PDMP data by clinicians (physicians, dentists, pharmacists and other treating clinicians) in a timely manner and across state boundaries.
How – Including patient prescription drug monitoring information in patient electronic health records.
• Unsolicited reports, alert lists, from PDMP to EHR, including prescriber, pharmacy, and Emer. Dept.
• Pilots being planned
• Single log in for EHR and PDMP
40
Summary
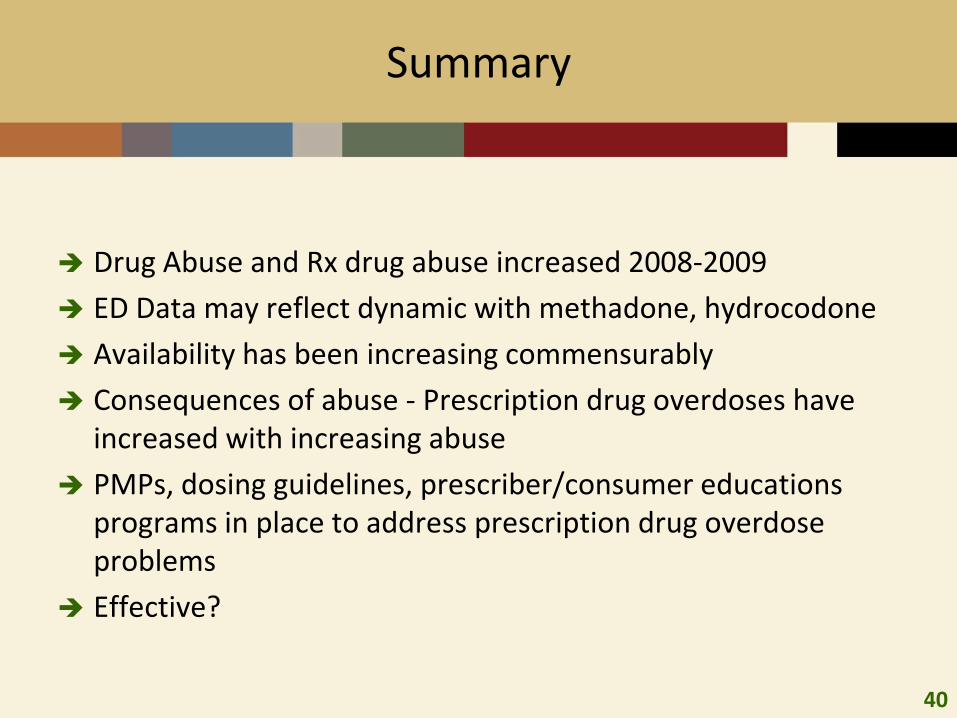
Drug Abuse and Rx drug abuse increased 2008-2009
ED Data may reflect dynamic with methadone, hydrocodone
Availability has been increasing commensurably
Consequences of abuse - Prescription drug overdoses have increased with increasing abuse
PMPs, dosing guidelines, prescriber/consumer educations programs in place to address prescription drug overdose problems
Effective?