Embed Size (px)
Citation preview

Preventing Robberies at Sub-Post Offices:an evaluation of a security initiative
Paul Ekblom
CRIME PREVENTION UNIT: PAPER 9LONDON: HOME OFFICE
Editor: John WebsterHome Office Crime Prevention Unit
50 Queen Anne’s GateLondon SW1H 9AT

© Crown Copyright 1987First published 1987
Crime Prevention Unit Papers
The Home Office Crime Prevention Unit was formed in 1983 to promotepreventive action against crime. It has a particular responsibility to disseminateinformation on crime prevention topics. The object of the present series ofoccasional papers is to present analysis and research material in a way whichshould help and inform practitioners whose work can help reduce crime.
ISBN 0 86252 300 1
(ii)

Foreword
This report describes an evaluation of an initiative by the Post Office to preventrobberies of sub-post offices in London, which had grown dramatically in the late1970s and early 1980s. The initiative, which included improvements in securityprocedures and the strengthening of ‘anti-bandit screens’ in all 1300 sub-postoffices in the London Postal Region, was followed by a fall in the number ofrobberies. For the crime prevention practitioner it is important to know whatproportion of this fall might be ascribed to the security initiative, and how muchto other factors, including for example police success in identifying and arrestingoffenders. Evaluation of individual crime prevention initiatives is a valuable aidto improving the effectiveness of preventive measures generally. Yet as thisreport illustrates, evaluation of real events on the basis of limited informationis a difficult exercise inevitably leaving a degree of uncertainty attached to anyconclusions.
Nonetheless, this report is able to conclude that, within broad limits, the PostOffice security initiative was a success, and contributed to at least some of thefall in robbery rates.
J A CHILCOTDeputy Under Secretaty of StateHome Office, Police DepartmentAugust 1987
(iii)

Acknowledgements
I am indebted to Mike Horler and Phil Giles, of the Post Office InvestigationDepartment, for access to Post Office robbery records and much help andencouragement; to Belinda Smith of G10 Branch of the Metropolitan Police,for robbery statistics; to Sneh Birdi, who assisted in collecting and coding thedata; to Mike Levi, University College Cardiff, and to Ian Sinclair, of the NationalInstitute of Social Work, for valuable comments; and to my colleagues GloriaLaycock, Kevin Heal and Pat Mayhew for their part in converting the tangledbriar patch of early drafts of this report into something more closely resemblinga well-pruned rose-bed.
PAUL EKBLOM
(iv)

Contents
Foreword
Acknowledgements
List of tables
List of figures
Introduction
Data for the evaluation
Was there a real change in robbery rates?
What proportion of the fall can be attributed to Post Office action?
What were the side effects of the security initiative?
Cost effectiveness
Next moves for the Post Office
Final points
Appendix 1 Choice of indicators for the background fall, andcalculation of the estimates of the fall in robberiesdue to the security initiative
Appendix 2 Interpreting the pattern of falls shown by thevarious methods of attack
References
Page
(iii)
(iv)
(vi)
(vii)
1
4
5
8
12
21
22
23
24
32
35
36Crime Prevention Unit Papers
(v)

List of Tables
Page
Table 1 The estimates of the fall in robberies at sub-post officesattributable to the security initiative 12
Table 2 Yearly rates of successful attacks on sub-post offices inLondon Postal Region, by method and phase 13
Table 3 Yearly rates of successful and unsuccessful attacks onsub-post offices in London Postal Region, by method and phase 14
Table 4 Proportion of attacks successful, by phase and method of attack 15
(vi)

List of Figures
Page
Figure 1
Figure 2
Figure 3
Figure 4
Figure 5
Figure 6
Figure 7
Figure A1.1
Figure A1.2
Figure A2.1
Number of successful and unsuccessful robberyincidents, by year
Raids on sub-post offices and other locations, and cashin transit, by year
Number of successful and unsuccessful robbery incidentsby quarter
Number of successful and unsuccessful robbery incidentsper method, plotted by quarter
Overview of process of calculation of estimates
Schematic interpretation of the impact of the Post Officesecurity initiative
Proportion of robberies within sub-post offices wherefirearms were involved, by quarter
Sub-post office robberies and other robberies atbusiness premises compared, by quarter
Number of successful and unsuccessful robbery incidentsby year, with phases superimposed
Preventive gains and losses
(vii)
1
3
6
7
9
17
19
25
28
33

Introduction
During the early eighties the number of sub-post office robberies in the LondonPostal Region increased substantially: from 70 incidents in 1980 the figure reached250 in 1981 and continued to rise the following year, to 266. About half of therobberies were failures, with nothing taken and the robbers usually scared off;nevertheless the growth in attacks posed a significant threat to staff and customers,and put in doubt the trading viability of some sub-post offices.
The Post Office responded by embarking on a major security initiative, guidedby an analysis of the methods of attack used by the robbers. Since a significantproportion of robberies involved attacks over the counter, it was concluded thatthe existing anti-bandit screens gave inadequate protection to staff. Between
Figure 1 Number of successful and unsuccessful robbery incidents by year
1

October 1981 and March 1985 the counter screen barrier protection in virtuallyall of some 1300 sub-post offices in the London Postal Region was upgraded togive a higher degree of resistance to physical attack. Several other improvements insecurity were introduced including a training programme for sub-postmasters.Together these measures form an example of situational crime prevention, wherephysical and social changes are made in the immediate environment of vulnerabletargets with the aim of reducing the opportunity for offending, and heighteningthe risk to the offender. After their sharp rise robbery incidents steadily declinedfrom the 1982 peak, to 121 in 1985. This pattern is shown in Figure 1.
On the face of it the security initiative seems to have been a success, with therobbery incident rate reduced to less than half the peak level. But this apparentlyobvious result is hard to interpret, since it is difficult to say what proportion of thefall in robberies should be attributed to the Post Office’s own security initiative,and what proportion to unrelated factors such as police action, or totally co-incidental events. The changes in the rate of sub-post office raids occurred at atime when the pattern of robbery in London was itself changing. As Figure 2shows, the robberies to other premises in the Metropolitan Police District peakedat about the same time as those in the sub-post offices; and there has been amore recent growth in raids on cash and valuables in transit by the Post Officeand elsewhere.
All evaluations are more difficult than they seem at first (and conclusions mustultimately rely on the balance of plausibility of alternative explanations for theobserved results) but in this case conclusions are all the more difficult to drawbecause the data for the evaluation were obtained retrospectively, rather thanduring the course of a planned experiment.
Despite these difficulties it was decided to proceed with the evaluation for tworeasons. First, there is relatively little research on robbery and its prevention; asa result there is some doubt whether situational approaches can be effective indealing with anything other than opportunist theft. Second, if prevention is todevelop practitioners require information on how evaluation can be carried outwith often limited resources.
The current report aims to cater for both sets of needs: to present findings on theimpact of preventive measures on robbery; and whilst doing so to comment on theissues which must be addressed by those seeking to evaluate preventive initiatives.The text thus goes into rather greater methodological detail than would normallybe the case, although much of this detail is consigned to appendices.
‘Pure’ and ‘applied’ research differ both in the way they handle uncertainty, andin their focus on the general versus the particular. Uncertainty can spring fromstatistical variation, imperfect or missing items of data, and the broader difficultiesin making inferences about cause and effect. Those concerned with pure researchfollow rigid rules to ensure that their conclusions are above a minimum level of
2
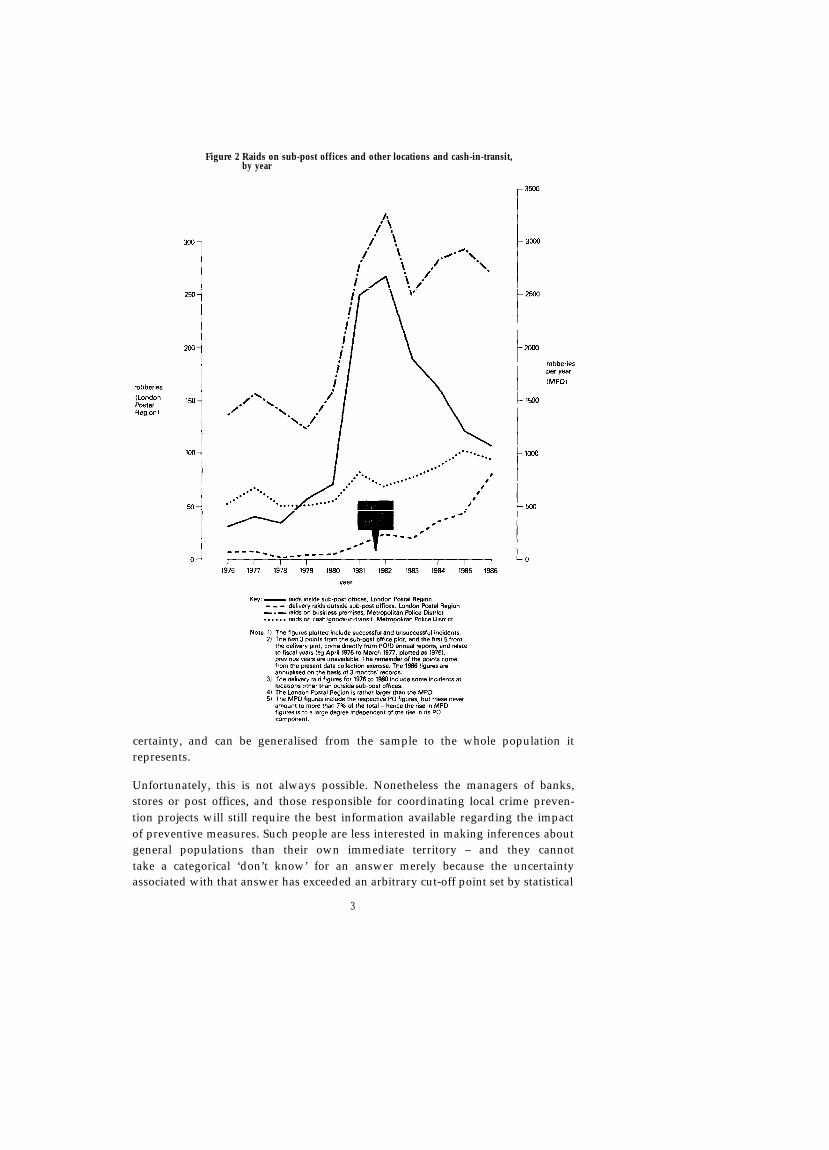
Figure 2 Raids on sub-post offices and other locations and cash-in-transit,by year
certainty, and can be generalised from the sample to the whole population itrepresents.
Unfortunately, this is not always possible. Nonetheless the managers of banks,stores or post offices, and those responsible for coordinating local crime preven-tion projects will still require the best information available regarding the impactof preventive measures. Such people are less interested in making inferences aboutgeneral populations than their own immediate territory – and they cannottake a categorical ‘don’t know’ for an answer merely because the uncertaintyassociated with that answer has exceeded an arbitrary cut-off point set by statistical
3
convention (cf. Oakes, 1986). But the ‘applied’ researcher cannot simply handover an unqualified answer and run the risk that it will be taken at face value bythe manager. Fortunately the competent manager is accustomed to decision-making under conditions of uncertainty, so the solution is to provide the managerwith an assessment which contains an evaluative judgement together with theassociated range of uncertainty. This approach often involves a shift from all-or-nothing significance testing to the provision of results accompanied by an estimateof the margin of error (in some cases through confidence intervals).
This report primarily adopts the applied perspective, although it attempts,cautiously, to generalise from some of the findings. After describing the data onwhich the study is based, the report raises the question of whether there was areal change in the pattern of robbery which calls for explanation, or a rise andfall that merely reflected random fluctuation. Estimates are then given of the sizeof the fall in robberies which might be accredited to the Post Office securityinitiative. In line with the preceding discussion, a range of values is produced,rather than a single figure. Next, it examines possible side-effects of the securityinitiative: in particular, did the robbers respond by changing their methods ofattacking sub-post offices, by for example greater resort to firearms, and did theyalso shift to other targets? The cost-effectiveness of the initiative is then discussed.
Data for the evaluation
Data on every robbery incident (successor failure) within sub-post offices in theLondon Postal Region were collected from Post Office Investigation Departmentrecords, covering the period 1 January 1979 to 31 March 1986. Also noted wereraids on PO vans delivering money and other valuables to sub-post offices. InPO records, each incident was described in a short passage giving details ofoffenders, weapons, injuries, losses (if any), and the unfolding of the event itself.Altogether a range of data on 1303 incidents were obtained. One of the morecomplex pieces of information to extract from the records was the method ofattack (see Ekblom, 1987 for a discussion of the issues involved in categorisingcrime data by methods of offence). The categories of attack eventually used arelisted below. To put these in context it is useful to recall the layout of a typicalsub-post office. Generally operated as part of a private retail business, for examplea newsagent’s, the sub-post office part of the store in London and many otherareas is enclosed by a floor-to-ceiling security screen with a counter and a hatchto take in parcels and a lockable door to the private business area of the shop.Though physically small, sub-post offices often have quite a large turnover ofcash and can thus make a tempting target for robbers. They are frequently runas a family concern.
Methods of robbey within sub-post offices
Each robbery incident was put into one of the following categories.
1. Physical attack on screen – tools such as sledgehammers may be used, or
4

bare hands; sometimes in addition threats are made and weapons carried,although these are ancillary to the attack on the screen.
2. Firearms at screen – weapons, almost always firearms, are pointed at thescreen to threaten staff behind it and occasionally discharged. This categoryincluded some cases where a physical attack on the screen failed and therobber then resorted to a firearm threat.
3. Insecure – robber forces his way through open parcel hatch, enters throughopen security door, or via stock room of non-Post Office part of shop etc.
4. Outside secure area – staff or customers outside secure Post Office area aretaken hostage or threatened, with or without firearms, to force staff to openup secure area. Staff may be attacked when opening or closing the shop.
5. Miscellaneous – eg robbers break into sub-post office and await arrival ofsub-postmaster.
Methods of robbery outside sub-post offices
6. Delivery – robbers await PO staff delivering remittances to sub-post office,and ambush them on street.
Figure 2 gives a general impression of the changes in robbery rates in the Londonarea from the early seventies. It presents sub-post office robberies, robberies onall business premises (the sub-post office robberies were, in 1985, about 4%of the total), delivery raids outside sub-post offices and all cash-in-transit raids.More detailed comparisons are made between these trends at various pointsbelow.
Was there a real change in robbery rates?
Figure 1 (page 1) shows the rates of robbery incidents (successes and failures) forthe London Postal Region by year over the period January 1979 to March 1986,and for several years previously. The pattern appears as a sharp rise followed bya more gentle fall to a rather higher level than intially. The first question iswhether this apparently distinct event was no more than one of a string ofrandom peaks and troughs over time commonly seen in crime data, particularlywhere numbers are relatively small. Such a pattern might result, for example,if one or two highly active offenders were first to enter the area and then tocease to commit robbery for completely incidental reasons (eg illness). With suchrandom fluctuation the Post Office could no more take credit for the fall than thepassengers of a roller-coaster for the ups and downs of the vehicle.
It seems clear, by inspection of Figure 1, that there is something to be explainedin the pattern of robbery over the period. (1)
(1) If the uncertainties as to cause and effect had been smaller and the observed pattern less distinct, it would havebeen sensible to use more sophisticated statistical methods to draw this conclusion and provide quantitativeestimates of statistical uncertainty.
5

During the seventies robbery incidents remain at consistently low levels, andthe 1982 peak stands out very clearly from earlier, and later fluctuations. Thepeak stands out even more distinctly when robbery rates are presented by quarter(Figure 3).
6

7

Evidence from comparison of the pattern of the different methods of robberyreinforces this impression. Figure 4 presents the different robbery rates byquarter. If the different methods were each showing purely random fluctuationstheir rates would probably vary independently of one another. However,with the exception of the miscellaneous category, the various methods appear,visually, to a large extent to share a common pattern of rise and fall. Thissuggests that the overall, combined rise and fall is not due to random fluctua-tions. It also illustrates the fact that the change in overall robbery rate has notresulted from a sudden rise and fall in just one or two methods of attack, withthe rest continuing as before.
The conclusion can be drawn, therefore, that there has been a distinct fall inrobbery levels which began about the same time as the Post Office securityinitiative. What is in question is whether the fall was from a new, and higher‘natural plateau’ in robbery levels (ie the rate would have levelled out at theexisting peak), or whether the monthly totals would have kept growing furtherbut for the intervention of outside events such as the security initiative. Thisremains a major source of uncertainty in the evaluation, since it is impossibleto make even an informed guess about the crime level that might have been.This report rests on the assumption that there would have been no furthergrowth in robbery rates from the observed peak – hence the subsequent evalu-ation probably underestimates rather than overestimates the true impact of thesecurity initiative.
What proportion of the fall can be attributed to Post Office action?
In answering this question we have to distinguish between the proportion of theobserved fall in robbery levels that can be attributed to the security initiative, asagainst the proportion that can be attributed to ‘background’ factors, such as theincreased police action against robbers known to have occurred at the same time.Looking at the issue in more detail, there are several possible explanations forthe fall in robbery rates, some of which (a to c below) give credit to the securityinitiative, others to the background factors. The various causes could be operatingin parallel, and include:
a) the direct physical effect of the upgraded screen in making physical attacksharder to commit;
b) a general tightening up of security at sub-post offices in response to therobbery wave, with staff becoming more vigilant and careful in their actionssuch as ensuring that the door from the shop to the protected areas is closed;
c) a broad deterrent effect on robbers, as knowledge that ‘somehow securityhas been improved’ becomes widespread.
d) The occurrence of ‘background’ changes independent of the security
8

initiative, such as increased police attention to robberies in response to theirrapid growth. During the growth period a number of operations against postoffice robbers were in fact conducted.
e) Regression to the status quo – ie the possibility of the rise and fall being nomore than part of a sequence of random fluctuations. It was earlier argued thatthis cannot account for the whole pattern; but any partial contribution thatregression may have made to the size of the fall in robbery rates will be takeninto consideration below.
In an evaluation using an experimental design, control groups (such as a set ofsub-post offices not fitted with screens) would have made estimation of back-ground changes relatively straightforward. Here, however, it is necessary to derivemeasures of the background effects by other less-preferred means, involving theuse of indicators. Once this is done the background measures can be subtractedfrom the total observed fall in robbery rates; the remaining figure represents theproportion of the fall arguably attributable to the Post Office. This process isillustrated in Figure 5.
Figure 5 Overview of process of calculation of estimates
9

To cope with the greater uncertainty of the non-experimental design, threedifferent measures are taken of the background fall, each with different sourcesof error. They are described below in brief; Appendix 1 gives more detail.
– The first assumes that the size of the background fall can be derived fromchanges, over the time period in question, in the Metropolitan Police figuresfor robbery in commercial premises – this is called the ‘external backgroundfall’. Subtracting it from the total fall and making various corrections producesthe external lower estimate of the fall due to the security initiative.
– The second assumes that the background fall can be derived from the fallin the rate of one of the five methods of attacking sub-post offices: attackson staff and customers outside the secure area. This last is judged the methodof attack least likely to have been affected by the security initiative, andconsequently could serve as a reasonable indicator of the influence of anybackground factors. This is called the ‘internal background fall’, and corres-pondingly subtracting this from the total fall produces the internal lower estimateof the fall due to the security initiative.
– The third simply assumes that the background fall was zero, ie that the entirereduction in robbery rates was due to the Post Office; this produces the upperestimate of the fall due to the security initiative.
The total fall itself was estimated by comparing robbery rates during two differentphases: the first, a 10-month period when robberies were at their peak and thePost Office security initiative began; the second, a 22-month period running upto the end of the study. The establishment of the peak phase in particular wasnot straightforward, and judgement was needed to resolve a conflict betweenobtaining a figure for the peak rate that was statistically reliable on the one hand,and representative of quite rapid changes on the other. (The process is fullydescribed in Appendix 1 but in essence it involved dividing the plot of robberyrates by sight into five phases: pre-rise, rise, peak, decline and final. The internaland external background falls were calculated with reference to the same peakand final phases.)
Measures were calculated separately for the effect of the security initiative onsuccessful attacks alone, and on successes and failures combined. This wasbecause, as with many types of crime, failed attempts may be seen as an indicatorthat preventive measures, such as target-hardening, are working well (Hough andMo, 1986). Whilst serving this function, failed attempts at robbery must also beviewed from a more critical perspective, since PO staff and customers may stillbe subjected to some trauma and physical danger, perhaps facing a shotgun oran iron bar, and PO fittings may be damaged before an attempt is abandoned.
Before presenting the results of the estimation process it is helpful to take stock.While a distinct fall in sub-post office robbery rates reliably appears to have
10
begun at the same time as the security initiative was started, the various sourcesof uncertainty in the data have made it necessary to establish three estimates ofthe size of the fall that is attributable to the security initiative. The two lowerestimates assume that only some proportion of the fall was due to the PostOffice; the upper one assumes that the entire fall can be thus attributed. For thelower ones, estimating the size of that proportion is to be done using differentindicators of the ‘background fall’, which are subtracted from the total fall: anexternal one based on MPD robbery figures and an internal one based on themethod of post office robbery judged least likely to have been affected by thesecurity initiative. Altogether there will be three estimates of the fall attributableto the security initiative for successful robberies, and equivalent estimates forsuccesses and failures combined.
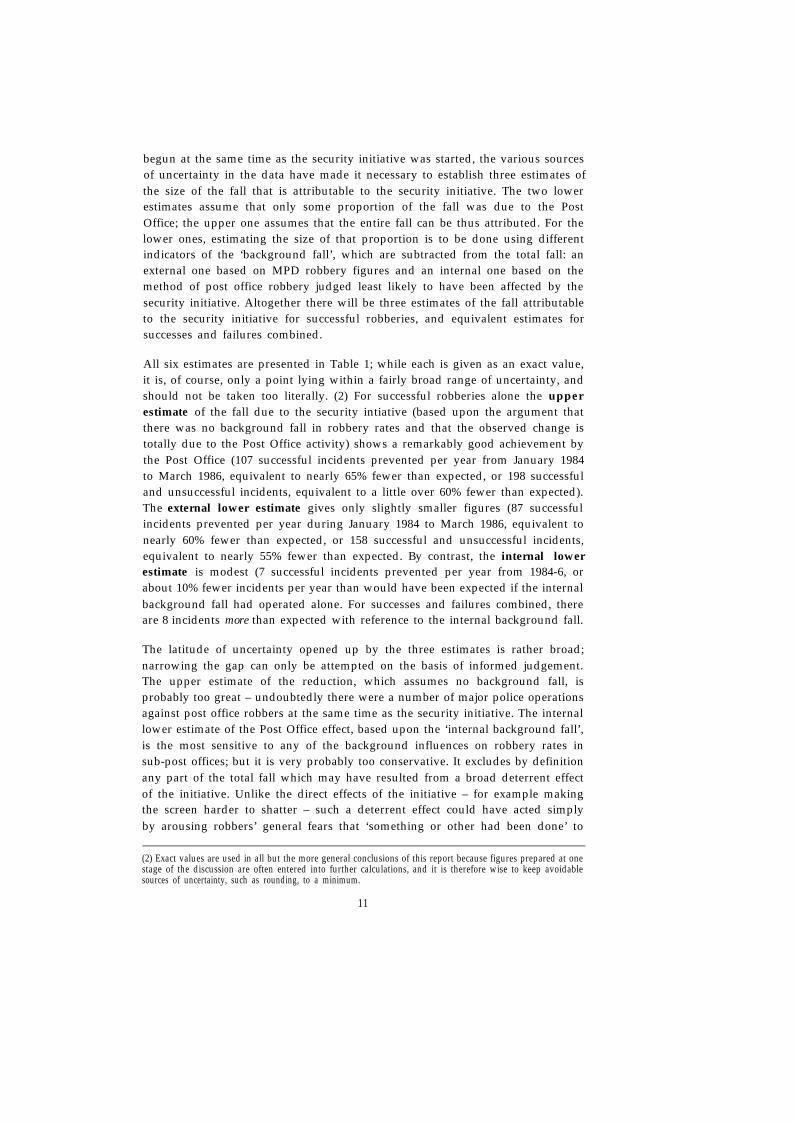
All six estimates are presented in Table 1; while each is given as an exact value,it is, of course, only a point lying within a fairly broad range of uncertainty, andshould not be taken too literally. (2) For successful robberies alone the upperestimate of the fall due to the security intiative (based upon the argument thatthere was no background fall in robbery rates and that the observed change istotally due to the Post Office activity) shows a remarkably good achievement bythe Post Office (107 successful incidents prevented per year from January 1984to March 1986, equivalent to nearly 65% fewer than expected, or 198 successfuland unsuccessful incidents, equivalent to a little over 60% fewer than expected).The external lower estimate gives only slightly smaller figures (87 successfulincidents prevented per year during January 1984 to March 1986, equivalent tonearly 60% fewer than expected, or 158 successful and unsuccessful incidents,equivalent to nearly 55% fewer than expected. By contrast, the internal lowerestimate is modest (7 successful incidents prevented per year from 1984-6, orabout 10% fewer incidents per year than would have been expected if the internalbackground fall had operated alone. For successes and failures combined, thereare 8 incidents more than expected with reference to the internal background fall.
The latitude of uncertainty opened up by the three estimates is rather broad;narrowing the gap can only be attempted on the basis of informed judgement.The upper estimate of the reduction, which assumes no background fall, isprobably too great – undoubtedly there were a number of major police operationsagainst post office robbers at the same time as the security initiative. The internallower estimate of the Post Office effect, based upon the ‘internal background fall’,is the most sensitive to any of the background influences on robbery rates insub-post offices; but it is very probably too conservative. It excludes by definitionany part of the total fall which may have resulted from a broad deterrent effectof the initiative. Unlike the direct effects of the initiative – for example makingthe screen harder to shatter – such a deterrent effect could have acted simplyby arousing robbers’ general fears that ‘something or other had been done’ to
(2) Exact values are used in all but the more general conclusions of this report because figures prepared at onestage of the discussion are often entered into further calculations, and it is therefore wise to keep avoidablesources of uncertainty, such as rounding, to a minimum.
11

Table 1: The estimates of the fall in robberies at sub-post offices attributable to thesecurity initiative
Note 1)
2)
The numbers are annual rates of robberies estimated to have beenprevented during the final phase (June 1984 - March 1986); the percent-ages are the number prevented as a proportion of the number expectedif the background fall had operated alone (see Figure 5).
A + sign indicates preventive gain, ie a fall attributable to the securityinitiative; a – indicates a loss, ie that the robbery rate was greater thanexpected.
heighten security (factor c, page 8). The external lower estimate of the effect ofthe initiative, using the background fall based on the much larger numbers ofMPD robberies (and corrected to allow for the possibility of displacement ofrobberies from sub-post offices to other commercial premises), is more reliableand allows the Post Office credit for the broad deterrent effect; it may howeverbe less representative of influences on sub-post office robbers, so it is difficultto judge whether or not it is over-generous. In sum, the upper estimate is veryprobably too large; the internal lower estimate is very probably too small; andwith the external lower estimate there are no good grounds for characterisingit one way or the other. Taking these together, the best estimate is probably alittle inclined towards the upper end of the range established - ie the securityinitiative cut the robberies by something over a third of their expected level,the reduction amounting to some 45 successful incidents per year.
Whichever estimate is used, the overall result of the security initiative is a greaterpreventive effect for successful robberies than when failed attempts are also takeninto account.
What were the side effects of the security initiative?
Displacement within sub-post offices
In order to find out what is happening to the pattern of robberies within sub-postoffices, it is necessary to look in greater detail at the changes in the rates of eachof the individual methods of attack, over the peak to final phase. Table 2 showsrates of successful robberies for the various phases, by method of robbery, and the
12

percentage fall each method displays from peak to final phase. Although (asFigure 4 showed) there is a marked basic pattern common to all methods, thefalls shown by the various methods nonetheless do differ significantly from oneanother (Chi-squared for the peak, decline and final phases = 16, df 8; p <.05).Therefore this method-to-method variation is unlikely to have stemmed fromrandom fluctuation alone, and constitutes a reasonably sound base from whichto make cautious interpretations of the pattern of events,
Table 2: Yearly rates of successful attacks on sub-post offices in London PostalRegion, by method and phase
Note 1) The phases are of unequal length: pre-rise = 20 months; rise= 10 months; peak = 10 months; decline = 25 months; final=22 months.
2) The absolute number of attacks during the relevant phase is listed insquare brackets.
3) Based on these absolute numbers (last 3 phases only) Chi-squared= 16, df 8; p <.05.
Table 3 shows the equivalent figures for successful and unsuccessful robberiescombined; again the falls differ significantly from one another (Chi-squared = 16,df 8; p <.05). The step-by-step interpretations of the pattern of successes andfailures shown by the various methods of attack are complicated. They are there-fore set out in Appendix 2, where ‘preventive gains’ and ‘preventive losses’ foreach individual method of attack are estimated relative to the internal backgroundfall, in a manner similar to that employed in calculating the internal lowerestimate of the impact of the security initiative on all methods combined.
As shown with a large degree of uncertainty in Appendix 2, the Post Office’ssecurity initiative appears to have succeeded in reducing considerably both thephysical attacks on the screen, and the attacks which take advantage of insecuritiessuch as open doors or hatches. In both cases, the reduction was achieved througha drop in the number of successful raids and not through a drop in failures,
13

Table 3: Yearly rates of successful and unsuccessful attacks on sub-post offices inLondon Postal Region, by method and phase
Note 1) The phases are of unequal length: pre-rise = 20 months; rise= 10 months; peak = 10 months; decline = 25 months; final= 22 months.
2) The absolute number of attacks during the relevant phase is listed insquare brackets.
3) Based on these absolute numbers (last 3 phases only) Chi-squared= 16, df 8; p <.05.
ie raids aborted by the robbers. To be set against this, robbers turned to othermethods of attack, mainly to simple firearm threats at the screen, but also to amiscellany of others. Fortunately all these methods had their drawbacks as far asthe offender was concerned, for altogether twice as many of the ‘extra’ incidentsusing these methods were failures than successes.
If the improvement of physical and procedural security had been responsible forthe falls in the physical attacks and the ‘insecure’ method, one might haveexpected to see a marked drop in the proportion of these incidents which weresuccessful. A greater proportion of physical attacks should have ended in failurefor example as the sledgehammers bounced off the now strengthened screens. (3)
Table 4 presents the absolute proportion successful of each method of attack,over the five phases. It shows that the expected drops in the proportion successfuldid occur, but only to a modest degree. The proportion of physical attackssuccessful, for example, fell from 0.65 at the peak to 0.47 at the final phase. (4)
(3) The proportions discussed here are the absolute proportions. The figures used in Appendix 2 in discussingsuccess and failure by method of attack are relative to the background fall.
(4) If the level in the pre-rise phase (0.36) is taken as base instead of the peak level, there appears to have beenin increase in the proportion of physical attacks successful. It is felt that this can be discounted, because it isreasonable to assume some discontinuity in the proportion successful with the arrival in the rise and peak phasesof a new wave of offending, possibly committed by a new wave of offenders.
14

There are three explanations for this rather modest effect, which may be operatingin concert. First, robbers do not always burst into sub-post offices with weaponsor sledgehammers to the fore. Sometimes they enter with the intention ofoffending but pose as bona-fide customers until a suitable moment (some actuallyqueue up as normal before declaring their hand). If some of those enteringcovertly are put off by the sight of the upgraded screens or improved securityprocedures, a number of ‘failures’ will thus go unrecorded. This will tend toreduce the number of failures in step with the fall in the number successful, andso mask the expected decrease in the proportion successful. The same goes forthe second explanation, which stems from the nature of displacement once anattack has begun. After an initial setback when robbers find they cannot smashthe screen or open the door or parcel hatch, sometimes, instead of admittingfailure, the robbers turn there and then to the firearm threat at the screen andto a lesser extent, to a miscellany of other methods. The descriptions of theincidents show that a high proportion of robbers physically attacking the screencarried guns anyway; tactically, in some cases the shift to firearm threat at thescreen involved the robber in little more than reversing his shotgun from buttfirst (when being used as a hammer) to barrel first. The third explanation issimply that the security initiative had its effect less through a direct impact onthe difficulty of making attacks than through the broad deterrent effect discussedearlier. This explanation is consistent with the large disparity between the externaland internal lower estimates of the preventive effect of the security initiative: thesmaller size of the internal estimate may partly be due to its inability to registerthe deterrent effect, as discussed above (page 11).
Table 4: Proportion of attacks successful, by phase and method of attack
The role of firearms within sub-post offices
It remains to explain why the robbers’ decision to turn to ‘firearm’ (and ‘miscel-laneous’) methods more frequently results in failure than success. It is worthexploring this in some detail, as the robbers’ displacement to the use of firearmsin particular is seen as a general threat to the effectiveness of situational meansof preventing robbery. Where the robbers’ decision to switch methods may be
15

made on the spur of the moment, as an attempt to salvage something fromthe debacle, this ‘instant displacement’ gives no time for planning and rehearsal.Even if robbers have decided in advance to make a firearm threat the centrepieceof their attempt, a naive faith in the weapon may prevent them from adequatelypreparing for the raid, or encourage otherwise nervous or unskilled people tomake the attempt. Whatever the case, relative to the other methods of attackfirearms threats at the screen have a consistently high failure rate. As Table 4shows, more than twice as many firearms threats at the screen fail as succeed.(5)
The presence of firearms might be expected to increase the likelihood of successof any method of robbing sub-post offices. However, looking at the methods ofattack other than firearms threat at the screen (where firearms are always presentby definition), we see that the presence or absence of a gun made no differenceto the success rate. Taken together, these findings suggest that the gun is notalways the ‘equaliser’ it is supposed to be. This runs contrary to some Americanfindings for example by Skogan (1978). Conklin (1972) suggests however thatrobbers not using firearms actually bring their threats up to a similar level ofintimidation to that so conveniently achieved with a gun, by deliberately pushing,shoving and shouting at victims. This would tend to mask the inherent advantageof firearms. Another factor possibly contributing to the present findings is thata number of the weapons used in sub-post offices were replicas, in some casesobvious ones. (6)
Unfortunately it was not possible to compare the effect of the presence of gunsin sub-post offices with the effect in, say, building society offices or banks, soone cannot say whether sub-post offices are unique in showing no effect of thepresence of guns on the success rate of attacks. However, on a broader level,national figures for armed raids in 1985 (Working Group on Commercial Robbery,1986) show that raids on sub-post offices have a significantly higher failure rate(54%) than raids on high street banks (23%) and building societies (24%) (Chi-squared = 65, df 2; p < 0.001). The very small number of raids on crown postoffices (failing on 42% of occasions) are rather more like the sub-post offices.
Several factors may explain this pattern. One may be the sub-postmasters andmistresses themselves. They may often be entrepreneurial, ‘have a go’ individualswith a personal stake in their shop, and a personal commitment to the Post Office.As such their response to a gun waved from the other side of the anti-banditscreen may be one of stubborn resistance, where they bravely call the bluff ofwhat could be an ill-prepared robber on a knife edge between pressing home hisattack or fleeing. In displaying such resistance they may be demonstratingconsiderable confidence in the efficacy of the screen against attack (a factor also
(5) Chi-squared on the total of each method of attack, combining all three phases, iS 110, df 4; p = .001. Mostof the chi-squared value comes from the firearms method.
(6) The results of attacks on Post Office staff delivering money are however consistent with conventional wisdom:those involving firearms are half as likely again to be successful.
16

important in the reaction of building society staff to robberies – cf. Austin, inpreparation) and in the consequences of sounding the audible bandit alarm.These alarms are fitted behind all counters and are considered by the Post OfficeInvestigation Department to be a primary reason why so many attacks areunsuccessful. In the London area during the two-year period 1985 and 1986 thealarm was sounded on 150 occasions during an attack and on only 11 occasionswas the attack continued; in all other cases the robbers immediately fled empty-handed. There is no evidence that activating the alarm has placed the staff inany danger.
A second factor may be the robbers themselves – those who choose to raidsub-post offices may be particularly inept individuals, whose reliance on guns isall the greater, and who may mistakenly believe that sub-post offices are easytargets. Indeed the apparent success of the audible bandit alarm could suggestthat the robbers are often nervous and inexperienced individuals rather than‘professional villains’.
In conclusion, what is happening within London sub-post offices seems to bethat there is a general fall in robberies, some of which is due perhaps to policeaction against offenders. Relative to this background fall, the security initiative
Figure 6 Schematic interpretation of the impact of the Post Office security initiative
17

has blocked methods of attack which in the past were successful, and in doingso has encouraged offenders to direct their efforts to methods that are morelikely to fail. In many respects this can be considered a gain for the Post Office.However, one consequence of the displacement may be that the robbers arefollowing the maxim of ‘if at first you don’t succeed…’, and generating an excessof failures (an excess that, on the basis of the internal lower estimate of thebackground effect, more than wipes out the number of successes prevented). Avisual impression of this pattern is presented in Figure 6. A related process – anincrease in attempts masking a tailing-off in the growth of successful offences –may have occurred in domestic burglaries as measured by the British CrimeSurvey (Hough and Mo, 1986).
Are sub-post office staff worse off in real terms?
The reduction in successful attacks is a notable achievement; there are groundstoo for believing that the Post Office initiative has not worsened the plight of thestaff in exposing them to more failed attacks, or by encouraging offenders tocarry guns. The vast majority of failed attacks, in the experience of Post OfficeInvestigation staff, are over in far less than a minute and normally with no injuries.When the staff are able to feel that they have contributed to the ‘defeat’ of therobber, they gain confidence in the security procedures and facilities, and enjoyheightened morale both of which are likely to significantly offset any trauma.
On firearms, while the use of guns across all methods of attack seems to haveincreased steadily in recent years, the security initiative cannot be held fullyresponsible because the trend seems to have begun well before the programmestarted (Figure 7). Moreover, the shift to the firearm threat at the screen has notinvolved the ‘conventional’ image of displacement where target hardening ofthe screen leads robbers to go off and return with a gun. In two-thirds of thephysical attacks on the screen robbers were carrying guns anyway. What hashappened instead seems more like a restriction on the tactical alternatives opento the robbers than the addition of a new and more deadly resource: ratherthan fetching a gun as a response to the improved screen, they have abandonedtheir sledgehammers and have been forced to fall back on the gun that many ofthem were carrying as a second line of offence.
The threat of lethal force associated with firearms in the majority of raidscontrasts markedly with the actual rate of injury. The proportion of robberies atsub-post offices that result in any kind of injury is very low. In the fiscal year1985-6, 90% of robbery incidents passed without any injury (whether success orfailure making little difference), 7% involved slight injury and 3% serious. Con-sistent with American research (Cook, 1982), robberies where guns are used areless likely than those involving other types of threat or force to injure: 94%of incidents with guns involved no injury compared with only 73% of incidentswithout guns (the whole pattern being statistically significant with Chi-squared= 10.65, df 2; p < .005). Moreover, injuries that did occur in gun incidents were
18

Figure 7 Proportion of robbery incidents within sub-post offices where firearmswere involved, by quarter
far more likely to result from pushes or blows than from gunshot. In explanation,MacDonald (1975) suggests that when robbers use strong-arm methods alone (iereliance on sheer physical strength and surprise, sometimes supplemented by ablunt instrument) the victims are more likely to ‘have a go’, and then get hurt. (7)
(7) Conklin (1972) studying a sample of robberies in Boston discusses the complex and interrelated issues ofvictim resistance, the level of intimidation offenders need to supplement the threat from their principal weaponand their unwillingness to step over the high threshold of actually using the weapon to wound.
19

On balance, it seems that as a result of the preventive initiative sub-post officestaff may be very little worse off in terms of any trauma from the extra numberof robbery attempts that fail. While firearms threats have tended to become thecentrepiece of the robbers’ technique they were likely to be present anyway –hence the staff are no worse off in terms of the probability of weapons beingproduced in any one incident, and the probability of injury per incident. However,American statistics suggest that on the rare occasion that a gun is fired atsomeone, the risks alter dramatically: Cook (1982) shows that fatal injuries arefive times as likely with the use of guns (9 fatalities per thousand gun robberiescompared with 1.7 fatal injuries per thousand non-gun robberies).
Displacement from sub-post offices to other Post Office targets
There remains the possibility that robbers, frustrated within the sub-post office,will turn their attention to other, less well-defended targets. The closest alterna-tive target, as far as the Post Office is concerned, is the daily delivery of cash andother valuables to sub-post offices by official mail vehicles. Robbers generallylie in wait for the van and spring out on the PO staff as they are carrying thevaluables across the pavement to the sub-office.
Figure 2 (page 3) shows that whilst the within-sub-post office robberies declined,delivery raids rose; they reached 42 per year in the final phase, of which 32 weresuccessful. (8)
The key question here is, was the increase in the delivery raids a result of thesecurity initiative or was it coincidental? There are two reasons for believing itto be at least partly coincidental.
First, the rise in delivery raids was not confined to the Post Office. In Figure 2,the MPD raids on cash-in-transit show a similar increase. It is possible that theimpetus for growth in robberies in the Post Office and elsewhere has come asmuch from ‘pull’ as ‘push’ – that is, as much from robbers themselves beingattracted away to richer pickings, as from robbers being thwarted in their attackson premises such as sub-post offices. There are indications from the plots of bothsub-post office delivery raids and MPD cash-in-transit robberies that the rise inboth types of offence began before the Post Office’s security initiative.
Second, Post Office Investigation Department officials believe that the offendersconducting delivery raids are in part a different set of individuals or gangs fromthose involved in the within-sub-post office robberies: the former, whilst moreoften successful and involving larger sums of money (Working Group onCommercial Robbery, 1986), require much more planning and accurately timed
(8) For successful robberies within sub-post offices, this more than neutralises the estimate of the preventive gainbased upon the ‘internal background fall’; for successes and failures combined, it drives the net figure further intoloss. The result is not so discouraging for the external lower estimate, where the net saving is 55 (87 minus 32)successful robberies per year, and 116 (158 minus 42) successes and failures combined.
20

execution. While some offenders progress from sub-post office raids to deliveryraids this is seen as more a case of ‘career development’ – in terms of greaterreturns from greater investment in planning and skill – than of displacementfrom a favoured target. While the security initiative may have forced somerobbers to progress in this way, it is equally likely to have caused others, withless ability to shift to the more demanding and sophisticated delivery raids, todropout. Unfortunately it was not possible to study offender records to settlethe issue.
Displacement beyond the Post Office
Another question is whether or not the community as a whole has gained fromthe Post Office security initiative: will the frustrated sub-post office robberssimply move on to attack other targets? The answer will turn on the extentto which robbers fit the stereotype of the determined professional who, it isassumed, will relentlessly seek out other targets if baulked in his current choice.Little research has been done in this area though Conklin (1972) and Walsh(1986) find they can divide commercial robbers into planners (or professionals)and opportunists. From the Post Office data, the accounts of the incidents studiedsuggest that many of the robberies were clumsily executed and frequently endedin farce, with quite a number of the robbers, despite their guns, being easilydeposed from their initial command of the situation (one, for example, whowaved a gun at a sub-postmaster behind the screen and demanded money, fledon being informed that the Post Office section of the shop was closed; anotherran off when the handle to the safe came off in his grasp). Such robbers may turnto other targets, like building societies, but as each successive opportunity forrobbery is first discovered by the robbers and then made more secure by itsdefenders, the longer-term trend is one in which the risk-and-effort-to-rewardratio of all society’s opportunities for robbery slowly but inexorably increases,and a progressively higher proportion of robbers choose to drop out entirelyrather than try to increase their level of organisation, skill and firepower. Thismay be a slow and haphazard process, and there may be some advantage to thecommunity of handlers of commercial sums of cash – banks, building societies,the Post Office, and security delivery firms – if they sought to coordinate securitymeasures, rather than in effect seeking simply to ‘pass the parcel’ by displacingrobbers to other organisations, and hoping none will be displaced onto them intheir turn. Such a coordinated approach has been recommended in the recentreport by the Home Office Standing Conference Working Group on CommercialRobbery (Home Office, 1986).
Cost effectiveness
Assessing the cost effectiveness of the screen upgrading programme is not easy,as some of the more important benefits are imponderable or intangible. Takingthe tangible ones first, on the cost side, the security initiative amounted to£2.2 millions of which about £1.4 millions was spent on improvements to the
21
screens themselves. on the benefit side, one can calculate financial savings fromthe average haul in a successful robbery during the decline and final phases, andestimates of the number of robberies prevented. With the external lower estimate,the scheme has already paid for itself and is yielding a handsome return oninvestment of approximately 50% at current robbery rates. With the internal lowerestimate, about a seventh of the initial cost has been recouped; the schemeappears to break even only after some 20 years. On the basis of the upper estimateof the preventive effect, the scheme is yielding a 65% return on investment atcurrent robbery rates. With all of these estimates it is assumed, probably un-realistically, that a) the number of robberies prevented in each year from nowonwards will remain constant and b) the increase in the more lucrative deliveryraids was a wholly incidental development rather than a consequence of theupgrading programme. Despite the latter qualification, it is judged reasonableto evaluate the sub-post office initiative on its own terms, as the existence ofvulnerabilities within the cash-in-transit area does not seem good grounds forfailing to attend to the vulnerabilities in premises which handle cash.
Imponderable and intangible costs include a move towards more direct useof firearm threats at the screen. While making threats with a firearm is amore serious matter as far as the courts are concerned, as the earlier discussionsuggested, the likelihood of injury to those threatened is actually less; and it islikely that the guns would have been present anyway, although not playingsuch a central role in the robbery incident. With fewer robberies (and fewerstill successful ones) the trauma to the victims will have been reduced. In thelonger term, a poorer reward-to-risk ratio for the robbers may discourage themfrom robbing post offices again. This would bring with it decreased risk forsub-post office staff and their customers and may make the difference betweena particularly victimised branch remaining open, or closing with consequentloss of amenity, revenue and employment. Finally, taking the broadest view ofthe initiative, it is perfectly possible – but completely unknowable – that had thePost Office not moved into check the robbery wave (and had the police not alsoacted), the level would have continued to grow as more and more robbersmoved in to exploit the continuing weaknesses in the security of sub-post offices.The fact that the current level of robbery is still higher than the pre-peak levelhas to be seen in this light: it is not a sign of failure but of a wave of offendingcountered and brought under control.
Next moves for the Post Office
The Post Office has already taken steps to introduce similar security measures inother parts of the UK. Following detailed analysis of incidents in the provincesthe security measures at some 2,400 sub-post offices, out of a total of 18,000,have been upgraded. These provincial offices were selected because of theirlocation and vulnerability to attack.
A degree of control of the current problem should not lead to complacencyhowever. The robbery scene is always changing as robbers and defenders
22

continually shift ground, and technological developments give one or the otherside momentary advantage. In the case of sub-post offices, there is always thepossibility that the current drop in robberies is no more than a ‘holding period’while robbers cast about for more effective tactics or lie low as a result of thebroad deterrent effect of the security initiative. The more skilled and determinedrobbers seem currently to be favouring delivery raids; once the Post Office (andother agencies) has made these less vulnerable in their turn, some of the ‘hardermen’ may return to the sub-post offices, perhaps to exploit the hostage-takingmethod. The Post Office, like other cash-handling agencies and indeed the police,will always be somewhat behind the developments in robbery methods, as theinitiative here lies with the robbers, and it takes time both to reliably detect theemergence of a new pattern and then to devise and implement a response.However, the lag before an intelligently targeted response is made can be greatlyreduced by the Post Office’s use of crime analysis on a routine basis; computeri-sation of robbery incident records would make this still faster and easier.
Final Points
It is uncertain how far the results of this evaluation can be generalised to othersites to be protected from robbery, such as building societies or banks, whereattacks have a much lower failure rate. But in principle it seems reasonable toconclude that robbery can be reduced by a blend of target-hardening strategiesand improvements in security procedures appropriate to the particular sites tobe protected, and their particular vulnerabilities. It is also apparent that changingthe situation in which the offence is committed will differentially affect the variousmethods of offending. This must be taken into account when information oncrimes is analysed to suggest preventive measures which might be taken, andwhen the impact of those measures is evaluated. While some displacement ofattacks to other methods and other targets is likely, at least in the short term, itis not inevitable, and as has been seen does not guarantee the robbers success.
This study has illustrated the evaluation of a crime prevention initiative as anexploratory process, with a sequence of questions to be answered as best onecan by drawing on whatever data is available and dealing with obstacles andambiguities. During this process one attempts to make numerical estimates ofchanges and to keep track of uncertainty. In doing so one must strike a sensiblebalance between attending to the uncertainty that comes from statistical sources,versus that which originates elsewhere, such as the difficulty of apportioningresponsibility between the various possible causes of the fall in crime levels. It isfeasible to cope with a fairly wide latitude of uncertainty, as this study has done,although this is not a soft option for the evaluator (nor for the managers who willuse the results) – it needs a professional input and the application of reasonedjudgement to arrive at the most plausible answer, rather than the following of asimple recipe. But as the weary reader may acknowledge, it is even better toreduce uncertainty by using an experimental design rather than a retrospectiveevaluation.
23

Appendix 1
Choice of indicators of the background fall and calculation of the estimates of thefall in robberies due to the security initiative
As the main text explains, in estimating the proportion of the total fall in robberiesthat can be accredited to the security initiative, two lower figures and an upperone will be derived. The two lower figures are calculated on the basis of twodifferent indicators of the background fall, an external indicator and an internalone. The first section of this appendix describes the grounds for choosing theseindicators. The second section presents the actual calculations for all the estimates,in which the background falls are subtracted from the total fall in robbery rates.
Choice of indicators for the background fall
a) The external indicator for the background fall
The external background indicator chosen is derived from the level of robberiesof business premises in the Metropolitan Police District of London. (Bycomparison very few business robberies occurred in the City of London sothese were not included.) Because the MPD figures included the sub-post officefigures, the indicator was produced by subtracting these from the correspondingmonthly totals obtained from the Metropolitan Police. The plots of the externalbackground indicator and the sub-post office robberies are compared in FigureA1.1.
As Figure A1.1 shows, the other business robberies behave in a broadlysimilar way to the sub-post office raids, suggesting that some of the fall in therate of the latter was indeed due to background changes that affected all robberiesin the London region. The MPD figures do not provide an ideal indicator, as theycould have been the province of different sets of criminals (eg bank raiders,factory wage robbers) and could have excited different levels of response on thepart of the police. In addition, the MPD area is somewhat smaller than theLondon Postal Region, which stretches, for example, as far as St Albans. Forthese reasons it is helpful to have the other perspective on background changeswhich is very much closer geographically, and situationally, to the sub-postoffices themselves.
b) The internal indicator for the background fall
Out of all the methods used to attack sub-post offices, it is possible to identifythe one which is least likely to have been affected by the security initiative. Thefall in the rate of this method of robbery can then be used as the second indicatorof the background fall.
The most appropriate internal indicator of the background fall is the robberymethod of threats to staff and customers outside the secure area. Logically it
24

cannot be directly affected by a physical improvement in the secure area itself:however good the anti-bandit screen, there will always be vulnerable peopleoutside it, whether staff serving in the non-post office part of the shop, orcustomers awaiting service. Nor are attacks outside the secure area very likelyto be reduced by a general tightening of security practice, as the staff cannotavoid spending time there, and the customers will frequently be present.
Like its external counterpart, the internal background indicator is not perfect;but the consequent errors in the estimates it produces are different. It excludesfrom the estimate any broad deterrent effect on robbers caused by their suspicion
25

that ‘something has been done’ to boost security in sub-post offices (factor c inthe main text, page 8). Such deterrence could be expected to influence theindicator method to the same degree as the other robbery methods. It willtherefore underestimate the preventive effect of the security initiative; more sothan the external background indicator. The estimate could also be affected ifrobbers change from making physical attacks on the screen to employing theindicator method itself. The present evaluation assumes that this is of minimalsignificance as quite a change in technique is required (and as will be seen, therobbers have another method of attack to which they turn – the firearms threatat the screen – which is sufficiently similar to the physical attack as to beconsidered no more than a tactical shift). Consistent with this, the proportion ofrobberies using the indicator method remains virtually unaltered at about 30%from the robbery peak to the present time, while the other methods swell orshrink markedly.
Calculating the various estimates
Calculating the estimate of the fall due to the security initiative first requires theestablishment of precise figures for the peak and the final robbery rates, so thatthe one can be compared with the other to yield the total fall. Second, it involvesderiving the alternative values for the background fall; and third, subtractingeach of these figures from the total fall. Figure 5 (main text, page 9) gives anoverview of the process and the principal equations involved. Before movingon to the calculations themselves, three further points are in order. The calcula-tions are done to one decimal place and rounded, which makes several of theadditions and subtractions apparently one unit out. The fact that exact figuresare necessarily used in the calculations should not be taken to imply a similarlevel of accuracy in the estimates, because the various sources of uncertainty aretoo great; besides the calculations themselves each stage involves an elementof judgement.
a) Establishing appropriate values for peak and final robbery rates
The establishment of peak and final rates must be done in the face of conflictingconstraints. On the one hand the figures derived must be sensitive to the realchanges in robbery rates, whilst on the other they must try to minimise thestatistical uncertainty due to random fluctuation. (This is akin to the problem oftrying to get better performance out of a radio: if one increases the sensitivityof the receiver one does obtain a stronger signal from the transmissions, but theinevitable penalty is a matching increase in random background ‘noise’.) Theproblem is particularly acute for the peak rate, because the peak seems to be sosharp and short-lived. The shorter the time period over which the peak figureis calculated, the more likely it is that it partly owes its high value to randomfluctuation. It would thus be a less reliable figure, statistically speaking, and onewould be open to criticism for ‘fishing’ for the highest point in the plot withwhich to get the most impressive estimate for the fall. Calculating the peak overa longer time period would improve the reliability of the figure, but would
26
significantly reduce the sensitivity of the estimation procedure – and in sodoing flatten the appearance of the plot and reduce the peak value to anunrepresentative level. Because the value of the total fall would consequentlybe reduced, all the estimates of the effect of the security initiative would betoo conservative.
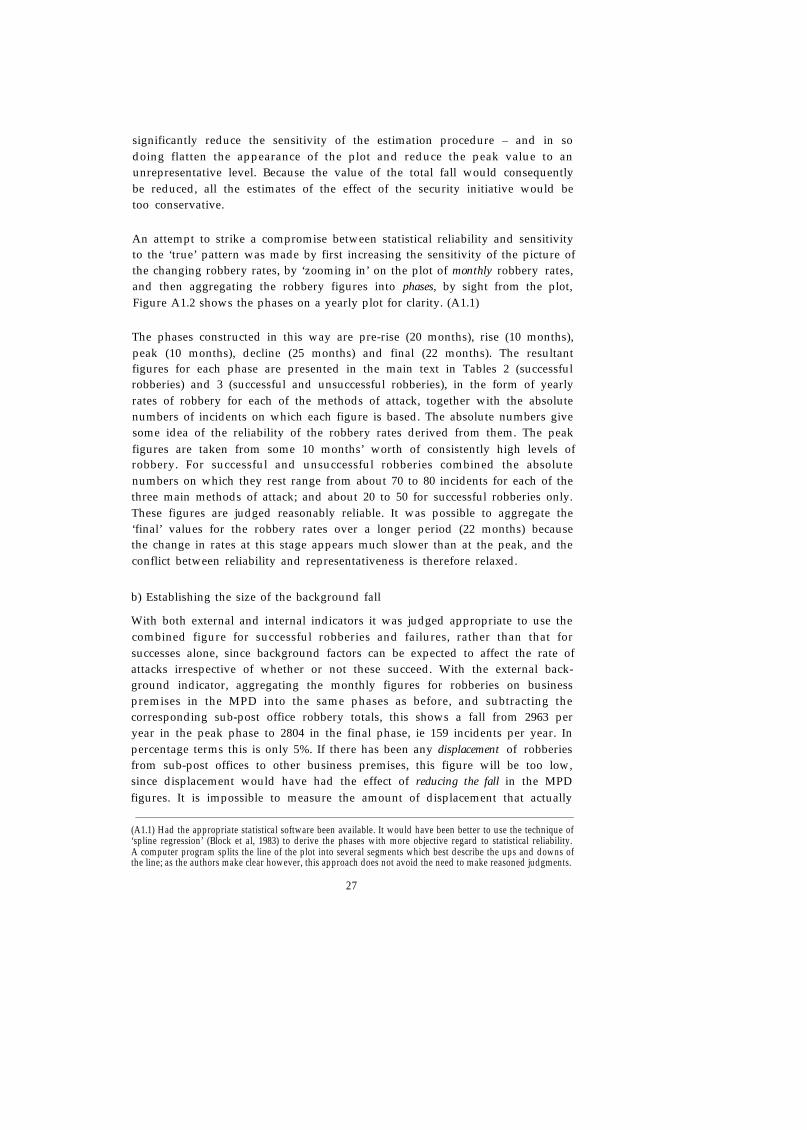
An attempt to strike a compromise between statistical reliability and sensitivityto the ‘true’ pattern was made by first increasing the sensitivity of the picture ofthe changing robbery rates, by ‘zooming in’ on the plot of monthly robbery rates,and then aggregating the robbery figures into phases, by sight from the plot,Figure A1.2 shows the phases on a yearly plot for clarity. (A1.1)
The phases constructed in this way are pre-rise (20 months), rise (10 months),peak (10 months), decline (25 months) and final (22 months). The resultantfigures for each phase are presented in the main text in Tables 2 (successfulrobberies) and 3 (successful and unsuccessful robberies), in the form of yearlyrates of robbery for each of the methods of attack, together with the absolutenumbers of incidents on which each figure is based. The absolute numbers givesome idea of the reliability of the robbery rates derived from them. The peakfigures are taken from some 10 months’ worth of consistently high levels ofrobbery. For successful and unsuccessful robberies combined the absolutenumbers on which they rest range from about 70 to 80 incidents for each of thethree main methods of attack; and about 20 to 50 for successful robberies only.These figures are judged reasonably reliable. It was possible to aggregate the‘final’ values for the robbery rates over a longer period (22 months) becausethe change in rates at this stage appears much slower than at the peak, and theconflict between reliability and representativeness is therefore relaxed.
b) Establishing the size of the background fall
With both external and internal indicators it was judged appropriate to use thecombined figure for successful robberies and failures, rather than that forsuccesses alone, since background factors can be expected to affect the rate ofattacks irrespective of whether or not these succeed. With the external back-ground indicator, aggregating the monthly figures for robberies on businesspremises in the MPD into the same phases as before, and subtracting thecorresponding sub-post office robbery totals, this shows a fall from 2963 peryear in the peak phase to 2804 in the final phase, ie 159 incidents per year. Inpercentage terms this is only 5%. If there has been any displacement of robberiesfrom sub-post offices to other business premises, this figure will be too low,since displacement would have had the effect of reducing the fall in the MPDfigures. It is impossible to measure the amount of displacement that actually
(A1.1) Had the appropriate statistical software been available. It would have been better to use the technique of‘spline regression’ (Block et al, 1983) to derive the phases with more objective regard to statistical reliability.A computer program splits the line of the plot into several segments which best describe the ups and downs ofthe line; as the authors make clear however, this approach does not avoid the need to make reasoned judgments.
27

Figure A1.2 Number of successful and unsuccessfulrobbery incidents by year, withphases superimposed
occurred, but assuming, conservatively, that the maximum possible happened,an adjusted estimate of the external background fall can be made. The maximumpossible displacement simply equals the total fall in the rate of sub-post officerobberies from peak to final phase – in other words, all the robberies that wouldhave been committed in sub-post offices are now committed at other premisesin the region. Subtracting this figure (198 per year) from the final level of theexternal background indicator gives a revised final level of 2606. Subtracting
28

this in turn from the peak rate of 2963 gives a fall of 357 or 12%. This figure willbe used as the external background fall.
The fall shown by the internal background indicator (attacks outside the securearea) was 62% for successful and unsuccessful attacks combined. This is takenas the internal background fall. This is a substantially larger background fallthan that derived from the external background indicator – a finding consistentwith the observation above (page 11) that using the internal background indicatormay give insufficient credit for the fall to the security initiative.
c) Estimating the fall in successful robberies due to the security initiative
c.1) Successful robberies
The figures for successful robberies are taken from Table 2, main text.
c.1.1) External lower estimate
If the original 168 attacks had fallen by the same degree as the external back-ground indicator – 12% – they would only have fallen by 20 per year. This is theexternal background fall, and subtracting it from the total fall of 107 yields a falldue to the security initiative of 87 robberies per year. This is the external lowerestimate. There are several ways of presenting the results for purposes ofcomparison, but it is judged closest to the ‘spirit’ of crime prevention if the fallattributable to the security initiative is converted to a proportion of the robberylevel that would have been expected in the final phase if the security initiativehad not occurred (see Figure 5, main text, page 9). The expected level can beregarded as the robbery rate which would have been observed if the backgroundfactors had operated alone. The final level expected if the background effect hadoperated alone equals (168 – 20 or) 148. As a proportion of this expected level,the fall due to the security initiative is 59%.
c.1.2) Internal lower estimate
In calculating the internal lower estimate a similar approach is used, with a slightvariation introduced because the internal background indicator originates as therate of one of the methods of robbing sub-post offices. As such it has beendefined out of consideration in estimating the total fall. One can therefore onlybase the total fall on the robberies which were committed by the other methodsof attack (that is methods 1, 2, 3 and 5 in the main text, page 4). Together theserobberies fell from 109 per year to 34, a fall of 75. The internal background fallwas earlier estimated to be 62%, and if the other methods of attack had fallen bythis degree they would only have fallen by 68 per year. The difference betweenthe total fall and the background fall is 7. The internal lower estimate of the effectof the security initiative is thus 7 successful robberies prevented in each year.In converting the estimate of the preventive effect to percentage terms, theexpected final level must now include the robberies committed using the indicatormethod, for comparability with the other estimates. The expected final level was
29

68 per year (27 from the indicator method (outside secure area) + 41 otherrobberies); as a proportion of this, the preventive effect was 10%.
c.1.3) Upper estimate
The number of robberies was 168 per year in the peak phase, which fell to 61in the final phase. The total fall therefore amounts to 107 robberies per year. Thisfigure also provides the upper estimate of the fall due to the security initiativebecause it was assumed here that there were no background changes. For thesame reason, the expected level in the final phase was the same as the peak level,namely 168 incidents per year. As a proportion of this expected level, the falldue to the security initiative (107) was 64%.
In sum, the external lower estimate for successful robberies prevented by thesecurity initiative in each year of the final phase is 59% (87 robberies); theinternal lower estimate is 10% (7 robberies); and the upper estimate is 64% (107robberies).
c.2) Successful and unsuccessful robberies combined
The three estimates for successful and unsuccessful robberies combined arearrived at by identical means to their successful counterparts above. The relevantfigures on which the estimates are based are presented in Table 3, main text.
c.2.1) External lower estimate
If the original 331 attacks had fallen by the same degree as the external back-ground indicator – 12% – they would only have fallen by 40 per year. Thedifference between this background fall and the total fall of 198 is 158. Theexternal lower estimate of the effect of the security initiative is thus 158 successfulrobberies prevented in each recent year. As a proportion of the expected finallevel of successful robberies (331 – 40 or) 291, the fall is 54%.
c.2.2) Internal lower estimate
With successes and failures combined from robbery methods 1, 2, 3 and 5, therobbery rate declined from 230 incidents per year to 95, a fail of 135, which isslightly smaller than the internal background fall of 143.
Thus in the final phase although robberies fell, there were still 8 more per yearthan would have been expected. With the internal lower estimate, therefore, thereis no preventive effect; indeed, the level of robbery incidents is 6% more thanexpected.
c.2.3) Upper estimate
The total number of incidents per year in the peak phase was 331, which fell to134 in the final phase, The upper estimate is a fall of 198 per year, or a preventiveeffect of 62%.
30

In sum, the upper estimate for successful and unsuccessful robberies preventedby the security initiative in each year of the final phase is 62% (198 robberies);the external lower estimate is 54% (158 robberies); but the internal lower estimateis 6% (8 robberies) greater than expected on the basis of the background fall.
31

Appendix 2
Interpreting the pattern of falls shown by the various methods of attack
The aim of the exercise is to interpret the pattern of falls shown by the differentmethods of attack, for successes and for failures. The key figures are the‘preventive gains and losses’ similar to those referred to in the main text.Preventive gains and losses are calculated from the difference between a) theactual fall from peak to final phases shown by a given set of robberies, and b) thefall expected if the background factors had operated alone. A preventive gainmeans that the robbery rate has been reduced in relation to the background fall,and that the security initiative has left the Post Office better off than it wouldotherwise have been; a preventive loss, although sounding rather strange, meansthat the robbery rate has increased in relation to the background fall, and thatthe security initiative seems to have left the Post Office actually worse off thanit would otherwise have been. The magnitude of the background fall meansthough that the PO is almost never worse off in absolute terms.
To calculate the expected fall, the internal background indicator – customers orstaff attacked outside the secure area – is used in preference to the externalbackground indicator. It is situationally very close to the other methods of robberyin sub-post offices (and therefore more sensitive to influences on sub-post officesin particular) and its frequency relative to the other methods remains quitestable throughout the study period. The likelihood that the internal backgroundindicator fails to register any broad deterrent effect of the security initiative(see Appendix 1), now becomes an advantage as it highlights the distinctionsbetween the changes in the rates of the various robbery methods rather than achange which may be common to them all.
In seeking to interpret the pattern of preventive gains and losses obtained, theapproach used is to begin with relatively global sets of gains and losses – forexample, the gain shown by all successful incidents (for all methods of attack)– and to split them into progressively smaller subsets representing, for example,the gain shown by physical attacks on the screen plus attacks on insecure doorsand hatches, that end in success. The decision to split the gains and losses oneway rather than another was made with the aim of highlighting similarities anddifferences between particular subsets of robberies. (The attacks outside thesecure area are omitted in all cases since they constitute, as said, the internalbackground indicator, and provide the ‘expected background fall’ as a referencelevel.)
The process of splitting is illustrated in Figure A2.1, where preventive gains andlosses are shown with reference to a ‘break even’ point. This point represents astate of affairs where the robberies in question fell by exactly the same degreeas expected on the basis of the background fall; above it, in a box, are preventivegains (denoted with a ‘+’ sign); below it are preventive losses (denoted with a
32

‘–’ sign). The numbers in each box are small, but they are difference scores,not absolute robbery rates; moreover, the numbers on which they are based arefairly large, because the annual rates used in comparison have been compressedfrom the numbers of robberies occurring in the 22 months of the final phase.The values of the actual numbers of incidents occurring in the final phase areshown in the boxes in brackets, and some of them appear also in Tables 2 and 3.
Figure A2.1 Preventive gains and losses
The splitting process
Step 1
The grand total number of successful robberies prevented per year, orpreventive gain, is estimated at 7. When failures are examined, however, thePost Office is worse off by 15 incidents per year.
33

Step 2
Successes and failures combined result in a net preventive loss of 8 incidentsper year.
Step 3
Splitting successes and failures combined, by method of attack, the methodswhich show reductions in crime are the physical attacks on the screen(method 1) and the attacks via insecure doors and hatches (method 3).Together these add up to a preventive gain of 14. The preventive losses onthe other hand derive from methods 2 and 5: firearm threats at the screenand miscellaneous means of attack. together these add up to 22. This figureprobably represents the side-effect of the security initiative, with the robbersdisplacing their methods by turning away from physical attacks on screensand exploitation of insecure doors and hatches in favour of using firearmthreats and a miscellany of other strategies. Displacement normally serves toreduce or at most neutralise any direct preventive gains. In the present case,however, it appears that the security initiative had an ‘excess’ displacementeffect that increased the number of robbery incidents to such a degree thatthe net outcome was a preventive loss of 8 – that is, there were 8 more robberyincidents occurring than expected. To explore this more fully, the final stepsin the splitting process involve looking separately at successes and failures bymethod.
Step 4
With the two methods that demonstrate a net preventive gain, most of thisgain comes from a reduction in successful incidents, and little or none froma reduction in failures. Taking together the two methods that demonstrate thenet loss, however, while there are quite a few (8) more successful incidentsoccurring than expected for these methods, about twice as many of the extralosses (15) stem from the failures.
Step 5
Looking separately at the two methods that show the loss, for the firearmsthreats at the screen, there are somewhat more excess failures ( 10) than excesssuccesses (7); but for the ‘miscellaneous’ methods of attack, there are manymore excess failures (5) than successes (1).
An interpretation of this pattern is that the overall preventive loss observed insub-post office robberies when successes and failures are taken together, resultsfrom a displacement from physical attacks at the screen and attacks exploitinginsecure doors and hatches, in favour of firearm threats at the screen and amiscellany of other strategies. The displacement, moreover, has been fromsuccessful attacks by the first two methods, to failures by the second two. It isplausible that the excess displacement of failures results from the robbers’ desireto ‘try, try and try again’.
34

References
Austin, C. (in preparation). The Prevention of Robbery at Building Society Branches.London: Home Office.
Block, C. and Miller, L. with the assistance of Hudson, D. (1983). Manual for thePattern Description of Time Series. Part I. Guide to Pattern Description. IllinoisCriminal Justice Information Authority.
Conklin, J. (1972). Robbery and the Criminal Justice System. Philadelphia:Lippincott.
Cook, P. (1982). ‘The role of firearms in violent crime – an interpretive reviewof the literature’ in M. Wolfgang and N. Weiner (Eds.) Criminal Violence. London:Sage.
Home Office (1986). Standing Conference on Crime Prevention. Report ofthe Working Group on Commercial Robbery. Available from Home OfficeCrime Prevention Unit.
Hough, J. M. and Mo, J. (1986). ‘“If at first you don’t succeed”: BCS findingson attempted burglaries.’ Home Office Research Bulletin, No 21, pp. 10 – 13.London: Home Office.
Macdonald, J. (1975). Armed Robbery: Offenders and their victims. Springfield,Illinois: CC Thomas.
Oakes, M. (1986). Statistical Inference: a Commentary for the Social andBehavioural Sciences. Chichester: Wiley.
Skogan, W. (1978). Weapon Use in Robbery: Patterns and Policy Implications.Evanston, Illinois: Northwestern University Center for Urban Affairs.
Velleman, P. and Hoaglin, D. (1981). ABCs of EDA. Boston, Massachusetts:Duxbury Press.
Walsh, D. (1986). Heavy Business: Commercial Burglary and Robbery. London:Routledge & Kegan Paul.
35

Crime Prevention Unit Papers
1.
2.
3.
4.
5.
6.
7.
8.
Reducing Burglary: a study of chemists’ shops.Gloria Laycock. 1985. v + 7 pp. (0 86353 154 8).
Reducing Crime: developing the role of crime prevention panels.Lorna J. F. Smith and Gloria Laycock. 1985. v + 14 pp. (0 86252 189 0).
Property Marking: a deterrent to domestic burglary?Gloria Laycock. 1985. v + 25 pp. (0 86252 193 9).
Designing for Car Security: towards a crime free car.Dean Southall and Paul Ekblom. 1985. v + 25 pp. (0 86252 222 6).
The Prevention of Shop Theft: an approach through crime analysis.Paul Ekblom. 1986. v + 19 pp. (0 86252 237 4).
Prepayment Coin Meters: a target for burglary.Nigel Hill. 1986. v + 15 pp. (0 86252 245 5).
Crime in Hospitals: diagnosis and prevention.Lorna J. F. Smith. 1987. v + 25 pp. (0 86252 267 6).
Preventing Juvenile Crime: the Staffordshire Experience.Kevin Heal and Gloria Laycock. 1987. v + 29 pp. (0 86252 297 8).
36