Embed Size (px)
Citation preview
DIRECTORATE OF RESEARCH AND DEVELOPMENT DEPUTY FOR PREVENTION CORRUPTION ERADICATION COMMISSION (KPK) REPUBLIC OF INDONESIA
OCTOBER 2015
Preventing State Losses in Indonesia’s Forestry SectorAn Analysis of Non-tax Forest Revenue Collection and Timber Production Administration
DIRECTORATE OF RESEARCH AND DEVELOPMENT
DEPUTY FOR PREVENTION
CORRUPTION ERADICATION COMMISSION (KPK)
REPUBLIC OF INDONESIA
OCTOBER 2015
Preventing State Losses in Indonesia’s Forestry Sector
An Analysis of Non-tax Forest Revenue Collection and Timber Production Administration
P R E V E N T I N G S TAT E LO S S E S I N I N D O N E S I A’S F O R E S T RY S E C TO Ri i
Executive SummaryIndonesia is home to one of the largest tropical forests in the world, and the vast majority of this forest is
administered by the Government through a Forest Estate that covers over 70 percent of the nation’s land
area. Based on Article 33 of the Constitution, the Government is responsible for managing Indonesia’s natural
resources for the maximum benefit of the country and its citizens. When forests within the state-administered
Forest Estate are harvested for commercial timber production, the Government collects various royalties, levies,
and fees based on reported timber production, collectively known as PNBP non-tax revenues. If timber is not
reported and/or royalty fees are not paid, then the economic value from these forests is captured by private
interests and not harnessed for the benefit of the Government and, by extension, the people of Indonesia.
The President has encouraged KPK, the Corruption Eradication Commission, to calculate state losses in the
forestry sector, examine the systems that allow such losses to occur, and coordinate efforts to fix these systems
and improve revenue collection. This study estimates the loss of state assets from unreported timber production
and the under-collection of non-tax forestry revenues during the period 2003–2014. The study analyzes the
weaknesses in the Government’s administrative systems for overseeing timber production and for collecting non-
tax forest revenues, and then provides recommendations for how these systems should be strengthened and
revenue collection improved. This study will provide the basis for KPK to coordinate an inter-ministerial reform
initiative to improve state administration of Indonesia’s forests for the benefit of the country.
Estimating the volume of unreported timber production
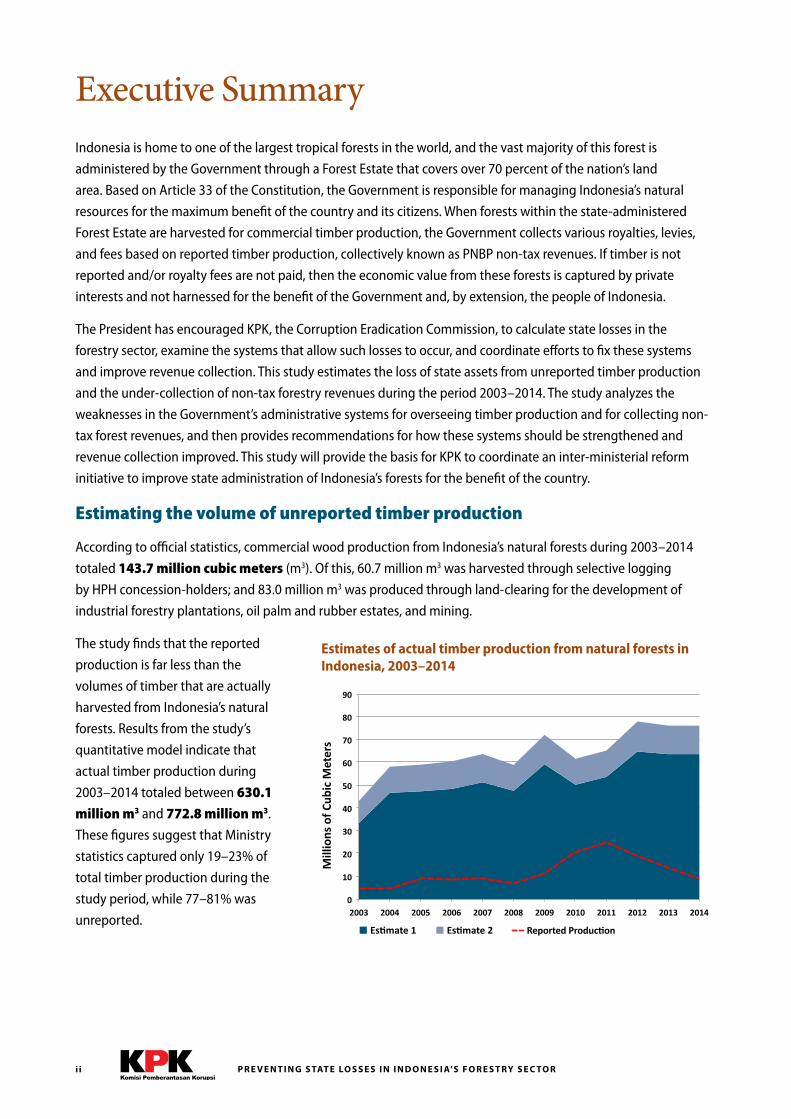
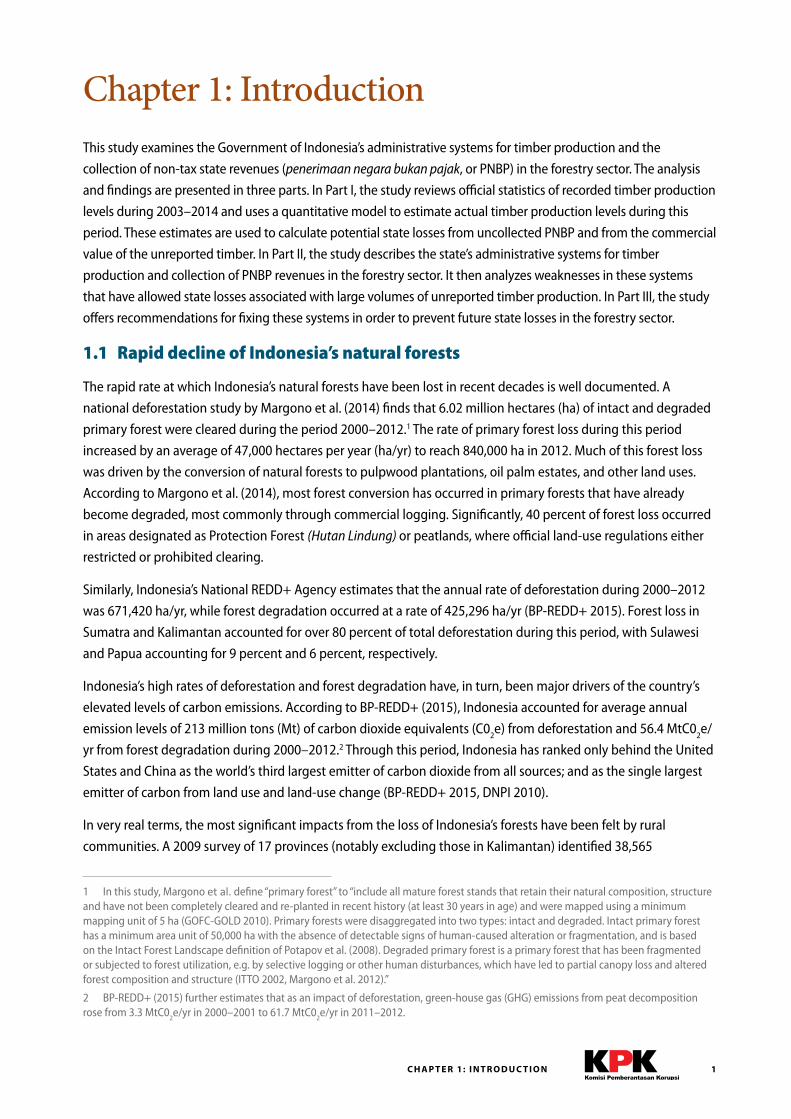
According to official statistics, commercial wood production from Indonesia’s natural forests during 2003–2014
totaled 143.7 million cubic meters (m3). Of this, 60.7 million m3 was harvested through selective logging
by HPH concession-holders; and 83.0 million m3 was produced through land-clearing for the development of
industrial forestry plantations, oil palm and rubber estates, and mining.
The study finds that the reported
production is far less than the
volumes of timber that are actually
harvested from Indonesia’s natural
forests. Results from the study’s
quantitative model indicate that
actual timber production during
2003–2014 totaled between 630.1
million m3 and 772.8 million m3.
These figures suggest that Ministry
statistics captured only 19–23% of
total timber production during the
study period, while 77–81% was
unreported.
0
10
20
30
40
50
60
70
80
90
2003 2004 2005 2006 2007 2008 2009 2010 2011 2012 2013 2014
Es.mate 1 Es.mate 2
Mill
ions
of C
ubic
Met
ers
Estimates of actual timber production from natural forests in Indonesia, 2003–2014
Reported Production
i i i
0
200
400
600
800
1,000
1,200
1,400
2003 2004 2005 2006 2007 2008 2009 2010 2011 2012 2013 2014
Collected Uncollected – Es9mate 1 Uncollected – Es9mate 2
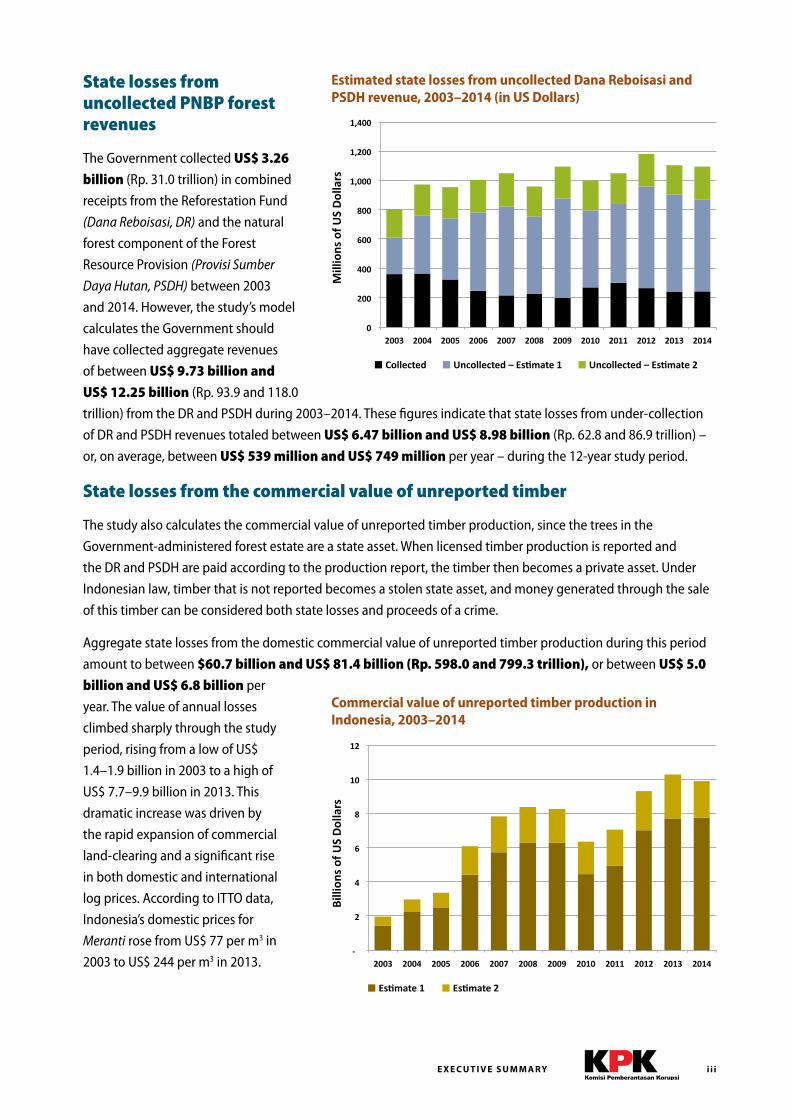
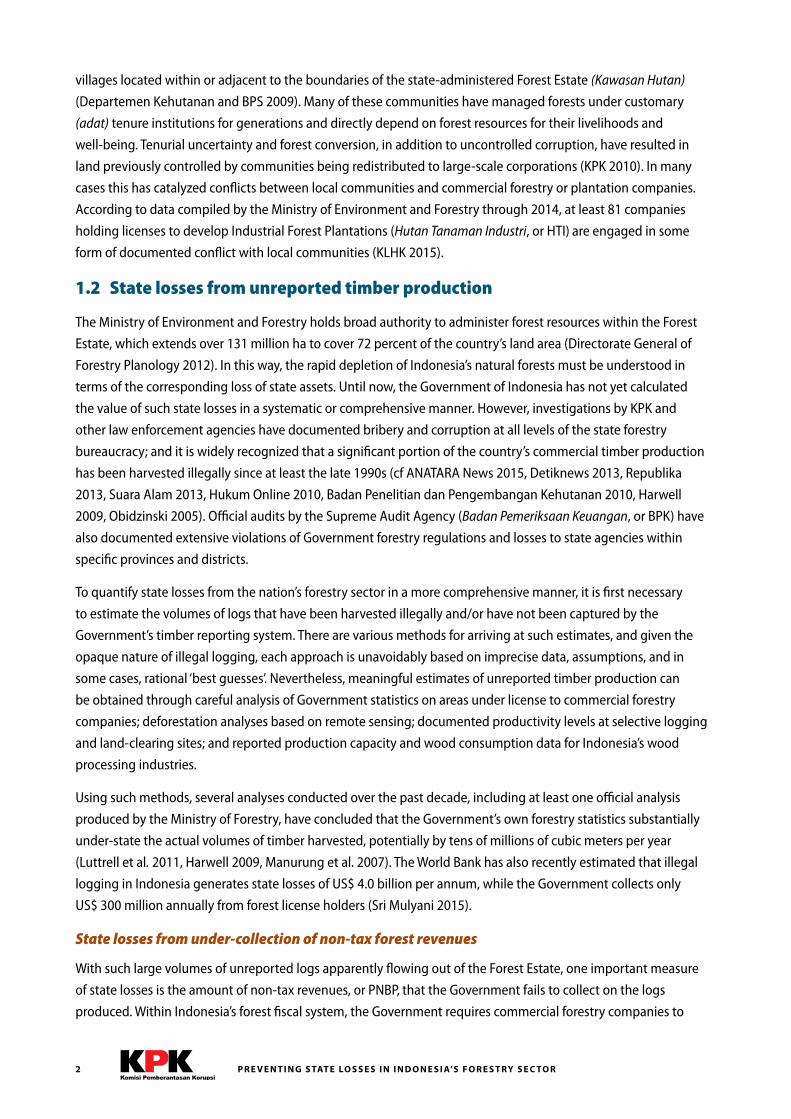
Estimated state losses from uncollected Dana Reboisasi and PSDH revenue, 2003–2014 (in US Dollars)
Mill
ions
of U
S D
olla
rs
-‐
2
4
6
8
10
12
2003 2004 2005 2006 2007 2008 2009 2010 2011 2012 2013 2014
Es/mate 1 Es/mate 2
State losses from uncollected PNBP forest revenues
The Government collected US$ 3.26
billion (Rp. 31.0 trillion) in combined
receipts from the Reforestation Fund
(Dana Reboisasi, DR) and the natural
forest component of the Forest
Resource Provision (Provisi Sumber
Daya Hutan, PSDH) between 2003
and 2014. However, the study’s model
calculates the Government should
have collected aggregate revenues
of between US$ 9.73 billion and
US$ 12.25 billion (Rp. 93.9 and 118.0
trillion) from the DR and PSDH during 2003–2014. These figures indicate that state losses from under-collection
of DR and PSDH revenues totaled between US$ 6.47 billion and US$ 8.98 billion (Rp. 62.8 and 86.9 trillion) –
or, on average, between US$ 539 million and US$ 749 million per year – during the 12-year study period.
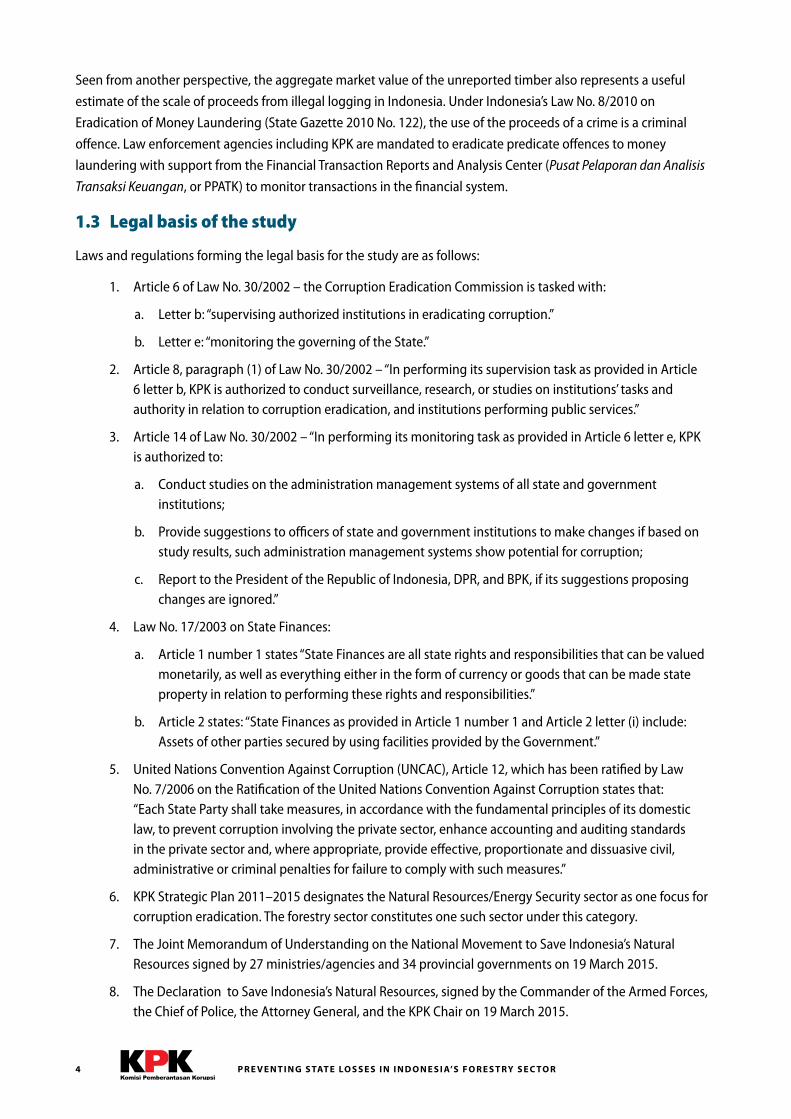
State losses from the commercial value of unreported timber
The study also calculates the commercial value of unreported timber production, since the trees in the
Government-administered forest estate are a state asset. When licensed timber production is reported and
the DR and PSDH are paid according to the production report, the timber then becomes a private asset. Under
Indonesian law, timber that is not reported becomes a stolen state asset, and money generated through the sale
of this timber can be considered both state losses and proceeds of a crime.
Aggregate state losses from the domestic commercial value of unreported timber production during this period
amount to between $60.7 billion and US$ 81.4 billion (Rp. 598.0 and 799.3 trillion), or between US$ 5.0
billion and US$ 6.8 billion per
year. The value of annual losses
climbed sharply through the study
period, rising from a low of US$
1.4–1.9 billion in 2003 to a high of
US$ 7.7–9.9 billion in 2013. This
dramatic increase was driven by
the rapid expansion of commercial
land-clearing and a significant rise
in both domestic and international
log prices. According to ITTO data,
Indonesia’s domestic prices for
Meranti rose from US$ 77 per m3 in
2003 to US$ 244 per m3 in 2013.
Billi
ons
of U
S D
olla
rs
Commercial value of unreported timber production in Indonesia, 2003–2014
E X E C U T I V E S U M M A RY
P R E V E N T I N G S TAT E LO S S E S I N I N D O N E S I A’S F O R E S T RY S E C TO Riv
Weaknesses in the administration of timber production and PNBP collection
Such large volumes of unreported timber production and state loss have resulted from significant weaknesses in
the Government’s timber production administration and revenue collection systems. Major weaknesses identified
by the study include:
1. Management of data on reported timber production and non-tax revenue collection is insufficient for holding companies accountable to meet fiscal obligations to the state.
2. Existing internal controls are inadequate for ensuring the integrity of systems for timber administration and collection of non-tax revenues.
3. External accountability mechanism are inadequate for preventing state losses from the manipulation of information on timber production and non-tax revenue collection.
4. Ineffective law enforcement in the forestry sector has resulted in a ‘shadow economy’ for illegally harvested timber.
5. Forest royalty rates have been set at levels that facilitate only limited capture of economic rents by the Government and provide implicit incentives for unsustainable forest management.
6. Non-tax revenue collection and timber product administration is not directed at the broader public interest.
Roadmap for fixing the system
Within the context of the National Movement to Save Indonesia’s Natural Resources, KPK will be working together
with the Ministry of Environment and Forestry (KLHK), the Ministry of Finance, the Supreme Audit Agency (BPK)
and other institutions to address the weaknesses identified by this study. KPK now calls on these institutions to
formulate a joint action plan aimed at strengthening the administration of timber production and increasing
non-tax revenue in the forestry sector. These efforts are critically needed to ensure that Indonesia’s forests are
managed more accountably and the benefits they generate are shared more equitably.
At minimum, this action plan must include:
1. A comprehensive audit of non-tax forest revenues conducted by BPK.
2. All timber production from state-administered forests reported on KLHK’s online and publicly-accessible SI-PUHH system, including official inventory, planning, production, non-tax revenue payment, and mill timber consumption reports.
3. Spatial monitoring tools used to verify forest inventory for all land-clearing areas prior to harvest.
4. Routine coordination between KLHK and Ministry of Finance to plan empirically-based and accountable non-tax revenue targets.
5. Enhanced law enforcement actions, including use of anti-money laundering laws, against all actors identified to be underreporting timber production and/or evading payments of forest royalties.
6. High-level review of the structure and rates of royalty fees to determine how the Government will collect full economic rent on timber production.
7. KPK along with counterparts from KLHK and Ministry of Finance publishes publicly-available annual performance reports of non-tax forest revenue collection.
vCO N T E N T S
ContentsExecutive Summary . . . . . . . . . . . . . . . . . . . . . . . . . . . . . . . . . . . . . . . . . . . . . . . . . . . . . . . . . . . . . . . . . . . . . . . . . . . . . . . . . . . . . . . . . . ii
List of Charts, Figures, and Tables . . . . . . . . . . . . . . . . . . . . . . . . . . . . . . . . . . . . . . . . . . . . . . . . . . . . . . . . . . . . . . . . . . . . . . . . . . . . .vi
Abbreviations and Acronyms . . . . . . . . . . . . . . . . . . . . . . . . . . . . . . . . . . . . . . . . . . . . . . . . . . . . . . . . . . . . . . . . . . . . . . . . . . . . . . . . . ix
Chapter 1: Introduction . . . . . . . . . . . . . . . . . . . . . . . . . . . . . . . . . . . . . . . . . . . . . . . . . . . . . . . . . . . . . . . . . . . . . . . . . . . . . . . . . . . . . . 1
Section I: Estimating state losses from unreported timber production . . . . . . . . . . . . . . . . . . . . . 7
Chapter 2: Estimating the volume of actual timber production from Indonesia’s natural forests . . . . . . . . . . . . . 8
Chapter 3: Calculating state losses from uncollected non-tax forest revenues . . . . . . . . . . . . . . . . . . . . . . . . . . . . . . 19
Chapter 4: Calculating state losses of commercial value from unreported timber production . . . . . . . . . . . . . . 27
Section II: Analysis of weaknesses in the timber administration and non-tax revenue collection system . . . . . . . . . . . . . . . . . . . . . . . . . . . . . . . . . . . . . . . . . . . . . . . . . . . . . . . . . . . . . . . . . . . . . . . . . . . . . . . . 31
Chapter 5: Regulatory framework for non-tax state revenue collection in the forestry sector . . . . . . . . . . . . . . . 32
Chapter 6: The management of data on reported timber production and non-tax revenue collection is insufficient for holding companies accountable to meet fiscal obligations to the state. . . . . . . . . . . . . . . . . . . 52
Chapter 7: Internal controls are inadequate for ensuring accountability in timber administration and non-tax revenue collection. . . . . . . . . . . . . . . . . . . . . . . . . . . . . . . . . . . . . . . . . . . . . . . . . . . . . . . . . . . . . . . . . . . . . . . . . . . . . . 63
Chapter 8: External accountability mechanisms are inadequate for preventing state losses from manipulation of information on timber production and non-tax revenue collection. . . . . . . . . . . . . . . . . . . . . . . 80
Chapter 9: Ineffective law enforcement in the forestry sector has facilitated the emergence of a ‘shadow economy’ in illegally harvested timber. . . . . . . . . . . . . . . . . . . . . . . . . . . . . . . . . . . . . . . . . . . . . . . . . . . . . . . . . . . . . 85
Chapter 10: Indonesia’s forest royalty rates are set at levels that facilitate only limited capture of economic rents by the Government and provide implicit incentives for unsustainable forest management. . . . . . . . . . . . . . . . . . . . . . . . . . . . . . . . . . . . . . . . . . . . . . . . . . . . . . . . . . . . . . . . . . . . . . . . . . . . . . . . . . . . . . . . . . . . . . . . 94
Chapter 11: Timber production administration and non-tax revenue collection in the forestry sector are not directed at the broader public interest. . . . . . . . . . . . . . . . . . . . . . . . . . . . . . . . . . . . . . . . . . . . . . . . . . . . . . . 101
Section III: Towards an accountable and efficient timber administration and non-tax revenue collection system . . . . . . . . . . . . . . . . . . . . . . . . . . . . . . . . . . . . . . . . . . . . . . . . . . . . . . . . . . . . . . . . . . . . 103
Chapter 12: Roadmap for fixing the system . . . . . . . . . . . . . . . . . . . . . . . . . . . . . . . . . . . . . . . . . . . . . . . . . . . . . . . . . . . . . . . . 104
Appendices . . . . . . . . . . . . . . . . . . . . . . . . . . . . . . . . . . . . . . . . . . . . . . . . . . . . . . . . . . . . . . . . . . . . . . . . . . . . . . . . . . . . . . . . . . . . . . . . . 107
Sources Cited . . . . . . . . . . . . . . . . . . . . . . . . . . . . . . . . . . . . . . . . . . . . . . . . . . . . . . . . . . . . . . . . . . . . . . . . . . . . . . . . . . . . . . . . . . . . . . . 114
P R E V E N T I N G S TAT E LO S S E S I N I N D O N E S I A’S F O R E S T RY S E C TO Rvi
List of Charts, Figures, and TablesEstimates of actual timber production from natural forests in Indonesia, 2003–2014 . . . . . . . . . . . . . . . . . . . . . . . . . . . ii
Estimated state losses from uncollected Dana Reboisasi and PSDH revenue, 2003–2014 (in US Dollars) . . . . . . . . . iii
Commercial value of unreported timber production in Indonesia, 2003–2014 . . . . . . . . . . . . . . . . . . . . . . . . . . . . . . . . . iii
Table 1.1. Study stages and schedule . . . . . . . . . . . . . . . . . . . . . . . . . . . . . . . . . . . . . . . . . . . . . . . . . . . . . . . . . . . . . . . . . . . . . . . 6
Chart 2.1. Reported timber production from natural forests in Indonesia, 2003–2014 . . . . . . . . . . . . . . . . . . . . . . . . . 10
Table 2.1. Estimated area of high-intensity selective logging . . . . . . . . . . . . . . . . . . . . . . . . . . . . . . . . . . . . . . . . . . . . . . . . 11
Table 2.2. Ministry of Forestry data on average standing stock per hectare for all species by province (except Java) . . . . . . . . . . . . . . . . . . . . . . . . . . . . . . . . . . . . . . . . . . . . . . . . . . . . . . . . . . . . . . . . . . . . . . . . . . . . . . . . . . . . . . . . . . . . . 14
Chart 2.2. Estimate 1 of actual timber production in Indonesia, 2003–2014 . . . . . . . . . . . . . . . . . . . . . . . . . . . . . . . . . . . 16
Chart 2.3. Estimate 1 of actual timber production by major island, 2003–2014 . . . . . . . . . . . . . . . . . . . . . . . . . . . . . . . . 16
Chart 2.4. Estimate 2 of actual timber production in Indonesia, 2003–2014 . . . . . . . . . . . . . . . . . . . . . . . . . . . . . . . . . . . 17
Chart 2.5. Estimate 2 of actual timber production by major islands, 2003–2014 . . . . . . . . . . . . . . . . . . . . . . . . . . . . . . . 18
Table 3.1. Rates of the DR levy according to Government Regulations No. 92/1999 and No. 12/2014 . . . . . . . . . . . . 21
Table 3.2. PSDH benchmark prices (harga patokan) according to Ministerial Regulations 06/MPP/Kep/1/1999, 12/M-Dag/PER/3/2012, 22/M-Dag/PER/4/2012 and P.68/Menhut-II/2014 . . . . . . . . . . . . . . . . 22
Table 3.3. Government receipts of PNBP in Indonesia’s forestry sector (in billion Rp), 2003–2013 . . . . . . . . . . . . . . . 23
Chart 3.1. Receipts for Dana Reboisasi and PSDH, 2003–2013 . . . . . . . . . . . . . . . . . . . . . . . . . . . . . . . . . . . . . . . . . . . . . . . . 24
Chart 3.2. Estimated state losses from uncollected DR revenues, 2003–2014 (in US dollars) . . . . . . . . . . . . . . . . . . . . 25
Chart 3.3. Estimated state losses from uncollected PSDH revenues, 2003–2014 (in Rupiah) . . . . . . . . . . . . . . . . . . . . 26
Chart 3.4. Estimated state losses from uncollected Dana Reboisasi and PSDH revenue, 2003–2014 (in US Dollars) . . . . . . . . . . . . . . . . . . . . . . . . . . . . . . . . . . . . . . . . . . . . . . . . . . . . . . . . . . . . . . . . . . . . . . . . . . . . . . . . . . . . . . . . . . . . 26
Chart 4.1. Commercial value of reported timber production in Indonesia, 2003–2014 (in US Dollars) . . . . . . . . . . . 29
Chart 4.2. Commercial value of unreported timber production in Indonesia, 2003–2014 – Estimate 1 (in US Dollars) . . . . . . . . . . . . . . . . . . . . . . . . . . . . . . . . . . . . . . . . . . . . . . . . . . . . . . . . . . . . . . . . . . . . . . . . . . . . . . . . . . . . . . . . . . . . 30
Chart 4.3. Commercial value of unreported timber production in Indonesia, 2003–2014 – Estimate 2 (in US Dollars) . . . . . . . . . . . . . . . . . . . . . . . . . . . . . . . . . . . . . . . . . . . . . . . . . . . . . . . . . . . . . . . . . . . . . . . . . . . . . . . . . . . . . . . . . . . . 30
Figure 5.1. Flow chart of PNBP governance . . . . . . . . . . . . . . . . . . . . . . . . . . . . . . . . . . . . . . . . . . . . . . . . . . . . . . . . . . . . . . . . . 33
Table 5.1. Regulatory framework for PNBP collection in the forestry sector . . . . . . . . . . . . . . . . . . . . . . . . . . . . . . . . . . . . 34
Figure 5.2. Flow chart for setting PNBP targets . . . . . . . . . . . . . . . . . . . . . . . . . . . . . . . . . . . . . . . . . . . . . . . . . . . . . . . . . . . . . . 34
Figure 5.4. Flow of the DR through the Special Allocation Fund . . . . . . . . . . . . . . . . . . . . . . . . . . . . . . . . . . . . . . . . . . . . . . 35
Figure 5.3. Division of PSDH through the Special Allocation Fund . . . . . . . . . . . . . . . . . . . . . . . . . . . . . . . . . . . . . . . . . . . . 35
Figure 5.5. System for administration of timber production and PNBP revenue collection . . . . . . . . . . . . . . . . . . . . . 36
Figure 5.6. Administrative system for timber production planning . . . . . . . . . . . . . . . . . . . . . . . . . . . . . . . . . . . . . . . . . . . 38
Figure 5.7. Flow chart for IHMB inventory preparation . . . . . . . . . . . . . . . . . . . . . . . . . . . . . . . . . . . . . . . . . . . . . . . . . . . . . . . 39
vii
Figure 5.8. Forest standing stock in the PT Bhara Induk concession according to the IMHB inventory in the RKU work plan . . . . . . . . . . . . . . . . . . . . . . . . . . . . . . . . . . . . . . . . . . . . . . . . . . . . . . . . . . . . . . . . . . . . . . . . . . . . . . . . . . . . . 41
Figure 5.9. PT Bhara Induk’s annual harvest quota based on its RKUPHHK-HA management plan . . . . . . . . . . . . . . . 43
Figure 5.10. PT Arara Abadi’s 2009 cruising target for Rokan Hilir District, Riau Province . . . . . . . . . . . . . . . . . . . . . . . 44
Figure 5.11. Executive summary of PT RAPP’s 2009 RKT in Pelalawan District, Riau Province . . . . . . . . . . . . . . . . . . . . 47
Figure 5.12. Self-assessment of PT Diamond Raya Timber’s RKT in 2014 . . . . . . . . . . . . . . . . . . . . . . . . . . . . . . . . . . . . . . . 47
Figure 5.13. Timber marked with barcodes . . . . . . . . . . . . . . . . . . . . . . . . . . . . . . . . . . . . . . . . . . . . . . . . . . . . . . . . . . . . . . . . . 48
Figure 5.14. Flow chart of PNBP collection administration in the forestry sector . . . . . . . . . . . . . . . . . . . . . . . . . . . . . . . 49
Table 6.1. Log production based on source of production during 2007–2011, as reported in Statistik Kehutanan 2011 . . . . . . . . . . . . . . . . . . . . . . . . . . . . . . . . . . . . . . . . . . . . . . . . . . . . . . . . . . . . . . . . . . . . . . . . . . . . . . . . . . . . . . . .54
Table 6.2. National log production based on source of production in 2011, as reported in Statistik Kehutanan 2011 . . . . . . . . . . . . . . . . . . . . . . . . . . . . . . . . . . . . . . . . . . . . . . . . . . . . . . . . . . . . . . . . . . . . . . . . . . . . . . . . . . . . . . . .55
Table 6.3. Log production based on source of production during 2008–2012, as reported in Statistik Kehutanan 2012 . . . . . . . . . . . . . . . . . . . . . . . . . . . . . . . . . . . . . . . . . . . . . . . . . . . . . . . . . . . . . . . . . . . . . . . . . . . . . . . . . . . . . . . .56
Table 6.4. National log production based on source of production in 2012, as reported in Statistik Kehutanan 2012 . . . . . . . . . . . . . . . . . . . . . . . . . . . . . . . . . . . . . . . . . . . . . . . . . . . . . . . . . . . . . . . . . . . . . . . . . . . . . . . . . . . . . . . .57
Table 6.5. Log production based on source of production in 2010–2013, as reported in Statistik Kehutanan 2013 . . . . . . . . . . . . . . . . . . . . . . . . . . . . . . . . . . . . . . . . . . . . . . . . . . . . . . . . . . . . . . . . . . . . . . . . . . . . . . . . . . . . . . . .58
Table 6.6. IPK data from Central Kalimantan . . . . . . . . . . . . . . . . . . . . . . . . . . . . . . . . . . . . . . . . . . . . . . . . . . . . . . . . . . . . . . . . 59
Table 6.7. Reported log production as a percentage of planned production by IUPHHK-HA (HPH) license holders, 2010–2013 . . . . . . . . . . . . . . . . . . . . . . . . . . . . . . . . . . . . . . . . . . . . . . . . . . . . . . . . . . . . . . . . . . . . . . . . . . . . . . . 60
Table 6.8. A comparison of reported log production according to SI-PUHH and log production reports from the Directorate of Natural Forest Production, 2010–2013 . . . . . . . . . . . . . . . . . . . . . . . . . . . . . . . . . . . . . . . 61
Table 7.1. Documents and information provided by forest license holders . . . . . . . . . . . . . . . . . . . . . . . . . . . . . . . . . . . . 64
Table 7.2. Verification methods in Minister of Forestry Regulations P.30/2014, P.33/2014, P.62/2014, P.41/2014 and P.42/2014 . . . . . . . . . . . . . . . . . . . . . . . . . . . . . . . . . . . . . . . . . . . . . . . . . . . . . . . . . . . . . . . . . . . . . . . . . . . . . . . . . . 65
Figure 7.1. Flowchart on LHC and RKT inspection and approval . . . . . . . . . . . . . . . . . . . . . . . . . . . . . . . . . . . . . . . . . . . . . . 66
Figure 7.2. Flowchart for LHC inspection and IPK approval . . . . . . . . . . . . . . . . . . . . . . . . . . . . . . . . . . . . . . . . . . . . . . . . . . . 67
Table 7.3. Timber cruising for various types of forest use and utilization . . . . . . . . . . . . . . . . . . . . . . . . . . . . . . . . . . . . . . 67
Figure 7.3. Flowchart on administration relating to LHP logging yield reports . . . . . . . . . . . . . . . . . . . . . . . . . . . . . . . . . 68
Figure 7.4. Sample integrity pact . . . . . . . . . . . . . . . . . . . . . . . . . . . . . . . . . . . . . . . . . . . . . . . . . . . . . . . . . . . . . . . . . . . . . . . . . . 69
Figure 7.5. KLHK internal control mechanisms and roles . . . . . . . . . . . . . . . . . . . . . . . . . . . . . . . . . . . . . . . . . . . . . . . . . . . . . 70
Table 7.4. Submission of documents and copies for internal control of forest production administration and non-tax revenue collection . . . . . . . . . . . . . . . . . . . . . . . . . . . . . . . . . . . . . . . . . . . . . . . . . . . . . . . . . . . . . . . . . . . . . . . . . . . . 71
Table 7.5. Timber administration documents and their requirements . . . . . . . . . . . . . . . . . . . . . . . . . . . . . . . . . . . . . . . . . 73
Figure 7.6. Timber felled without being administered and buried in the ground . . . . . . . . . . . . . . . . . . . . . . . . . . . . . . . 73
Figure 7.7. Statement from P2LHP officer refuting the veracity of PT MTI’s LHP-KB log production report . . . . . . . 74
Figure 7.8. Annex to the statement listing LHP logging yield reports not signed by the relevant official(s) . . . . . . 75
L I S T O F C H A R T S , F I G U R E S , A N D TA B L E S
P R E V E N T I N G S TAT E LO S S E S I N I N D O N E S I A’S F O R E S T RY S E C TO Rvii i
Figure 7.9. Officers issuing SKSKB log transport permits are found to have issued SKSKBs without following procedures (BPK-RI audit 2012) . . . . . . . . . . . . . . . . . . . . . . . . . . . . . . . . . . . . . . . . . . . . . . . . . . . . . . . . . . . . . . . . . . 76
Table 7.6. KLHK controls in timber administration . . . . . . . . . . . . . . . . . . . . . . . . . . . . . . . . . . . . . . . . . . . . . . . . . . . . . . . . . . . 76
Figure 7.10. BPK findings on SKSKBs being issued without prior settlement of DR and PSDH . . . . . . . . . . . . . . . . . . . 77
Table 7.7. Movement of timber without LHP logging yield reports . . . . . . . . . . . . . . . . . . . . . . . . . . . . . . . . . . . . . . . . . . . 77
Table 7.8. Payment standards for forest timber administration and PNBP collection . . . . . . . . . . . . . . . . . . . . . . . . . . . 78
Table 9.1. ‘Perpetrators of crimes’ convicted under Law No. 18/2013 . . . . . . . . . . . . . . . . . . . . . . . . . . . . . . . . . . . . . . . . . . 86
Table 9.2. Analysis reports sent by PPATK to law enforcers . . . . . . . . . . . . . . . . . . . . . . . . . . . . . . . . . . . . . . . . . . . . . . . . . . . 86
Table 9.3. List of corruption cases linked to the forestry sector handled by KPK . . . . . . . . . . . . . . . . . . . . . . . . . . . . . . . . 88
Chart 9.1. Production forest not subject to management units . . . . . . . . . . . . . . . . . . . . . . . . . . . . . . . . . . . . . . . . . . . . . . . 89
Figure 9.1. Forest Estate designation and the area of Production Forest under management units . . . . . . . . . . . . . . 90
Table 9.4. Comparison between small-scale and large-scale forest management . . . . . . . . . . . . . . . . . . . . . . . . . . . . . . 90
Table 9.5. Forest Estate designation . . . . . . . . . . . . . . . . . . . . . . . . . . . . . . . . . . . . . . . . . . . . . . . . . . . . . . . . . . . . . . . . . . . . . . . . 91
Figure 9.2. Description of the management region, public facilities, and social facilities in Madara village inside the Barito River Protection Forest . . . . . . . . . . . . . . . . . . . . . . . . . . . . . . . . . . . . . . . . . . . . . . . . . . . . . . . . . . . . . 91
Chart 9.2. Ratio of Forest Estate area to forest police officers (Polhut) (hectares per officer) . . . . . . . . . . . . . . . . . . . . . 92
Table 9.6. Numbers of forest police (Polhut) and forestry civil service investigators (PPNS Kehutanan) . . . . . . . . . . . 92
Table 9.7. Forest supervisory staff (Wasganis PHPL) in Central Kalimantan . . . . . . . . . . . . . . . . . . . . . . . . . . . . . . . . . . . . . 93
Table 10.1. Reforestation Fund (DR) rates for 1999 and 2014 . . . . . . . . . . . . . . . . . . . . . . . . . . . . . . . . . . . . . . . . . . . . . . . . . 96
Chart 10.1. Reforestation Fund rate for Meranti logs as a percentage of domestic prices during 1998–2014 . . . . . 97
Table 10.2. Changes in the benchmark price for PSDH, according to Ministerlal regulations . . . . . . . . . . . . . . . . . . . . 98
Chart 10.2. Comparison between PSDH rates and inflation during 1999–2014 . . . . . . . . . . . . . . . . . . . . . . . . . . . . . . . . 99
Figure 10.1. Benchmark prices and domestic market prices recorded in West Papua BPPHP’s annual statistics report . . . . . . . . . . . . . . . . . . . . . . . . . . . . . . . . . . . . . . . . . . . . . . . . . . . . . . . . . . . . . . . . . . . . . . . . . . . . . . . . . . . . . . . . . . . 99
Appendix Table 1. Estimates of actual timber production in Indonesia (in cubic meters), 2003–2014 . . . . . . . . . . 107
Appendix Table 2. Estimates of Dana Reboisasi funds owed, collected, and uncollected, 2003–2014 . . . . . . . . . . . 108
Appendix Table 3. Estimates of PSDH funds owed, collected, and uncollected, 2003–2014 . . . . . . . . . . . . . . . . . . . . 109
Appendix Table 4. Exchange rate (Rupiah/US$) used in this study . . . . . . . . . . . . . . . . . . . . . . . . . . . . . . . . . . . . . . . . . . . 110
Appendix Table 5. Estimates of Dana Reboisasi and PSDH (US$) funds owed, collected, and uncollected, 2003–2014 . . . . . . . . . . . . . . . . . . . . . . . . . . . . . . . . . . . . . . . . . . . . . . . . . . . . . . . . . . . . . . . . . . . . . . . . . . . . . . . . . . . . . . . . . . . . . . 111
Appendix Table 6. Estimates of Dana Reboisasi and PSDH (Rp.) funds owed, collected, and uncollected, 2003–2014 . . . . . . . . . . . . . . . . . . . . . . . . . . . . . . . . . . . . . . . . . . . . . . . . . . . . . . . . . . . . . . . . . . . . . . . . . . . . . . . . . . . . . . . . . . . . . . 112
Appendix Table 7. Commercial value of unreported timber production, 2003–2014 . . . . . . . . . . . . . . . . . . . . . . . . . . 113
ix
Abbreviations and AcronymsAPBN State Budget (Anggaran Pendapatan dan Belanja Negara)
APHI Indonesia Forest Concessionaires Association (Asosiasi Pengusaha Hutan Indonesia)
BLU Public Service Unit (Badan Layanan Umum)
BP2HP Regional Production Forest Supervision Offices, under the Ministry of Environment and Forestry
(Balai Pemantauan Pemanfaatan Hutan Produksi)
BPK-RI Supreme Audit Agency for the Republic of Indonesia (Badan Pemeriksa Keuangan
Republik Indonesia)
CIA Corruption Impact Assessment
DR Reforestation Fund (Dana Reboisasi)
Ganis Licensed Technical Officer (Tenaga Teknis)
GN-SDA National Movement to Save Indonesia’s Natural Resources (Gerakan Nasional Penyelamatan
Sumber Daya Alam)
HL Protected Forest (Hutan Lindung)
HP Production Forest (Hutan Produksi)
HPH Selective Logging Timber Concession (Hak Pengelolaan Hutan)
HPK Production Forest for Conversion (Hutan Produksi yang dapat Dikonversi)
HPT Limited Production Forest (Hutan Produksi Terbatas)
HTI Industrial Forest Plantation (Hutan Tanaman Industri)
IHH Forest Product Fee (Iuran Hasil Hutan)
IHMB Concession Area Standing Stock Inventory (Inventarisasi Hutan Menyeluruh Berkala)
IPK Wood Utilization Permit (for land-clearing) (Izin Pemanfaatan Kayu)
IPPKH Forest Estate Temporary Use Licenses (Izin Pinjam Pakai Kawasan Hutan)
ITTO International Tropical Timber Organization
IUPHH Commercial Forest Utilization License Fee (Iuran Izin Usaha Pemanfaatan Hutan)
IUPHHK Commercial Forest Concession License (Izin Usaha Pemanfaatan Hasil Hutan Kayu)
KB Large-diameter logs (≥ 30 cm) (Kayu Bulat)
KBK Small-diameter logs (< 30 cm) (Kayu Bulat Kecil)
KLHK Ministry of Environment and Forestry (Kementerian Lingkungan Hidup dan Kehutanan)
KPK Corruption Eradication Commission (Komisi Pemberantasan Korupsi)
LHC Timber Cruising Report (Laporan Hasil Cruising)
LHP Logging Yield Report (Laporan Hasil Penebangan)
LP-KHP Timber Harvest Production Report (Laporan Produksi Kayu Hasil Pemanenan)
MTH Mixed Tropical Hardwoods
PKH Forest Estate User Fee (Pemakaian Kawasan Hutan)
PNBP Non-tax State Revenue (Penerimaan Negara Bukan Pajak)
PNT Stumpage Value Replacement Fee (Penggantian Nilai Tegakan)
PPATK Financial Transaction Reports and Analysis Center (Pusat Pelaporan dan Analisis
Transaksi Keuangan)
A B B R E V I AT I O N S A N D AC R O N YM S
P R E V E N T I N G S TAT E LO S S E S I N I N D O N E S I A’S F O R E S T RY S E C TO Rx
PSDH Forest Resource Provision (Provisi Sumber Daya Hutan)
PSP Permanent Sample Plot (Plot Sampel Permanen)
P2PSDH/DR Invoicing officer for the PSDH and DR (Petugas Pembuat PSDH/DR)
RKT Forest Concession Annual Work Plan (Rencana Kerja Tahunan Usaha Pemanfaatan Hasil
Hutan Kayu)
RKU Forest Concession Ten-year Management Plan (Rencana Kerja Usaha Pemanfaatan Hasil
Hutan Kayu)
SBB Proof of Payment (Surat Bukti Bayar)
SI-PUHH Forest Product Administration Information System (Sistem Informasi Penatausahaan Hasil Hutan)
SKSKB Log Legality Statement (Surat Keterangan Sah Kayu Bulat)
SPP Payment Order (Surat Perintah Pembayaran)
SVLK Timber Legality Verification System (Sistem Verifikasi Legalitas Kayu)
TPTI Indonesia’s Selective Logging and Replanting System (Tebang Pilih Tanaman Indonesia)
Wasganis Forestry officer overseeing the technical officers (Pengawas Tenaga Teknis)
1
Chapter 1: Introduction This study examines the Government of Indonesia’s administrative systems for timber production and the
collection of non-tax state revenues (penerimaan negara bukan pajak, or PNBP) in the forestry sector. The analysis
and findings are presented in three parts. In Part I, the study reviews official statistics of recorded timber production
levels during 2003–2014 and uses a quantitative model to estimate actual timber production levels during this
period. These estimates are used to calculate potential state losses from uncollected PNBP and from the commercial
value of the unreported timber. In Part II, the study describes the state’s administrative systems for timber
production and collection of PNBP revenues in the forestry sector. It then analyzes weaknesses in these systems
that have allowed state losses associated with large volumes of unreported timber production. In Part III, the study
offers recommendations for fixing these systems in order to prevent future state losses in the forestry sector.
1.1 Rapid decline of Indonesia’s natural forests
The rapid rate at which Indonesia’s natural forests have been lost in recent decades is well documented. A
national deforestation study by Margono et al. (2014) finds that 6.02 million hectares (ha) of intact and degraded
primary forest were cleared during the period 2000–2012.1 The rate of primary forest loss during this period
increased by an average of 47,000 hectares per year (ha/yr) to reach 840,000 ha in 2012. Much of this forest loss
was driven by the conversion of natural forests to pulpwood plantations, oil palm estates, and other land uses.
According to Margono et al. (2014), most forest conversion has occurred in primary forests that have already
become degraded, most commonly through commercial logging. Significantly, 40 percent of forest loss occurred
in areas designated as Protection Forest (Hutan Lindung) or peatlands, where official land-use regulations either
restricted or prohibited clearing.
Similarly, Indonesia’s National REDD+ Agency estimates that the annual rate of deforestation during 2000–2012
was 671,420 ha/yr, while forest degradation occurred at a rate of 425,296 ha/yr (BP-REDD+ 2015). Forest loss in
Sumatra and Kalimantan accounted for over 80 percent of total deforestation during this period, with Sulawesi
and Papua accounting for 9 percent and 6 percent, respectively.
Indonesia’s high rates of deforestation and forest degradation have, in turn, been major drivers of the country’s
elevated levels of carbon emissions. According to BP-REDD+ (2015), Indonesia accounted for average annual
emission levels of 213 million tons (Mt) of carbon dioxide equivalents (C02e) from deforestation and 56.4 MtC0
2e/
yr from forest degradation during 2000–2012.2 Through this period, Indonesia has ranked only behind the United
States and China as the world’s third largest emitter of carbon dioxide from all sources; and as the single largest
emitter of carbon from land use and land-use change (BP-REDD+ 2015, DNPI 2010).
In very real terms, the most significant impacts from the loss of Indonesia’s forests have been felt by rural
communities. A 2009 survey of 17 provinces (notably excluding those in Kalimantan) identified 38,565
1 In this study, Margono et al. define “primary forest” to “include all mature forest stands that retain their natural composition, structure and have not been completely cleared and re-planted in recent history (at least 30 years in age) and were mapped using a minimum mapping unit of 5 ha (GOFC-GOLD 2010). Primary forests were disaggregated into two types: intact and degraded. Intact primary forest has a minimum area unit of 50,000 ha with the absence of detectable signs of human-caused alteration or fragmentation, and is based on the Intact Forest Landscape definition of Potapov et al. (2008). Degraded primary forest is a primary forest that has been fragmented or subjected to forest utilization, e.g. by selective logging or other human disturbances, which have led to partial canopy loss and altered forest composition and structure (ITTO 2002, Margono et al. 2012).”
2 BP-REDD+ (2015) further estimates that as an impact of deforestation, green-house gas (GHG) emissions from peat decomposition rose from 3.3 MtC0
2e/yr in 2000–2001 to 61.7 MtC0
2e/yr in 2011–2012.
C H A P T E R 1: I N T R O D U C T I O N
P R E V E N T I N G S TAT E LO S S E S I N I N D O N E S I A’S F O R E S T RY S E C TO R2
villages located within or adjacent to the boundaries of the state-administered Forest Estate (Kawasan Hutan)
(Departemen Kehutanan and BPS 2009). Many of these communities have managed forests under customary
(adat) tenure institutions for generations and directly depend on forest resources for their livelihoods and
well-being. Tenurial uncertainty and forest conversion, in addition to uncontrolled corruption, have resulted in
land previously controlled by communities being redistributed to large-scale corporations (KPK 2010). In many
cases this has catalyzed conflicts between local communities and commercial forestry or plantation companies.
According to data compiled by the Ministry of Environment and Forestry through 2014, at least 81 companies
holding licenses to develop Industrial Forest Plantations (Hutan Tanaman Industri, or HTI) are engaged in some
form of documented conflict with local communities (KLHK 2015).
1.2 State losses from unreported timber production
The Ministry of Environment and Forestry holds broad authority to administer forest resources within the Forest
Estate, which extends over 131 million ha to cover 72 percent of the country’s land area (Directorate General of
Forestry Planology 2012). In this way, the rapid depletion of Indonesia’s natural forests must be understood in
terms of the corresponding loss of state assets. Until now, the Government of Indonesia has not yet calculated
the value of such state losses in a systematic or comprehensive manner. However, investigations by KPK and
other law enforcement agencies have documented bribery and corruption at all levels of the state forestry
bureaucracy; and it is widely recognized that a significant portion of the country’s commercial timber production
has been harvested illegally since at least the late 1990s (cf ANATARA News 2015, Detiknews 2013, Republika
2013, Suara Alam 2013, Hukum Online 2010, Badan Penelitian dan Pengembangan Kehutanan 2010, Harwell
2009, Obidzinski 2005). Official audits by the Supreme Audit Agency (Badan Pemeriksaan Keuangan, or BPK) have
also documented extensive violations of Government forestry regulations and losses to state agencies within
specific provinces and districts.
To quantify state losses from the nation’s forestry sector in a more comprehensive manner, it is first necessary
to estimate the volumes of logs that have been harvested illegally and/or have not been captured by the
Government’s timber reporting system. There are various methods for arriving at such estimates, and given the
opaque nature of illegal logging, each approach is unavoidably based on imprecise data, assumptions, and in
some cases, rational ‘best guesses’. Nevertheless, meaningful estimates of unreported timber production can
be obtained through careful analysis of Government statistics on areas under license to commercial forestry
companies; deforestation analyses based on remote sensing; documented productivity levels at selective logging
and land-clearing sites; and reported production capacity and wood consumption data for Indonesia’s wood
processing industries.
Using such methods, several analyses conducted over the past decade, including at least one official analysis
produced by the Ministry of Forestry, have concluded that the Government’s own forestry statistics substantially
under-state the actual volumes of timber harvested, potentially by tens of millions of cubic meters per year
(Luttrell et al . 2011, Harwell 2009, Manurung et al. 2007). The World Bank has also recently estimated that illegal
logging in Indonesia generates state losses of US$ 4.0 billion per annum, while the Government collects only
US$ 300 million annually from forest license holders (Sri Mulyani 2015).
State losses from under-collection of non-tax forest revenues
With such large volumes of unreported logs apparently flowing out of the Forest Estate, one important measure
of state losses is the amount of non-tax revenues, or PNBP, that the Government fails to collect on the logs
produced. Within Indonesia’s forest fiscal system, the Government requires commercial forestry companies to

3
pay various kinds of royalties, levies, and fees. The two largest of these, by far, are the Reforestation Fund (Dana
Reboisasi, or DR) and the Forest Resource Provision (Provisi Sumber Daya Hutan, or PSDH), both of which are
structured as volume-based levies (differentiated by species, grade, diameter, and region) on timber harvested.
Over the past decade, Government receipts from the DR and PSDH have amounted to approximately US$ 271.9
million (Rp. 2.58 trillion) per year.
The value of state losses from uncollected DR and PSDH can be calculated by applying the prevailing rates for
each of these to the estimated volumes of actual timber production over a specified period of time. The resulting
figures represent the potential amount of DR and PSDH that the Government should have collected under
existing regulations. By deducting the reported receipts from this sum, it is possible to calculate the amount of
revenues the Government should have collected, yet failed to collect.
State losses from the commercial value of unreported timber
A second, far more significant, measure of state losses relates to the economic value of the logs that have
been harvested outside the Government’s timber reporting system. Timber in state forests that is harvested in
sanctioned areas under valid licenses, accounted for in production reports, and for which the required tariffs are
paid becomes the property of the concessionaire. When timber is not reported and the required tariffs are not
paid, this timber becomes a stolen state asset.
The value of this stolen state asset can be calculated by accounting for the market value of the timber, the value
of the ecosystem services it provides to nearby communities, and the value of the carbon stored in its biomass.
But corruption cases related to timber production that have been prosecuted in Indonesia have used only the
market price to value this timber, which is a significant though only partial accounting of the total value of this
state asset.3 For the purposes of this study, this method, which has precedent in legal court proceedings, is used
to calculate state loss from unreported timber production. It is noted, however, that this approach does not
capture the full value of state loss.
In cases prosecuted until now, the method for calculating state losses from illegally harvested timber has relied
on government-regulated benchmark prices (harga patokan) as a way to measure market value. The harga
patokan, according to Government Regulation No. 51/1998 on Forest Resource Provision (State Gazette 1998
No. 84), should reflect an average of domestic and international market prices for specific grades of wood and
the regions in which they are harvested. Subsequent analysis presented in this report, however, shows that
throughout the study period, the harga patokan in the forestry sector have been significantly less than prevailing
market prices. Therefore, the study uses domestic market prices provided by the International Tropical Timber
Organization (ITTO) for large-diameter logs (kayu bulat), and domestic prices reported by Wood Resource
Quarterly, an international proprietary service provider, for small-diameter logs (kayu bulat kecil), or pulpwood.
Even though the regulation PP. 51/1998 describes harga patokan as an average of domestic and international
market prices, only domestic prices are used in this study to calculate state loss. During the period of this study, a
log export ban was in effect in Indonesia, so at least officially, Indonesian timber producers were unable to access
international market prices. Since it is unknown how much of the unreported timber production left Indonesia in
unprocessed form, a conservative estimate of state loss should be based on domestic market prices.
3 In Supreme Court Decision No. 736 K/Pid.Sus/2009, the head of Pelalawan District in Riau Province, Tengku Azmun Jaafar, was found guilty of taking bribes to issue Izin Usaha Pemanfaatan Hasil Hutan Kayu-Hutan Tanaman Industri (IUPHHK-HTI) licenses for areas not designated for that purpose. In the case, Azmun Jaafar’s actions were qualified as corruption with state losses of Rp. 1.2 trillion. This sum was calculated by subtracting the non-tax revenues companies had already paid from the timber values and production amounts.
C H A P T E R 1: I N T R O D U C T I O N
P R E V E N T I N G S TAT E LO S S E S I N I N D O N E S I A’S F O R E S T RY S E C TO R4
Seen from another perspective, the aggregate market value of the unreported timber also represents a useful
estimate of the scale of proceeds from illegal logging in Indonesia. Under Indonesia’s Law No. 8/2010 on
Eradication of Money Laundering (State Gazette 2010 No. 122), the use of the proceeds of a crime is a criminal
offence. Law enforcement agencies including KPK are mandated to eradicate predicate offences to money
laundering with support from the Financial Transaction Reports and Analysis Center (Pusat Pelaporan dan Analisis
Transaksi Keuangan, or PPATK) to monitor transactions in the financial system.
1.3 Legal basis of the study
Laws and regulations forming the legal basis for the study are as follows:
1. Article 6 of Law No. 30/2002 – the Corruption Eradication Commission is tasked with:
a. Letter b: “supervising authorized institutions in eradicating corruption.”
b. Letter e: “monitoring the governing of the State.”
2. Article 8, paragraph (1) of Law No. 30/2002 – “In performing its supervision task as provided in Article 6 letter b, KPK is authorized to conduct surveillance, research, or studies on institutions’ tasks and authority in relation to corruption eradication, and institutions performing public services.”
3. Article 14 of Law No. 30/2002 – “In performing its monitoring task as provided in Article 6 letter e, KPK is authorized to:
a. Conduct studies on the administration management systems of all state and government institutions;
b. Provide suggestions to officers of state and government institutions to make changes if based on study results, such administration management systems show potential for corruption;
c. Report to the President of the Republic of Indonesia, DPR, and BPK, if its suggestions proposing changes are ignored.”
4. Law No. 17/2003 on State Finances:
a. Article 1 number 1 states “State Finances are all state rights and responsibilities that can be valued monetarily, as well as everything either in the form of currency or goods that can be made state property in relation to performing these rights and responsibilities.”
b. Article 2 states: “State Finances as provided in Article 1 number 1 and Article 2 letter (i) include: Assets of other parties secured by using facilities provided by the Government.”
5. United Nations Convention Against Corruption (UNCAC), Article 12, which has been ratified by Law No. 7/2006 on the Ratification of the United Nations Convention Against Corruption states that: “Each State Party shall take measures, in accordance with the fundamental principles of its domestic law, to prevent corruption involving the private sector, enhance accounting and auditing standards in the private sector and, where appropriate, provide effective, proportionate and dissuasive civil, administrative or criminal penalties for failure to comply with such measures.”
6. KPK Strategic Plan 2011–2015 designates the Natural Resources/Energy Security sector as one focus for corruption eradication. The forestry sector constitutes one such sector under this category.
7. The Joint Memorandum of Understanding on the National Movement to Save Indonesia’s Natural Resources signed by 27 ministries/agencies and 34 provincial governments on 19 March 2015.
8. The Declaration to Save Indonesia’s Natural Resources, signed by the Commander of the Armed Forces, the Chief of Police, the Attorney General, and the KPK Chair on 19 March 2015.
5
1.4 Purpose of the study
This study aims to:
1. Identify fundamental problems with the forestry sector’s non-tax revenue collection system.
2. Calculate potential state losses from the forestry sector resulting from weaknesses in the non-tax revenue management system.
3. Produce recommendations for improving the non-tax revenue management system in the forestry sector.
1.5 Scope of the study
The study analyzes the Government’s non-tax revenue collection system and state losses associated with
unreported timber production from Indonesia’s natural forests during the period 2003–2014.
1.6 Methodology
To address these issues, the study uses a quantitative model to estimate actual timber production from natural
forests, including both reported and unreported harvests, during 2003–2014. These estimates are derived using
conservative assumptions for areas harvested and productivity levels achieved in each of Indonesia’s major
timber producing regions (reported by major island). To the extent possible, these assumptions have been
based on data published both by Government agencies, particularly the Ministry of Environment and Forestry,
and by independent technical analyses (further details are described in Chapter Three below). This model is
used to generate two estimates (Estimate 1 and Estimate 2) of overall timber production based on conservative
assumptions for timber productivity levels and production areas.
Based on timber production volumes generated by this model, the study then calculates the amounts of DR and
PSDH that should have been collected under Indonesian law at prevailing rates during 2003–2014. Again, these
figures are presented as two estimates, both of which are based on conservative assumptions. To quantify state
losses from under-collection of PNBP forest revenues, the Government’s reported receipts of DR and PSDH are
subtracted from each of these estimates of potential DR and PSDH that should have been collected.
The study estimates the domestic market value of the unreported timber production by multiplying the volumes
of unreported large- and small-diameter logs by the annual average market prices for each grade. For large-
diameter logs, prices are obtained from reports published by the International Tropical Timber Organization
(ITTO); and for small-diameter pulp logs, prices are obtained from Wood Resource Quarterly, a proprietary data
provider. The study then uses these estimates of market value to calculate state losses associated with unreported
timber production.
To better understand how such large volumes of logs could go unreported and such significant amounts of
PNBP could go uncollected during the study period, the report then presents a detailed institutional analysis of
the Government’s timber production reporting and PNBP revenue collection systems in the forestry sector. This
analysis is based on a careful review of Government laws and regulations that considers three main variables:
1) performance, relating to the institutional and regulatory capacity to implement policies, including through
sanctions and law enforcement; 2) policy making, used to evaluate objective conditions and opportunities
for discretion in policies; and 3) transparency and conflicts of interest, to assess the accountability of related
policies. Within the KPK, such studies of laws and regulations with these variables are called Corruption Impact
Assessments (CIA).
C H A P T E R 1: I N T R O D U C T I O N
P R E V E N T I N G S TAT E LO S S E S I N I N D O N E S I A’S F O R E S T RY S E C TO R6
To further verify this analysis, the study team also interviewed key informants at the national, provincial
and district levels in Central Kalimantan, East Kalimantan, and Riau; and conducted an analysis of published
and unpublished data obtained from the Ministry of Environment and Forestry, regional forestry agencies
(Dinas Kehutanan) from provinces across Indonesia, Dinas Kehutanan in select districts (kabupaten) in the
abovementioned provinces; and reviewed relevant audit reports prepared by BPK, the state’s Supreme
Audit Agency.
Finally, the study presents a number of recommendations for strengthening the Government’s timber production
reporting and PNBP forest revenue collection systems. These recommendations have been discussed with key
informants at the national, provincial, and district levels, and have been refined based on feedback received.
1.7 Study implementation
The study has been implemented in 2015 with a breakdown of activities as follows:
Table 1.1. Study stages and schedule
NO. STUDY STAGE SCHEDULE
1 Preparation of Terms of Reference for the study January 2015
2 Study kick-off meeting February 2015
3 Data and information collection February–August 2015
3a Meeting with the Indonesian Forest Concessionaires Association (APHI) 30 March 2015
3b Meeting with OPN team at Badan Pengawasan Keuangan dan Pembangunan (BPKP)
30 March 2015
3c Meeting with the Secretary General of the Ministry of Environment and Forestry
17 April 2015
3d Meeting with the Director General of Budgeting, Ministry of Finance 17 April 2015
3e Meeting with the Director General of State Assets, Ministry of Finance 17 April 2015
3f Meeting with Main Auditor IV – Supreme Audit Agency (BPK) 17 April 2015
4a Field studies
4b Field study in Central Kalimantan 7–10 April 2015
4c Field study in East Kalimantan 26 April–30 April 2015
4d Field study in Riau 6 May–8 May 2015
5 Data analysis May–August 2015
6 Report preparation August–September 2015
7 Exit meeting 27 August 2015
8 Internal review of findings 9 September 2015
9 External release of the study 9 October 2015
10 Action plan agreement November–December 2015
7
Section I: Estimating state losses from unreported timber production
P R E V E N T I N G S TAT E LO S S E S I N I N D O N E S I A’S F O R E S T RY S E C TO R8
Chapter 2: Estimating the volume of actual timber production from Indonesia’s natural forestsIn exercising administrative control over the nation’s Forest Estate, the Ministry of Environment and Forestry
(Kementerian Lingkungan Hidup dan Kehutanan, or KLHK) holds far-reaching authority for defining the functional
classification of forestlands and determining who may have access to these. Since Indonesia’s regional autonomy
laws took effect in the early 2000s, the Ministry has shared significant components of this authority with regional
government forestry agencies (Dinas Kehutanan) at the provincial and district levels. For areas designated for
timber production and/or conversion to other land uses, the Ministry and regional forestry agencies share
responsibility for issuing licenses to commercial logging companies, monitoring timber production, and
collecting various non-tax forest revenues on the volumes of logs harvested.
In carrying out these functions, the Ministry and regional forestry agencies also have a responsibility to compile
and publish accurate forestry statistics, including timber production figures. The publication of these statistics
represents an essential form of public accountability as it is these institutions that oversee the management
and exploitation of Indonesia’s forest resources. In recent years, however, as the nation’s deforestation rate has
accelerated, a growing body of evidence has suggested that the official statistics on timber production and forest
conversion may significantly underestimate the actual log volumes harvested and forest areas cleared.
This chapter summarizes the Ministry of Environment and Forestry’s reported timber production levels for
the period 2003–2014, including volumes harvested both through selective logging and land clearing. It then
describes the methods, data, and assumptions used by the study’s model to estimate actual timber production
for this period. The model presents two scenarios, a lower-end estimate (Estimate 1) and a higher-end estimate
(Estimate 2), both of which are based on available data and conservative assumptions concerning areas
harvested and per hectare productivity levels. Results indicate that the Ministry’s figures for reported timber
production grossly underestimate the volumes of logs that were actually harvested in Indonesia during the
study period.
2.1 State administration of timber production
In administering the nation’s forest resources, the Ministry of Environment and Forestry and regional
governments have prioritized commercial exploitation of timber, classifying nearly 60 percent of the Forest
Estate as Production Forest (Hutan Produksi) (Directorate General of Forestry Planology 2012). From the
late 1960s through the early 2000s, commercial logging was largely carried out through the HPH (Hak
Pengusahaan Hutan) timber concession system. During this period, the Ministry allocated over 600 commercial
timber concessions, covering an aggregate area of nearly 65 million ha, to state-owned and privately-held
logging companies.
Under Indonesia’s ‘selective logging and replanting’ (Tebang Pilih dan Tanam Indonesia, or TPTI) guidelines, HPH
license holders are allowed to harvest trees above 30 centimeters (cm) in diameter at approved logging sites on
a 35-year rotation. After harvest, concession holders are supposed to carry out enrichment planting within their
cutting blocks in order to encourage regrowth. In theory, the TPTI guidelines have been designed to ensure that
HPH holders manage the forests within their concession areas on a sustainable basis, allowing them to return
9CHAPTER 2: ESTIMATING THE VOLUME OF AC TUAL TIMBER PRODUC TION
FROM INDONESIA’S NATURAL FORESTS
to previously-logged sites every 35 years and to harvest these productively over multiple rotations. In practice,
however, relatively few HPH holders have succeeded in managing their concessions sustainably over the long
term. Overall, reported timber production levels from the HPH system have declined steadily from a peak of more
than 20 million cubic meters (m3) in the early 1990s to 5.3 million m3 in 2014.
Since the mid-1990s, a growing portion of Indonesia’s commercial wood production has come from natural forest
conversion. The Ministry of Forestry and regional governments have facilitated this process by allocating millions
of hectares of degraded natural forests for the development of industrial timber and pulpwood plantations
(Hutan Tanaman Industri, HTI) and for conversion to other commercial land uses, including oil palm estates
and mining operations. In these areas, companies holding HTI licenses or IPK (Izin Pemanfaatan Kayu) ‘wood
utilization permits’ are allowed to clear-fell all standing natural forest timber before the sites are developed for
alternate land uses.1 Analysis of KLHK forestry statistics suggests that commercial wood production from land
clearing has grown sharply in recent years, rising from 2.8 million m3 in 2008 to 19.1 million m3 in 2011.
This increase in wood production from land clearing is not readily apparent in statistics published by KLHK. In
2010, according to Statistik Kehutanan (Table IV. 6.1), 14,488,152 m3 of timber came from ‘IPK/ILS’ wood-utilization
permits (i.e. effectively permits to harvest wood during land-clearing operations). However, in 2011 the figure fell
to 600,598 m3. But also in 2011 there was a sharp increase in a category called ‘Sumber Lainnya’ (‘Other Sources’)
to 21,786,505 m3 from 3,720,785 m3 the previous year (2010). In Table IV. 6.2 of Statistik Kehutanan, the ‘Sumber
Lainnya’ (‘Other Sources’) category is divided into three sub-categories: ‘Hutan Rakyat’ (‘Community Forest’), ‘Kayu
Perkebunan’ (‘Wood from Estate Crops’) and ‘Lainnya’ (‘Other’). In 2011, total production for the ‘Lainnya’ (‘Other’)
category was 18,530,228 m3. This study considers this volume to be timber produced from land clearing, which in
previous years was categorized as ‘IPK/ILS’.
To calculate the total volume of timber originating from land clearing in 2011 – and in subsequent years – the
study added this figure to the volume reported as ‘IPK/ILS’ (600,598 m3 in 2011). For 2013, however, Table IV. 6.1.
in Statistik Kehutanan 2013 only reports volumes of timber produced from HPH concessions and HTI plantations,
and does not include production from other categories. Consequently, this study uses the 7,951,705 m3 reported
in the RPBBI industrial wood supply report under the category ‘Land Preparation for HTI’ (‘Penyiapan Lahan untuk
HTI’), and adds it to the 949,607 m3 categorized as IPK/ILS in the same report. The resulting figure of 8,901,312 m3
is the reported production volume for land clearing in 2013.
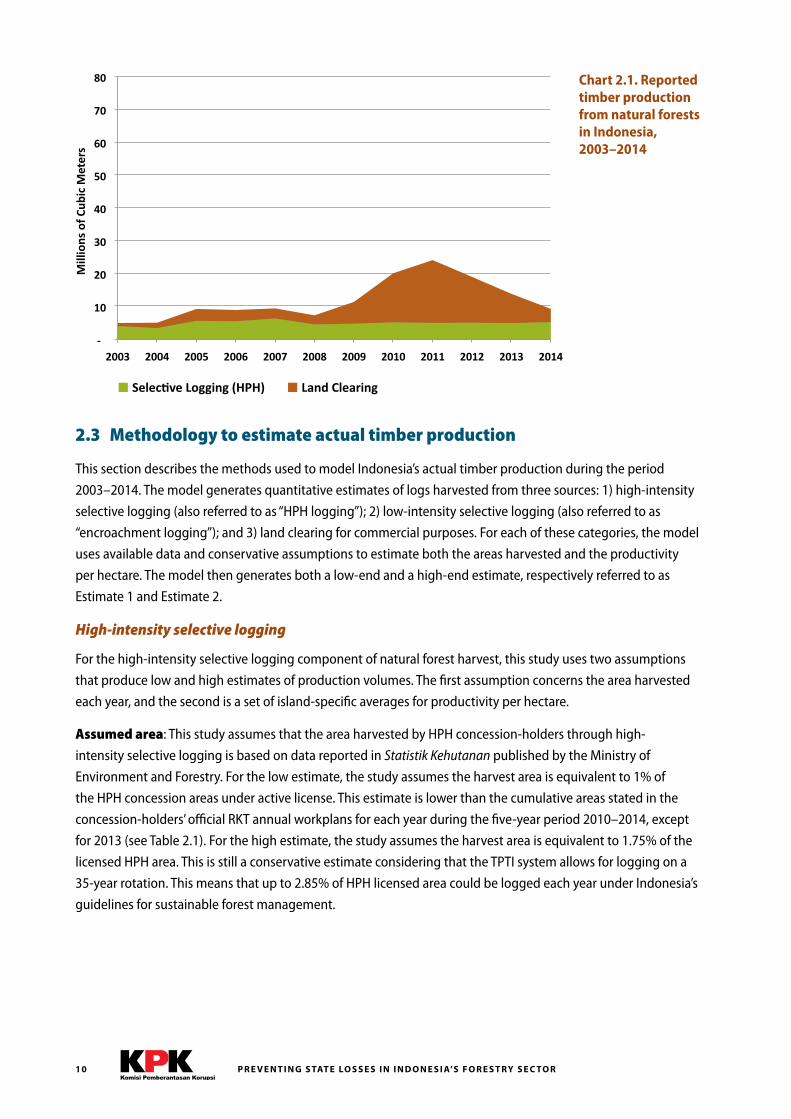
2.2 Reported timber production during 2003–2014
According to Ministry statistics, timber production from natural forests in Indonesia during the twelve-year
period 2003–2014 reached 143.7 million m3, or an average of 12.0 million m3 per year. This timber is reported to
have been sourced from natural forests, either through selective logging or land clearing (see Chart 2.1). Through
this period, the Ministry reports that selective logging from HPH concession holders remained relatively steady,
ranging between 3.5 and 6.4 million m3 per year. By contrast, commercial wood produced through land clearing
is reported to have risen sharply in recent years, despite the Government’s moratorium on forest and peatland
conversion since May 2011.
1 Degraded forests, in the Indonesian definition is anything that is not “primary forest”, or completely untouched by logging or other anthropogenic changes. Often, these “degraded” forests still have significant timber standing stock. As Gunarso et al. (2013) explain, “The conversion of forest in Kalimantan is a step-wise process where undisturbed forest is impacted by logging, which is sometimes followed by wildfire that further degrades areas into shrub land. The establishment of plantations or crops is largely the consequence of the conversion of disturbed forest or shrub land; this trajectory of degradation prior to conversion occurs on both upland and swamp habitats.”
P R E V E N T I N G S TAT E LO S S E S I N I N D O N E S I A’S F O R E S T RY S E C TO R10
-‐
10
20
30
40
50
60
70
80
2003 2004 2005 2006 2007 2008 2009 2010 2011 2012 2013 2014
Selec1ve Logging (HPH) Land Clearing
Chart 2.1. Reported timber production from natural forests in Indonesia, 2003–2014
2.3 Methodology to estimate actual timber production
This section describes the methods used to model Indonesia’s actual timber production during the period
2003–2014. The model generates quantitative estimates of logs harvested from three sources: 1) high-intensity
selective logging (also referred to as “HPH logging”); 2) low-intensity selective logging (also referred to as
“encroachment logging”); and 3) land clearing for commercial purposes. For each of these categories, the model
uses available data and conservative assumptions to estimate both the areas harvested and the productivity
per hectare. The model then generates both a low-end and a high-end estimate, respectively referred to as
Estimate 1 and Estimate 2.
High-intensity selective logging
For the high-intensity selective logging component of natural forest harvest, this study uses two assumptions
that produce low and high estimates of production volumes. The first assumption concerns the area harvested
each year, and the second is a set of island-specific averages for productivity per hectare.
Assumed area: This study assumes that the area harvested by HPH concession-holders through high-
intensity selective logging is based on data reported in Statistik Kehutanan published by the Ministry of
Environment and Forestry. For the low estimate, the study assumes the harvest area is equivalent to 1% of
the HPH concession areas under active license. This estimate is lower than the cumulative areas stated in the
concession-holders’ official RKT annual workplans for each year during the five-year period 2010–2014, except
for 2013 (see Table 2.1). For the high estimate, the study assumes the harvest area is equivalent to 1.75% of the
licensed HPH area. This is still a conservative estimate considering that the TPTI system allows for logging on a
35-year rotation. This means that up to 2.85% of HPH licensed area could be logged each year under Indonesia’s
guidelines for sustainable forest management.
Mill
ions
of C
ubic
Met
ers
11CHAPTER 2: ESTIMATING THE VOLUME OF AC TUAL TIMBER PRODUC TION
FROM INDONESIA’S NATURAL FORESTS
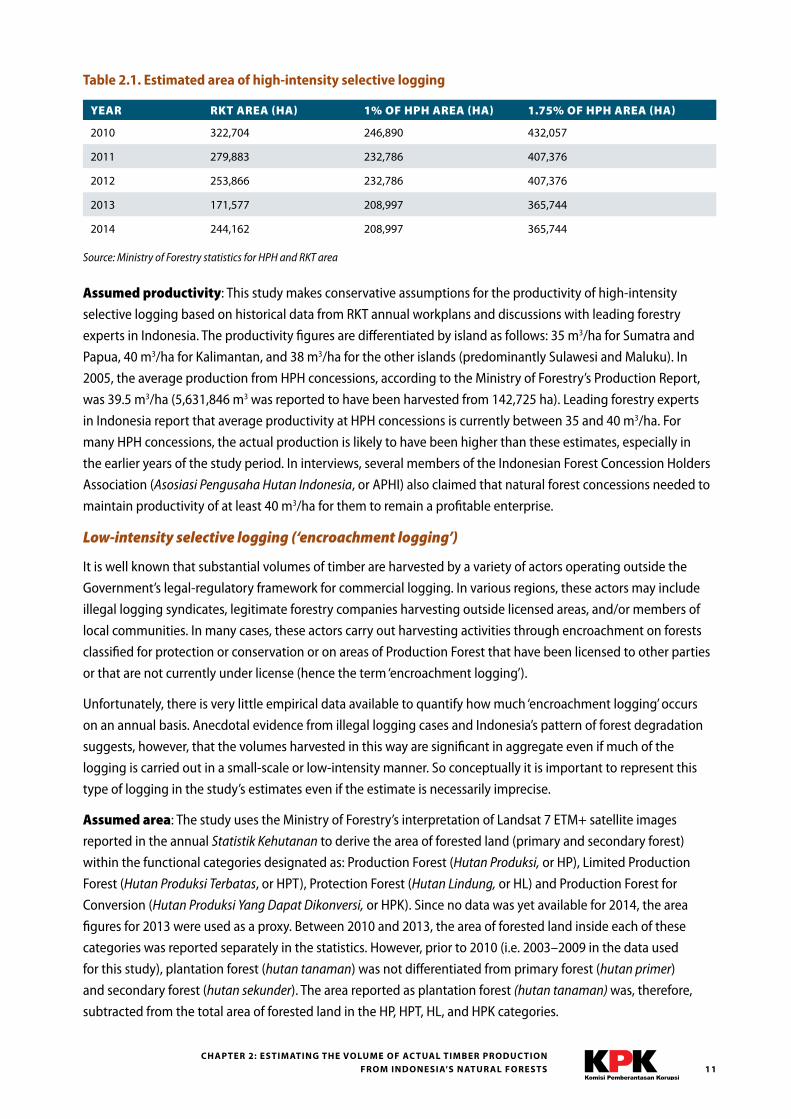
Table 2.1. Estimated area of high-intensity selective logging
YEAR RKT AREA (HA) 1% OF HPH AREA (HA) 1.75% OF HPH AREA (HA)
2010 322,704 246,890 432,057
2011 279,883 232,786 407,376
2012 253,866 232,786 407,376
2013 171,577 208,997 365,744
2014 244,162 208,997 365,744
Source: Ministry of Forestry statistics for HPH and RKT area
Assumed productivity: This study makes conservative assumptions for the productivity of high-intensity
selective logging based on historical data from RKT annual workplans and discussions with leading forestry
experts in Indonesia. The productivity figures are differentiated by island as follows: 35 m3/ha for Sumatra and
Papua, 40 m3/ha for Kalimantan, and 38 m3/ha for the other islands (predominantly Sulawesi and Maluku). In
2005, the average production from HPH concessions, according to the Ministry of Forestry’s Production Report,
was 39.5 m3/ha (5,631,846 m3 was reported to have been harvested from 142,725 ha). Leading forestry experts
in Indonesia report that average productivity at HPH concessions is currently between 35 and 40 m3/ha. For
many HPH concessions, the actual production is likely to have been higher than these estimates, especially in
the earlier years of the study period. In interviews, several members of the Indonesian Forest Concession Holders
Association (Asosiasi Pengusaha Hutan Indonesia, or APHI) also claimed that natural forest concessions needed to
maintain productivity of at least 40 m3/ha for them to remain a profitable enterprise.
Low-intensity selective logging (‘encroachment logging’)
It is well known that substantial volumes of timber are harvested by a variety of actors operating outside the
Government’s legal-regulatory framework for commercial logging. In various regions, these actors may include
illegal logging syndicates, legitimate forestry companies harvesting outside licensed areas, and/or members of
local communities. In many cases, these actors carry out harvesting activities through encroachment on forests
classified for protection or conservation or on areas of Production Forest that have been licensed to other parties
or that are not currently under license (hence the term ‘encroachment logging’).
Unfortunately, there is very little empirical data available to quantify how much ‘encroachment logging’ occurs
on an annual basis. Anecdotal evidence from illegal logging cases and Indonesia’s pattern of forest degradation
suggests, however, that the volumes harvested in this way are significant in aggregate even if much of the
logging is carried out in a small-scale or low-intensity manner. So conceptually it is important to represent this
type of logging in the study’s estimates even if the estimate is necessarily imprecise.
Assumed area: The study uses the Ministry of Forestry’s interpretation of Landsat 7 ETM+ satellite images
reported in the annual Statistik Kehutanan to derive the area of forested land (primary and secondary forest)
within the functional categories designated as: Production Forest (Hutan Produksi, or HP), Limited Production
Forest (Hutan Produksi Terbatas, or HPT), Protection Forest (Hutan Lindung, or HL) and Production Forest for
Conversion (Hutan Produksi Yang Dapat Dikonversi, or HPK). Since no data was yet available for 2014, the area
figures for 2013 were used as a proxy. Between 2010 and 2013, the area of forested land inside each of these
categories was reported separately in the statistics. However, prior to 2010 (i.e. 2003–2009 in the data used
for this study), plantation forest (hutan tanaman) was not differentiated from primary forest (hutan primer)
and secondary forest (hutan sekunder). The area reported as plantation forest (hutan tanaman) was, therefore,
subtracted from the total area of forested land in the HP, HPT, HL, and HPK categories.
P R E V E N T I N G S TAT E LO S S E S I N I N D O N E S I A’S F O R E S T RY S E C TO R12
For all years in the data set, the high estimate for high-intensity logging area (1.75% of HPH licensed area) is
subtracted from the total area of forested land, so as not to double-count any of the land in both the high-
intensity and low-intensity logging categories. With this modification, the estimated forested land area that is
vulnerable to ‘encroachment logging’ is around 70 million ha.
Assumed productivity: This study assumes that logging occurred on less than 3% of the area vulnerable to
encroachment logging at a production rate of 5 m3/ha/yr. Under these assumptions, annual production from this
low-intensity ‘encroachment logging’ is around 10 million m3. It must be emphasized that this is a crude estimate
based on minimal data. It is very possible that some kind of logging occurred on more or less than 3% of this area
in any given year, and that in many places considerably more than 5 m3/ha was logged.
Forest land clearing
The land clearing component of natural forest timber production in Indonesia is difficult to model because there
is sparse historical data available with which to estimate the volumes of logs produced per hectare. Land clearing
occurs on forested areas that range across the spectrum from largely untouched primary forests to severely
degraded forests on which unsustainable logging practices have left few trees standing.
There is too little information in the public domain about the standing stock and commercial timber yield from
land clearing to know how much of the land clearing has occurred on intact primary forest, primary forest that
has been selectively logged (often referred to as ‘secondary forest’ in the Indonesian context), and degraded
forest, which could allow production rates to be differentiated and applied to the relevant area measurements.
In an effort to capture the range of forest landscapes, this study therefore uses average production rates
differentiated by island.
Assumed area: An estimate of the area of land clearing from which commercial timber was harvested is
derived from Margono et al.’s 2014 study on deforestation in Indonesia between 2000 and 2012. It should be
noted, however, that not all deforestation or forest land clearing supplied timber to commercial markets. Forest
fires, for instance, generally destroy the timber in areas that are burned. Similarly, much of the timber from
deforestation carried out by rural small-holders is used for subsistence purposes like building houses and fires for
cooking/heating.
This study considers that between 70% and 80% of the land deforested in Indonesia produces timber that
enters the commercial wood supply. These two percentages form low and high estimates for the area on which
commercial timber is produced from land clearing. This includes deforestation from commercial oil palm and
rubber development (both large- and small-scale), coal mining, as well as HTI plantation development for
pulpwood. The aggregate estimates for deforestation caused by those land uses exceed 80% of the deforestation
rate, so the range between 70% and 80% is considered to be a conservative estimate of the total forest area
cleared for commercial purposes (Abood et al. 2014).
The loss of forest cover during this time period was much greater (exceeding 1,000,000 ha/year) than the area
measurements used in this study (Hansen et al. 2013). But not all the forest cover loss in Indonesia is from
natural forest, just as not all of the timber from natural forest loss enters the commercial wood supply. Forestland
cleared by local communities for farming is often used by those communities for subsistence purposes (building
materials and household fires) or sold locally. Some timber, mainly small-diameter logs and non-commercial
species, is also sometimes left in the forest when its commercial value is not worth the cost of extraction. In
addition, forest fires damage or destroy the timber in forests that are burnt.
13CHAPTER 2: ESTIMATING THE VOLUME OF AC TUAL TIMBER PRODUC TION
FROM INDONESIA’S NATURAL FORESTS
Still, the conversion of forests to oil palm plantations and fast-growing plantations for pulp and paper mills
were the main cause of deforestation in Indonesia during the study period. A 2013 study on oil palm and land-
use change found that in Sumatra, Kalimantan, and Papua between 2000 and 2005, oil palm concessions grew
by 1,477,000 ha, and that between 2006 and 2010 oil palm concessions increased by 2,569,000 ha (Gunarso
et al. 2013). Furthermore, 66% of the oil palm plantation expansion between 2000 and 2005 occurred on land
previously converted for agroforestry and plantations. In the latter period between 2005 and 2010, only 14% of
the palm oil expansion occurred on land previously used for agroforestry or plantations.
The difference between those two periods is that in the first much of the oil palm expansion occurred in Sumatra,
where there were higher levels of past land-use change. In the second period, oil palm expansion accelerated in
Kalimantan where there was greater conversion of natural habitat, much of which was undisturbed and disturbed
forest and upland shrub and grassland (which can have significant timber biomass). So, for oil palm plantations,
both the rate of expansion and the rate of natural habitat conversion were increasing across the time period.
One way to parse out commercially harvested land clearing from all deforestation is to assume that much of the
wood harvested from land clearing on industrial HTI and/or mining concessions is sold commercially. A study in
2014 mapped concession areas over forest loss in Indonesia between 2000 and 2010 and found that of a total
14.7 million ha of deforestation, 6.6 million ha2 occurred inside industrial concessions (Abood et al. 2014). This
equates to an annual average of forest loss inside industrial concessions of 660,000 ha/yr.
Margono et al. (2014) finds that Indonesia’s deforestation rate increased from 209,000 ha in 2001 to 839,000 ha in
2012. This contradicts the argument that most deforestation between 2000 and 2010 was the result of large-scale
forest clearing occurring during the decentralization period in the early 2000s. Though Abood et al. (2014) does
not present deforestation figures broken down by year, their analysis does suggest – especially when considered
alongside Margono et al. (2014) – that deforestation increased during the latter part of the study period,
although it occurred at an average rate of 660,000 ha/yr.
Many have argued that deforestation rates spiked in the few years directly following the fall of Suharto and
beginning of reformasi and decentralization. This view would advise weighting annual averages of forest loss
towards the beginning part of the period in the study. However, the acceleration in the expansion of oil palm and
pulp plantation concessions to the present time actually suggests that forest loss within industrial concessions
occurred at a greater annual rate towards the latter part of the study period.
Assumed productivity: Average timber production rates differentiated by island are based on standing stock
data from permanent sample plots reported by the Ministry of Forestry in Statistik Kehutanan 2011. The figures
used are from 1996–2009 and were reported for permanent sample plots by province for volume in cubic meters
per hectare (m3/ha) (see Table 2.2). The volume figures are reported for standing stock with diameter at breast
height (DBH) in the following categories: 20 cm and up, 50 cm and up, and 60 cm and up.
To estimate the commercial standing stock, the study relied on the advice of Indonesia forestry experts to use
70% of the total standing stock as the volume of merchantable timber. This yielded average production rates of
65 m3/ha in Sumatra, 76 m3/ha in Kalimantan, 87 m3/ha in Papua, and 81 m3/ha in Sulawesi and Maluku.
Also, since there are different DR and PSDH rates for small- and large-diameter timber, the study divided the
commercial standing stock into categories of 30 cm in diameter and above, and below 30 cm. It is assumed that
2 Of the 6.6 million ha of forest loss inside industrial concessions, 4.9 million ha was lowland forest, while the remainder was peat swamp forest.
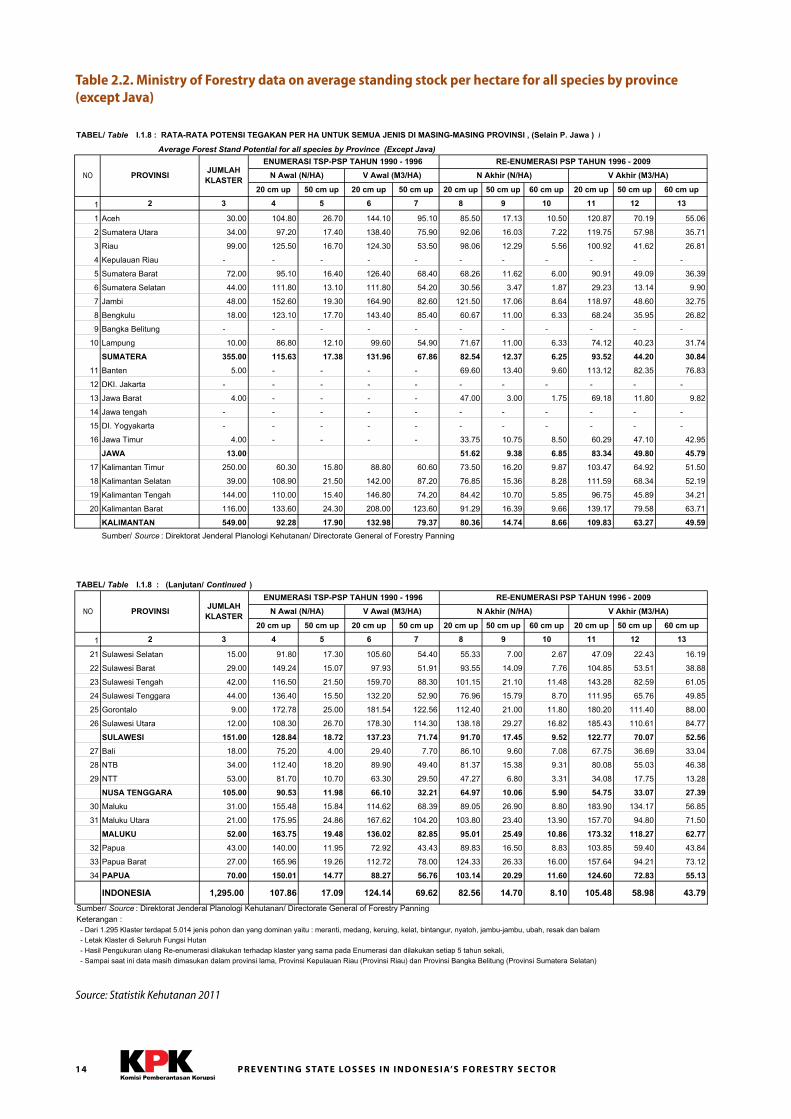
P R E V E N T I N G S TAT E LO S S E S I N I N D O N E S I A’S F O R E S T RY S E C TO R14
31
TABEL/ Table I.1.8 : RATA-RATA POTENSI TEGAKAN PER HA UNTUK SEMUA JENIS DI MASING-MASING PROVINSI , (Selain P. Jawa ) /
Average Forest Stand Potential for all species by Province (Except Java)
20 cm up 50 cm up 20 cm up 50 cm up 20 cm up 50 cm up 60 cm up 20 cm up 50 cm up 60 cm up
1 2 3 4 5 6 7 8 9 10 11 12 13
1 Aceh 30.00 104.80 26.70 144.10 95.10 85.50 17.13 10.50 120.87 70.19 55.06
2 Sumatera Utara 34.00 97.20 17.40 138.40 75.90 92.06 16.03 7.22 119.75 57.98 35.71
3 Riau 99.00 125.50 16.70 124.30 53.50 98.06 12.29 5.56 100.92 41.62 26.81
4 Kepulauan Riau - - - - - - - - - - -
5 Sumatera Barat 72.00 95.10 16.40 126.40 68.40 68.26 11.62 6.00 90.91 49.09 36.39
6 Sumatera Selatan 44.00 111.80 13.10 111.80 54.20 30.56 3.47 1.87 29.23 13.14 9.90
7 Jambi 48.00 152.60 19.30 164.90 82.60 121.50 17.06 8.64 118.97 48.60 32.75
8 Bengkulu 18.00 123.10 17.70 143.40 85.40 60.67 11.00 6.33 68.24 35.95 26.82
9 Bangka Belitung - - - - - - - - - - -
10 Lampung 10.00 86.80 12.10 99.60 54.90 71.67 11.00 6.33 74.12 40.23 31.74
SUMATERA 355.00 115.63 17.38 131.96 67.86 82.54 12.37 6.25 93.52 44.20 30.84
11 Banten 5.00 - - - - 69.60 13.40 9.60 113.12 82.35 76.83
12 DKI. Jakarta - - - - - - - - - - -
13 Jawa Barat 4.00 - - - - 47.00 3.00 1.75 69.18 11.80 9.82
14 Jawa tengah - - - - - - - - - - -
15 DI. Yogyakarta - - - - - - - - - - -
16 Jawa Timur 4.00 - - - - 33.75 10.75 8.50 60.29 47.10 42.95
JAWA 13.00 51.62 9.38 6.85 83.34 49.80 45.79
17 Kalimantan Timur 250.00 60.30 15.80 88.80 60.60 73.50 16.20 9.87 103.47 64.92 51.50
18 Kalimantan Selatan 39.00 108.90 21.50 142.00 87.20 76.85 15.36 8.28 111.59 68.34 52.19
19 Kalimantan Tengah 144.00 110.00 15.40 146.80 74.20 84.42 10.70 5.85 96.75 45.89 34.21
20 Kalimantan Barat 116.00 133.60 24.30 208.00 123.60 91.29 16.39 9.66 139.17 79.58 63.71
KALIMANTAN 549.00 92.28 17.90 132.98 79.37 80.36 14.74 8.66 109.83 63.27 49.59Sumber/ Source : Direktorat Jenderal Planologi Kehutanan/ Directorate General of Forestry Panning
NO PROVINSI JUMLAHKLASTER
ENUMERASI TSP-PSP TAHUN 1990 - 1996 RE-ENUMERASI PSP TAHUN 1996 - 2009
N Awal (N/HA) V Awal (M3/HA) N Akhir (N/HA) V Akhir (M3/HA)
32 TABEL/ Table I.1.8 : (Lanjutan/ Continued )
20 cm up 50 cm up 20 cm up 50 cm up 20 cm up 50 cm up 60 cm up 20 cm up 50 cm up 60 cm up
1 2 3 4 5 6 7 8 9 10 11 12 13
21 Sulawesi Selatan 15.00 91.80 17.30 105.60 54.40 55.33 7.00 2.67 47.09 22.43 16.19
22 Sulawesi Barat 29.00 149.24 15.07 97.93 51.91 93.55 14.09 7.76 104.85 53.51 38.88
23 Sulawesi Tengah 42.00 116.50 21.50 159.70 88.30 101.15 21.10 11.48 143.28 82.59 61.05
24 Sulawesi Tenggara 44.00 136.40 15.50 132.20 52.90 76.96 15.79 8.70 111.95 65.76 49.85
25 Gorontalo 9.00 172.78 25.00 181.54 122.56 112.40 21.00 11.80 180.20 111.40 88.00
26 Sulawesi Utara 12.00 108.30 26.70 178.30 114.30 138.18 29.27 16.82 185.43 110.61 84.77
SULAWESI 151.00 128.84 18.72 137.23 71.74 91.70 17.45 9.52 122.77 70.07 52.56
27 Bali 18.00 75.20 4.00 29.40 7.70 86.10 9.60 7.08 67.75 36.69 33.04
28 NTB 34.00 112.40 18.20 89.90 49.40 81.37 15.38 9.31 80.08 55.03 46.38
29 NTT 53.00 81.70 10.70 63.30 29.50 47.27 6.80 3.31 34.08 17.75 13.28
NUSA TENGGARA 105.00 90.53 11.98 66.10 32.21 64.97 10.06 5.90 54.75 33.07 27.39
30 Maluku 31.00 155.48 15.84 114.62 68.39 89.05 26.90 8.80 183.90 134.17 56.85
31 Maluku Utara 21.00 175.95 24.86 167.62 104.20 103.80 23.40 13.90 157.70 94.80 71.50
MALUKU 52.00 163.75 19.48 136.02 82.85 95.01 25.49 10.86 173.32 118.27 62.77
32 Papua 43.00 140.00 11.95 72.92 43.43 89.83 16.50 8.83 103.85 59.40 43.84
33 Papua Barat 27.00 165.96 19.26 112.72 78.00 124.33 26.33 16.00 157.64 94.21 73.12
34 PAPUA 70.00 150.01 14.77 88.27 56.76 103.14 20.29 11.60 124.60 72.83 55.13
INDONESIA 1,295.00 107.86 17.09 124.14 69.62 82.56 14.70 8.10 105.48 58.98 43.79Sumber/ Source : Direktorat Jenderal Planologi Kehutanan/ Directorate General of Forestry Panning Keterangan : - Dari 1.295 Klaster terdapat 5.014 jenis pohon dan yang dominan yaitu : meranti, medang, keruing, kelat, bintangur, nyatoh, jambu-jambu, ubah, resak dan balam - Letak Klaster di Seluruh Fungsi Hutan - Hasil Pengukuran ulang Re-enumerasi dilakukan terhadap klaster yang sama pada Enumerasi dan dilakukan setiap 5 tahun sekali, - Sampai saat ini data masih dimasukan dalam provinsi lama, Provinsi Kepulauan Riau (Provinsi Riau) dan Provinsi Bangka Belitung (Provinsi Sumatera Selatan)
NO N Akhir (N/HA) V Akhir (M3/HA)PROVINSI JUMLAHKLASTER
ENUMERASI TSP-PSP TAHUN 1990 - 1996 RE-ENUMERASI PSP TAHUN 1996 - 2009
N Awal (N/HA) V Awal (M3/HA)
Table 2.2. Ministry of Forestry data on average standing stock per hectare for all species by province (except Java)
Source: Statistik Kehutanan 2011
15
one-half of the standing stock in this range is below 30 cm in diameter (Kayu Bulat Kecil, or KBK) and one-half of it
is 30 cm and above (Kayu Bulat, or KB). This 50:50 split is intentionally a conservative estimate so as to be sure not
to overestimate the volume of KB, which carries substantially higher DR and PSDH rates.
The only exception to this methodology is the standing stock calculated for Sumatra. Since almost all of
Indonesia’s pulp mills are located in Sumatra, the demand for KBK small-diameter timber is higher there than in
other regions. So it is assumed that KBK accounts for a higher percentage of overall production from land clearing
activities relative to the other islands. The study estimates that commercial stock in Sumatra is 85% of total
standing stock, or 79.5 m3/ha. The study assumes that 60% or 47.5 m3/ha of this standing stock is KBK, while 40%
or 32 m3/ha is KB.
As a point of comparison, a 2005 CIFOR study on the conversion of land for pulpwood plantations in Sumatra
documented mixed tropical hardwood (MTH) yields from land-clearing at four HTI concessions that were all in
excess of 90 m3/ha, and in some cases in excess of 120 m3/ha (Maturana 2005).
A 2002 workplan for clearing 49,500 ha of forest in Central Kalimantan, half of which was primary forest and the
other half forest degraded from mining activities, illustrates high commercial stocking rates and indicates that
estimates used in this study are conservative for both primary and degraded forests. In the commercial work
plan (Bagan Kerja Usaha Pemanfaatan Hasil Hutan Kayu Pada Hutan Alam) prepared in 2003 for PT Sarang Sapta
Putra, which cleared 49,500 ha of forest in Central Kalimantan, calculated yields on the half of the land area that
was primary forest exceeded 200 m3/ha of timber over 20 cm in diameter. On the other half of the land that was
degraded from mining activities, calculated yields exceeded 93 m3/ha.
A 2008 study by Jikalahari, a network of advocacy organizations promoting forest conservation in Riau, found
that the average timber yield from land clearing in seven HTI concessions in Riau was 89.56 m3/ha (based
on annual work plans, or Rencana Kerja Tahunan Bagan Kerja HTI IUPHHKHT, issued by the Governor of Riau).
The yields on the seven HTI concessions, which have a total area of 17,314 ha, ranged from 80.17 m3/ha to
108.25 m3/ha. Also in Riau province, annual logging plans (RKT) submitted in 2010 by HTI companies affiliated
with Indonesia’s two largest paper and pulp companies, Asia Pulp & Paper (APP) and Asia Pacific Resources
International Ltd. (APRIL), show that stocking rates towards the latter part of the study period are higher than the
productivity estimates used in this study. On the 112,914 ha of land to be cleared by the two groups, the average
timber commercial timber production was 92 m3/ha.
2.4 Actual timber production during 2003–2014 – Estimate 1
According to the model’s lower estimate (Estimate 1), Indonesia’s actual timber production from natural forests
totaled 630.1 million m3 during 2003–2014 (see Chart 2.2). This volume is 4.4 times higher than the volume
of reported production during this period (as shown by the red dotted line), suggesting that the Ministry of
Environment and Forestry’s production statistics captured less than 25 percent of the volumes of logs actually
harvested and that over 75 percent of total production went unreported (see Chart 2.2).
In Estimate 1, annual timber production from natural forests ranged from a low of 33.4 million m3 in 2003 to
a high of 64.8 million m3 in 2012 (see Chart 2.2). Over the course of the study period, the volume of timber
harvested through high-intensity selective logging fell from 10.3 million m3 in 2003 to 7.9 million m3 in 2014 as
the area of active HPH timber concessions experienced a slow, but steady decline. By contrast, the volumes of
timber harvested from land clearing rose sharply from a low of 13.2 million m3 in 2003 to a high of 46.1 million m3
in 2014. Of the volumes harvested from land clearing, 55 percent were small-diameter logs, mainly used for the
CHAPTER 2: ESTIMATING THE VOLUME OF AC TUAL TIMBER PRODUC TION FROM INDONESIA’S NATURAL FORESTS
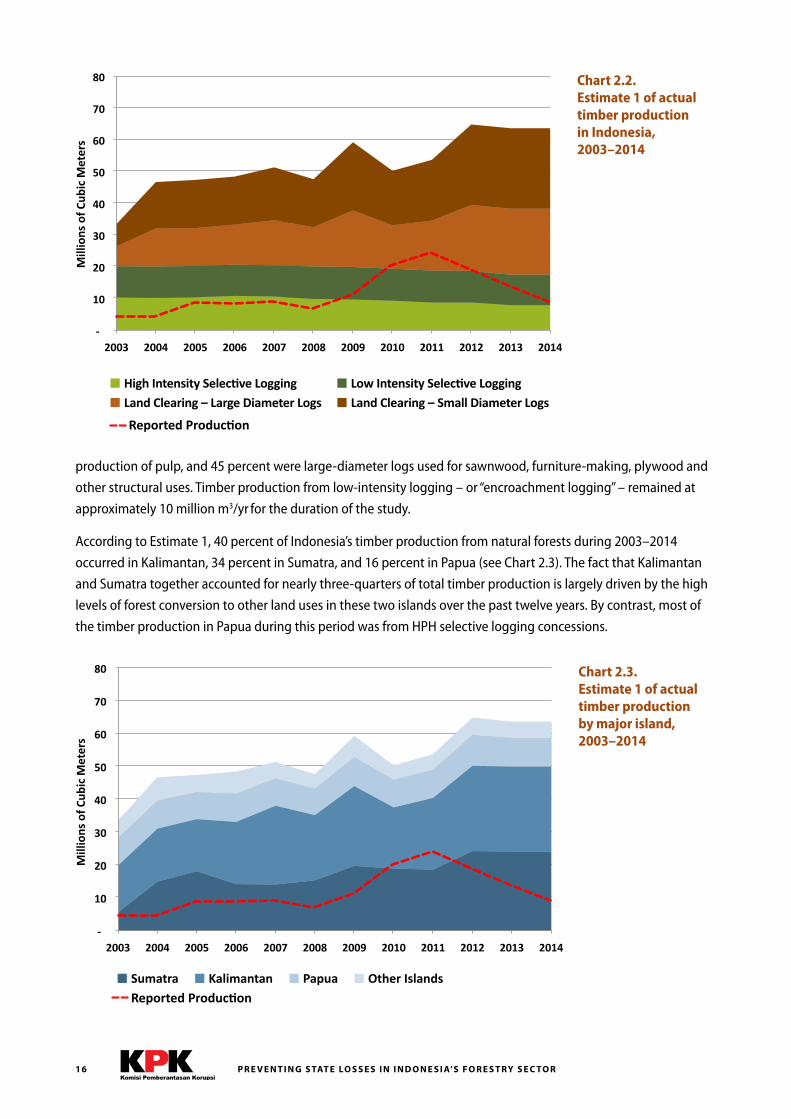
P R E V E N T I N G S TAT E LO S S E S I N I N D O N E S I A’S F O R E S T RY S E C TO R16
-‐
10
20
30
40
50
60
70
80
2003 2004 2005 2006 2007 2008 2009 2010 2011 2012 2013 2014
Sumatra Kalimantan Papua Other Islands
Reported Production
Chart 2.3. Estimate 1 of actual timber production by major island, 2003–2014
Mill
ions
of C
ubic
Met
ers
production of pulp, and 45 percent were large-diameter logs used for sawnwood, furniture-making, plywood and
other structural uses. Timber production from low-intensity logging – or “encroachment logging” – remained at
approximately 10 million m3/yr for the duration of the study.
According to Estimate 1, 40 percent of Indonesia’s timber production from natural forests during 2003–2014
occurred in Kalimantan, 34 percent in Sumatra, and 16 percent in Papua (see Chart 2.3). The fact that Kalimantan
and Sumatra together accounted for nearly three-quarters of total timber production is largely driven by the high
levels of forest conversion to other land uses in these two islands over the past twelve years. By contrast, most of
the timber production in Papua during this period was from HPH selective logging concessions.
-‐
10
20
30
40
50
60
70
80
2003 2004 2005 2006 2007 2008 2009 2010 2011 2012 2013 2014
High Intensity Selec:ve Logging Low Intensity Selec:ve Logging Land Clearing – Large Diameter Logs Land Clearing – Small Diameter Logs
Chart 2.2. Estimate 1 of actual timber production in Indonesia, 2003–2014
Mill
ions
of C
ubic
Met
ers
Reported Production
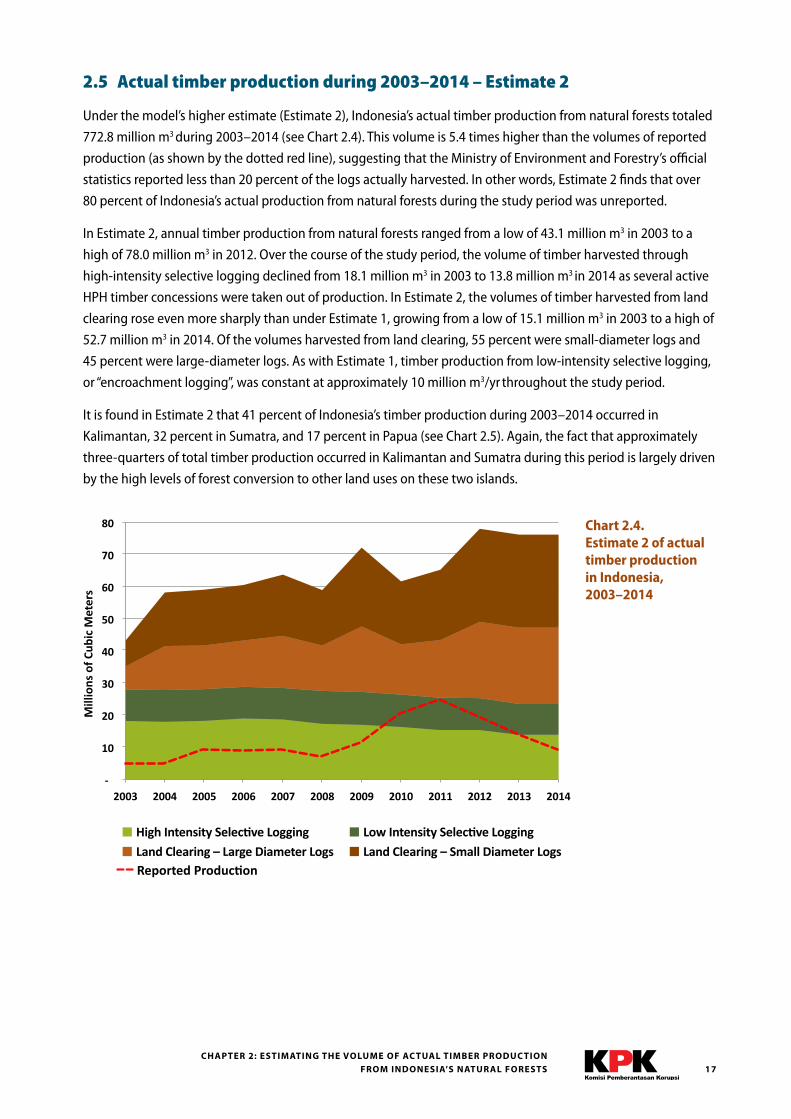
17
-‐
10
20
30
40
50
60
70
80
2003 2004 2005 2006 2007 2008 2009 2010 2011 2012 2013 2014
High Intensity Selec:ve Logging Low Intensity Selec:ve Logging
Land Clearing – Large Diameter Logs Land Clearing – Small Diameter Logs Reported Production
Chart 2.4. Estimate 2 of actual timber production in Indonesia, 2003–2014
Mill
ions
of C
ubic
Met
ers
CHAPTER 2: ESTIMATING THE VOLUME OF AC TUAL TIMBER PRODUC TION FROM INDONESIA’S NATURAL FORESTS
2.5 Actual timber production during 2003–2014 – Estimate 2
Under the model’s higher estimate (Estimate 2), Indonesia’s actual timber production from natural forests totaled
772.8 million m3 during 2003–2014 (see Chart 2.4). This volume is 5.4 times higher than the volumes of reported
production (as shown by the dotted red line), suggesting that the Ministry of Environment and Forestry’s official
statistics reported less than 20 percent of the logs actually harvested. In other words, Estimate 2 finds that over
80 percent of Indonesia’s actual production from natural forests during the study period was unreported.
In Estimate 2, annual timber production from natural forests ranged from a low of 43.1 million m3 in 2003 to a
high of 78.0 million m3 in 2012. Over the course of the study period, the volume of timber harvested through
high-intensity selective logging declined from 18.1 million m3 in 2003 to 13.8 million m3 in 2014 as several active
HPH timber concessions were taken out of production. In Estimate 2, the volumes of timber harvested from land
clearing rose even more sharply than under Estimate 1, growing from a low of 15.1 million m3 in 2003 to a high of
52.7 million m3 in 2014. Of the volumes harvested from land clearing, 55 percent were small-diameter logs and
45 percent were large-diameter logs. As with Estimate 1, timber production from low-intensity selective logging,
or “encroachment logging”, was constant at approximately 10 million m3/yr throughout the study period.
It is found in Estimate 2 that 41 percent of Indonesia’s timber production during 2003–2014 occurred in
Kalimantan, 32 percent in Sumatra, and 17 percent in Papua (see Chart 2.5). Again, the fact that approximately
three-quarters of total timber production occurred in Kalimantan and Sumatra during this period is largely driven
by the high levels of forest conversion to other land uses on these two islands.
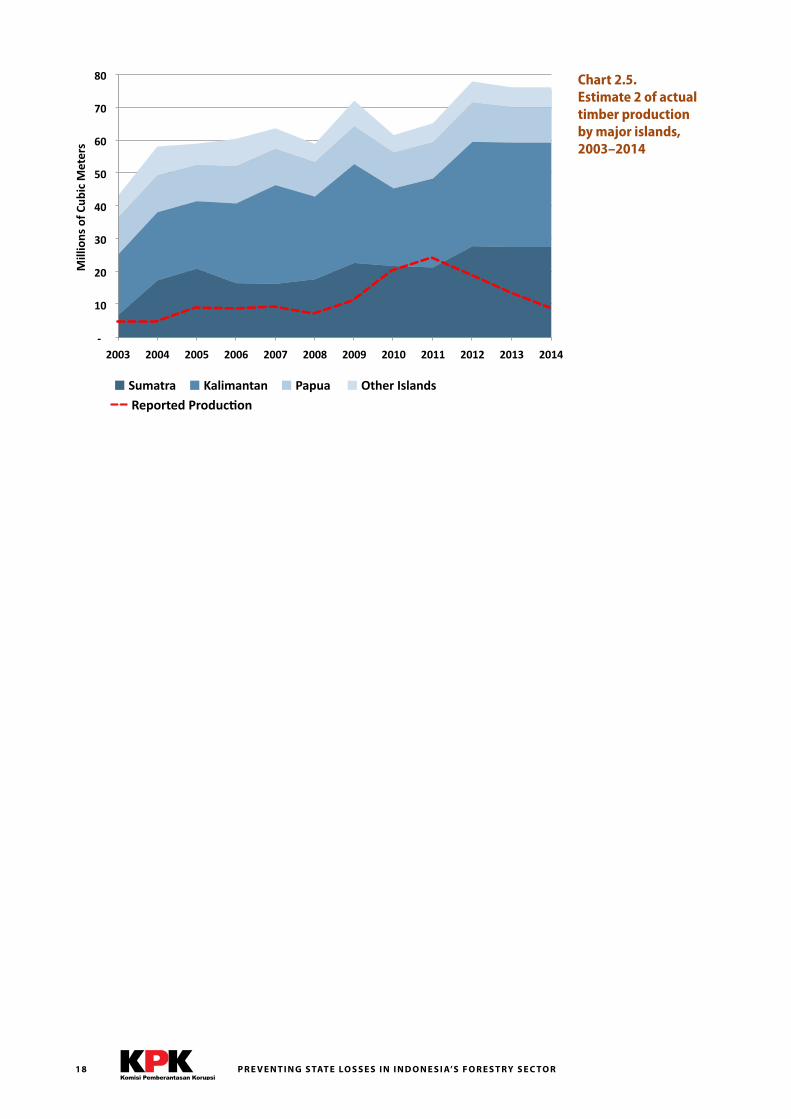
P R E V E N T I N G S TAT E LO S S E S I N I N D O N E S I A’S F O R E S T RY S E C TO R18
-‐
10
20
30
40
50
60
70
80
2003 2004 2005 2006 2007 2008 2009 2010 2011 2012 2013 2014
Sumatra Kalimantan Papua Other Islands
Reported Production
Chart 2.5. Estimate 2 of actual timber production by major islands, 2003–2014
Mill
ions
of C
ubic
Met
ers
19
Chapter 3: Calculating state losses from uncollected non-tax forest revenuesIn Indonesia, as in most timber producing countries, the Government collects a number of royalties, levies, and
fees on commercial logging operations within the nation’s Forest Estate. Some of these charges are based on the
area of forestland under permit to logging companies and other license-holders, while other charges are based
on the volume and value of timber harvested. Collectively, these non-tax state revenues, or PNBP, represent
the most direct legal mechanism through which the Government is able to capture monetary benefits from
commercial forestry and land-clearing activities. Since the early 2000s, the Government has collected on average
Rp. 3.0 trillion per year in PNBP receipts within the forestry sector.
This study’s estimate that unreported timber production during 2003–2014, on average, ranged between 40.5
million and 52.4 million m3 per year suggests the Government has failed to collect large amounts of PNBP forest
revenues that it should have collected under prevailing regulations. This chapter aims to calculate the state
losses associated with these uncollected PNBP forest revenues during this period. The analysis focuses on under-
collection of the sector’s two largest sources of non-tax revenues: the Reforestation Fund (Dana Reboisasi, or DR)
and the Forest Resource Provision (Provisi Sumber Daya Hutan, or PSDH).
By applying average DR and PSDH rates to the estimated volumes of timber actually harvested during the 12-year
study period, the model calculates the total amounts of DR and PSDH the Government should have collected.
These figures are then compared to reported receipts to determine the amount of revenues that the Government
failed to collect. It is calculated that state losses from uncollected DR and PSDH during 2003–2014 averaged
between US$ 539 million and US$ 749 million per year (Rp. 5.24 and 7.24 trillion per year).
3.1 Indonesia’s non-tax forest revenue system
In Indonesia’s forestry sector, the Ministry of Environment and Forestry collects various types of royalties, levies,
and fees from forest license holders, which are considered to be PNBP. Through the study period, the most
significant sources of non-tax forestry revenues include the following:
● Reforestation Fund (DR): a volume-based levy on timber harvested from natural forests;
● Forest Resource Provision (PSDH): a volume-based levy on timber harvested from both natural forests and timber/pulpwood plantations;
● Commercial Forest Utilization License Fee (Iuran Izin Usaha Pemanfaatan Hutan, or IUPHH): an area-based fee collected from holders of most types of commercial forest utilization licenses;
● Forest Estate User Fee (Penggunaan Kawasan Hutan, or PKH): an area-based fee collected from mining and plantation companies holding Forest Estate Temporary Use Licenses (Izin Pinjam Pakai Kawasan Hutan, or IPPKH);
● Stumpage Value Replacement (Pengganti Nilai Tegakan, or PNT): a volume-based fee collected on timber harvested from natural forests through forest land-clearing.
During 2003–2013, the DR and PSDH accounted for the vast majority of the revenues collected. Through the first
half of this period, DR revenues accounted for over 70 percent of PNBP receipts in the forestry sector and PSDH
revenues accounted for over 20 percent. Since 2009, the significance of revenues from the PKH Forest Estate User
C H A P T E R 3: C A LC U L AT I N G S TAT E LO S S E S F R O M U N CO L L E C T E D N O N - TAX F O R E S T R E V E N U E S
P R E V E N T I N G S TAT E LO S S E S I N I N D O N E S I A’S F O R E S T RY S E C TO R20
Fee has grown as the Ministry of Forestry has allocated increasingly large areas of state forestland to mining and
plantation companies for temporary use. Nevertheless, DR and PSDH payments have continued to account for
over 75 percent of the sector’s total PNBP receipts.
Reforestation Fund (DR)
The DR levy was introduced in 1989 with the stated aim of collecting revenues that would be used to finance
reforestation and forest rehabilitation activities. According to Article 5 (1) of Ministerial Regulation 52/Menhut-
II/2014 on Procedures for the Levying, Collection and Payment of Forest Resource Provision, Reforestation Fund,
Stumpage Value Replacement and Standing Stock Compensation, the DR is collected on all timber from natural
forests that: originates from within state forests; grew naturally before title has been issued for sections of state
forest that have been excised from the Forest Estate; originates from the sale or replacement of standing stock; is
sourced from the auction of found or confiscated goods; and/or sourced from holders of IUPHHK-HD licenses to
manage village forests (hutan desa).
The DR is not collected on timber sourced from: plantation forests within the Government-administered Forest
Estate; from forests under customary management (hutan adat) used by customary (adat) communities and not
sold for commercial use; used by local communities and not sold for commercial use; harvested from privately-
owned forest (hutan hak) or community forest (hutan rakyat) that grew after title was issued; or used to provide
assistance to victims of natural disasters (P.52/2014, Article 5 (2)).
Rates for the DR levy are based on the volume of wood harvested and vary by region, species, and grade of
timber. As Table 3.1 shows, DR rates range from US$ 2 per ton for small-diameter logs to US$ 20 per ton for high-
value ebony. DR rates for Meranti logs (Shorea sp .) range between US$ 13 and 16 per m3, depending on the region
where the logs are harvested.
The DR levy is denominated in US Dollars. However, the Government has permitted forestry companies to make
payments in Indonesian Rupiah since the financial crisis of the late 1990s. Significantly, the rates of the DR levy
have remained largely unchanged since 1999.
Forest Resource Provision (PSDH)
The PSDH was introduced in 1998 and is defined as the “intrinsic replacement value” of forest products harvested
from: a) state forests; b) sections of the state forest that have been relinquished from the Forest Estate; and/or c)
state forest that is designated for development outside the forestry sector.
According to Article 3 (1) of Ministerial Regulation 52/Menhut-II/2014, the PSDH is collected on timber and
non-timber forest products from natural forests and/or plantations that: originate from within state forests; grew
naturally before title has been issued for sections of state forest that have been excised from the Forest Estate;
are harvested from state forest that has been designated for development needs outside the forestry sector;
originate from the sale or replacement of standing stock; are sourced from the auction of found or confiscated
goods; and/or are sourced from community forests (hutan kemasyarakatan) or village forests (hutan desa).
The PSDH does not apply to timber or non-timber forest products that are: sourced from forests under customary
management (hutan adat) used by customary (adat) communities and not sold for commercial use; used by local
communities and not sold for commercial use; sourced from privately-owned forest (hutan hak) and community
forests (hutan rakyat) that grew after title was issued; or used to provide assistance to victims of natural disasters
(P.52/2014, Article 3 (2)).
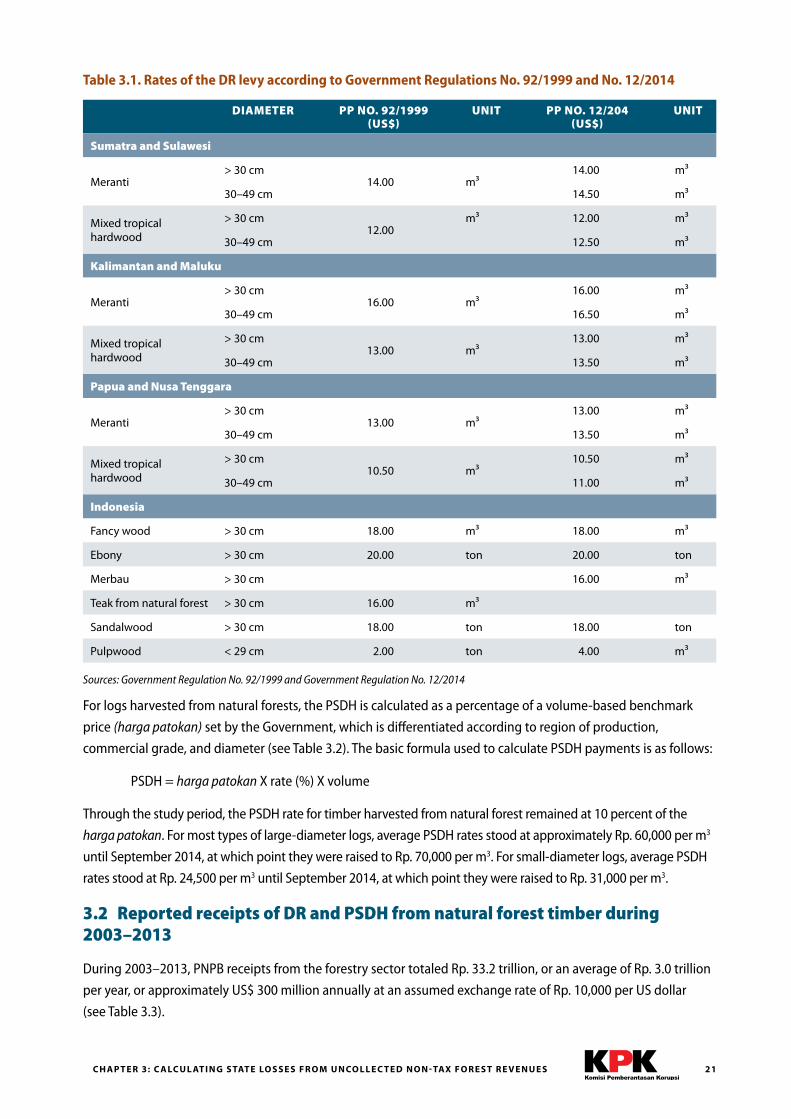
21C H A P T E R 3: C A LC U L AT I N G S TAT E LO S S E S F R O M U N CO L L E C T E D N O N - TAX F O R E S T R E V E N U E S
For logs harvested from natural forests, the PSDH is calculated as a percentage of a volume-based benchmark
price (harga patokan) set by the Government, which is differentiated according to region of production,
commercial grade, and diameter (see Table 3.2). The basic formula used to calculate PSDH payments is as follows:
PSDH = harga patokan X rate (%) X volume
Through the study period, the PSDH rate for timber harvested from natural forest remained at 10 percent of the
harga patokan. For most types of large-diameter logs, average PSDH rates stood at approximately Rp. 60,000 per m3
until September 2014, at which point they were raised to Rp. 70,000 per m3. For small-diameter logs, average PSDH
rates stood at Rp. 24,500 per m3 until September 2014, at which point they were raised to Rp. 31,000 per m3.
3.2 Reported receipts of DR and PSDH from natural forest timber during 2003–2013
During 2003–2013, PNPB receipts from the forestry sector totaled Rp. 33.2 trillion, or an average of Rp. 3.0 trillion
per year, or approximately US$ 300 million annually at an assumed exchange rate of Rp. 10,000 per US dollar
(see Table 3.3).
Table 3.1. Rates of the DR levy according to Government Regulations No. 92/1999 and No. 12/2014
DIAMETER PP NO. 92/1999 (US$)
UNIT PP NO. 12/204 (US$)
UNIT
Sumatra and Sulawesi
Meranti> 30 cm
14.00 m³14.00 m³
30–49 cm 14.50 m³
Mixed tropical hardwood
> 30 cm12.00
m³ 12.00 m³
30–49 cm 12.50 m³
Kalimantan and Maluku
Meranti> 30 cm
16.00 m³16.00 m³
30–49 cm 16.50 m³
Mixed tropical hardwood
> 30 cm13.00 m³
13.00 m³
30–49 cm 13.50 m³
Papua and Nusa Tenggara
Meranti> 30 cm
13.00 m³13.00 m³
30–49 cm 13.50 m³
Mixed tropical hardwood
> 30 cm10.50 m³
10.50 m³
30–49 cm 11.00 m³
Indonesia
Fancy wood > 30 cm 18.00 m³ 18.00 m³
Ebony > 30 cm 20.00 ton 20.00 ton
Merbau > 30 cm 16.00 m³
Teak from natural forest > 30 cm 16.00 m³
Sandalwood > 30 cm 18.00 ton 18.00 ton
Pulpwood < 29 cm 2.00 ton 4.00 m³
Sources: Government Regulation No . 92/1999 and Government Regulation No . 12/2014
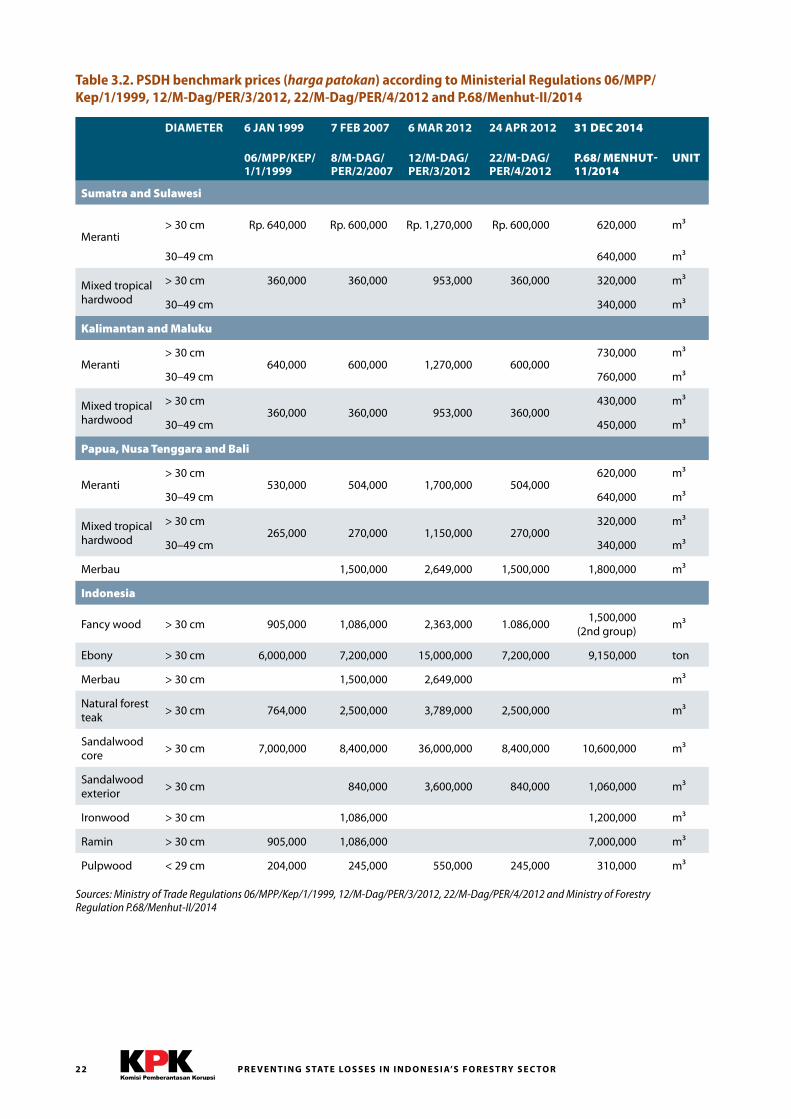
P R E V E N T I N G S TAT E LO S S E S I N I N D O N E S I A’S F O R E S T RY S E C TO R22
Table 3.2. PSDH benchmark prices (harga patokan) according to Ministerial Regulations 06/MPP/Kep/1/1999, 12/M-Dag/PER/3/2012, 22/M-Dag/PER/4/2012 and P.68/Menhut-II/2014
DIAMETER 6 JAN 1999 7 FEB 2007 6 MAR 2012 24 APR 2012 31 DEC 2014
06/MPP/KEP/ 1/1/1999
8/M-DAG/ PER/2/2007
12/M-DAG/ PER/3/2012
22/M-DAG/ PER/4/2012
P.68/ MENHUT- 11/2014
UNIT
Sumatra and Sulawesi
Meranti> 30 cm Rp. 640,000 Rp. 600,000 Rp. 1,270,000 Rp. 600,000 620,000 m³
30–49 cm 640,000 m³
Mixed tropical hardwood
> 30 cm 360,000 360,000 953,000 360,000 320,000 m³
30–49 cm 340,000 m³
Kalimantan and Maluku
Meranti> 30 cm
640,000 600,000 1,270,000 600,000730,000 m³
30–49 cm 760,000 m³
Mixed tropical hardwood
> 30 cm360,000 360,000 953,000 360,000
430,000 m³
30–49 cm 450,000 m³
Papua, Nusa Tenggara and Bali
Meranti> 30 cm
530,000 504,000 1,700,000 504,000620,000 m³
30–49 cm 640,000 m³
Mixed tropical hardwood
> 30 cm265,000 270,000 1,150,000 270,000
320,000 m³
30–49 cm 340,000 m³
Merbau 1,500,000 2,649,000 1,500,000 1,800,000 m³
Indonesia
Fancy wood > 30 cm 905,000 1,086,000 2,363,000 1.086,0001,500,000
(2nd group)m³
Ebony > 30 cm 6,000,000 7,200,000 15,000,000 7,200,000 9,150,000 ton
Merbau > 30 cm 1,500,000 2,649,000 m³
Natural forest teak
> 30 cm 764,000 2,500,000 3,789,000 2,500,000 m³
Sandalwood core
> 30 cm 7,000,000 8,400,000 36,000,000 8,400,000 10,600,000 m³
Sandalwood exterior
> 30 cm 840,000 3,600,000 840,000 1,060,000 m³
Ironwood > 30 cm 1,086,000 1,200,000 m³
Ramin > 30 cm 905,000 1,086,000 7,000,000 m³
Pulpwood < 29 cm 204,000 245,000 550,000 245,000 310,000 m³
Sources: Ministry of Trade Regulations 06/MPP/Kep/1/1999, 12/M-Dag/PER/3/2012, 22/M-Dag/PER/4/2012 and Ministry of Forestry Regulation P .68/Menhut-II/2014
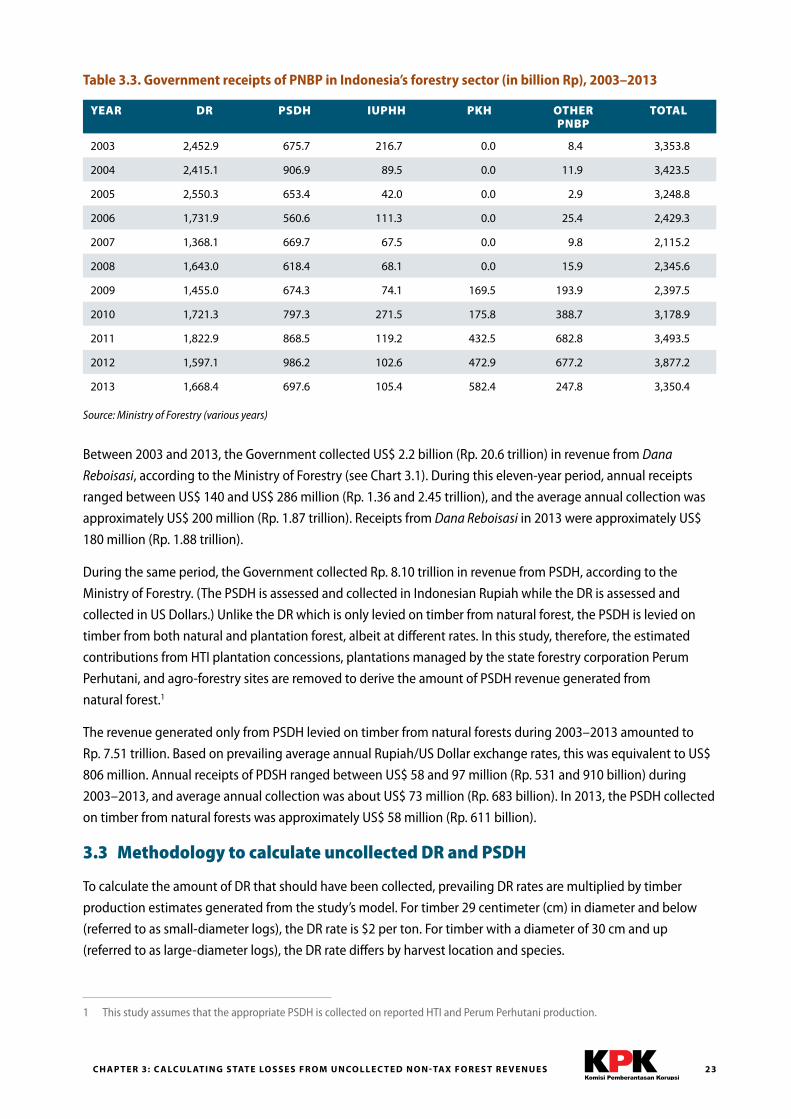
23C H A P T E R 3: C A LC U L AT I N G S TAT E LO S S E S F R O M U N CO L L E C T E D N O N - TAX F O R E S T R E V E N U E S
Table 3.3. Government receipts of PNBP in Indonesia’s forestry sector (in billion Rp), 2003–2013
YEAR DR PSDH IUPHH PKH OTHERPNBP
TOTAL
2003 2,452.9 675.7 216.7 0.0 8.4 3,353.8
2004 2,415.1 906.9 89.5 0.0 11.9 3,423.5
2005 2,550.3 653.4 42.0 0.0 2.9 3,248.8
2006 1,731.9 560.6 111.3 0.0 25.4 2,429.3
2007 1,368.1 669.7 67.5 0.0 9.8 2,115.2
2008 1,643.0 618.4 68.1 0.0 15.9 2,345.6
2009 1,455.0 674.3 74.1 169.5 193.9 2,397.5
2010 1,721.3 797.3 271.5 175.8 388.7 3,178.9
2011 1,822.9 868.5 119.2 432.5 682.8 3,493.5
2012 1,597.1 986.2 102.6 472.9 677.2 3,877.2
2013 1,668.4 697.6 105.4 582.4 247.8 3,350.4
Source: Ministry of Forestry (various years)
Between 2003 and 2013, the Government collected US$ 2.2 billion (Rp. 20.6 trillion) in revenue from Dana
Reboisasi, according to the Ministry of Forestry (see Chart 3.1). During this eleven-year period, annual receipts
ranged between US$ 140 and US$ 286 million (Rp. 1.36 and 2.45 trillion), and the average annual collection was
approximately US$ 200 million (Rp. 1.87 trillion). Receipts from Dana Reboisasi in 2013 were approximately US$
180 million (Rp. 1.88 trillion).
During the same period, the Government collected Rp. 8.10 trillion in revenue from PSDH, according to the
Ministry of Forestry. (The PSDH is assessed and collected in Indonesian Rupiah while the DR is assessed and
collected in US Dollars.) Unlike the DR which is only levied on timber from natural forest, the PSDH is levied on
timber from both natural and plantation forest, albeit at different rates. In this study, therefore, the estimated
contributions from HTI plantation concessions, plantations managed by the state forestry corporation Perum
Perhutani, and agro-forestry sites are removed to derive the amount of PSDH revenue generated from
natural forest.1
The revenue generated only from PSDH levied on timber from natural forests during 2003–2013 amounted to
Rp. 7.51 trillion. Based on prevailing average annual Rupiah/US Dollar exchange rates, this was equivalent to US$
806 million. Annual receipts of PDSH ranged between US$ 58 and 97 million (Rp. 531 and 910 billion) during
2003–2013, and average annual collection was about US$ 73 million (Rp. 683 billion). In 2013, the PSDH collected
on timber from natural forests was approximately US$ 58 million (Rp. 611 billion).
3.3 Methodology to calculate uncollected DR and PSDH
To calculate the amount of DR that should have been collected, prevailing DR rates are multiplied by timber
production estimates generated from the study’s model. For timber 29 centimeter (cm) in diameter and below
(referred to as small-diameter logs), the DR rate is $2 per ton. For timber with a diameter of 30 cm and up
(referred to as large-diameter logs), the DR rate differs by harvest location and species.
1 This study assumes that the appropriate PSDH is collected on reported HTI and Perum Perhutani production.
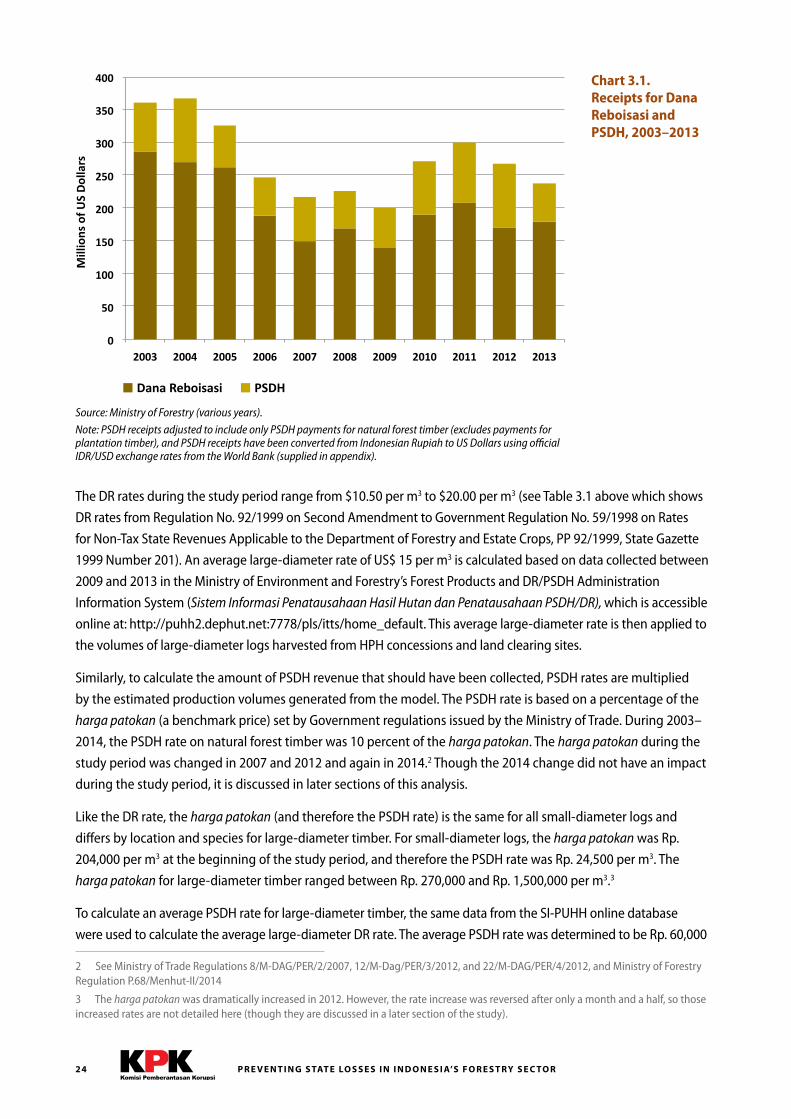
P R E V E N T I N G S TAT E LO S S E S I N I N D O N E S I A’S F O R E S T RY S E C TO R24
The DR rates during the study period range from $10.50 per m3 to $20.00 per m3 (see Table 3.1 above which shows
DR rates from Regulation No. 92/1999 on Second Amendment to Government Regulation No. 59/1998 on Rates
for Non-Tax State Revenues Applicable to the Department of Forestry and Estate Crops, PP 92/1999, State Gazette
1999 Number 201). An average large-diameter rate of US$ 15 per m3 is calculated based on data collected between
2009 and 2013 in the Ministry of Environment and Forestry’s Forest Products and DR/PSDH Administration
Information System (Sistem Informasi Penatausahaan Hasil Hutan dan Penatausahaan PSDH/DR), which is accessible
online at: http://puhh2.dephut.net:7778/pls/itts/home_default. This average large-diameter rate is then applied to
the volumes of large-diameter logs harvested from HPH concessions and land clearing sites.
Similarly, to calculate the amount of PSDH revenue that should have been collected, PSDH rates are multiplied
by the estimated production volumes generated from the model. The PSDH rate is based on a percentage of the
harga patokan (a benchmark price) set by Government regulations issued by the Ministry of Trade. During 2003–
2014, the PSDH rate on natural forest timber was 10 percent of the harga patokan. The harga patokan during the
study period was changed in 2007 and 2012 and again in 2014.2 Though the 2014 change did not have an impact
during the study period, it is discussed in later sections of this analysis.
Like the DR rate, the harga patokan (and therefore the PSDH rate) is the same for all small-diameter logs and
differs by location and species for large-diameter timber. For small-diameter logs, the harga patokan was Rp.
204,000 per m3 at the beginning of the study period, and therefore the PSDH rate was Rp. 24,500 per m3. The
harga patokan for large-diameter timber ranged between Rp. 270,000 and Rp. 1,500,000 per m3.3
To calculate an average PSDH rate for large-diameter timber, the same data from the SI-PUHH online database
were used to calculate the average large-diameter DR rate. The average PSDH rate was determined to be Rp. 60,000
2 See Ministry of Trade Regulations 8/M-DAG/PER/2/2007, 12/M-Dag/PER/3/2012, and 22/M-DAG/PER/4/2012, and Ministry of Forestry Regulation P.68/Menhut-II/2014
3 The harga patokan was dramatically increased in 2012. However, the rate increase was reversed after only a month and a half, so those increased rates are not detailed here (though they are discussed in a later section of the study).
0
50
100
150
200
250
300
350
400
2003 2004 2005 2006 2007 2008 2009 2010 2011 2012 2013
Dana Reboisasi PSDH
Chart 3.1. Receipts for Dana Reboisasi and PSDH, 2003–2013
Source: Ministry of Forestry (various years) .
Note: PSDH receipts adjusted to include only PSDH payments for natural forest timber (excludes payments for plantation timber), and PSDH receipts have been converted from Indonesian Rupiah to US Dollars using official IDR/USD exchange rates from the World Bank (supplied in appendix) .
Mill
ions
of U
S D
olla
rs
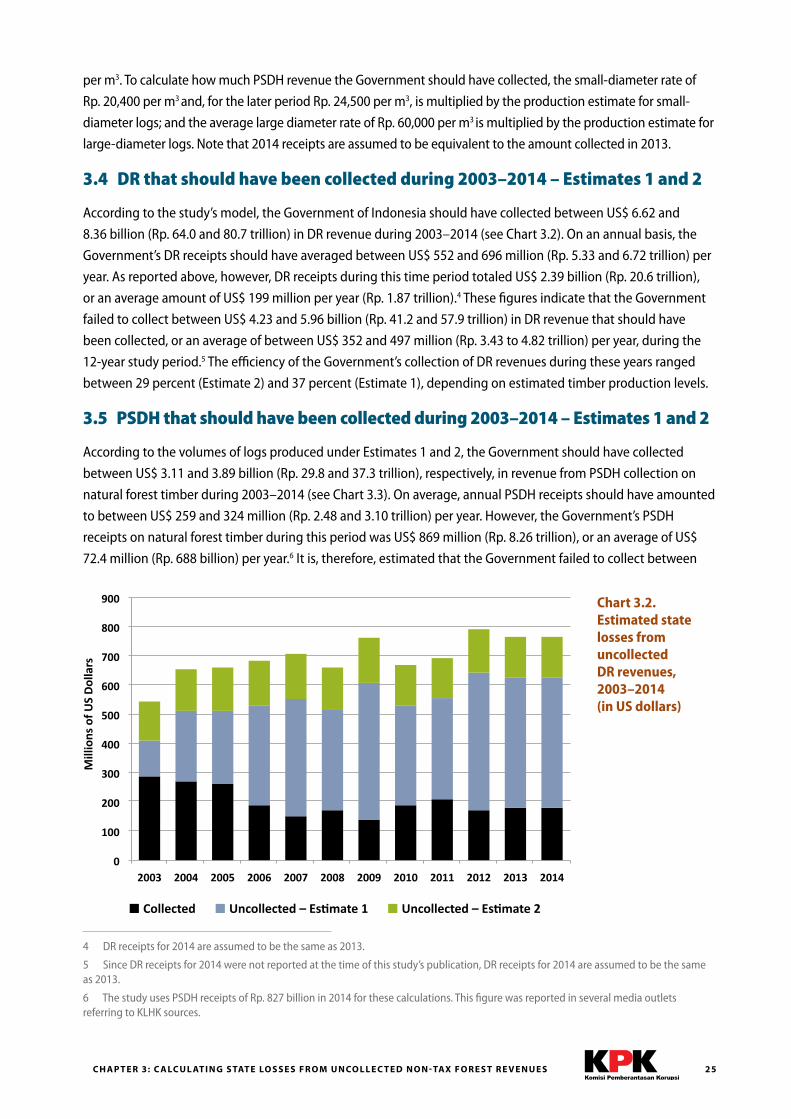
25C H A P T E R 3: C A LC U L AT I N G S TAT E LO S S E S F R O M U N CO L L E C T E D N O N - TAX F O R E S T R E V E N U E S
per m3. To calculate how much PSDH revenue the Government should have collected, the small-diameter rate of
Rp. 20,400 per m3 and, for the later period Rp. 24,500 per m3, is multiplied by the production estimate for small-
diameter logs; and the average large diameter rate of Rp. 60,000 per m3 is multiplied by the production estimate for
large-diameter logs. Note that 2014 receipts are assumed to be equivalent to the amount collected in 2013.
3.4 DR that should have been collected during 2003–2014 – Estimates 1 and 2
According to the study’s model, the Government of Indonesia should have collected between US$ 6.62 and
8.36 billion (Rp. 64.0 and 80.7 trillion) in DR revenue during 2003–2014 (see Chart 3.2). On an annual basis, the
Government’s DR receipts should have averaged between US$ 552 and 696 million (Rp. 5.33 and 6.72 trillion) per
year. As reported above, however, DR receipts during this time period totaled US$ 2.39 billion (Rp. 20.6 trillion),
or an average amount of US$ 199 million per year (Rp. 1.87 trillion).4 These figures indicate that the Government
failed to collect between US$ 4.23 and 5.96 billion (Rp. 41.2 and 57.9 trillion) in DR revenue that should have
been collected, or an average of between US$ 352 and 497 million (Rp. 3.43 to 4.82 trillion) per year, during the
12-year study period.5 The efficiency of the Government’s collection of DR revenues during these years ranged
between 29 percent (Estimate 2) and 37 percent (Estimate 1), depending on estimated timber production levels.
3.5 PSDH that should have been collected during 2003–2014 – Estimates 1 and 2
According to the volumes of logs produced under Estimates 1 and 2, the Government should have collected
between US$ 3.11 and 3.89 billion (Rp. 29.8 and 37.3 trillion), respectively, in revenue from PSDH collection on
natural forest timber during 2003–2014 (see Chart 3.3). On average, annual PSDH receipts should have amounted
to between US$ 259 and 324 million (Rp. 2.48 and 3.10 trillion) per year. However, the Government’s PSDH
receipts on natural forest timber during this period was US$ 869 million (Rp. 8.26 trillion), or an average of US$
72.4 million (Rp. 688 billion) per year.6 It is, therefore, estimated that the Government failed to collect between
4 DR receipts for 2014 are assumed to be the same as 2013.
5 Since DR receipts for 2014 were not reported at the time of this study’s publication, DR receipts for 2014 are assumed to be the same as 2013.
6 The study uses PSDH receipts of Rp. 827 billion in 2014 for these calculations. This figure was reported in several media outlets referring to KLHK sources.
0
100
200
300
400
500
600
700
800
900
2003 2004 2005 2006 2007 2008 2009 2010 2011 2012 2013 2014
Collected Uncollected – Es8mate 1 Uncollected – Es8mate 2
Mill
ions
of U
S D
olla
rs
Chart 3.2. Estimated state losses from uncollected DR revenues, 2003–2014 (in US dollars)
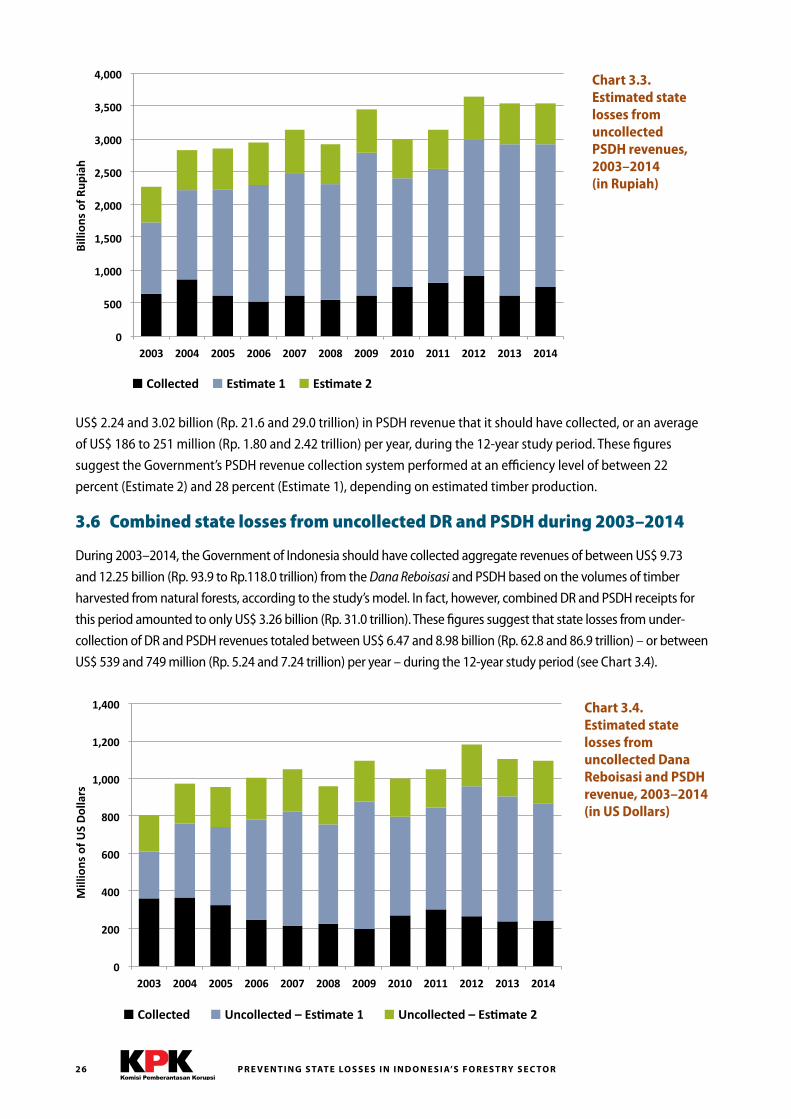
P R E V E N T I N G S TAT E LO S S E S I N I N D O N E S I A’S F O R E S T RY S E C TO R26
0
500
1,000
1,500
2,000
2,500
3,000
3,500
4,000
2003 2004 2005 2006 2007 2008 2009 2010 2011 2012 2013 2014
Collected Es6mate 1 Es6mate 2
Chart 3.3. Estimated state losses from uncollected PSDH revenues, 2003–2014 (in Rupiah)
0
200
400
600
800
1,000
1,200
1,400
2003 2004 2005 2006 2007 2008 2009 2010 2011 2012 2013 2014
Collected Uncollected – Es9mate 1 Uncollected – Es9mate 2
Chart 3.4. Estimated state losses from uncollected Dana Reboisasi and PSDH revenue, 2003–2014 (in US Dollars)
Billi
ons
of R
upia
h
US$ 2.24 and 3.02 billion (Rp. 21.6 and 29.0 trillion) in PSDH revenue that it should have collected, or an average
of US$ 186 to 251 million (Rp. 1.80 and 2.42 trillion) per year, during the 12-year study period. These figures
suggest the Government’s PSDH revenue collection system performed at an efficiency level of between 22
percent (Estimate 2) and 28 percent (Estimate 1), depending on estimated timber production.
3.6 Combined state losses from uncollected DR and PSDH during 2003–2014
During 2003–2014, the Government of Indonesia should have collected aggregate revenues of between US$ 9.73
and 12.25 billion (Rp. 93.9 to Rp.118.0 trillion) from the Dana Reboisasi and PSDH based on the volumes of timber
harvested from natural forests, according to the study’s model. In fact, however, combined DR and PSDH receipts for
this period amounted to only US$ 3.26 billion (Rp. 31.0 trillion). These figures suggest that state losses from under-
collection of DR and PSDH revenues totaled between US$ 6.47 and 8.98 billion (Rp. 62.8 and 86.9 trillion) – or between
US$ 539 and 749 million (Rp. 5.24 and 7.24 trillion) per year – during the 12-year study period (see Chart 3.4).
Mill
ions
of U
S D
olla
rs
27
Chapter 4: Calculating state losses of commercial value from unreported timber productionThe value of state losses from uncollected PNBP forest revenues during 2003–2014 is substantial, amounting to
between US$ 6.47 and 8.98 billion (Rp. 62.8 and 86.9 trillion) as shown in Chapter Three. These losses, however,
represent only the foregone royalties that the Government should have collected, yet did not collect, on
unreported timber production. By definition, these royalties represent a fraction of the underlying commercial
value of the logs harvested outside the state’s timber production reporting system. To the extent this timber was
harvested illegally, it represents an asset that has been stolen from the state and the value of which belongs to
the state. In this way, the commercial value of the unreported timber harvested from Indonesia’s Forest Estate
represents an important quantitative measure of the scale of state losses from undocumented, and arguably
illegal, logging.
This chapter calculates state losses of commercial value associated with unreported timber production during
2003–2014. It bases these calculations on the estimated volumes of unreported log harvests presented in
Chapter Two, which are multiplied by average domestic log prices for each year during the study period. These
calculations demonstrate that the Government incurred aggregate state losses of between US$ 60.7 and
81.4 billion (Rp. 598.0 and 799.3 trillion) during this period, and that annual state losses rose steadily to reach
between US$ 7.7 and 9.9 billion (Rp. 80.7 and 104.3 trillion) in 2013 alone.
4.1 Legal basis for defining state losses from the commercial value of unreported timber
In Indonesia, the legal basis for calculating state losses from the commercial value of unreported timber is
well established. Legal precedents indicate various methods to be used for calculating state losses resulting
from corruption in the forestry sector. In the case of Adelin Lis in Mandailing Natal District of Aceh Province, for
instance, state losses were calculated and recorded based on the non-tax state revenues not collected by the
state. By contrast, in the case of Azmun Jaafar, the former Bupati of Pelalawan District in Riau Province, state
losses were calculated based on the total value of timber harvested by companies that had secured their permits
through the accused by corrupt means. In the Azmun Jaafar case, state losses were calculated to have reached
Rp. 1.2 trillion.1
In this study, state losses are determined using the methods applied in the Azmun Jaafar case, which calculate
timber value by multiplying the log price by the volumes of timber harvested.2 In the Azmun Jaafar case, state
losses were calculated by subtracting revenues that the state had already received in the form of PSDH and DR on
the companies’ timber harvests from the value of the timber. But in the case of unreported timber, the PSDH and
DR was never paid, so this study does not subtract that amount from the value of the unreported timber. Also,
as will be established later in the study, the benchmark prices (harga patokan) are significantly less than market
1 See Azmun Jaafar indictment p. 36
2 In 2012 the Ministry of Environment issued Ministerial Regulation No. 5/2012 on Economic Valuation Guidelines for Forest Ecosystems, which provides methods for calculating the economic value of forests above and beyond the value of the timber, either through changes in production or based on changes in environmental quality. This “ecosystem services” method of calculating economic loss from forest destruction is an important measure even though it is not quantified in this study.
CHAPTER 4: CALCULATING STATE LOSSES OF COMMERCIAL VALUE FROM UNREPORTED TIMBER PRODUCTION
P R E V E N T I N G S TAT E LO S S E S I N I N D O N E S I A’S F O R E S T RY S E C TO R28
prices for logs. Since the intention of using the benchmark prices is to value the timber at market rates, this study
uses sources other than the government’s official benchmark rates as a proxy for market prices.
Under Indonesia’s legal framework for curbing money laundering, state losses can also be treated as proceeds
of crime. According to Law No. 8/2010 on Money Laundering, forestry crime and corruption are included in the
list of predicate offenses (Article 2 (1)) to money laundering. Therefore, the use of or transactions involving the
proceeds of forestry crime or corruption can qualify as money laundering. Furthermore, with this legal framework,
Law No. 8/2010 also grants the Financial Transaction Reports and Analysis Center (Pusat Pelaporan Analisis dan
Transaksi Keuangan, or PPATK) the authority to conduct investigations and submit reports on potential money
laundering crimes to law enforcement agencies (Article 44 (1)). Based on analyses submitted by PPATK, law
enforcement agencies may conduct criminal prosecutions against predicate offences to money laundering,
including forestry crime and corruption. Consequently, law enforcement agencies investigating predicate offences
may also conduct investigations into the laundering of the proceeds from those predicate offenses.
4.2 Methodology for calculating commercial value of unreported timber production
The methods for calculating the commercial value of unreported timber production are straightforward.
In simplest terms, the volumes of unreported timber production calculated for the study’s lower estimate
(Estimate 1) and upper estimate (Estimate 2) for 2003–2014, as presented in Chapter Two, are multiplied by
average domestic log prices for each year during the study period. Average log prices are differentiated by the
following grades: 1) small-diameter logs (kayu bulat kecil, or KBK); and 2) large-diameter logs (kayu bulat, or KB).
For small-diameter logs, annual domestic market prices are obtained from Wood Resources Quarterly, a
proprietary industry data provider that tracks domestic and international pulplog prices around the world. For
Indonesia, these prices are reported on a freight on board (FOB) basis, thereby incorporating the costs of delivery
of the logs either to the mill or to the shipment vessel.
For large-diameter logs, annual domestic market prices are obtained from reports published by the International
Tropical Timber Organization (ITTO). The ITTO publishes average domestic timber prices for Indonesia and other
tropical forestry countries on an annual basis. For Indonesia, log prices are only reported for Meranti and for
core logs. For the purposes of this analysis, the commercial value of large-diameter logs from selective logging
is calculated using a blended log price, 35 percent of which is based on the Meranti log price and 65 percent of
which is based on the core log price. The commercial value of large-diameter logs from land clearing is calculated
using a blended price, 20 percent of which is based on the Meranti log price and 80 percent of which is based on
the core log price. These prices are similarly reported on an FOB basis.
The blended price for large-diameter domestic logs is considered to be conservative in light of the fact that it
does not include either high-value fancy grades of timber such as Merbau and/or log sales (legal or illegal) to
international buyers.
4.3 Commercial value of reported timber production in domestic markets during 2003–2014
Before calculating the commercial value of unreported logs, it is useful to determine the market value of
Indonesia’s reported timber production during the study period. Applying average domestic log prices to
the reported volumes of timber harvested, it is calculated that the nation’s formal logging industry generated
US$ 20.9 billion (Rp. 202 trillion) worth of logs during 2003–2014. Of this total, large-diameter logs from
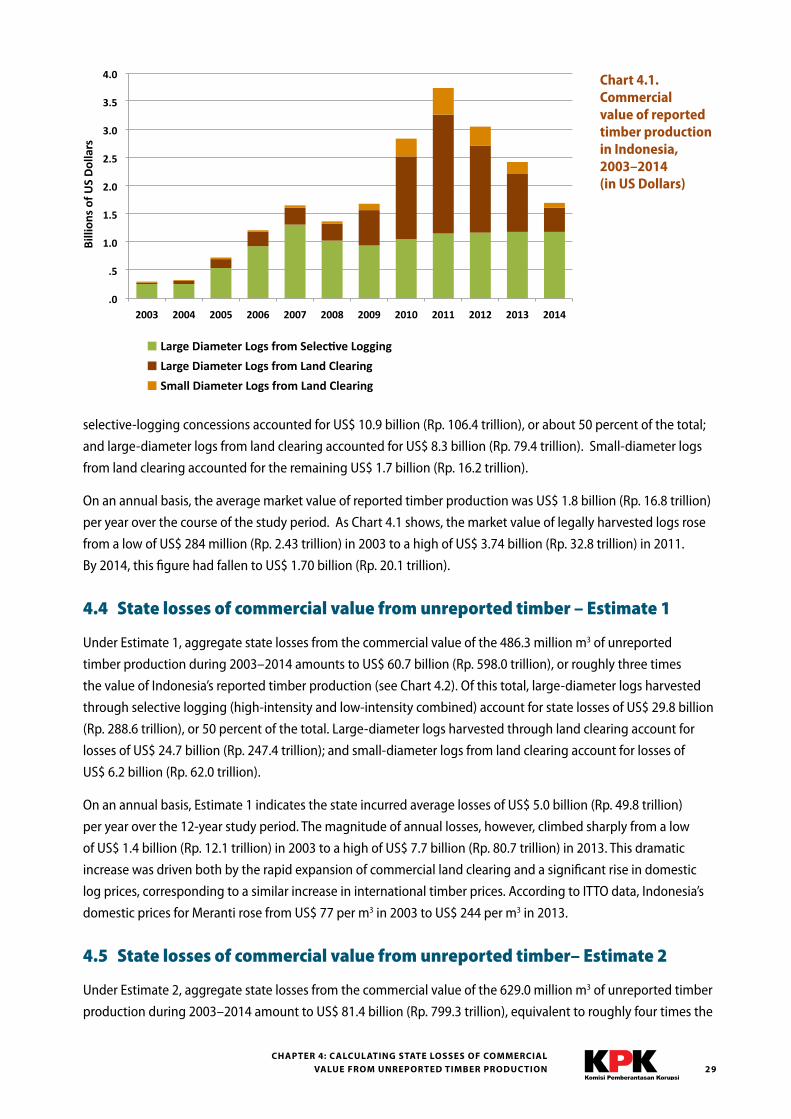
29CHAPTER 4: CALCULATING STATE LOSSES OF COMMERCIAL
VALUE FROM UNREPORTED TIMBER PRODUCTION
selective-logging concessions accounted for US$ 10.9 billion (Rp. 106.4 trillion), or about 50 percent of the total;
and large-diameter logs from land clearing accounted for US$ 8.3 billion (Rp. 79.4 trillion). Small-diameter logs
from land clearing accounted for the remaining US$ 1.7 billion (Rp. 16.2 trillion).
On an annual basis, the average market value of reported timber production was US$ 1.8 billion (Rp. 16.8 trillion)
per year over the course of the study period. As Chart 4.1 shows, the market value of legally harvested logs rose
from a low of US$ 284 million (Rp. 2.43 trillion) in 2003 to a high of US$ 3.74 billion (Rp. 32.8 trillion) in 2011.
By 2014, this figure had fallen to US$ 1.70 billion (Rp. 20.1 trillion).
4.4 State losses of commercial value from unreported timber – Estimate 1
Under Estimate 1, aggregate state losses from the commercial value of the 486.3 million m3 of unreported
timber production during 2003–2014 amounts to US$ 60.7 billion (Rp. 598.0 trillion), or roughly three times
the value of Indonesia’s reported timber production (see Chart 4.2). Of this total, large-diameter logs harvested
through selective logging (high-intensity and low-intensity combined) account for state losses of US$ 29.8 billion
(Rp. 288.6 trillion), or 50 percent of the total. Large-diameter logs harvested through land clearing account for
losses of US$ 24.7 billion (Rp. 247.4 trillion); and small-diameter logs from land clearing account for losses of
US$ 6.2 billion (Rp. 62.0 trillion).
On an annual basis, Estimate 1 indicates the state incurred average losses of US$ 5.0 billion (Rp. 49.8 trillion)
per year over the 12-year study period. The magnitude of annual losses, however, climbed sharply from a low
of US$ 1.4 billion (Rp. 12.1 trillion) in 2003 to a high of US$ 7.7 billion (Rp. 80.7 trillion) in 2013. This dramatic
increase was driven both by the rapid expansion of commercial land clearing and a significant rise in domestic
log prices, corresponding to a similar increase in international timber prices. According to ITTO data, Indonesia’s
domestic prices for Meranti rose from US$ 77 per m3 in 2003 to US$ 244 per m3 in 2013.
4.5 State losses of commercial value from unreported timber– Estimate 2
Under Estimate 2, aggregate state losses from the commercial value of the 629.0 million m3 of unreported timber
production during 2003–2014 amount to US$ 81.4 billion (Rp. 799.3 trillion), equivalent to roughly four times the
.0
.5
1.0
1.5
2.0
2.5
3.0
3.5
4.0
2003 2004 2005 2006 2007 2008 2009 2010 2011 2012 2013 2014
Large Diameter Logs from Selec<ve Logging
Large Diameter Logs from Land Clearing
Small Diameter Logs from Land Clearing
Chart 4.1. Commercial value of reported timber production in Indonesia, 2003–2014 (in US Dollars)
Billi
ons
of U
S D
olla
rs
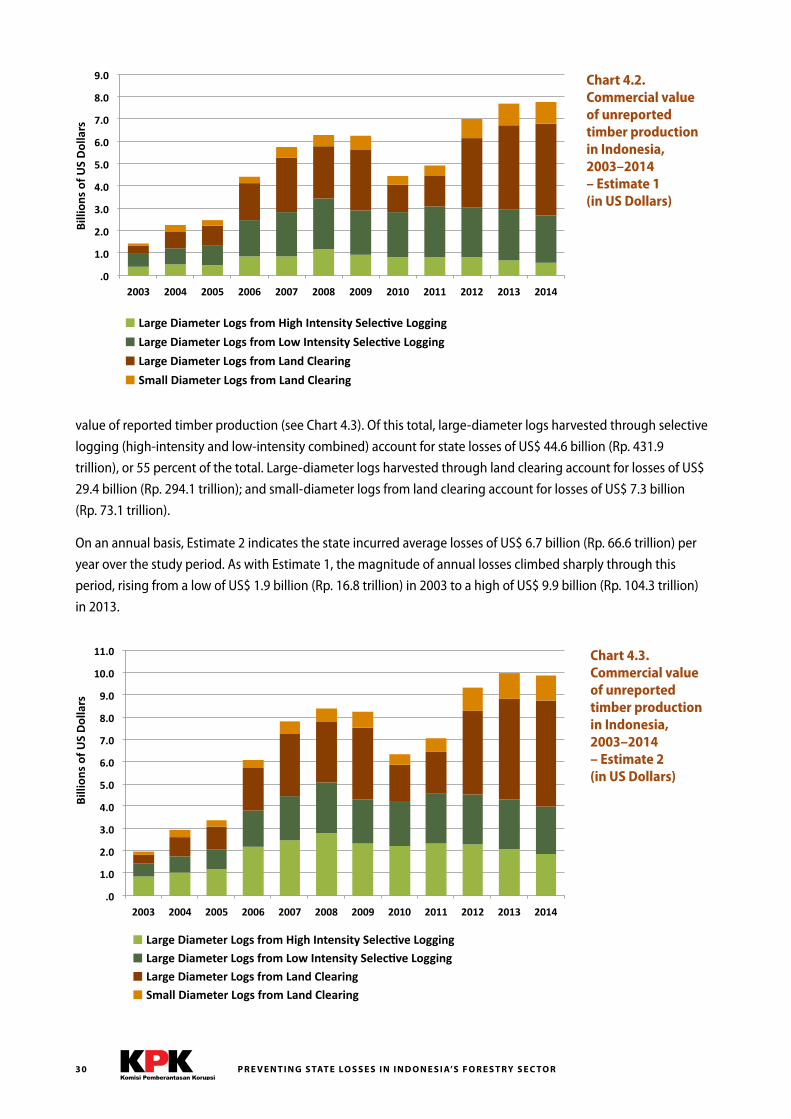
P R E V E N T I N G S TAT E LO S S E S I N I N D O N E S I A’S F O R E S T RY S E C TO R30
.0
1.0
2.0
3.0
4.0
5.0
6.0
7.0
8.0
9.0
2003 2004 2005 2006 2007 2008 2009 2010 2011 2012 2013 2014
Large Diameter Logs from High Intensity SelecAve Logging
Large Diameter Logs from Low Intensity SelecAve Logging
Large Diameter Logs from Land Clearing
Small Diameter Logs from Land Clearing
.0
1.0
2.0
3.0
4.0
5.0
6.0
7.0
8.0
9.0
10.0
11.0
2003 2004 2005 2006 2007 2008 2009 2010 2011 2012 2013 2014
Large Diameter Logs from High Intensity SelecAve Logging Large Diameter Logs from Low Intensity SelecAve Logging Large Diameter Logs from Land Clearing Small Diameter Logs from Land Clearing
Chart 4.2. Commercial value of unreported timber production in Indonesia, 2003–2014 – Estimate 1 (in US Dollars)
Chart 4.3. Commercial value of unreported timber production in Indonesia, 2003–2014 – Estimate 2 (in US Dollars)
value of reported timber production (see Chart 4.3). Of this total, large-diameter logs harvested through selective
logging (high-intensity and low-intensity combined) account for state losses of US$ 44.6 billion (Rp. 431.9
trillion), or 55 percent of the total. Large-diameter logs harvested through land clearing account for losses of US$
29.4 billion (Rp. 294.1 trillion); and small-diameter logs from land clearing account for losses of US$ 7.3 billion
(Rp. 73.1 trillion).
On an annual basis, Estimate 2 indicates the state incurred average losses of US$ 6.7 billion (Rp. 66.6 trillion) per
year over the study period. As with Estimate 1, the magnitude of annual losses climbed sharply through this
period, rising from a low of US$ 1.9 billion (Rp. 16.8 trillion) in 2003 to a high of US$ 9.9 billion (Rp. 104.3 trillion)
in 2013.
Billi
ons
of U
S D
olla
rsBi
llion
s of
US
Dol
lars
31
Section II: Analysis of weaknesses in the timber administration and non-tax revenue collection system
P R E V E N T I N G S TAT E LO S S E S I N I N D O N E S I A’S F O R E S T RY S E C TO R32
Chapter 5: Regulatory framework for non-tax state revenue collection in the forestry sector5.1 Overview of the PNBP regulatory framework
In Indonesia, non-tax state revenues, or PNBP, are regulated under a number of laws, including Law No. 20/1997
on Non-Tax State Revenue, Law No. 17/2003 on State Finances, and Law No. 1/2004 on the State Treasury. Based
on these laws, PNBP governance, including in the forestry sector, is considered to be part of the national budget
administration. These three laws form the basis for the Government to organize, plan, collect, manage, spend and
account for non-tax revenues.
Based on the norms it contains, Law 17/2003 on State Finances functions as a lex generalis for the regulation of
state revenue sources. Under this law, non-tax revenues are regulated as forms of state revenue along with taxes
and grants (Article 11). The law mandates the Government to collect revenues from these sources, including
PNBP and receivables, and to manage them for the state (Article 9). Law 1/2004 on the State Treasury provides
for regulation similar to Law 17/2003, in addition to providing revenue management and accountability
mechanisms. Law 1/2004 stipulates that the Government has the authority to collect state revenue, to appoint a
state treasurer to carry out that collection, and to determine procedures for how ministries and agencies use the
collected revenue (Article 16 (2) and (4)).
Specific provisions forming the basis for non-tax state revenue collection policy are regulated under Law
No. 20/1997 on Non-Tax State Revenue. This law regulates various aspects of PNBP governance, including
management, control and accountability, and a verification mechanism. To ensure the law’s provisions are
enforced, Law 20/1997 also specifies the penalties for violations. The law also defines the sources from which
the state is permitted to collect PNBP. The law identifies natural resources (on, under, and above the surface of
the earth) as one such source, and it provides examples of natural resource PNBP revenues including forestry,
fisheries and mining (Article 2 (1)). Without explaining in detail the forms of PNBP collection, the law mandates
that specific arrangements for PNBP classification should be provided under a subordinate regulatory
framework.
In addition to the laws above, Law No. 41/1999 on Forestry provides norms relating to the state’s collection of
PNBP associated with forest utilization. This law states that part of the proceeds from the exploitation of forest
products constitutes state revenue. This revenue includes the Reforestation Fund (Dana Reboisasi, or DR), the
Forest Resource Provision (Provisi Sumber Daya Hutan, or PSDH), license fees and also investment guarantee
funds. The DR is defined as a fee collected for the rehabilitation and restoration of degraded forests, while
the PSDH is defined as the “intrinsic replacement value” of forest products harvested (Elucidation Article 35).
Law No. 41/1999 mandates the Government (the Ministry of Forestry and the Ministry of Finance, in equal
measure) to issue technical regulations supporting the collection and management of forestry sector PNBP
(Article 35 (4)).
The regulatory framework for PNBP administration, as with other countries’ revenue collection systems, begins
with policies for setting PNBP rates and targets. As part of the national budgetary process, ministries must set
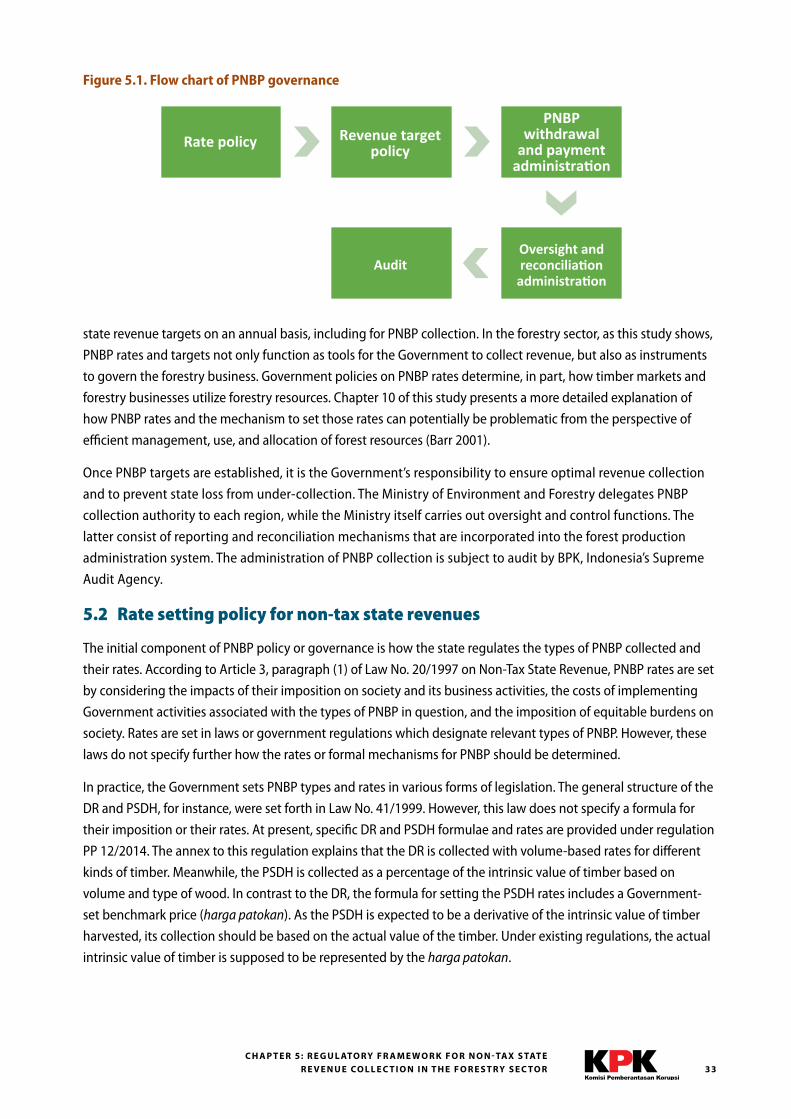
33C H A P T E R 5: R E G U L ATO RY F R A M E W O R K F O R N O N - TAX S TAT E
R E V E N U E CO L L E C T I O N I N T H E F O R E S T RY S E C TO R
state revenue targets on an annual basis, including for PNBP collection. In the forestry sector, as this study shows,
PNBP rates and targets not only function as tools for the Government to collect revenue, but also as instruments
to govern the forestry business. Government policies on PNBP rates determine, in part, how timber markets and
forestry businesses utilize forestry resources. Chapter 10 of this study presents a more detailed explanation of
how PNBP rates and the mechanism to set those rates can potentially be problematic from the perspective of
efficient management, use, and allocation of forest resources (Barr 2001).
Once PNBP targets are established, it is the Government’s responsibility to ensure optimal revenue collection
and to prevent state loss from under-collection. The Ministry of Environment and Forestry delegates PNBP
collection authority to each region, while the Ministry itself carries out oversight and control functions. The
latter consist of reporting and reconciliation mechanisms that are incorporated into the forest production
administration system. The administration of PNBP collection is subject to audit by BPK, Indonesia’s Supreme
Audit Agency.
5.2 Rate setting policy for non-tax state revenues
The initial component of PNBP policy or governance is how the state regulates the types of PNBP collected and
their rates. According to Article 3, paragraph (1) of Law No. 20/1997 on Non-Tax State Revenue, PNBP rates are set
by considering the impacts of their imposition on society and its business activities, the costs of implementing
Government activities associated with the types of PNBP in question, and the imposition of equitable burdens on
society. Rates are set in laws or government regulations which designate relevant types of PNBP. However, these
laws do not specify further how the rates or formal mechanisms for PNBP should be determined.
In practice, the Government sets PNBP types and rates in various forms of legislation. The general structure of the
DR and PSDH, for instance, were set forth in Law No. 41/1999. However, this law does not specify a formula for
their imposition or their rates. At present, specific DR and PSDH formulae and rates are provided under regulation
PP 12/2014. The annex to this regulation explains that the DR is collected with volume-based rates for different
kinds of timber. Meanwhile, the PSDH is collected as a percentage of the intrinsic value of timber based on
volume and type of wood. In contrast to the DR, the formula for setting the PSDH rates includes a Government-
set benchmark price (harga patokan). As the PSDH is expected to be a derivative of the intrinsic value of timber
harvested, its collection should be based on the actual value of the timber. Under existing regulations, the actual
intrinsic value of timber is supposed to be represented by the harga patokan.
Figure 5.1. Flow chart of PNBP governance
Rate policy Revenue targetpolicy
PNBPwithdrawal
and paymentadministration
Oversight andreconciliationadministration
Audit
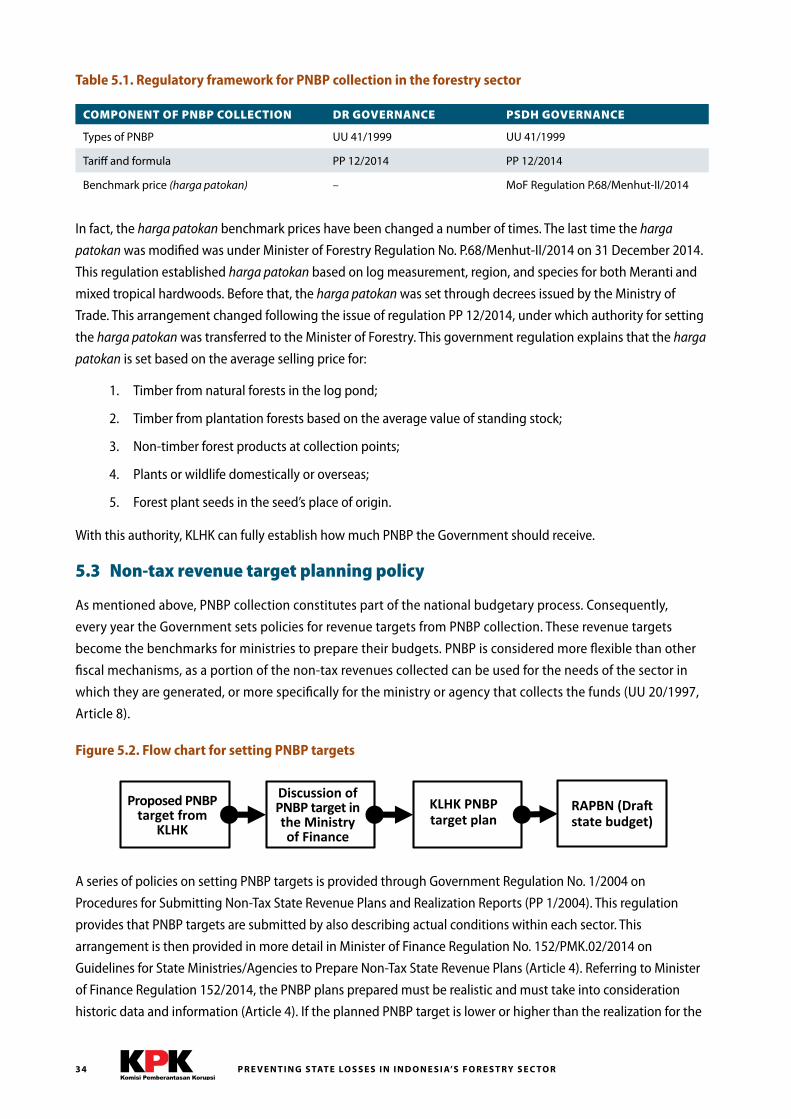
P R E V E N T I N G S TAT E LO S S E S I N I N D O N E S I A’S F O R E S T RY S E C TO R34
Table 5.1. Regulatory framework for PNBP collection in the forestry sector
COMPONENT OF PNBP COLLECTION DR GOVERNANCE PSDH GOVERNANCE
Types of PNBP UU 41/1999 UU 41/1999
Tariff and formula PP 12/2014 PP 12/2014
Benchmark price (harga patokan) – MoF Regulation P.68/Menhut-II/2014
In fact, the harga patokan benchmark prices have been changed a number of times. The last time the harga
patokan was modified was under Minister of Forestry Regulation No. P.68/Menhut-II/2014 on 31 December 2014.
This regulation established harga patokan based on log measurement, region, and species for both Meranti and
mixed tropical hardwoods. Before that, the harga patokan was set through decrees issued by the Ministry of
Trade. This arrangement changed following the issue of regulation PP 12/2014, under which authority for setting
the harga patokan was transferred to the Minister of Forestry. This government regulation explains that the harga
patokan is set based on the average selling price for:
1. Timber from natural forests in the log pond;
2. Timber from plantation forests based on the average value of standing stock;
3. Non-timber forest products at collection points;
4. Plants or wildlife domestically or overseas;
5. Forest plant seeds in the seed’s place of origin.
With this authority, KLHK can fully establish how much PNBP the Government should receive.
5.3 Non-tax revenue target planning policy
As mentioned above, PNBP collection constitutes part of the national budgetary process. Consequently,
every year the Government sets policies for revenue targets from PNBP collection. These revenue targets
become the benchmarks for ministries to prepare their budgets. PNBP is considered more flexible than other
fiscal mechanisms, as a portion of the non-tax revenues collected can be used for the needs of the sector in
which they are generated, or more specifically for the ministry or agency that collects the funds (UU 20/1997,
Article 8).
Figure 5.2. Flow chart for setting PNBP targets
A series of policies on setting PNBP targets is provided through Government Regulation No. 1/2004 on
Procedures for Submitting Non-Tax State Revenue Plans and Realization Reports (PP 1/2004). This regulation
provides that PNBP targets are submitted by also describing actual conditions within each sector. This
arrangement is then provided in more detail in Minister of Finance Regulation No. 152/PMK.02/2014 on
Guidelines for State Ministries/Agencies to Prepare Non-Tax State Revenue Plans (Article 4). Referring to Minister
of Finance Regulation 152/2014, the PNBP plans prepared must be realistic and must take into consideration
historic data and information (Article 4). If the planned PNBP target is lower or higher than the realization for the
Discussion ofPNBP target in the Ministry of Finance
KLHK PNBPtarget plan
RAPBN (Draftstate budget)
Proposed PNBPtarget from
KLHK
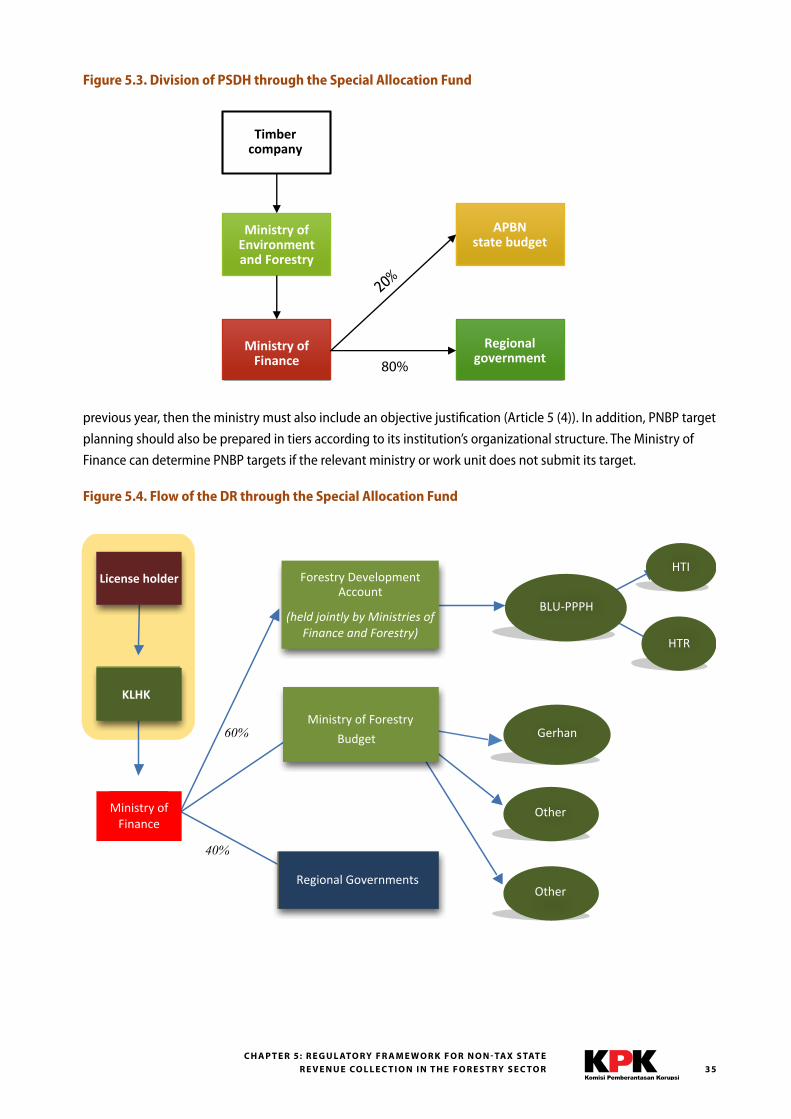
35C H A P T E R 5: R E G U L ATO RY F R A M E W O R K F O R N O N - TAX S TAT E
R E V E N U E CO L L E C T I O N I N T H E F O R E S T RY S E C TO R
previous year, then the ministry must also include an objective justification (Article 5 (4)). In addition, PNBP target
planning should also be prepared in tiers according to its institution’s organizational structure. The Ministry of
Finance can determine PNBP targets if the relevant ministry or work unit does not submit its target.
Figure 5.4. Flow of the DR through the Special Allocation Fund
Figure 5.3. Division of PSDH through the Special Allocation Fund
Timbercompany
80%
Ministry ofEnvironmentand Forestry
Ministry ofFinance
APBNstate budget
Regionalgovernment
License holder
KLHK
Finance
Regional Governments
Forestry Development Account
(held jointly by Ministries of Finance and Forestry)
Ministry of Forestry
Budget 60%
40%
Gerhan
Other
Other
BLU-‐PPPH
HTR
HTI
Ministry of
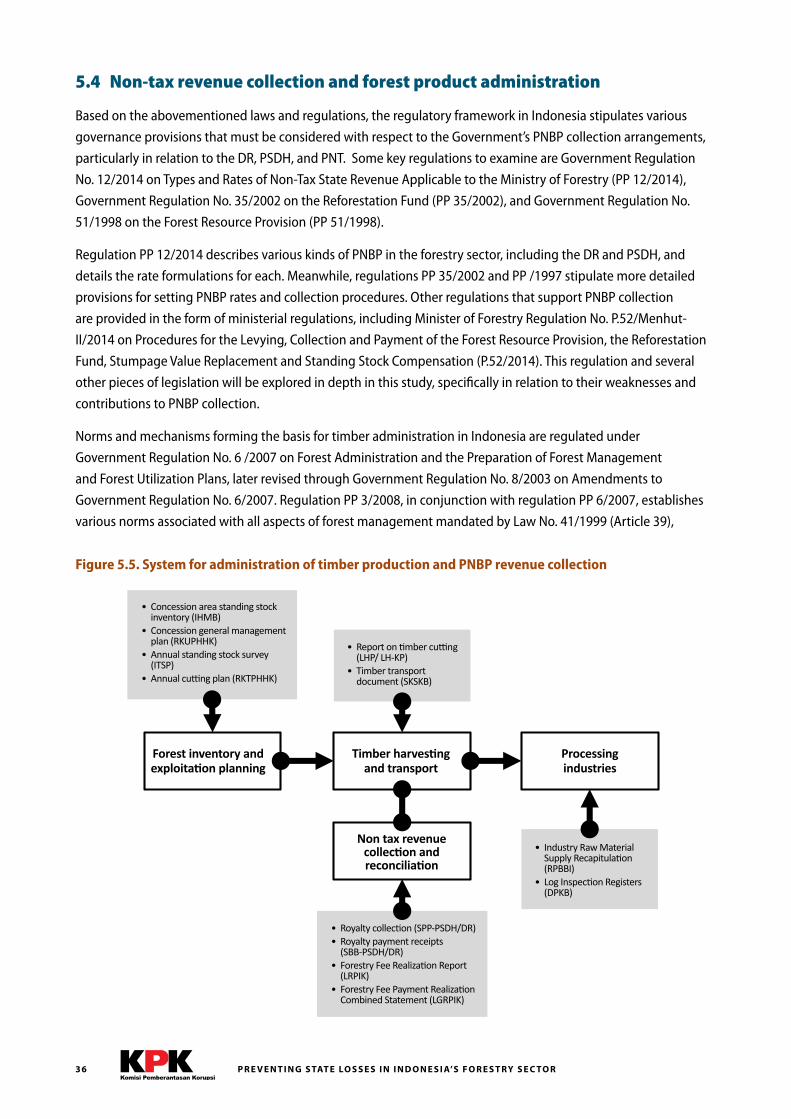
P R E V E N T I N G S TAT E LO S S E S I N I N D O N E S I A’S F O R E S T RY S E C TO R36
5.4 Non-tax revenue collection and forest product administration
Based on the abovementioned laws and regulations, the regulatory framework in Indonesia stipulates various
governance provisions that must be considered with respect to the Government’s PNBP collection arrangements,
particularly in relation to the DR, PSDH, and PNT. Some key regulations to examine are Government Regulation
No. 12/2014 on Types and Rates of Non-Tax State Revenue Applicable to the Ministry of Forestry (PP 12/2014),
Government Regulation No. 35/2002 on the Reforestation Fund (PP 35/2002), and Government Regulation No.
51/1998 on the Forest Resource Provision (PP 51/1998).
Regulation PP 12/2014 describes various kinds of PNBP in the forestry sector, including the DR and PSDH, and
details the rate formulations for each. Meanwhile, regulations PP 35/2002 and PP /1997 stipulate more detailed
provisions for setting PNBP rates and collection procedures. Other regulations that support PNBP collection
are provided in the form of ministerial regulations, including Minister of Forestry Regulation No. P.52/Menhut-
II/2014 on Procedures for the Levying, Collection and Payment of the Forest Resource Provision, the Reforestation
Fund, Stumpage Value Replacement and Standing Stock Compensation (P.52/2014). This regulation and several
other pieces of legislation will be explored in depth in this study, specifically in relation to their weaknesses and
contributions to PNBP collection.
Norms and mechanisms forming the basis for timber administration in Indonesia are regulated under
Government Regulation No. 6 /2007 on Forest Administration and the Preparation of Forest Management
and Forest Utilization Plans, later revised through Government Regulation No. 8/2003 on Amendments to
Government Regulation No. 6/2007. Regulation PP 3/2008, in conjunction with regulation PP 6/2007, establishes
various norms associated with all aspects of forest management mandated by Law No. 41/1999 (Article 39),
• Concession area standing stock inventory (IHMB)
• Concession general management plan (RKUPHHK)
• Annual standing stock survey (ITSP)
• Annual cutting plan (RKTPHHK)
• Report on timber cutting (LHP/ LH-KP)
• Timber transport document (SKSKB)
• Royalty collection (SPP-PSDH/DR)• Royalty payment receipts
(SBB-PSDH/DR)• Forestry Fee Realization Report
(LRPIK)• Forestry Fee Payment Realization
Combined Statement (LGRPIK)
• Industry Raw Material Supply Recapitulation (RPBBI)
• Log Inspection Registers (DPKB)
Forest inventory and exploitation planning
Timber harvesting and transport
Processingindustries
Non tax revenuecollection andreconciliation
Figure 5.5. System for administration of timber production and PNBP revenue collection
37C H A P T E R 5: R E G U L ATO RY F R A M E W O R K F O R N O N - TAX S TAT E
R E V E N U E CO L L E C T I O N I N T H E F O R E S T RY S E C TO R
from issuing licenses to issuing transport documents, including imposition of sanctions for administrative non-
compliance in the forestry sector. With such a broad scope, regulation PP 3/2008 is further supplemented with
various ministerial regulations that establish rules of different components of forest utilization in further detail.
For the purposes of this study, however, the various stages involved in timber production administration and
forestry PNBP collection will be elaborated further below.
Generally, PNBP collection and timber administration are covered by at least four administrative systems,
including: inventory and planning; harvesting and distribution of timber; PNBP collection; and fulfilling raw
material requirements of wood-processing industries. In this study, however, analysis is limited to the PNBP
collection stage. The next section will explain that under the current regulatory framework, all of these stages
also represent control systems. These systems are structured in a hierarchical manner from district forestry offices
up to the Ministry of Forestry. Some specific arrangements also involve other ministries and/or agencies, such as
the Ministry of Finance. In simple terms, improvements in PNBP collection, therefore, are inseparable from how
effectively timber administration and its oversight are carried out.
Administrative systems in timber planning and production
Before timber from natural forests can be harvested, Indonesia’s regulatory framework requires license holders
to issue a series of inventory and planning documents. The requirements and obligations to conduct inventories
are strictly regulated under Law No. 41/1999 on Forestry, Government Regulation No. 44/2004 on Forestry
Planning, and PP 6/2007 in conjunction with PP 3/2008. Regulation PP 44/2004 defines a hierarchical forest
inventory process, from the national level to the field level (Article 5). Other obligations associated with forest
inventories are regulated under PP 3/2008 in conjunction with PP 6/2007. Although they do not specifically refer
to PP 44/2004, these regulations also stipulate various responsibilities for license holders to conduct inventories
before commencing harvesting. These include:
1. Concession Area Standing Stock Inventories (Inventarisasi Hutan Menyeluruh Berkala, or IHMB)
2. Pre-Harvest Standing Stock Inventories (Inventarisasi Tegakan Sebelum Penebangan, or ITSP).
Results of these inventories become part of the assessments of license holders’ work plans for their concession
areas. In forestry sector administration, in addition to conducting inventories of standing stock that will be
harvested, license holders must also prepare harvest plans, namely:
1. Timber Utilization Concession Management Plans (Rencana Kerja Usaha Pemanfaatan Hasil Hutan Kayu, or RKUPHHK)
2. Timber Utilization Annual Harvest Plans (Rencana Kerja Tahunan Pemanfaatan Hasil Hutan Kayu, or RKTPHHK)
The next section will explain the administrative systems relating to inventories and forest production planning
in both natural and plantation forests. In many respects, inventories and production planning in forest
management are regulated in complicated ways, involving various levels of government from district office heads
to the Director General, and various forms of evaluation mechanisms. Implementation of inventory and planning
administration is deemed critical, particularly as their implementation forms the basis for forest exploitation
activities over the long term.
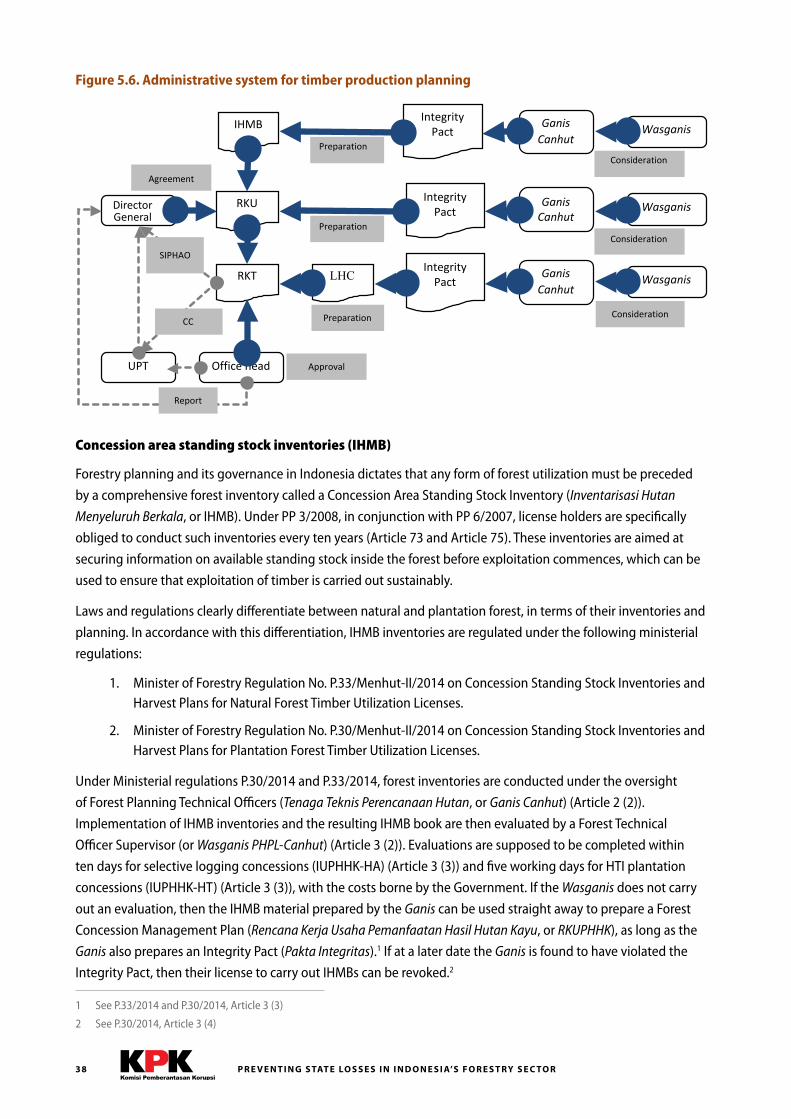
P R E V E N T I N G S TAT E LO S S E S I N I N D O N E S I A’S F O R E S T RY S E C TO R38
Concession area standing stock inventories (IHMB)
Forestry planning and its governance in Indonesia dictates that any form of forest utilization must be preceded
by a comprehensive forest inventory called a Concession Area Standing Stock Inventory (Inventarisasi Hutan
Menyeluruh Berkala, or IHMB). Under PP 3/2008, in conjunction with PP 6/2007, license holders are specifically
obliged to conduct such inventories every ten years (Article 73 and Article 75). These inventories are aimed at
securing information on available standing stock inside the forest before exploitation commences, which can be
used to ensure that exploitation of timber is carried out sustainably.
Laws and regulations clearly differentiate between natural and plantation forest, in terms of their inventories and
planning. In accordance with this differentiation, IHMB inventories are regulated under the following ministerial
regulations:
1. Minister of Forestry Regulation No. P.33/Menhut-II/2014 on Concession Standing Stock Inventories and Harvest Plans for Natural Forest Timber Utilization Licenses.
2. Minister of Forestry Regulation No. P.30/Menhut-II/2014 on Concession Standing Stock Inventories and Harvest Plans for Plantation Forest Timber Utilization Licenses.
Under Ministerial regulations P.30/2014 and P.33/2014, forest inventories are conducted under the oversight
of Forest Planning Technical Officers (Tenaga Teknis Perencanaan Hutan, or Ganis Canhut) (Article 2 (2)).
Implementation of IHMB inventories and the resulting IHMB book are then evaluated by a Forest Technical
Officer Supervisor (or Wasganis PHPL-Canhut) (Article 3 (2)). Evaluations are supposed to be completed within
ten days for selective logging concessions (IUPHHK-HA) (Article 3 (3)) and five working days for HTI plantation
concessions (IUPHHK-HT) (Article 3 (3)), with the costs borne by the Government. If the Wasganis does not carry
out an evaluation, then the IHMB material prepared by the Ganis can be used straight away to prepare a Forest
Concession Management Plan (Rencana Kerja Usaha Pemanfaatan Hasil Hutan Kayu, or RKUPHHK), as long as the
Ganis also prepares an Integrity Pact (Pakta Integritas).1 If at a later date the Ganis is found to have violated the
Integrity Pact, then their license to carry out IHMBs can be revoked.2
1 See P.33/2014 and P.30/2014, Article 3 (3)
2 See P.30/2014, Article 3 (4)
IHMB
RKU
RKT LHC
Ganis Canhut
Integrity Pact
Integrity Pact
Ganis Canhut
Integrity Pact
Ganis Canhut
Wasganis
Wasganis
Wasganis
Dirjen
UPT Office head
SIPHAO
CC
Preparation
Preparation
Preparation
Consideration
Consideration
Consideration
Agreement
Approval
Report
Figure 5.6. Administrative system for timber production planning
DirectorGeneral
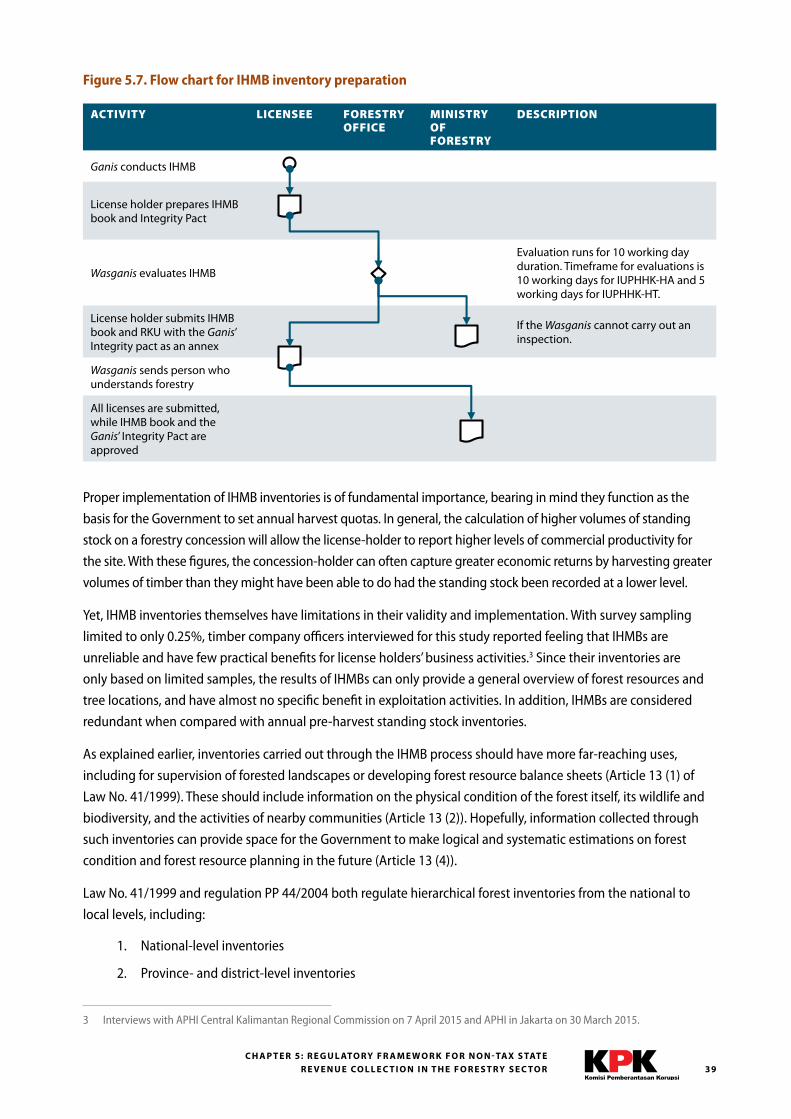
39C H A P T E R 5: R E G U L ATO RY F R A M E W O R K F O R N O N - TAX S TAT E
R E V E N U E CO L L E C T I O N I N T H E F O R E S T RY S E C TO R
Proper implementation of IHMB inventories is of fundamental importance, bearing in mind they function as the
basis for the Government to set annual harvest quotas. In general, the calculation of higher volumes of standing
stock on a forestry concession will allow the license-holder to report higher levels of commercial productivity for
the site. With these figures, the concession-holder can often capture greater economic returns by harvesting greater
volumes of timber than they might have been able to do had the standing stock been recorded at a lower level.
Yet, IHMB inventories themselves have limitations in their validity and implementation. With survey sampling
limited to only 0.25%, timber company officers interviewed for this study reported feeling that IHMBs are
unreliable and have few practical benefits for license holders’ business activities.3 Since their inventories are
only based on limited samples, the results of IHMBs can only provide a general overview of forest resources and
tree locations, and have almost no specific benefit in exploitation activities. In addition, IHMBs are considered
redundant when compared with annual pre-harvest standing stock inventories.
As explained earlier, inventories carried out through the IHMB process should have more far-reaching uses,
including for supervision of forested landscapes or developing forest resource balance sheets (Article 13 (1) of
Law No. 41/1999). These should include information on the physical condition of the forest itself, its wildlife and
biodiversity, and the activities of nearby communities (Article 13 (2)). Hopefully, information collected through
such inventories can provide space for the Government to make logical and systematic estimations on forest
condition and forest resource planning in the future (Article 13 (4)).
Law No. 41/1999 and regulation PP 44/2004 both regulate hierarchical forest inventories from the national to
local levels, including:
1. National-level inventories
2. Province- and district-level inventories
3 Interviews with APHI Central Kalimantan Regional Commission on 7 April 2015 and APHI in Jakarta on 30 March 2015.
Figure 5.7. Flow chart for IHMB inventory preparation
ACTIVITY LICENSEE FORESTRY OFFICE
MINISTRY OF FORESTRY
DESCRIPTION
Ganis conducts IHMB
License holder prepares IHMB book and Integrity Pact
Wasganis evaluates IHMB
Evaluation runs for 10 working day duration. Timeframe for evaluations is 10 working days for IUPHHK-HA and 5 working days for IUPHHK-HT.
License holder submits IHMB book and RKU with the Ganis’ Integrity pact as an annex
If the Wasganis cannot carry out an inspection.
Wasganis sends person who understands forestry
All licenses are submitted, while IHMB book and the Ganis’ Integrity Pact are approved
P R E V E N T I N G S TAT E LO S S E S I N I N D O N E S I A’S F O R E S T RY S E C TO R40
3. Watershed-level inventories
4. Management unit-level inventories
Referring to these provisions, the obligation for management units to carry out inventories has been regulated
since Law No. 41/1999 (Article 13 (3)) was issued. This inventory obligation is regulated further in PP 44/2004,
Article 12 (2), which explains that management units at the local level must conduct at least two kinds of
inventory, the first of which is conducted once every five years and the other conducted annually as part of their
annual harvest plan (Article 12 (3) and (4)). The different forest inventory arrangements under Law No. 41/1999
and PP 44/2004 are bridged in PP 3/2008, in conjunction with PP 6/2007. While PP 44/2004 requires inventories
every five years for local-level management units, PP 3/2008 stipulates that IHMBs only need to be carried out
once every ten years, except when substantial changes to forest condition are found.
The need to verify IHMB inventories can be considered vital if they are understood to be instruments for protecting
against over-exploitation. However, regulation PP 3/2008 in conjunction with PP 6/2007 does not establish an
effective mechanism for verifying IHMBs. As explained earlier, regulations P.30/2014 and P.33/2014 both state that
IHMBs are supervised and evaluated by a Wasganis, who can apply administrative sanctions to a Ganis, if necessary.
Yet, the current arrangements provide no concrete criteria for carrying out verifications of IHMBs.
Another thing to consider is that there are no regulations governing the use of IHMB inventories apart from the
formulation of concession management plans for license holders. Whatever information the Government obtains
through IHMBs is also difficult for the public to access, even though Law No. 41/1999 on Forestry mandates forest
inventories to be used as instruments for systematic oversight of standing stock and for anticipating land cover changes.
This instruction should become part of the Government’s interest to collect and manage information on forests.
Forest concession management plans (RKUPHHK)
Following forest inventories, concession holders must prepare ten-year forest concession management plans
called Rencana Kerja Usaha Pemanfaatan Hasil Hutan Kayu (RKUPHHK, or in abbreviated form, RKU). Even though
Law No. 41/1999 does not specifically regulate this obligation, PP 3/2008 in conjunction with PP 6/2007 instructs
all license holders to prepare RKUs as the basis for long-term forest management. These plans must cover various
activities, including: work area boundary demarcation, standing stock inventories, land preparation, silviculture,
forest protection, and also empowerment of village communities living around the forest. By preparing RKUs, in
theory all license holders should be able to manage and exploit forests sustainably.
The preparation and approval of RKUPHHKs is stipulated in the same regulations that govern IHMBs, i.e. P.30/2014
and P.33/2014. Two regulations associated with RKUs are:
a. Director General of Forestry Business Development Regulation No. P.9/VI-BUHA/2014 on Guidelines for Preparing, Evaluating, and Approving Timber Utilization Work Plans in Natural Forest Timber Utilization Concessions, which regulates the preparation, drafting, evaluation, and approval of RKUs in natural forests; and
b. Director General of Forestry Business Development Regulation No. P.7/VI-BUHT/2014 on Guidelines for the Preparation, Evaluation, and Approval of Timber Utilization Work Plans in Industrial Plantation Forest Timber Utilization Concessions.
Both of these regulations consider RKUs to be important obligations, which, if not carried out, can result in license
revocation. Draft RKUs must be submitted to the Ministry of Forestry no later than one year after concession
license approval. All license holders must have a qualified forest planning technical officer (Ganis Canhut) to
prepare the RKU, which according to requirements should be based on:
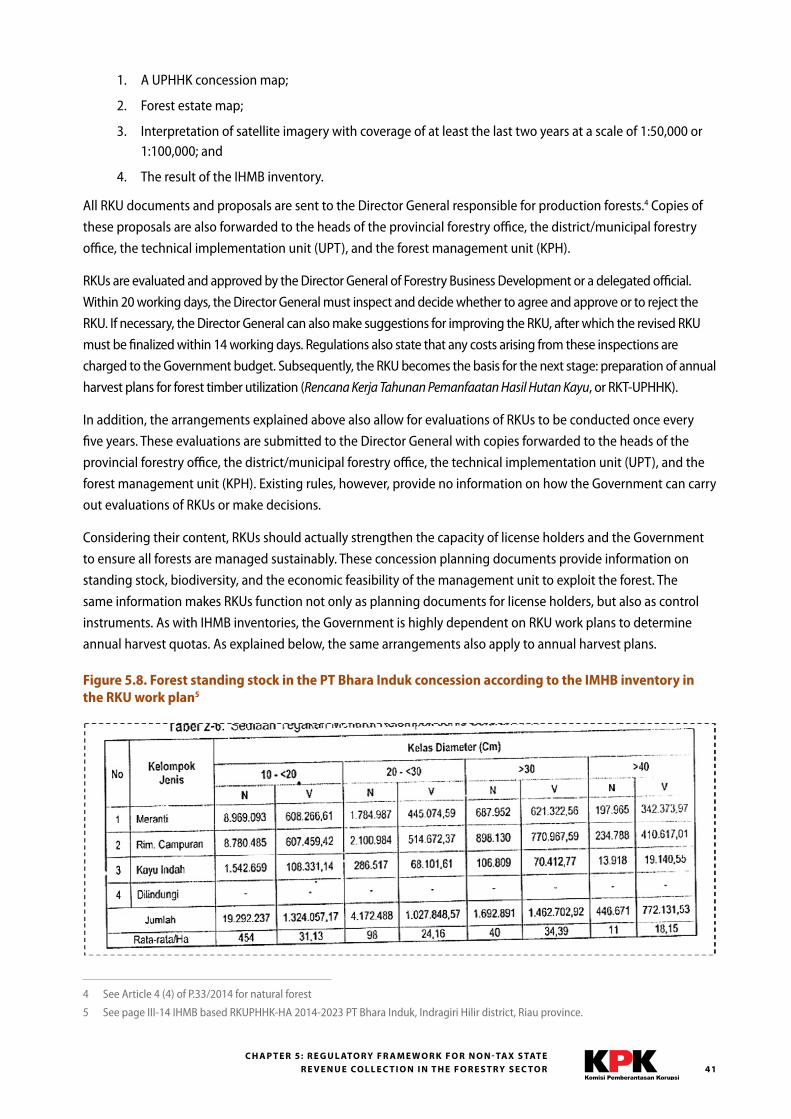
41C H A P T E R 5: R E G U L ATO RY F R A M E W O R K F O R N O N - TAX S TAT E
R E V E N U E CO L L E C T I O N I N T H E F O R E S T RY S E C TO R
1. A UPHHK concession map;
2. Forest estate map;
3. Interpretation of satellite imagery with coverage of at least the last two years at a scale of 1:50,000 or 1:100,000; and
4. The result of the IHMB inventory.
All RKU documents and proposals are sent to the Director General responsible for production forests.4 Copies of
these proposals are also forwarded to the heads of the provincial forestry office, the district/municipal forestry
office, the technical implementation unit (UPT), and the forest management unit (KPH).
RKUs are evaluated and approved by the Director General of Forestry Business Development or a delegated official.
Within 20 working days, the Director General must inspect and decide whether to agree and approve or to reject the
RKU. If necessary, the Director General can also make suggestions for improving the RKU, after which the revised RKU
must be finalized within 14 working days. Regulations also state that any costs arising from these inspections are
charged to the Government budget. Subsequently, the RKU becomes the basis for the next stage: preparation of annual
harvest plans for forest timber utilization (Rencana Kerja Tahunan Pemanfaatan Hasil Hutan Kayu, or RKT-UPHHK).
In addition, the arrangements explained above also allow for evaluations of RKUs to be conducted once every
five years. These evaluations are submitted to the Director General with copies forwarded to the heads of the
provincial forestry office, the district/municipal forestry office, the technical implementation unit (UPT), and the
forest management unit (KPH). Existing rules, however, provide no information on how the Government can carry
out evaluations of RKUs or make decisions.
Considering their content, RKUs should actually strengthen the capacity of license holders and the Government
to ensure all forests are managed sustainably. These concession planning documents provide information on
standing stock, biodiversity, and the economic feasibility of the management unit to exploit the forest. The
same information makes RKUs function not only as planning documents for license holders, but also as control
instruments. As with IHMB inventories, the Government is highly dependent on RKU work plans to determine
annual harvest quotas. As explained below, the same arrangements also apply to annual harvest plans.
Figure 5.8. Forest standing stock in the PT Bhara Induk concession according to the IMHB inventory in the RKU work plan5
4 See Article 4 (4) of P.33/2014 for natural forest
5 See page III-14 IHMB based RKUPHHK-HA 2014-2023 PT Bhara Induk, Indragiri Hilir district, Riau province.
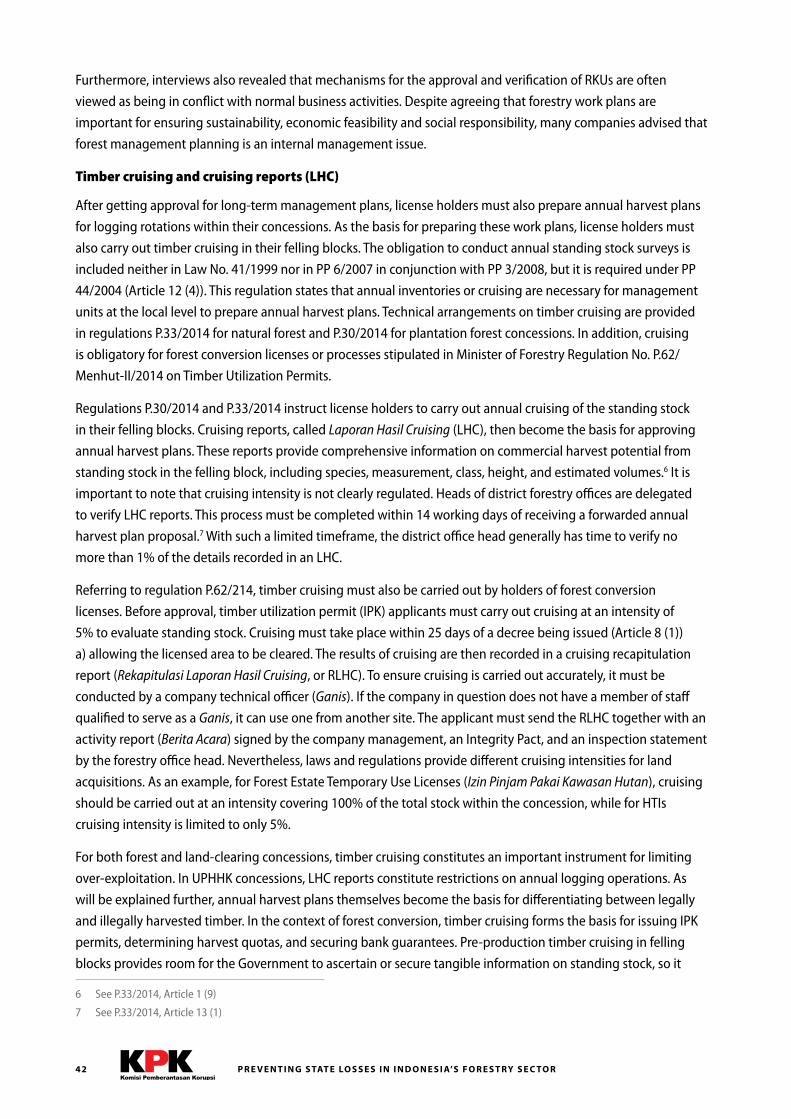
P R E V E N T I N G S TAT E LO S S E S I N I N D O N E S I A’S F O R E S T RY S E C TO R42
Furthermore, interviews also revealed that mechanisms for the approval and verification of RKUs are often
viewed as being in conflict with normal business activities. Despite agreeing that forestry work plans are
important for ensuring sustainability, economic feasibility and social responsibility, many companies advised that
forest management planning is an internal management issue.
Timber cruising and cruising reports (LHC)
After getting approval for long-term management plans, license holders must also prepare annual harvest plans
for logging rotations within their concessions. As the basis for preparing these work plans, license holders must
also carry out timber cruising in their felling blocks. The obligation to conduct annual standing stock surveys is
included neither in Law No. 41/1999 nor in PP 6/2007 in conjunction with PP 3/2008, but it is required under PP
44/2004 (Article 12 (4)). This regulation states that annual inventories or cruising are necessary for management
units at the local level to prepare annual harvest plans. Technical arrangements on timber cruising are provided
in regulations P.33/2014 for natural forest and P.30/2014 for plantation forest concessions. In addition, cruising
is obligatory for forest conversion licenses or processes stipulated in Minister of Forestry Regulation No. P.62/
Menhut-II/2014 on Timber Utilization Permits.
Regulations P.30/2014 and P.33/2014 instruct license holders to carry out annual cruising of the standing stock
in their felling blocks. Cruising reports, called Laporan Hasil Cruising (LHC), then become the basis for approving
annual harvest plans. These reports provide comprehensive information on commercial harvest potential from
standing stock in the felling block, including species, measurement, class, height, and estimated volumes.6 It is
important to note that cruising intensity is not clearly regulated. Heads of district forestry offices are delegated
to verify LHC reports. This process must be completed within 14 working days of receiving a forwarded annual
harvest plan proposal.7 With such a limited timeframe, the district office head generally has time to verify no
more than 1% of the details recorded in an LHC.
Referring to regulation P.62/214, timber cruising must also be carried out by holders of forest conversion
licenses. Before approval, timber utilization permit (IPK) applicants must carry out cruising at an intensity of
5% to evaluate standing stock. Cruising must take place within 25 days of a decree being issued (Article 8 (1))
a) allowing the licensed area to be cleared. The results of cruising are then recorded in a cruising recapitulation
report (Rekapitulasi Laporan Hasil Cruising, or RLHC). To ensure cruising is carried out accurately, it must be
conducted by a company technical officer (Ganis). If the company in question does not have a member of staff
qualified to serve as a Ganis, it can use one from another site. The applicant must send the RLHC together with an
activity report (Berita Acara) signed by the company management, an Integrity Pact, and an inspection statement
by the forestry office head. Nevertheless, laws and regulations provide different cruising intensities for land
acquisitions. As an example, for Forest Estate Temporary Use Licenses (Izin Pinjam Pakai Kawasan Hutan), cruising
should be carried out at an intensity covering 100% of the total stock within the concession, while for HTIs
cruising intensity is limited to only 5%.
For both forest and land-clearing concessions, timber cruising constitutes an important instrument for limiting
over-exploitation. In UPHHK concessions, LHC reports constitute restrictions on annual logging operations. As
will be explained further, annual harvest plans themselves become the basis for differentiating between legally
and illegally harvested timber. In the context of forest conversion, timber cruising forms the basis for issuing IPK
permits, determining harvest quotas, and securing bank guarantees. Pre-production timber cruising in felling
blocks provides room for the Government to ascertain or secure tangible information on standing stock, so it
6 See P.33/2014, Article 1 (9)
7 See P.33/2014, Article 13 (1)
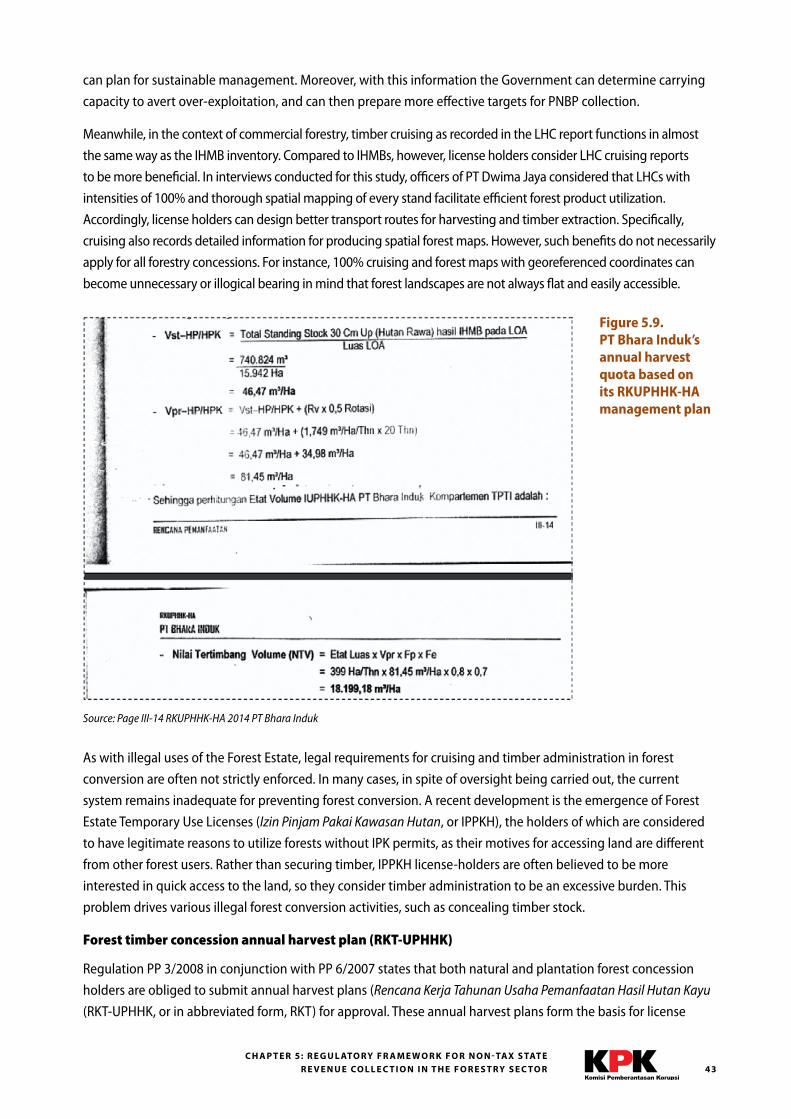
43C H A P T E R 5: R E G U L ATO RY F R A M E W O R K F O R N O N - TAX S TAT E
R E V E N U E CO L L E C T I O N I N T H E F O R E S T RY S E C TO R
can plan for sustainable management. Moreover, with this information the Government can determine carrying
capacity to avert over-exploitation, and can then prepare more effective targets for PNBP collection.
Meanwhile, in the context of commercial forestry, timber cruising as recorded in the LHC report functions in almost
the same way as the IHMB inventory. Compared to IHMBs, however, license holders consider LHC cruising reports
to be more beneficial. In interviews conducted for this study, officers of PT Dwima Jaya considered that LHCs with
intensities of 100% and thorough spatial mapping of every stand facilitate efficient forest product utilization.
Accordingly, license holders can design better transport routes for harvesting and timber extraction. Specifically,
cruising also records detailed information for producing spatial forest maps. However, such benefits do not necessarily
apply for all forestry concessions. For instance, 100% cruising and forest maps with georeferenced coordinates can
become unnecessary or illogical bearing in mind that forest landscapes are not always flat and easily accessible.
Source: Page III-14 RKUPHHK-HA 2014 PT Bhara Induk
As with illegal uses of the Forest Estate, legal requirements for cruising and timber administration in forest
conversion are often not strictly enforced. In many cases, in spite of oversight being carried out, the current
system remains inadequate for preventing forest conversion. A recent development is the emergence of Forest
Estate Temporary Use Licenses (Izin Pinjam Pakai Kawasan Hutan, or IPPKH), the holders of which are considered
to have legitimate reasons to utilize forests without IPK permits, as their motives for accessing land are different
from other forest users. Rather than securing timber, IPPKH license-holders are often believed to be more
interested in quick access to the land, so they consider timber administration to be an excessive burden. This
problem drives various illegal forest conversion activities, such as concealing timber stock.
Forest timber concession annual harvest plan (RKT-UPHHK)
Regulation PP 3/2008 in conjunction with PP 6/2007 states that both natural and plantation forest concession
holders are obliged to submit annual harvest plans (Rencana Kerja Tahunan Usaha Pemanfaatan Hasil Hutan Kayu
(RKT-UPHHK, or in abbreviated form, RKT) for approval. These annual harvest plans form the basis for license
Figure 5.9. PT Bhara Induk’s annual harvest quota based on its RKUPHHK-HA management plan
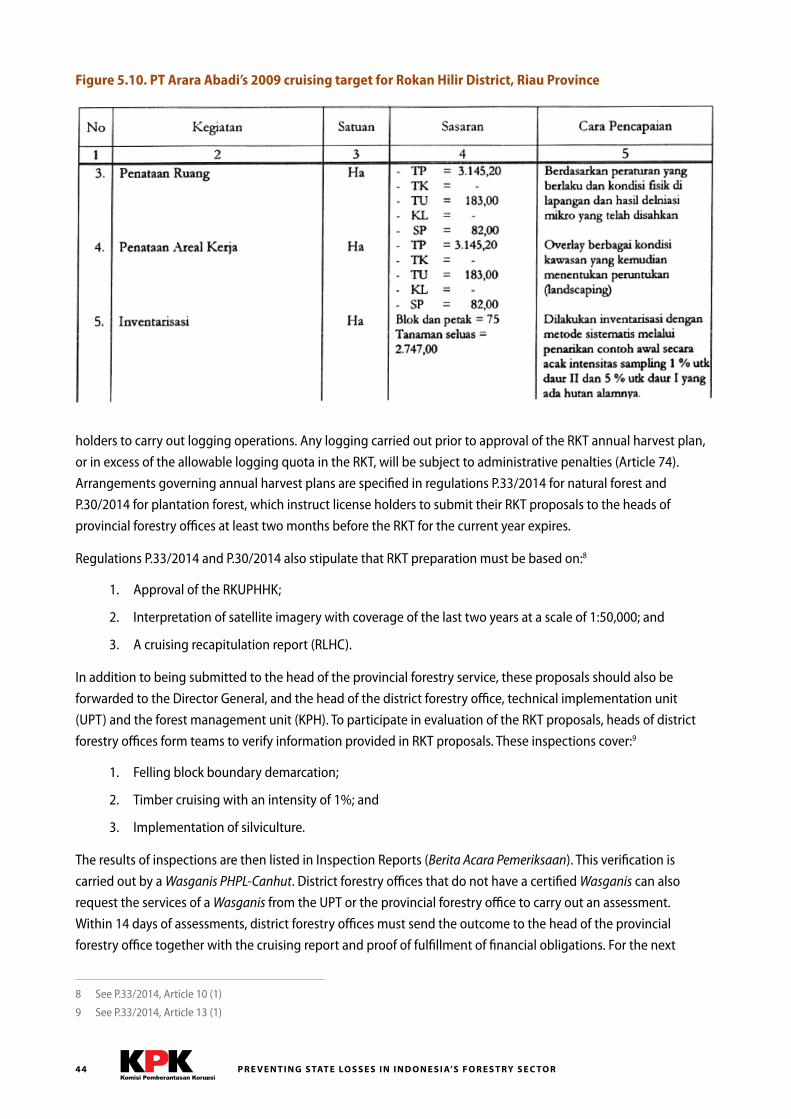
P R E V E N T I N G S TAT E LO S S E S I N I N D O N E S I A’S F O R E S T RY S E C TO R44
holders to carry out logging operations. Any logging carried out prior to approval of the RKT annual harvest plan,
or in excess of the allowable logging quota in the RKT, will be subject to administrative penalties (Article 74).
Arrangements governing annual harvest plans are specified in regulations P.33/2014 for natural forest and
P.30/2014 for plantation forest, which instruct license holders to submit their RKT proposals to the heads of
provincial forestry offices at least two months before the RKT for the current year expires.
Regulations P.33/2014 and P.30/2014 also stipulate that RKT preparation must be based on:8
1. Approval of the RKUPHHK;
2. Interpretation of satellite imagery with coverage of the last two years at a scale of 1:50,000; and
3. A cruising recapitulation report (RLHC).
In addition to being submitted to the head of the provincial forestry service, these proposals should also be
forwarded to the Director General, and the head of the district forestry office, technical implementation unit
(UPT) and the forest management unit (KPH). To participate in evaluation of the RKT proposals, heads of district
forestry offices form teams to verify information provided in RKT proposals. These inspections cover:9
1. Felling block boundary demarcation;
2. Timber cruising with an intensity of 1%; and
3. Implementation of silviculture.
The results of inspections are then listed in Inspection Reports (Berita Acara Pemeriksaan). This verification is
carried out by a Wasganis PHPL-Canhut. District forestry offices that do not have a certified Wasganis can also
request the services of a Wasganis from the UPT or the provincial forestry office to carry out an assessment.
Within 14 days of assessments, district forestry offices must send the outcome to the head of the provincial
forestry office together with the cruising report and proof of fulfillment of financial obligations. For the next
8 See P.33/2014, Article 10 (1)
9 See P.33/2014, Article 13 (1)
Figure 5.10. PT Arara Abadi’s 2009 cruising target for Rokan Hilir District, Riau Province
45C H A P T E R 5: R E G U L ATO RY F R A M E W O R K F O R N O N - TAX S TAT E
R E V E N U E CO L L E C T I O N I N T H E F O R E S T RY S E C TO R
14 days, the head of the provincial forestry office must also assess the Berita Acara and decide to approve or
reject the proposed RKT. Then, if the head of the provincial forestry office refuses to assess or inspect the RKT
proposal, current rules also authorize the Director General on behalf of the Minister of Forestry to take over the
administrative process.10 Additionally, a license holder that has PHPL certification can also issue an RKT through
self-approval.11 Once approved, the license holder must submit the RKT to the Director General, and the heads of
the provincial forestry office, the UPT, and the district forestry office.12
In the overall bureaucracy RKTs, like RKUs, are not only instruments for planning, but also instruments of control
for the Government. Approval of an RKT document also includes the plan, commitment and restriction to exploit
forest for a one-year timeframe. Within this framework, approved RKTs also cover:
1. The silviculture and harvest system;
2. Use of forest timber;
3. Forest protection;
4. Management of human resources, including technical and non-technical staff;
5. Research and community empowerment;
6. Collection points, log ponds, machinery and trails; and
7. Planting and seeding plans.
The likelihood of ineffective internal controls can be found if evaluations conducted by provincial and district
forestry offices are compared with self-assessments prepared by forest concession-holders. Internal controls can
be weakened when self- assessments do not follow standard formats usually included in RKTs.
Administration systems for timber production and distribution
Once timber has been harvested, timber administration begins. The first stage of timber administration involves
reporting the volume, class, species and measurements of harvested timber. This process is recorded and verified
right up to the end users, namely wood-processing industries. The Government regulates several administrative
documents for this purpose as a means for inspecting and verifying the origins of timber at each stage of trading,
starting from the collection point up to the processing industry. The scope of this study, however, is limited only
to collection and flow of forestry sector PNBP. Generally, timber administration aims to ensure that all wood on
the market originates from legitimate sources and has fulfilled its financial obligations to the state.13
After timber has been harvested and reported, the next stage is to ensure that all timber removed from the
forest is reported and is legal. Generally, laws and regulations demand that all logs transported from forests be
accompanied by transport documents stating that the timber was obtained legally. This obligation is regulated
in the form of penalties in Law No. 41/1999. Referring to this law, these documents are used to verify physical
congruity in terms of species, amount and volume. If inconsistencies are found, then the law deems the control or
transport of timber not to be accompanied with legitimate papers.14
The obligation to have documents explaining the legitimacy of timber being transported is mentioned expressly
in Article 119 of regulation PP 6/2007 in conjunction with PP 3/2008. In the following article, the regulation
10 See Article 14 (4)
11 See P.33/2014, Article 11 (1)
12 See P.33/2014, Article 11 (2)
13 See P.41/2014, Article 2 and P.42/2014, Article 2 (2)
14 Penalties for transporting timber without accompanying documents showing legality are specified under Law No. 18/2013.
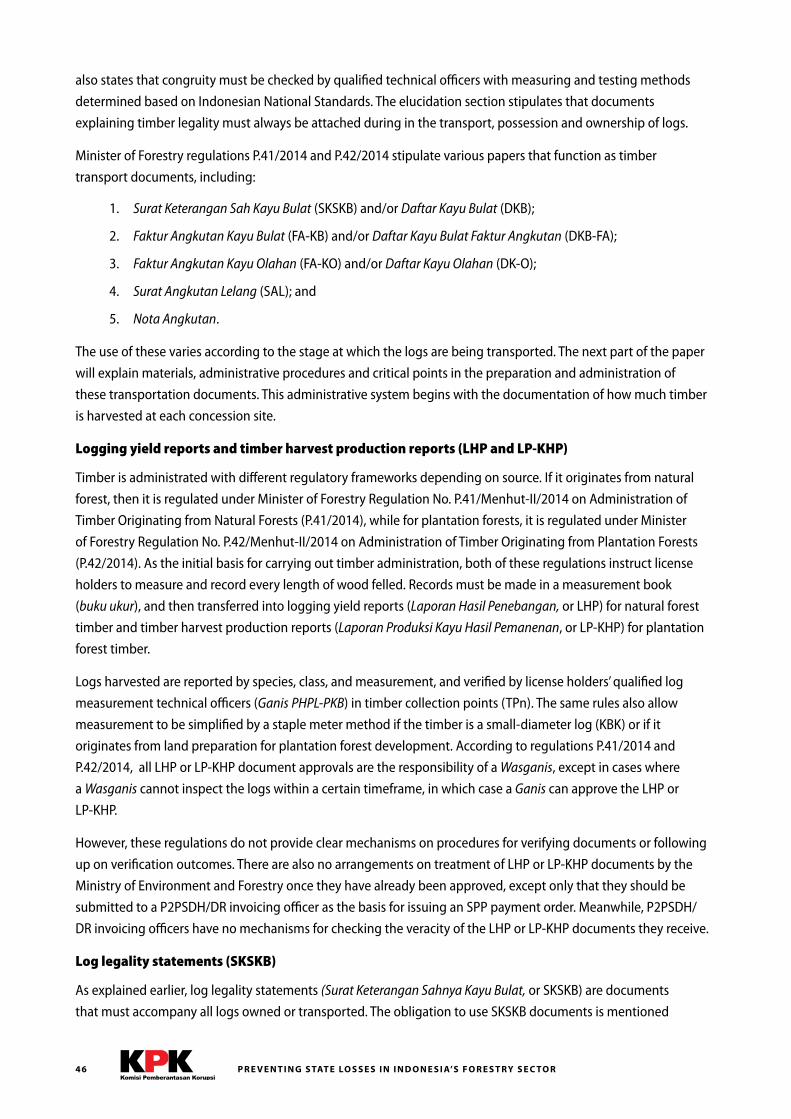
P R E V E N T I N G S TAT E LO S S E S I N I N D O N E S I A’S F O R E S T RY S E C TO R46
also states that congruity must be checked by qualified technical officers with measuring and testing methods
determined based on Indonesian National Standards. The elucidation section stipulates that documents
explaining timber legality must always be attached during in the transport, possession and ownership of logs.
Minister of Forestry regulations P.41/2014 and P.42/2014 stipulate various papers that function as timber
transport documents, including:
1. Surat Keterangan Sah Kayu Bulat (SKSKB) and/or Daftar Kayu Bulat (DKB);
2. Faktur Angkutan Kayu Bulat (FA-KB) and/or Daftar Kayu Bulat Faktur Angkutan (DKB-FA);
3. Faktur Angkutan Kayu Olahan (FA-KO) and/or Daftar Kayu Olahan (DK-O);
4. Surat Angkutan Lelang (SAL); and
5. Nota Angkutan.
The use of these varies according to the stage at which the logs are being transported. The next part of the paper
will explain materials, administrative procedures and critical points in the preparation and administration of
these transportation documents. This administrative system begins with the documentation of how much timber
is harvested at each concession site.
Logging yield reports and timber harvest production reports (LHP and LP-KHP)
Timber is administrated with different regulatory frameworks depending on source. If it originates from natural
forest, then it is regulated under Minister of Forestry Regulation No. P.41/Menhut-II/2014 on Administration of
Timber Originating from Natural Forests (P.41/2014), while for plantation forests, it is regulated under Minister
of Forestry Regulation No. P.42/Menhut-II/2014 on Administration of Timber Originating from Plantation Forests
(P.42/2014). As the initial basis for carrying out timber administration, both of these regulations instruct license
holders to measure and record every length of wood felled. Records must be made in a measurement book
(buku ukur), and then transferred into logging yield reports (Laporan Hasil Penebangan, or LHP) for natural forest
timber and timber harvest production reports (Laporan Produksi Kayu Hasil Pemanenan, or LP-KHP) for plantation
forest timber.
Logs harvested are reported by species, class, and measurement, and verified by license holders’ qualified log
measurement technical officers (Ganis PHPL-PKB) in timber collection points (TPn). The same rules also allow
measurement to be simplified by a staple meter method if the timber is a small-diameter log (KBK) or if it
originates from land preparation for plantation forest development. According to regulations P.41/2014 and
P.42/2014, all LHP or LP-KHP document approvals are the responsibility of a Wasganis, except in cases where
a Wasganis cannot inspect the logs within a certain timeframe, in which case a Ganis can approve the LHP or
LP-KHP.
However, these regulations do not provide clear mechanisms on procedures for verifying documents or following
up on verification outcomes. There are also no arrangements on treatment of LHP or LP-KHP documents by the
Ministry of Environment and Forestry once they have already been approved, except only that they should be
submitted to a P2PSDH/DR invoicing officer as the basis for issuing an SPP payment order. Meanwhile, P2PSDH/
DR invoicing officers have no mechanisms for checking the veracity of the LHP or LP-KHP documents they receive.
Log legality statements (SKSKB)
As explained earlier, log legality statements (Surat Keterangan Sahnya Kayu Bulat, or SKSKB) are documents
that must accompany all logs owned or transported. The obligation to use SKSKB documents is mentioned
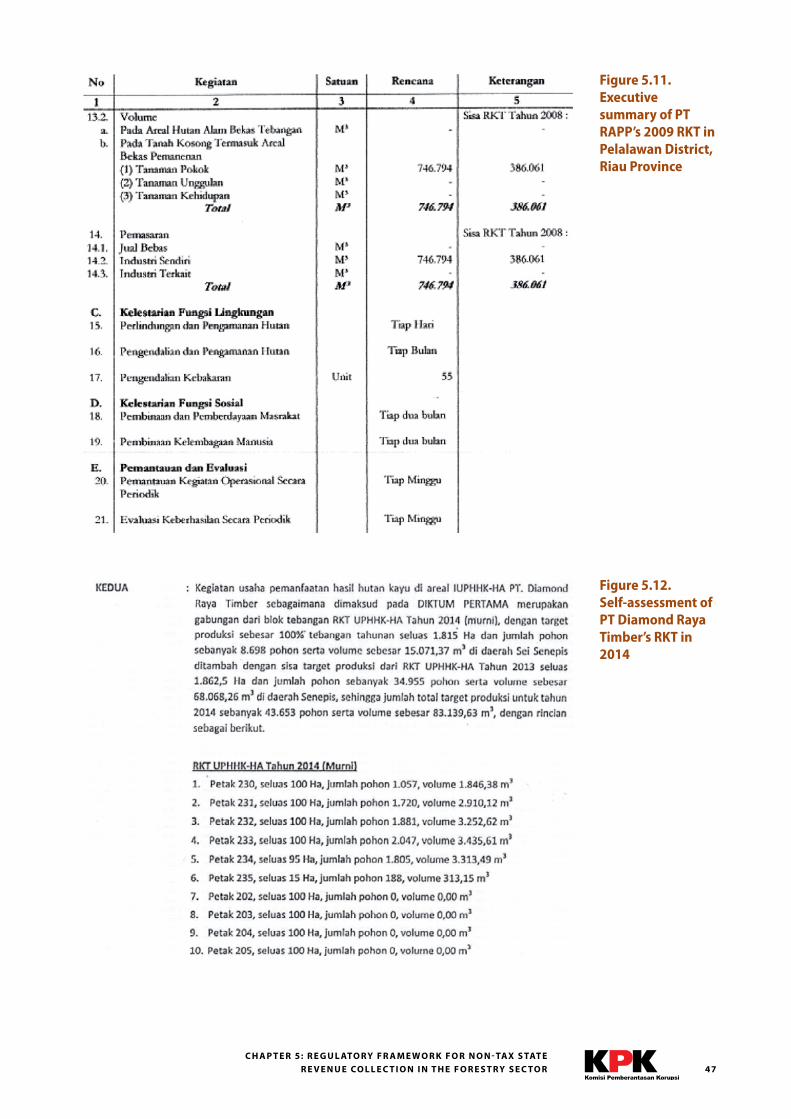
47C H A P T E R 5: R E G U L ATO RY F R A M E W O R K F O R N O N - TAX S TAT E
R E V E N U E CO L L E C T I O N I N T H E F O R E S T RY S E C TO R
Figure 5.11. Executive summary of PT RAPP’s 2009 RKT in Pelalawan District, Riau Province
Figure 5.12. Self-assessment of PT Diamond Raya Timber’s RKT in 2014
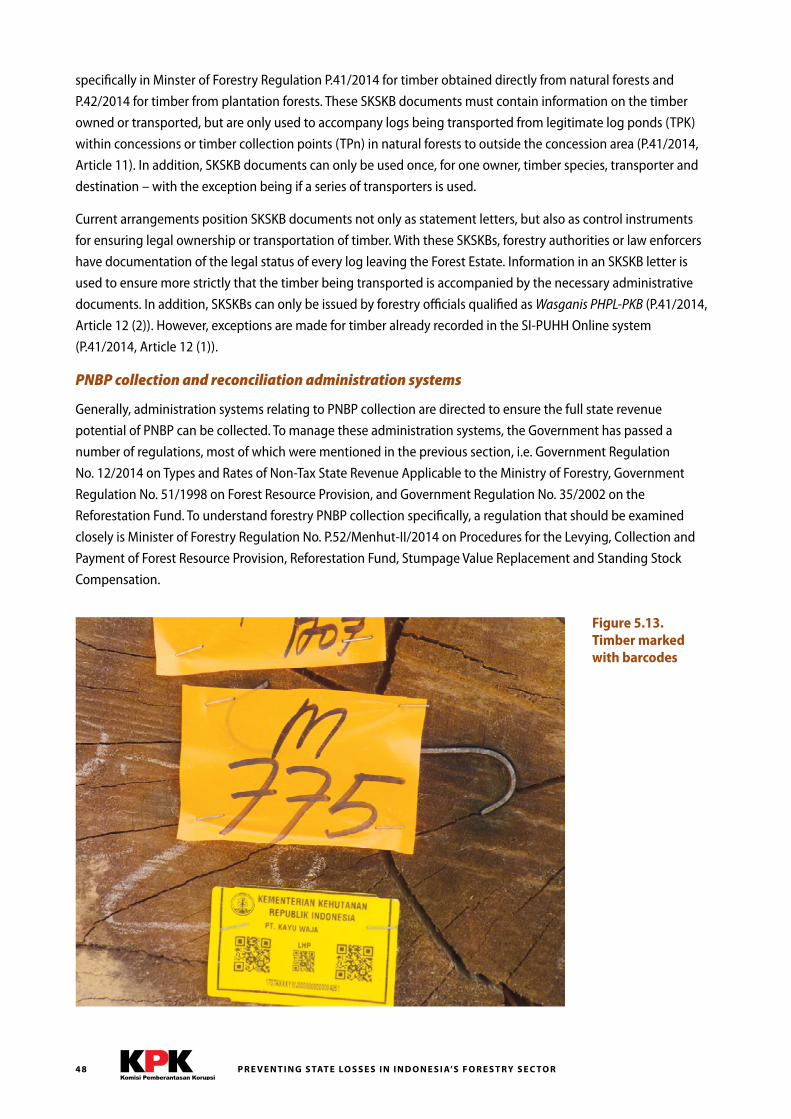
P R E V E N T I N G S TAT E LO S S E S I N I N D O N E S I A’S F O R E S T RY S E C TO R48
specifically in Minster of Forestry Regulation P.41/2014 for timber obtained directly from natural forests and
P.42/2014 for timber from plantation forests. These SKSKB documents must contain information on the timber
owned or transported, but are only used to accompany logs being transported from legitimate log ponds (TPK)
within concessions or timber collection points (TPn) in natural forests to outside the concession area (P.41/2014,
Article 11). In addition, SKSKB documents can only be used once, for one owner, timber species, transporter and
destination – with the exception being if a series of transporters is used.
Current arrangements position SKSKB documents not only as statement letters, but also as control instruments
for ensuring legal ownership or transportation of timber. With these SKSKBs, forestry authorities or law enforcers
have documentation of the legal status of every log leaving the Forest Estate. Information in an SKSKB letter is
used to ensure more strictly that the timber being transported is accompanied by the necessary administrative
documents. In addition, SKSKBs can only be issued by forestry officials qualified as Wasganis PHPL-PKB (P.41/2014,
Article 12 (2)). However, exceptions are made for timber already recorded in the SI-PUHH Online system
(P.41/2014, Article 12 (1)).
PNBP collection and reconciliation administration systems
Generally, administration systems relating to PNBP collection are directed to ensure the full state revenue
potential of PNBP can be collected. To manage these administration systems, the Government has passed a
number of regulations, most of which were mentioned in the previous section, i.e. Government Regulation
No. 12/2014 on Types and Rates of Non-Tax State Revenue Applicable to the Ministry of Forestry, Government
Regulation No. 51/1998 on Forest Resource Provision, and Government Regulation No. 35/2002 on the
Reforestation Fund. To understand forestry PNBP collection specifically, a regulation that should be examined
closely is Minister of Forestry Regulation No. P.52/Menhut-II/2014 on Procedures for the Levying, Collection and
Payment of Forest Resource Provision, Reforestation Fund, Stumpage Value Replacement and Standing Stock
Compensation.
Figure 5.13. Timber marked with barcodes
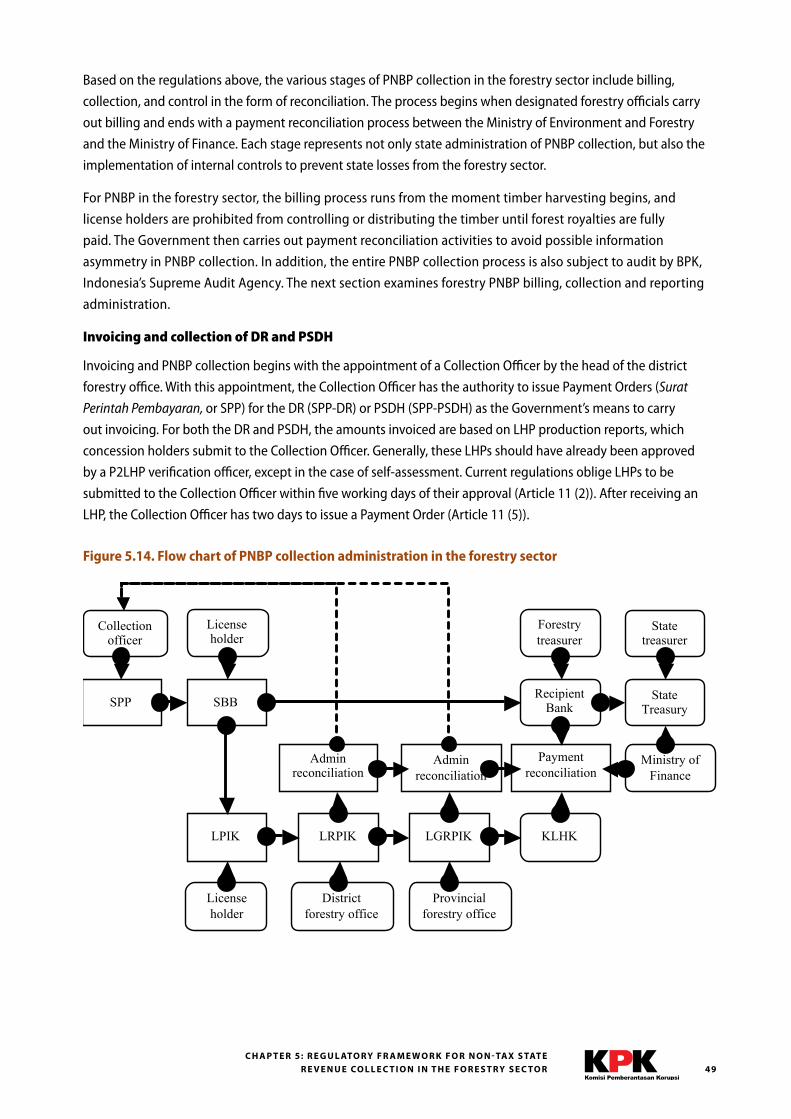
49C H A P T E R 5: R E G U L ATO RY F R A M E W O R K F O R N O N - TAX S TAT E
R E V E N U E CO L L E C T I O N I N T H E F O R E S T RY S E C TO R
Based on the regulations above, the various stages of PNBP collection in the forestry sector include billing,
collection, and control in the form of reconciliation. The process begins when designated forestry officials carry
out billing and ends with a payment reconciliation process between the Ministry of Environment and Forestry
and the Ministry of Finance. Each stage represents not only state administration of PNBP collection, but also the
implementation of internal controls to prevent state losses from the forestry sector.
For PNBP in the forestry sector, the billing process runs from the moment timber harvesting begins, and
license holders are prohibited from controlling or distributing the timber until forest royalties are fully
paid. The Government then carries out payment reconciliation activities to avoid possible information
asymmetry in PNBP collection. In addition, the entire PNBP collection process is also subject to audit by BPK,
Indonesia’s Supreme Audit Agency. The next section examines forestry PNBP billing, collection and reporting
administration.
Invoicing and collection of DR and PSDH
Invoicing and PNBP collection begins with the appointment of a Collection Officer by the head of the district
forestry office. With this appointment, the Collection Officer has the authority to issue Payment Orders (Surat
Perintah Pembayaran, or SPP) for the DR (SPP-DR) or PSDH (SPP-PSDH) as the Government’s means to carry
out invoicing. For both the DR and PSDH, the amounts invoiced are based on LHP production reports, which
concession holders submit to the Collection Officer. Generally, these LHPs should have already been approved
by a P2LHP verification officer, except in the case of self-assessment. Current regulations oblige LHPs to be
submitted to the Collection Officer within five working days of their approval (Article 11 (2)). After receiving an
LHP, the Collection Officer has two days to issue a Payment Order (Article 11 (5)).
Figure 5.14. Flow chart of PNBP collection administration in the forestry sector
State treasurer
Payment reconciliation
Recipient Bank
State Treasury
KLHK
Ministry of Finance
SBB
License holder
Collection officer
SPP
LGRPIK LRPIK LPIK
License holder
District forestry office
Provincial forestry office
Admin reconciliation
Admin reconciliation
Forestry treasurer
P R E V E N T I N G S TAT E LO S S E S I N I N D O N E S I A’S F O R E S T RY S E C TO R50
This mechanism shows that the state only applies PNBP levies concretely on the value of timber actually
exploited or cut down. In this way, PNBP levies are expected to be carried out in the most efficient manner;
namely, no timber is supposed to be harvested without the appropriate royalties being collected. In addition, the
calculation of PNBP based on LHP production reports is also meant to ensure that no timber is removed from the
forest without financial obligations being met beforehand. This control function is expected to ensure the system
runs effectively, so that even if logs are harvested without proper permits, they will not be allowed to be removed
from the logging site and to enter the marketplace. This barrier is expected to be a disincentive for those actors
engaged in illegal logging.
Nevertheless, the current system is still likely to experience problems, particularly as existing arrangements
provide no mechanisms for verification. Collection Officers do not have adequate information and mechanisms
for verifying the veracity of the LHPs they receive in the limited time available. Furthermore, if for some reason
an LHP is not available, perhaps due to the timber being damaged, lost or buried, then PNBP dues are estimated
based on the LHC cruising report (Article 9 and 13 (1)). If an LHC is also unavailable, PNBP can be calculated by
basing it on the standing stock availability ratio in the region (Article 9 and 13 (2)). These rules, however, provide
no mechanism for using the standing stock availability ratio, and make no mention of what references should be
used in applying them. When carried out without the provision of strict references or criteria, such arrangements
provide too much discretion for billing amounts of PNBP. According to the annex of regulation P.52/2014,
a payment order must include the 15-digit license holder number, harvest block location, LHP and LP-KHP
reference numbers, and tabulation tracing lists of all timber subject to payments with classification by species
and royalty.
Returning to billing, once a payment order is issued, the party responsible for payment (Wajib Bayar), in this case
the concession harvesting the timber, has six working days to pay its obligations. Furthermore, the Wajib Bayar
can be subject to administrative fines (Article 24 (2)). Yet, generally, PNBP collection carried out by the Collection
Officer is highly dependent on the implementation of administration beforehand. Similarly, the issuing of an
SKSKB is highly dependent on internal controls carried out by the Collection Officer. As explained earlier, proof of
payment from the recipient bank (Bank Persepsi) constitutes the basis for a P2SKSKB verification officer to issue an
SKSKB transport document. With this proof of payment, rights over the timber move from state control to private
ownership. Oversight, therefore, is critical for the P2SKSKB verification officer to ensure the veracity of the proof
of payment, or consider the thoroughness of the information submitted.
PNBP payment obligations, as regulated under P.52/2014, are made to the Ministry’s Comptroller (Bendaharawan
Penerima) (Article 24 (1)). This has the potential to cause uncertainty as Law No. 20/1997 on Non-Tax State
Revenue mandates that PNBP payments must be transferred directly to the State Treasury account (Article 6 (2) of
Law No. 20/1997). This article states that:
Appointed Government Institutions as stipulated in paragraph (1), are obliged to pay Non-Tax State Revenues
they receive directly to the State Treasury as stipulated in Article 4 .
DR and PSDH reconciliation
In addition to billing and payment administration mechanisms, PNBP governance in the Ministry of Environment
and Forestry also provides a PNBP collection control mechanism. This tiered control process is carried out from
the district forestry office level up to the Ministry. The various stages show how there is an awareness of the
likelihood of errors or manipulation occurring in PNBP collection, so a second-layer control mechanism should be
provided for ensuring PNBP collection administration runs effectively.
51C H A P T E R 5: R E G U L ATO RY F R A M E W O R K F O R N O N - TAX S TAT E
R E V E N U E CO L L E C T I O N I N T H E F O R E S T RY S E C TO R
Minister of Forestry Regulation No. P.52/2014 provides that on the fifth day of each month, forestry fee payment
reports (Laporan Pembayaran Iuran Kehutanan, or LPIK) should be submitted to the head of the district forestry
office with copies forwarded to the heads of the provincial forestry office and the technical implementation
unit (UPT) (Article 29). The Collection Officer submits similar reports to the head of the district forestry office.
Consequently, every month district forestry offices should have reports of forestry sector PNBP invoices and
payments.
District forestry offices then do the same thing by issuing forestry fee deposit realization reports (Laporan
Realisasi Penyetoran Iuran Kehutanan, or LRPIK). These reports must be submitted by heads of district forestry
offices on the tenth of every month to the head of the provincial forestry office with copies forwarded to
the Secretary General, the Director General, and UPT head. Meanwhile, heads of provincial offices also send
combined forestry fee revenue realization statements (Laporan Gabungan Realisasi Penerimaan Iuran Kehutanan,
or LGRPIK) to the Secretary General, with copies forwarded to the Director General and UPT head. So, the Ministry
should manage data on state revenue receipts from every company holding a forestry license, for every month
and from every location.
In addition to the submission of these documents, there is also a tiered reconciliation process. Every three
months, heads of district forestry offices must reconcile SPP Payment Orders with the various company
documents proving control and distribution of forest timber (Article 26 (1)). In addition to quarterly checks,
reconciliation between license holders and district forestry offices is also carried out annually. Heads of provincial
forestry offices then carry out administrative reconciliation with district forestry offices. Minister of Forestry
Regulation P.52/2014 firmly states that collection officers must immediately invoice for any PNBP shortfalls.
P R E V E N T I N G S TAT E LO S S E S I N I N D O N E S I A’S F O R E S T RY S E C TO R52
Chapter 6: The management of data on reported timber production and non-tax revenue collection is insufficient for holding companies accountable to meet fiscal obligations to the state.Effective timber administration and efficient non-tax revenue collection depend on accurate and
comprehensive data. This study examined publicly available data on timber production and PNBP collection,
as well as non-published data obtained from the Ministry of Environment and Forestry, several of the
Ministry’s regional forestry offices (BP2HP), and regional government forestry agencies (Dinas Kehutanan) in
select provinces. In addition to compilations of statistics, this data included company-specific information that
is not publicly available.
The study found that KLHK’s collection and management of timber production data is far from adequate. Data
is often incomplete, internally inconsistent, and/or inaccurate. The incomplete data contributes to weakening
internal controls, meaning data cannot be cross-checked or verified. The poor quality of data collection and
management is both an indicator of poor oversight of timber administration and PNBP collection as well as a
substantial barrier to improving timber administration and PNBP collection.
6.1 The Ministry of Environment and Forestry does not keep records of PNBP collection by company.
In a September 2014 letter, KPK’s Deputy of Corruption Prevention requested that KLHK provide, among other
items, documentation of the following:
1. Reforestation Fund receipts by province for 2000–2014.
2. Reforestation Fund receipts by company for 2000–2014.
3. Reforestation Fund receipts detailed as (company) payments based on year and based on arrears for the years 2000–2014.
4. Reforestation Fund payment arrears data by company for 2000–2014.
5. PSDH receipts by province for 2000–2014.
6. PSDH receipts by company for 2000–2014.
7. PSDH receipts detailed as (company) payments based on year and based on arrears for the years 2000–2014.
8. PSDH payment arrears data by company for 2000–2014.
In response to this request, KPK received a letter from the Head of the Financial Bureau at the Ministry of Forestry
(Surat Kepala Biro Keuangan S .518/KEU-2/2014) dated 29 October 2014, stating that the Ministry’s Comptroller
(Bendahara Penerima) does not compile data on DR or PSDH by the parties responsible for payment (Wajib Bayar)
or by province.
53
C H A P T E R 6: T H E M A N AG E M E N T O F D ATA O N R E P O R T E D T I M B E R P R O D U C T I O N A N D N O N - TAX R E V E N U E CO L L E C T I O N I S I N S U F F I C I E N T F O R H O L D I N G CO M PA N I E S
ACCO U N TA B L E TO M E E T F I S C A L O B L I G AT I O N S TO T H E S TAT E
If it is indeed true that the Ministry does not maintain these basic records on DR and PSDH receipts and
outstanding obligations, then KLHK cannot possibly hold companies accountable for meeting their fiscal
obligations to the state. This is a fundamental flaw in KLHK’s accounting practices and data management related
to non-tax revenue collection.
6.2 Timber production volumes reported by KLHK are inconsistent across sources, historical data are changed in reports from subsequent years, and categories for reporting sources of wood production vary from one year to the next without explanation.
The most fundamental questions regarding the administration of timber production are what volumes of logs
originating from natural forests were reported, and from what sources was the timber harvested? In order
to manage Indonesia’s forest resources effectively, these two questions must be explained with accountable
information. However, the manner in which KLHK reports timber production data makes it difficult to obtain
responses to these questions that are accurate and unambiguous. This conclusion is based on a detailed
examination of KLHK’s official timber production statistics over the 12-year study period. The two main sources
of information on timber production that the Ministry makes available to the public are: 1) an annual statistical
yearbook called Statistik Kehutanan; and 2) an online database for the Recapitulation of Industrial Raw Material
Supply (Rekapitulasi Pemenuhan Bahan Baku Industri, or RPBBI) for wood-processing industries. The RPBBI
database publishes annual statistics for both planned and realized log consumption for wood-processing
industries with a capacity above 6,000 m3/year.
Particularly in the last several years, timber production data reported by the Ministry has been inconsistent
across sources, and the reporting categories have changed without adequate explanation. In 2013, for example,
log production from HPH selective-logging concessions was reported to be 3,672,594 m3 in Statistik Kehutanan,
(see Tabel IV.6.1 “Rekapitulasi Produksi Kayu Bulat Berdasarkan Sumber Produksi”). In a different table within the
same yearbook (Tabel IV.5.3 “Realisasi Penggunaan Bahan Baku IPHHK Kapasitas Izin di atas 6000 m3/Tahun per
Provinsi Tahun 2013”), timber production sourced from HPH concessions is reported to be 6,621,643 m3. In the
RPBBI 2013 statistics published on KLHK’s website, industry use of timber from HPH concessions is reported to
be 5,029,626 m3. With such widely diverging reported figures and no explanation of the variation between them,
it is unclear how much timber was actually produced by HPH concession-holders and how much of that was
consumed by wood-processing industries.
Similar issues were observed for the reported volumes of wood production by HTI plantation concessions and the
use of timber from HTI plantations by wood-processing industries. In Table IV.6.1 of Statistik Kehutanan 2013, HTI
wood production is reported to be 19,554,418 m3 for 2013. In Table IV.5.3 of the same document, consumption of
wood from HTI concessions by forest industries is reported to be 35,288,880 m3. It remains unclear what accounts
for this difference of 15,734,462 m3 of HTI wood that was reportedly consumed by forest industries and where
this additional wood may have come from. Also, in the 2013 RPBBI data published on the KLHK website, the use
of HTI wood by forest industries is reported to be 29,668,946 m3, or 5,619,934 m3 less than the figure reported in
Table IV.5.3.
Though wood recorded as being produced by HTI is presumably not from natural forests, discrepancies in
reported production and industry consumption statistics raise important questions as to whether this is actually
the case. According to forestry experts interviewed for this study, the fact that industry consumption of wood
from HTI sources is reported to be so far higher than reported HTI production suggests that natural forest timber
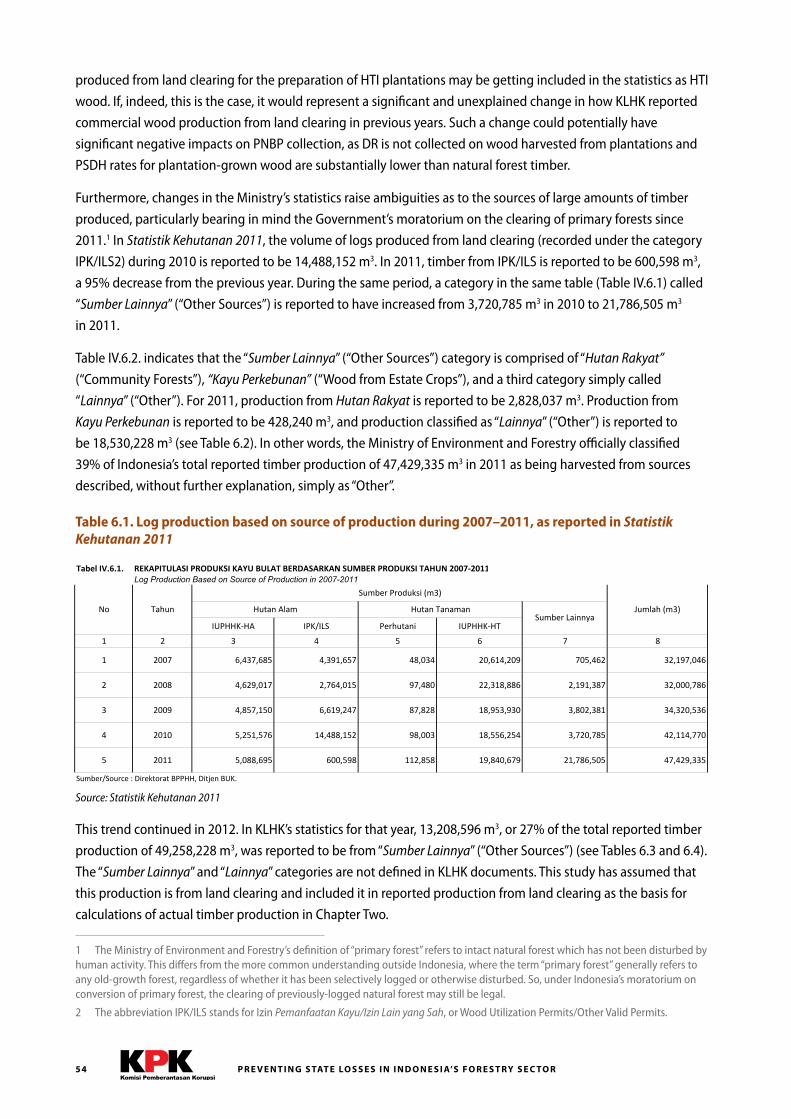
P R E V E N T I N G S TAT E LO S S E S I N I N D O N E S I A’S F O R E S T RY S E C TO R54
produced from land clearing for the preparation of HTI plantations may be getting included in the statistics as HTI
wood. If, indeed, this is the case, it would represent a significant and unexplained change in how KLHK reported
commercial wood production from land clearing in previous years. Such a change could potentially have
significant negative impacts on PNBP collection, as DR is not collected on wood harvested from plantations and
PSDH rates for plantation-grown wood are substantially lower than natural forest timber.
Furthermore, changes in the Ministry’s statistics raise ambiguities as to the sources of large amounts of timber
produced, particularly bearing in mind the Government’s moratorium on the clearing of primary forests since
2011.1 In Statistik Kehutanan 2011, the volume of logs produced from land clearing (recorded under the category
IPK/ILS2) during 2010 is reported to be 14,488,152 m3. In 2011, timber from IPK/ILS is reported to be 600,598 m3,
a 95% decrease from the previous year. During the same period, a category in the same table (Table IV.6.1) called
“Sumber Lainnya” (“Other Sources”) is reported to have increased from 3,720,785 m3 in 2010 to 21,786,505 m3
in 2011.
Table IV.6.2. indicates that the “Sumber Lainnya” (“Other Sources”) category is comprised of “Hutan Rakyat”
(“Community Forests”), “Kayu Perkebunan” (“Wood from Estate Crops”), and a third category simply called
“Lainnya” (“Other”). For 2011, production from Hutan Rakyat is reported to be 2,828,037 m3. Production from
Kayu Perkebunan is reported to be 428,240 m3, and production classified as “Lainnya” (“Other”) is reported to
be 18,530,228 m3 (see Table 6.2). In other words, the Ministry of Environment and Forestry officially classified
39% of Indonesia’s total reported timber production of 47,429,335 m3 in 2011 as being harvested from sources
described, without further explanation, simply as “Other”.
Table 6.1. Log production based on source of production during 2007–2011, as reported in Statistik Kehutanan 2011
Source: Statistik Kehutanan 2011
This trend continued in 2012. In KLHK’s statistics for that year, 13,208,596 m3, or 27% of the total reported timber
production of 49,258,228 m3, was reported to be from “Sumber Lainnya” (“Other Sources”) (see Tables 6.3 and 6.4).
The “Sumber Lainnya” and “Lainnya” categories are not defined in KLHK documents. This study has assumed that
this production is from land clearing and included it in reported production from land clearing as the basis for
calculations of actual timber production in Chapter Two.
1 The Ministry of Environment and Forestry’s definition of “primary forest” refers to intact natural forest which has not been disturbed by human activity. This differs from the more common understanding outside Indonesia, where the term “primary forest” generally refers to any old-growth forest, regardless of whether it has been selectively logged or otherwise disturbed. So, under Indonesia’s moratorium on conversion of primary forest, the clearing of previously-logged natural forest may still be legal.
2 The abbreviation IPK/ILS stands for Izin Pemanfaatan Kayu/Izin Lain yang Sah, or Wood Utilization Permits/Other Valid Permits.
Tabel�IV.6.1.Log Production Based on Source of Production in 2007-2011
IUPHHK�HA IPK/ILS Perhutani IUPHHK�HT
1 2 3 4 5 6 7 8
1 2007 6,437,685 4,391,657 48,034 20,614,209 705,462 32,197,046
2 2008 4,629,017 2,764,015 97,480 22,318,886 2,191,387 32,000,786
3 2009 4,857,150 6,619,247 87,828 18,953,930 3,802,381 34,320,536
4 2010 5,251,576 14,488,152 98,003 18,556,254 3,720,785 42,114,770
5 2011 5,088,695 600,598 112,858 19,840,679 21,786,505 47,429,335
REKAPITULASI�PRODUKSI�KAYU�BULAT�BERDASARKAN�SUMBER�PRODUKSI�TAHUN�2007�2011
Tahun Hutan�Alam Hutan�Tanaman Jumlah�(m3)
Sumber/Source�:�Direktorat�BPPHH,�Ditjen�BUK.
Sumber�Produksi�(m3)
Sumber�LainnyaNo
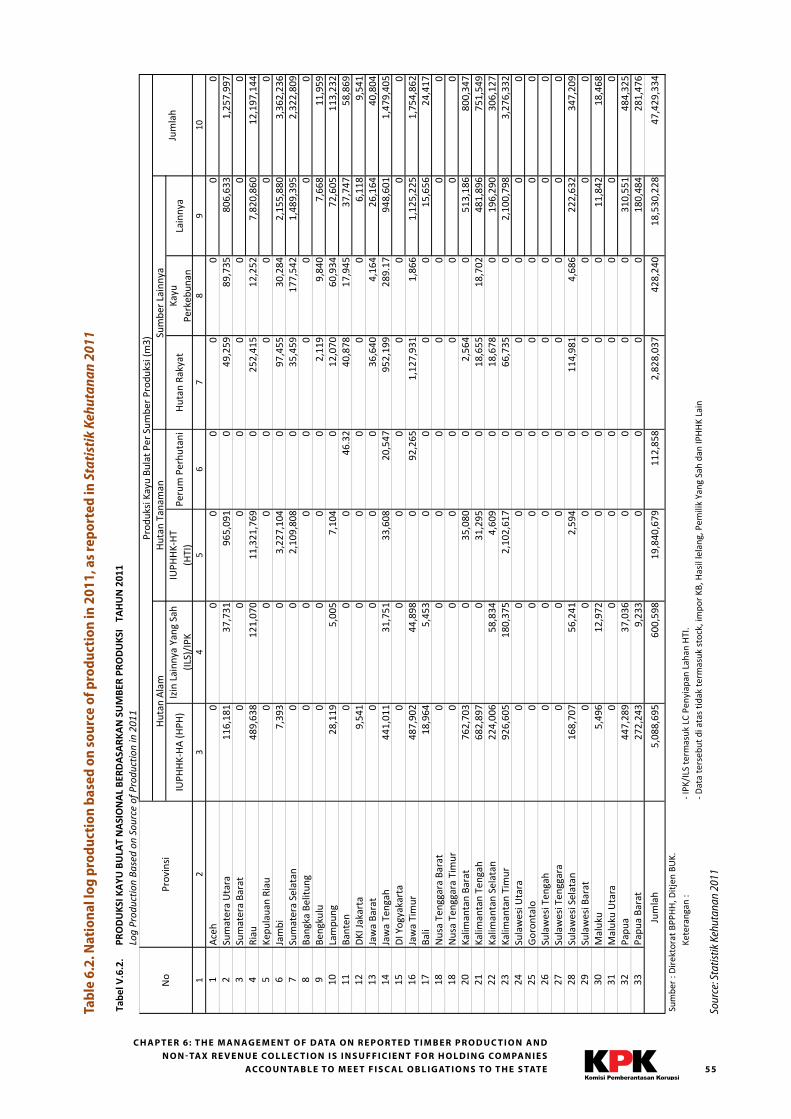
55
Tabe
l�V.6.2.
Log�Prod
uctio
n�Ba
sed�on
�Sou
rce�of�Produ
ction�in�201
1
IUPHHK�HA�(H
PH)
Izin�Lainnya�Yang�Sah�
(ILS)/IPK
IUPHHK�HT���������
(HTI)
Perum�Perhutani
Hutan�Rakyat
Kayu�
Perkebunan
Lainnya
12
34
56
78
910
1Aceh
00
00
00
00
2Sumatera�Utara
116,181
37,731
965,091
049,259
89,735
806,633
1,257,997
3Sumatera�Barat
00
00
00
00
4Riau
489,638
121,070
11,321,769
0252,415
12,252
7,820,860
12,197,144
5Kepulauan�Riau
00
00
00
00
6Jambi
7,393
03,227,104
097,455
30,284
2,155,880
3,362,236
7Sumatera�Selatan
00
2,109,808
035,459
177,542
1,489,395
2,322,809
8Bangka�Belitung
00
00
00
00
9Bengkulu
00
00
2,119
9,840
7,668
11,959
10
Lampung
28,119
5,005
7,104
012,070
60,934
72,605
113,232
11
Banten
00
046.32
40,878
17,945
37,747
58,869
12
DKI�Jakarta
9,541
00
00
06,118
9,541
13
Jawa�Barat
00
00
36,640
4,164
26,164
40,804
14
Jawa�Tengah
441,011
31,751
33,608
20,547
952,199
289.17
948,601
1,479,405
15
DI�Yogyakarta
00
00
00
00
16
Jawa�Timur
487,902
44,898
092,265
1,127,931
1,866
1,125,225
1,754,862
17
Bali
18,964
5,453
00
00
15,656
24,417
18
Nusa�Tenggara�Barat
00
00
00
00
18
Nusa�Tenggara�Timur
00
00
00
00
20
Kalimantan�Barat
762,703
035,080
02,564
0513,186
800,347
21
Kalimantan�Tengah
682,897
031,295
018,655
18,702
481,896
751,549
22
Kalimantan�Selatan
224,006
58,834
4,609
018,678
0196,290
306,127
23
Kalimantan�Timur
926,605
180,375
2,102,617
066,735
02,100,798
3,276,332
24
Sulawesi�U
tara
00
00
00
00
25
Gorontalo
00
00
00
00
26
Sulawesi�Tengah
00
00
00
00
27
Sulawesi�Tenggara
00
00
00
00
28
Sulawesi�Selatan
168,707
56,241
2,594
0114,981
4,686
222,632
347,209
29
Sulawesi�Barat
00
00
00
00
30
Maluku
5,496
12,972
00
00
11,842
18,468
31
Maluku�Utara
00
00
00
00
32
Papua
447,289
37,036
00
00
310,551
484,325
33
Papua�Barat
272,243
9,233
00
00
180,484
281,476
5,088,695
600,598
19,840,679
112,858
2,828,037
428,240
18,530,228
47,429,334
Keterangan�:
��IPK/ILS�te
rmasuk�LC�Penyiapan�Lahan�HTI.
Sumber�Lainnya
Jumlah
PRODUKS
I�KAYU
�BULA
T�NASIONAL�BE
RDASA
RKAN�SUMBE
R�PR
ODUKS
I���TAHUN�201
1
��Data�te
rsebut�d
i�atas�tidak�te
rmasuk�stock,�impor�KB,�H
asil�lelang,�Pemilik�Yang�Sah�dan�IPHHK�Lain
Hutan�Tanaman
Sumber�:�D
irektorat�B
PPHH,�D
itjen�BUK.
Jumlah
No
Provinsi
Produksi�Kayu�Bulat�P
er�Sumber�Produksi�(m3)
Hutan�Alam
Tabl
e 6.
2. N
atio
nal l
og p
rodu
ctio
n ba
sed
on s
ourc
e of
pro
duct
ion
in 2
011,
as
repo
rted
in S
tati
stik
Keh
utan
an 2
011
Sour
ce: S
tatis
tik K
ehut
anan
201
1
C H A P T E R 6: T H E M A N AG E M E N T O F D ATA O N R E P O R T E D T I M B E R P R O D U C T I O N A N D N O N - TAX R E V E N U E CO L L E C T I O N I S I N S U F F I C I E N T F O R H O L D I N G CO M PA N I E S
ACCO U N TA B L E TO M E E T F I S C A L O B L I G AT I O N S TO T H E S TAT E
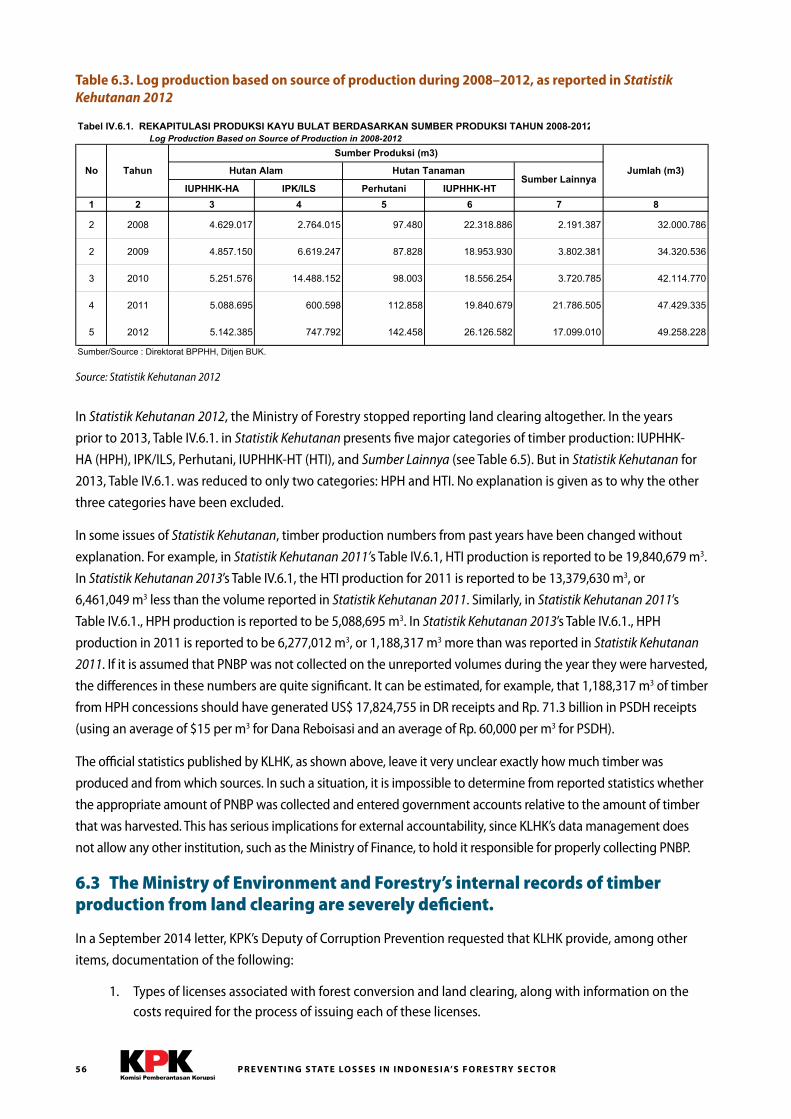
P R E V E N T I N G S TAT E LO S S E S I N I N D O N E S I A’S F O R E S T RY S E C TO R56
Table 6.3. Log production based on source of production during 2008–2012, as reported in Statistik Kehutanan 2012
Source: Statistik Kehutanan 2012
In Statistik Kehutanan 2012, the Ministry of Forestry stopped reporting land clearing altogether. In the years
prior to 2013, Table IV.6.1. in Statistik Kehutanan presents five major categories of timber production: IUPHHK-
HA (HPH), IPK/ILS, Perhutani, IUPHHK-HT (HTI), and Sumber Lainnya (see Table 6.5). But in Statistik Kehutanan for
2013, Table IV.6.1. was reduced to only two categories: HPH and HTI. No explanation is given as to why the other
three categories have been excluded.
In some issues of Statistik Kehutanan, timber production numbers from past years have been changed without
explanation. For example, in Statistik Kehutanan 2011’s Table IV.6.1, HTI production is reported to be 19,840,679 m3.
In Statistik Kehutanan 2013’s Table IV.6.1, the HTI production for 2011 is reported to be 13,379,630 m3, or
6,461,049 m3 less than the volume reported in Statistik Kehutanan 2011. Similarly, in Statistik Kehutanan 2011’s
Table IV.6.1., HPH production is reported to be 5,088,695 m3. In Statistik Kehutanan 2013’s Table IV.6.1., HPH
production in 2011 is reported to be 6,277,012 m3, or 1,188,317 m3 more than was reported in Statistik Kehutanan
2011. If it is assumed that PNBP was not collected on the unreported volumes during the year they were harvested,
the differences in these numbers are quite significant. It can be estimated, for example, that 1,188,317 m3 of timber
from HPH concessions should have generated US$ 17,824,755 in DR receipts and Rp. 71.3 billion in PSDH receipts
(using an average of $15 per m3 for Dana Reboisasi and an average of Rp. 60,000 per m3 for PSDH).
The official statistics published by KLHK, as shown above, leave it very unclear exactly how much timber was
produced and from which sources. In such a situation, it is impossible to determine from reported statistics whether
the appropriate amount of PNBP was collected and entered government accounts relative to the amount of timber
that was harvested. This has serious implications for external accountability, since KLHK’s data management does
not allow any other institution, such as the Ministry of Finance, to hold it responsible for properly collecting PNBP.
6.3 The Ministry of Environment and Forestry’s internal records of timber production from land clearing are severely deficient.
In a September 2014 letter, KPK’s Deputy of Corruption Prevention requested that KLHK provide, among other
items, documentation of the following:
1. Types of licenses associated with forest conversion and land clearing, along with information on the costs required for the process of issuing each of these licenses.
IUPHHK-HA IPK/ILS Perhutani IUPHHK-HT
1 2 3 4 5 6 7 8
2 2008 4.629.017 2.764.015 97.480 22.318.886 2.191.387 32.000.786
2 2009 4.857.150 6.619.247 87.828 18.953.930 3.802.381 34.320.536
3 2010 5.251.576 14.488.152 98.003 18.556.254 3.720.785 42.114.770
4 2011 5.088.695 600.598 112.858 19.840.679 21.786.505 47.429.335
5 2012 5.142.385 747.792 142.458 26.126.582 17.099.010 49.258.228
Sumber LainnyaNo Tahun Hutan Alam Hutan Tanaman
Tabel IV.6.1. REKAPITULASI PRODUKSI KAYU BULAT BERDASARKAN SUMBER PRODUKSI TAHUN 2008-2012 Log Production Based on Source of Production in 2008-2012
Jumlah (m3)
Sumber/Source : Direktorat BPPHH, Ditjen BUK.
Sumber Produksi (m3)
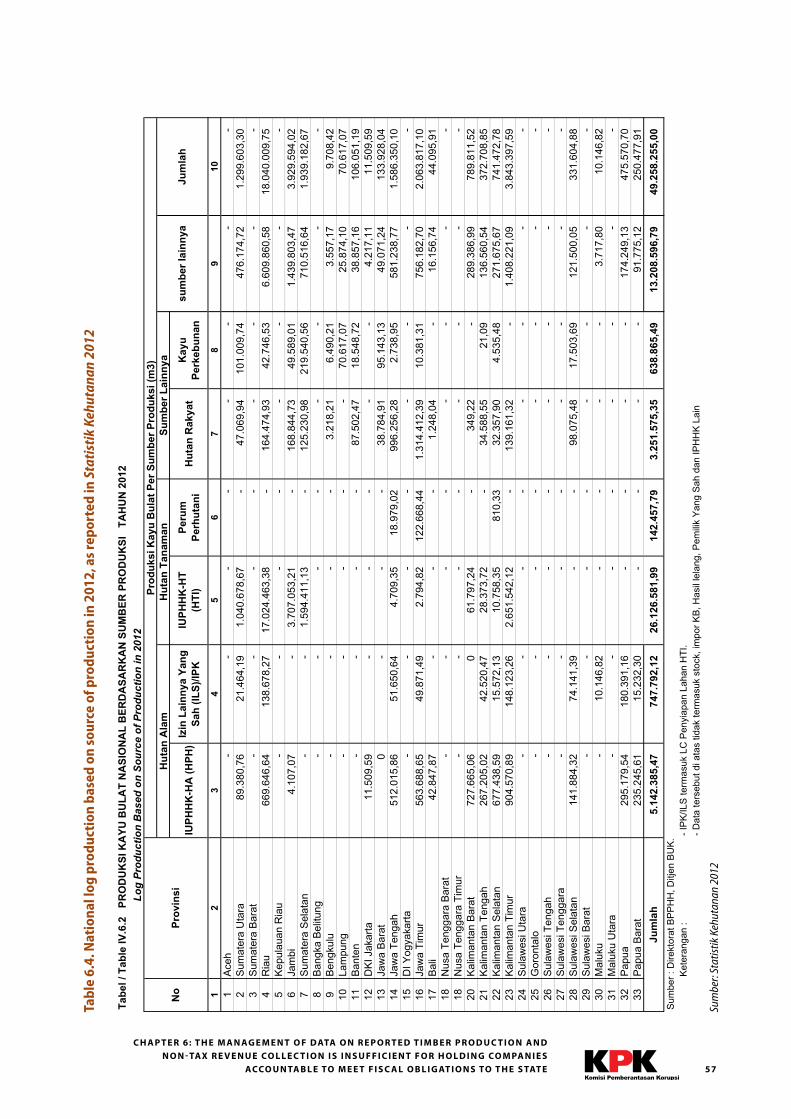
57
C H A P T E R 6: T H E M A N AG E M E N T O F D ATA O N R E P O R T E D T I M B E R P R O D U C T I O N A N D N O N - TAX R E V E N U E CO L L E C T I O N I S I N S U F F I C I E N T F O R H O L D I N G CO M PA N I E S
ACCO U N TA B L E TO M E E T F I S C A L O B L I G AT I O N S TO T H E S TAT E
Tabl
e 6.
4. N
atio
nal l
og p
rodu
ctio
n ba
sed
on s
ourc
e of
pro
duct
ion
in 2
012,
as
repo
rted
in S
tati
stik
Keh
utan
an 2
012
Sum
ber:
Stat
istik
Keh
utan
an 2
012
Log
Pro
duct
ion
Bas
ed o
n S
ourc
e of
Pro
duct
ion
in 2
012
IUP
HH
K-H
A (
HP
H)
Izin
Lain
nya Y
an
g
Sah
(IL
S)/
IPK
IUP
HH
K-H
T(H
TI)
Peru
mP
erh
uta
ni
Hu
tan
Rakyat
Kayu
Perk
eb
un
an
12
34
56
78
910
1A
ceh
--
--
--
--
2S
umat
era
Uta
ra89
.380
,76
21.4
64,1
91.
040.
678,
67-
47.0
69,9
410
1.00
9,74
476.
174,
721.
299.
603,
303
Sum
ater
a B
arat
--
--
--
--
4R
iau
669.
646,
6413
8.67
8,27
17.0
24.4
63,3
8-
164.
474,
9342
.746
,53
6.60
9.86
0,58
18.0
40.0
09,7
55
Kep
ulau
an R
iau
--
--
--
--
6Ja
mbi
4.10
7,07
-3.
707.
053,
21-
168.
844,
7349
.589
,01
1.43
9.80
3,47
3.92
9.59
4,02
7S
umat
era
Sel
atan
--
1.59
4.41
1,13
-12
5.23
0,98
219.
540,
5671
0.51
6,64
1.93
9.18
2,67
8B
angk
a B
elitu
ng-
--
--
--
-9
Ben
gkul
u-
--
-3.
218,
216.
490,
213.
557,
179.
708,
4210
Lam
pung
--
--
-70
.617
,07
25.8
74,1
070
.617
,07
11B
ante
n-
--
-87
.502
,47
18.5
48,7
238
.857
,16
106.
051,
1912
DK
I Jak
arta
11.5
09,5
9-
--
--
4.21
7,11
11.5
09,5
913
Jaw
a B
arat
0-
--
38.7
84,9
195
.143
,13
49.0
71,2
413
3.92
8,04
14Ja
wa
Teng
ah51
2.01
5,86
51.6
50,6
44.
709,
3518
.979
,02
996.
256,
282.
738,
9558
1.23
8,77
1.58
6.35
0,10
15D
I Yog
yaka
rta-
--
--
--
-16
Jaw
a Ti
mur
563.
688,
6549
.871
,49
2.79
4,82
122.
668,
441.
314.
412,
3910
.381
,31
756.
182,
702.
063.
817,
1017
Bal
i42
.847
,87
--
-1.
248,
04-
16.1
56,7
444
.095
,91
18N
usa
Teng
gara
Bar
at-
--
--
--
-18
Nus
a Te
ngga
ra T
imur
--
--
--
--
20K
alim
anta
n B
arat
727.
665,
060
61.7
97,2
4-
349,
22-
289.
386,
9978
9.81
1,52
21K
alim
anta
n Te
ngah
267.
205,
0242
.520
,47
28.3
73,7
2-
34.5
88,5
521
,09
136.
560,
5437
2.70
8,85
22K
alim
anta
n S
elat
an67
7.43
8,59
15.5
72,1
310
.758
,35
810,
3332
.357
,90
4.53
5,48
271.
675,
6774
1.47
2,78
23K
alim
anta
n Ti
mur
904.
570,
8914
8.12
3,26
2.65
1.54
2,12
-13
9.16
1,32
-1.
408.
221,
093.
843.
397,
5924
Sul
awes
i Uta
ra-
--
--
--
-25
Gor
onta
lo-
--
--
--
-26
Sul
awes
i Ten
gah
--
--
--
--
27S
ulaw
esi T
engg
ara
--
--
--
--
28S
ulaw
esi S
elat
an14
1.88
4,32
74.1
41,3
9-
-98
.075
,48
17.5
03,6
912
1.50
0,05
331.
604,
8829
Sul
awes
i Bar
at-
--
--
--
-30
Mal
uku
-10
.146
,82
--
--
3.71
7,80
10.1
46,8
231
Mal
uku
Uta
ra-
--
--
--
-32
Pap
ua29
5.17
9,54
180.
391,
16-
--
-17
4.24
9,13
475.
570,
7033
Pap
ua B
arat
235.
245,
6115
.232
,30
--
--
91.7
75,1
225
0.47
7,91
5.1
42.3
85,4
7747.7
92,1
226.1
26.5
81,9
9142.4
57,7
93.2
51.5
75,3
5638.8
65,4
913.2
08.5
96,7
949.2
58.2
55,0
0
Ket
eran
gan
:- I
PK
/ILS
term
asuk
LC
Pen
yiap
an L
ahan
HTI
.- D
ata
ters
ebut
di a
tas
tidak
term
asuk
sto
ck, i
mpo
r KB
, Has
il le
lang
, Pem
ilik
Yan
g S
ah d
an IP
HH
K L
ain
Hu
tan
Tan
am
an
Sum
ber :
Dire
ktor
at B
PP
HH
, Ditj
en B
UK
.
Ju
mla
h
No
Pro
vin
si
Pro
du
ksi K
ayu
Bu
lat
Per
Su
mb
er
Pro
du
ksi (m
3)
Tab
el / T
ab
le IV
.6.2
P
RO
DU
KS
I K
AY
U B
UL
AT
NA
SIO
NA
L B
ER
DA
SA
RK
AN
SU
MB
ER
PR
OD
UK
SI T
AH
UN
2012
Hu
tan
Ala
m
su
mb
er
lain
nya
Su
mb
er
Lain
nya
Ju
mla
h
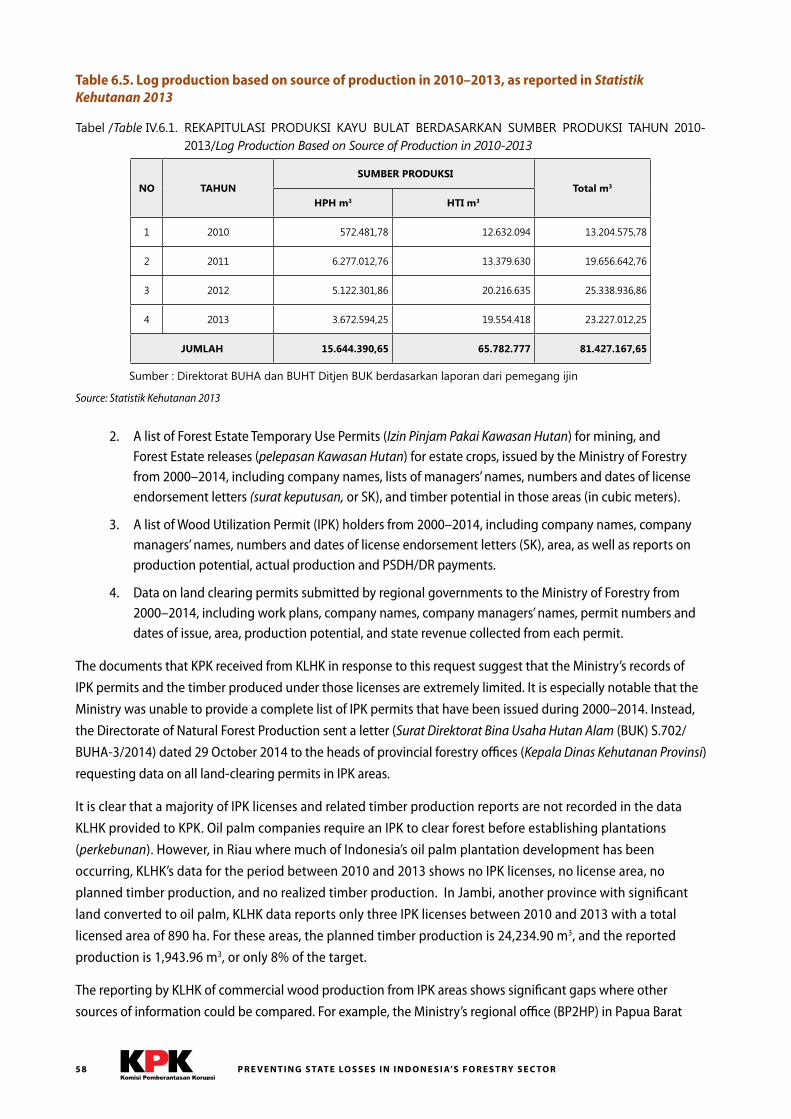
P R E V E N T I N G S TAT E LO S S E S I N I N D O N E S I A’S F O R E S T RY S E C TO R58
2. A list of Forest Estate Temporary Use Permits (Izin Pinjam Pakai Kawasan Hutan) for mining, and Forest Estate releases (pelepasan Kawasan Hutan) for estate crops, issued by the Ministry of Forestry from 2000–2014, including company names, lists of managers’ names, numbers and dates of license endorsement letters (surat keputusan, or SK), and timber potential in those areas (in cubic meters).
3. A list of Wood Utilization Permit (IPK) holders from 2000–2014, including company names, company managers’ names, numbers and dates of license endorsement letters (SK), area, as well as reports on production potential, actual production and PSDH/DR payments.
4. Data on land clearing permits submitted by regional governments to the Ministry of Forestry from 2000–2014, including work plans, company names, company managers’ names, permit numbers and dates of issue, area, production potential, and state revenue collected from each permit.
The documents that KPK received from KLHK in response to this request suggest that the Ministry’s records of
IPK permits and the timber produced under those licenses are extremely limited. It is especially notable that the
Ministry was unable to provide a complete list of IPK permits that have been issued during 2000–2014. Instead,
the Directorate of Natural Forest Production sent a letter (Surat Direktorat Bina Usaha Hutan Alam (BUK) S.702/
BUHA-3/2014) dated 29 October 2014 to the heads of provincial forestry offices (Kepala Dinas Kehutanan Provinsi)
requesting data on all land-clearing permits in IPK areas.
It is clear that a majority of IPK licenses and related timber production reports are not recorded in the data
KLHK provided to KPK. Oil palm companies require an IPK to clear forest before establishing plantations
(perkebunan). However, in Riau where much of Indonesia’s oil palm plantation development has been
occurring, KLHK’s data for the period between 2010 and 2013 shows no IPK licenses, no license area, no
planned timber production, and no realized timber production. In Jambi, another province with significant
land converted to oil palm, KLHK data reports only three IPK licenses between 2010 and 2013 with a total
licensed area of 890 ha. For these areas, the planned timber production is 24,234.90 m3, and the reported
production is 1,943.96 m3, or only 8% of the target.
The reporting by KLHK of commercial wood production from IPK areas shows significant gaps where other
sources of information could be compared. For example, the Ministry’s regional office (BP2HP) in Papua Barat
Table 6.5. Log production based on source of production in 2010–2013, as reported in Statistik Kehutanan 2013
Source: Statistik Kehutanan 2013
225Stat ist ik Kementer ian Kehutanan Tahun 2013
Tabel /Table IV.6.1. REKAPITULASI PRODUKSI KAYU BULAT BERDASARKAN SUMBER PRODUKSI TAHUN 2010-2013/Log Production Based on Source of Production in 2010-2013
NO TAHUN SUMBER PRODUKSI
Total m3
HPH m3 HTI m3
1 2010 572.481,78 12.632.094 13.204.575,78
2 2011 6.277.012,76 13.379.630 19.656.642,76
3 2012 5.122.301,86 20.216.635 25.338.936,86
4 2013 3.672.594,25 19.554.418 23.227.012,25
JUMLAH 15.644.390,65 65.782.777 81.427.167,65
Sumber : Direktorat BUHA dan BUHT Ditjen BUK berdasarkan laporan dari pemegang ijin
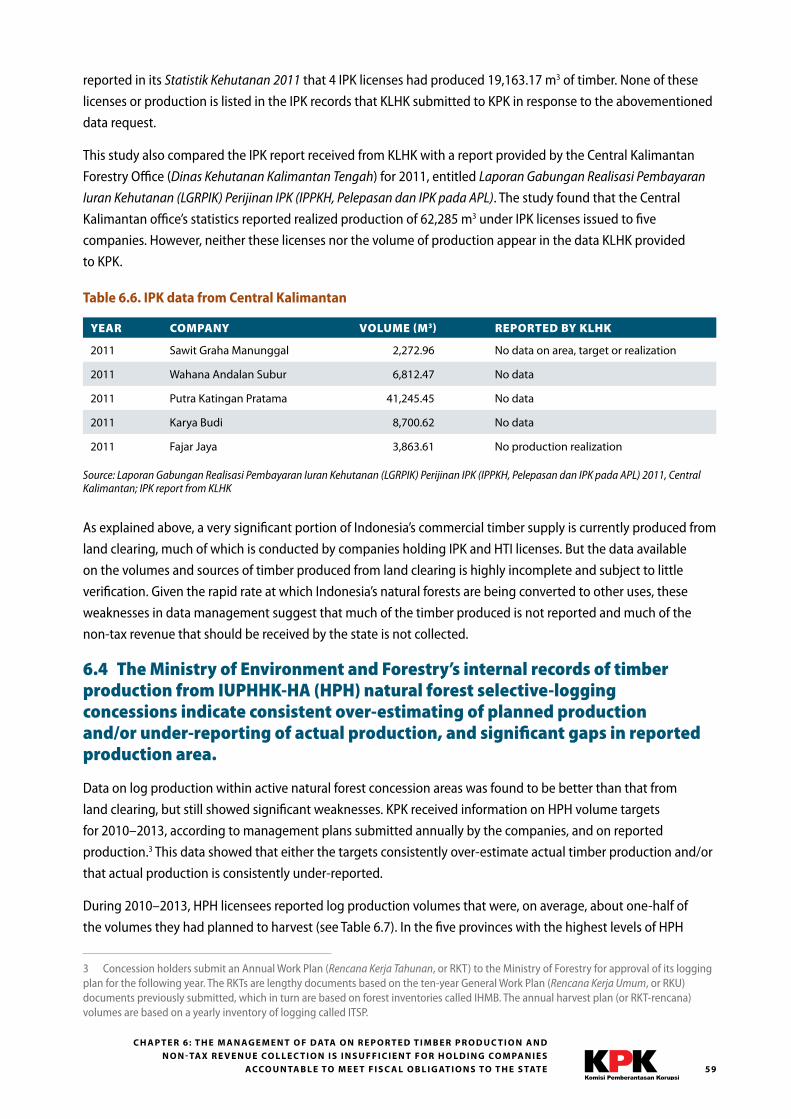
59
C H A P T E R 6: T H E M A N AG E M E N T O F D ATA O N R E P O R T E D T I M B E R P R O D U C T I O N A N D N O N - TAX R E V E N U E CO L L E C T I O N I S I N S U F F I C I E N T F O R H O L D I N G CO M PA N I E S
ACCO U N TA B L E TO M E E T F I S C A L O B L I G AT I O N S TO T H E S TAT E
reported in its Statistik Kehutanan 2011 that 4 IPK licenses had produced 19,163.17 m3 of timber. None of these
licenses or production is listed in the IPK records that KLHK submitted to KPK in response to the abovementioned
data request.
This study also compared the IPK report received from KLHK with a report provided by the Central Kalimantan
Forestry Office (Dinas Kehutanan Kalimantan Tengah) for 2011, entitled Laporan Gabungan Realisasi Pembayaran
Iuran Kehutanan (LGRPIK) Perijinan IPK (IPPKH, Pelepasan dan IPK pada APL). The study found that the Central
Kalimantan office’s statistics reported realized production of 62,285 m3 under IPK licenses issued to five
companies. However, neither these licenses nor the volume of production appear in the data KLHK provided
to KPK.
Table 6.6. IPK data from Central Kalimantan
YEAR COMPANY VOLUME (M3) REPORTED BY KLHK
2011 Sawit Graha Manunggal 2,272.96 No data on area, target or realization
2011 Wahana Andalan Subur 6,812.47 No data
2011 Putra Katingan Pratama 41,245.45 No data
2011 Karya Budi 8,700.62 No data
2011 Fajar Jaya 3,863.61 No production realization
Source: Laporan Gabungan Realisasi Pembayaran Iuran Kehutanan (LGRPIK) Perijinan IPK (IPPKH, Pelepasan dan IPK pada APL) 2011, Central Kalimantan; IPK report from KLHK
As explained above, a very significant portion of Indonesia’s commercial timber supply is currently produced from
land clearing, much of which is conducted by companies holding IPK and HTI licenses. But the data available
on the volumes and sources of timber produced from land clearing is highly incomplete and subject to little
verification. Given the rapid rate at which Indonesia’s natural forests are being converted to other uses, these
weaknesses in data management suggest that much of the timber produced is not reported and much of the
non-tax revenue that should be received by the state is not collected.
6.4 The Ministry of Environment and Forestry’s internal records of timber production from IUPHHK-HA (HPH) natural forest selective-logging concessions indicate consistent over-estimating of planned production and/or under-reporting of actual production, and significant gaps in reported production area.
Data on log production within active natural forest concession areas was found to be better than that from
land clearing, but still showed significant weaknesses. KPK received information on HPH volume targets
for 2010–2013, according to management plans submitted annually by the companies, and on reported
production.3 This data showed that either the targets consistently over-estimate actual timber production and/or
that actual production is consistently under-reported.
During 2010–2013, HPH licensees reported log production volumes that were, on average, about one-half of
the volumes they had planned to harvest (see Table 6.7). In the five provinces with the highest levels of HPH
3 Concession holders submit an Annual Work Plan (Rencana Kerja Tahunan, or RKT) to the Ministry of Forestry for approval of its logging plan for the following year. The RKTs are lengthy documents based on the ten-year General Work Plan (Rencana Kerja Umum, or RKU) documents previously submitted, which in turn are based on forest inventories called IHMB. The annual harvest plan (or RKT-rencana) volumes are based on a yearly inventory of logging called ITSP.
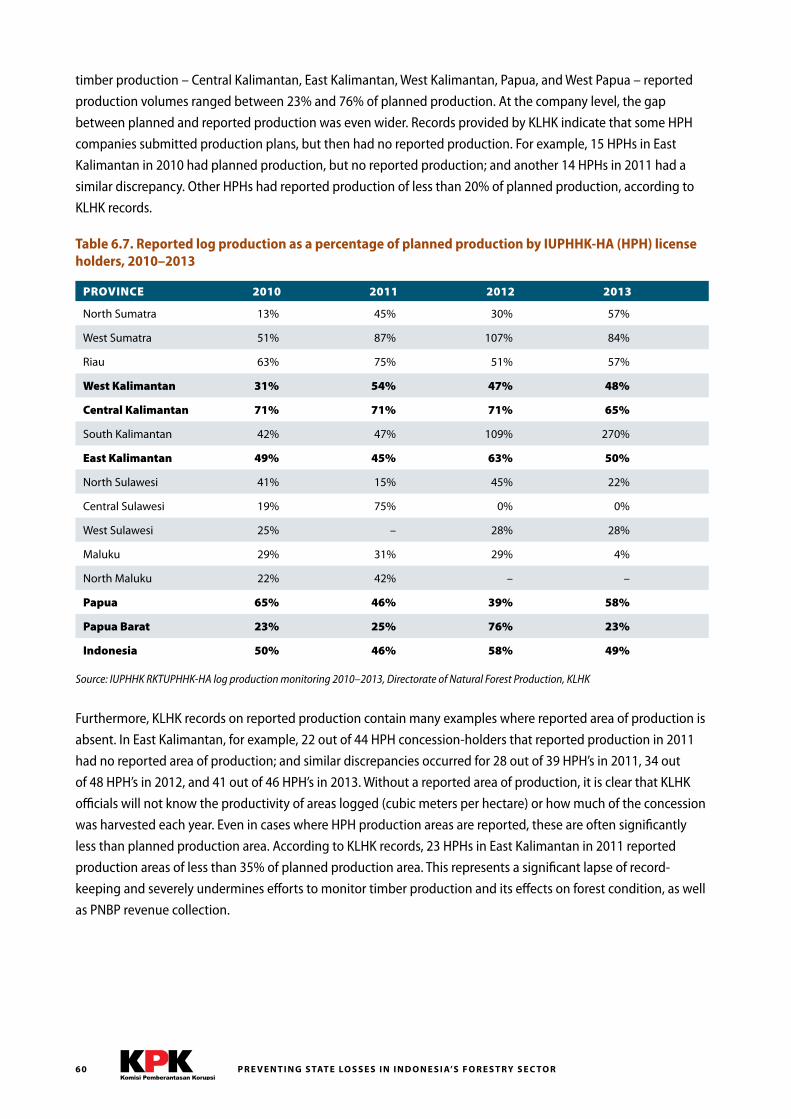
P R E V E N T I N G S TAT E LO S S E S I N I N D O N E S I A’S F O R E S T RY S E C TO R60
timber production – Central Kalimantan, East Kalimantan, West Kalimantan, Papua, and West Papua – reported
production volumes ranged between 23% and 76% of planned production. At the company level, the gap
between planned and reported production was even wider. Records provided by KLHK indicate that some HPH
companies submitted production plans, but then had no reported production. For example, 15 HPHs in East
Kalimantan in 2010 had planned production, but no reported production; and another 14 HPHs in 2011 had a
similar discrepancy. Other HPHs had reported production of less than 20% of planned production, according to
KLHK records.
Table 6.7. Reported log production as a percentage of planned production by IUPHHK-HA (HPH) license holders, 2010–2013
PROVINCE 2010 2011 2012 2013
North Sumatra 13% 45% 30% 57%
West Sumatra 51% 87% 107% 84%
Riau 63% 75% 51% 57%
West Kalimantan 31% 54% 47% 48%
Central Kalimantan 71% 71% 71% 65%
South Kalimantan 42% 47% 109% 270%
East Kalimantan 49% 45% 63% 50%
North Sulawesi 41% 15% 45% 22%
Central Sulawesi 19% 75% 0% 0%
West Sulawesi 25% – 28% 28%
Maluku 29% 31% 29% 4%
North Maluku 22% 42% – –
Papua 65% 46% 39% 58%
Papua Barat 23% 25% 76% 23%
Indonesia 50% 46% 58% 49%
Source: IUPHHK RKTUPHHK-HA log production monitoring 2010–2013, Directorate of Natural Forest Production, KLHK
Furthermore, KLHK records on reported production contain many examples where reported area of production is
absent. In East Kalimantan, for example, 22 out of 44 HPH concession-holders that reported production in 2011
had no reported area of production; and similar discrepancies occurred for 28 out of 39 HPH’s in 2011, 34 out
of 48 HPH’s in 2012, and 41 out of 46 HPH’s in 2013. Without a reported area of production, it is clear that KLHK
officials will not know the productivity of areas logged (cubic meters per hectare) or how much of the concession
was harvested each year. Even in cases where HPH production areas are reported, these are often significantly
less than planned production area. According to KLHK records, 23 HPHs in East Kalimantan in 2011 reported
production areas of less than 35% of planned production area. This represents a significant lapse of record-
keeping and severely undermines efforts to monitor timber production and its effects on forest condition, as well
as PNBP revenue collection.
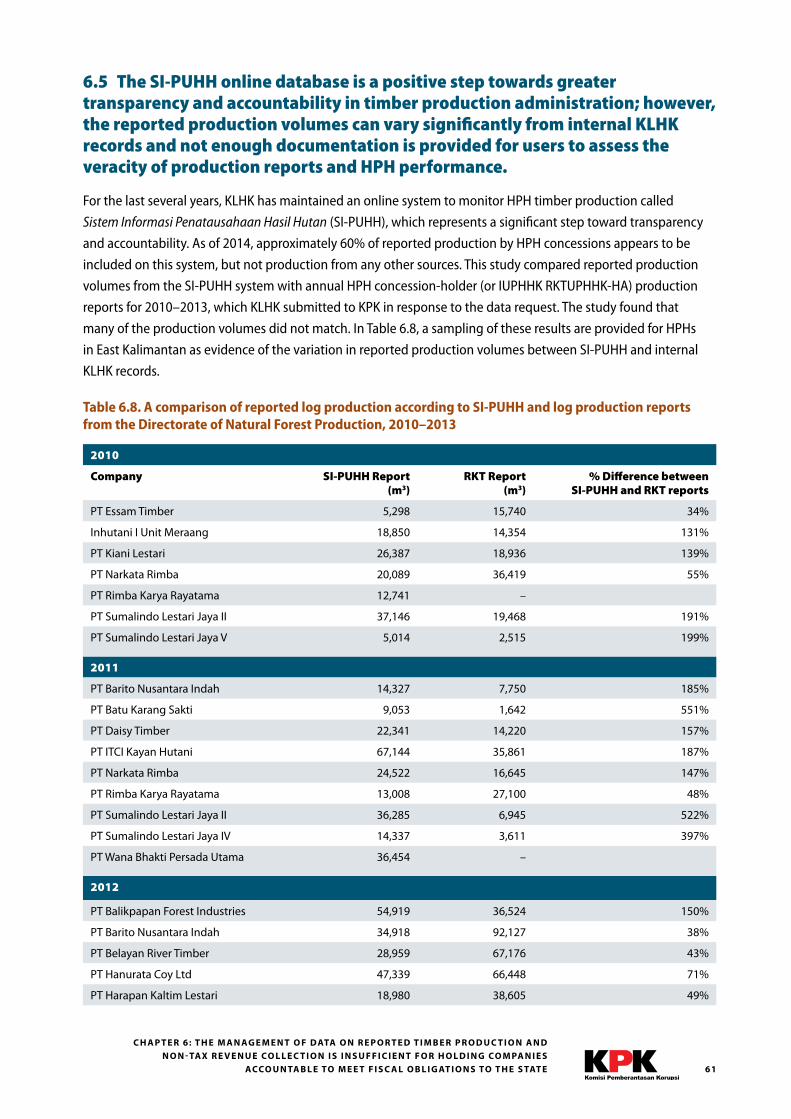
61
C H A P T E R 6: T H E M A N AG E M E N T O F D ATA O N R E P O R T E D T I M B E R P R O D U C T I O N A N D N O N - TAX R E V E N U E CO L L E C T I O N I S I N S U F F I C I E N T F O R H O L D I N G CO M PA N I E S
ACCO U N TA B L E TO M E E T F I S C A L O B L I G AT I O N S TO T H E S TAT E
6.5 The SI-PUHH online database is a positive step towards greater transparency and accountability in timber production administration; however, the reported production volumes can vary significantly from internal KLHK records and not enough documentation is provided for users to assess the veracity of production reports and HPH performance.
For the last several years, KLHK has maintained an online system to monitor HPH timber production called
Sistem Informasi Penatausahaan Hasil Hutan (SI-PUHH), which represents a significant step toward transparency
and accountability. As of 2014, approximately 60% of reported production by HPH concessions appears to be
included on this system, but not production from any other sources. This study compared reported production
volumes from the SI-PUHH system with annual HPH concession-holder (or IUPHHK RKTUPHHK-HA) production
reports for 2010–2013, which KLHK submitted to KPK in response to the data request. The study found that
many of the production volumes did not match. In Table 6.8, a sampling of these results are provided for HPHs
in East Kalimantan as evidence of the variation in reported production volumes between SI-PUHH and internal
KLHK records.
Table 6.8. A comparison of reported log production according to SI-PUHH and log production reports from the Directorate of Natural Forest Production, 2010–2013
2010
Company SI-PUHH Report (m3)
RKT Report (m3)
% Difference between SI-PUHH and RKT reports
PT Essam Timber 5,298 15,740 34%
Inhutani I Unit Meraang 18,850 14,354 131%
PT Kiani Lestari 26,387 18,936 139%
PT Narkata Rimba 20,089 36,419 55%
PT Rimba Karya Rayatama 12,741 –
PT Sumalindo Lestari Jaya II 37,146 19,468 191%
PT Sumalindo Lestari Jaya V 5,014 2,515 199%
2011
PT Barito Nusantara Indah 14,327 7,750 185%
PT Batu Karang Sakti 9,053 1,642 551%
PT Daisy Timber 22,341 14,220 157%
PT ITCI Kayan Hutani 67,144 35,861 187%
PT Narkata Rimba 24,522 16,645 147%
PT Rimba Karya Rayatama 13,008 27,100 48%
PT Sumalindo Lestari Jaya II 36,285 6,945 522%
PT Sumalindo Lestari Jaya IV 14,337 3,611 397%
PT Wana Bhakti Persada Utama 36,454 –
2012
PT Balikpapan Forest Industries 54,919 36,524 150%
PT Barito Nusantara Indah 34,918 92,127 38%
PT Belayan River Timber 28,959 67,176 43%
PT Hanurata Coy Ltd 47,339 66,448 71%
PT Harapan Kaltim Lestari 18,980 38,605 49%
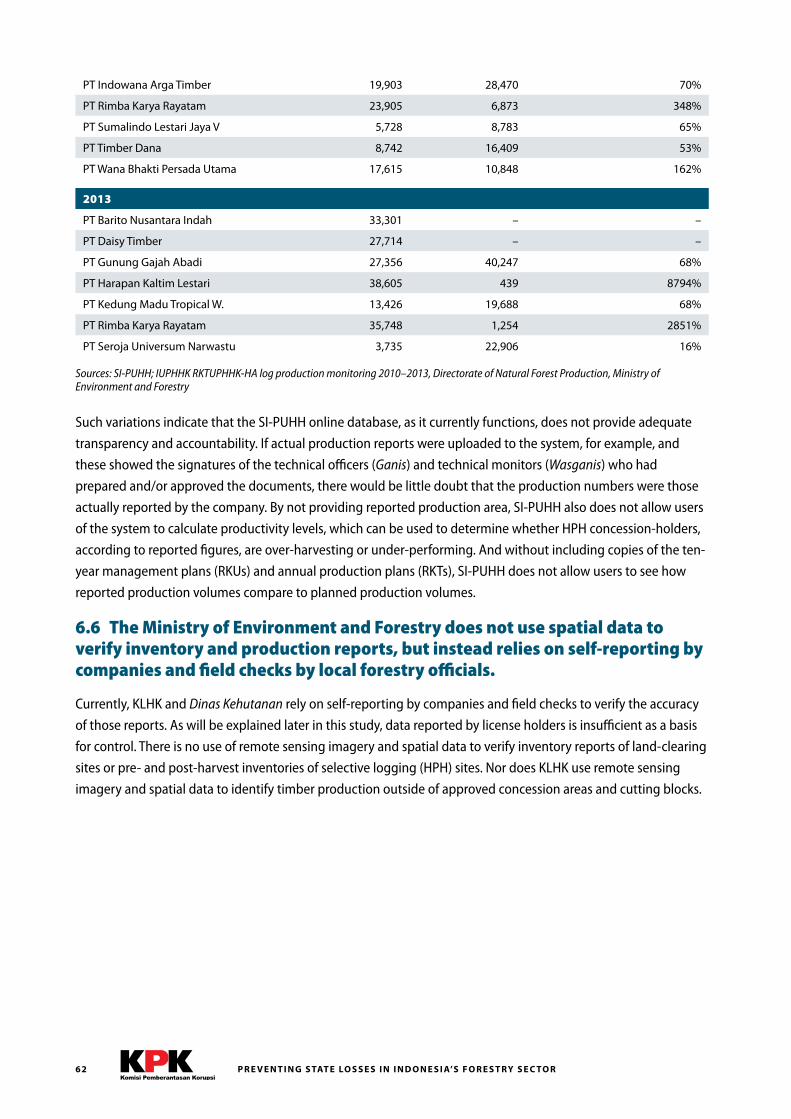
P R E V E N T I N G S TAT E LO S S E S I N I N D O N E S I A’S F O R E S T RY S E C TO R62
PT Indowana Arga Timber 19,903 28,470 70%
PT Rimba Karya Rayatam 23,905 6,873 348%
PT Sumalindo Lestari Jaya V 5,728 8,783 65%
PT Timber Dana 8,742 16,409 53%
PT Wana Bhakti Persada Utama 17,615 10,848 162%
2013
PT Barito Nusantara Indah 33,301 – –
PT Daisy Timber 27,714 – –
PT Gunung Gajah Abadi 27,356 40,247 68%
PT Harapan Kaltim Lestari 38,605 439 8794%
PT Kedung Madu Tropical W. 13,426 19,688 68%
PT Rimba Karya Rayatam 35,748 1,254 2851%
PT Seroja Universum Narwastu 3,735 22,906 16%
Sources: SI-PUHH; IUPHHK RKTUPHHK-HA log production monitoring 2010–2013, Directorate of Natural Forest Production, Ministry of Environment and Forestry
Such variations indicate that the SI-PUHH online database, as it currently functions, does not provide adequate
transparency and accountability. If actual production reports were uploaded to the system, for example, and
these showed the signatures of the technical officers (Ganis) and technical monitors (Wasganis) who had
prepared and/or approved the documents, there would be little doubt that the production numbers were those
actually reported by the company. By not providing reported production area, SI-PUHH also does not allow users
of the system to calculate productivity levels, which can be used to determine whether HPH concession-holders,
according to reported figures, are over-harvesting or under-performing. And without including copies of the ten-
year management plans (RKUs) and annual production plans (RKTs), SI-PUHH does not allow users to see how
reported production volumes compare to planned production volumes.
6.6 The Ministry of Environment and Forestry does not use spatial data to verify inventory and production reports, but instead relies on self-reporting by companies and field checks by local forestry officials.
Currently, KLHK and Dinas Kehutanan rely on self-reporting by companies and field checks to verify the accuracy
of those reports. As will be explained later in this study, data reported by license holders is insufficient as a basis
for control. There is no use of remote sensing imagery and spatial data to verify inventory reports of land-clearing
sites or pre- and post-harvest inventories of selective logging (HPH) sites. Nor does KLHK use remote sensing
imagery and spatial data to identify timber production outside of approved concession areas and cutting blocks.
63
Chapter 7: Internal controls are inadequate for ensuring accountability in timber administration and non-tax revenue collection.The system of internal controls for ensuring accountability in Indonesia’s timber administration and non-tax
revenue collection systems is both complicated and focused upon the administration of documents. This
complex, paper-based administrative structure can be considered inadequate in many ways because timber
administration and non-tax revenue collection are fragmented and undergo minimal verification. Information is
prone to asymmetry as the Ministry of Environment and Forestry is highly dependent on limited verification of
information by regional forestry offices, most of which is produced by the companies whose activities are being
monitored. As a result of fragmentation, weaknesses in the instruments of control have become systematic. Errors
in and/or manipulation of the timber administration system can occur in the absence of meaningful oversight.
Despite the recently developed Forest Product Administration Information System (SI-PUHH) being able to rectify
some weaknesses, this online system does not apply to all forest products in circulation.
As a result of such weak controls, the Government is unable to produce credible data on standing stock and
timber production as the basis for policymaking. This is because almost all the data and information generated
through document-based administration comes from private timber companies, including even vital data
on commercial standing stock and the volumes of logs harvested from licensed forest areas. This has further
consequences on how forests and, more broadly, the overall Forest Estate can be managed by the Government.
Unreliable information on standing stock means the Government also loses the capacity to prepare more
effective policies or plans, including, for instance, on limitations in forest product exploitation, or targeting state
revenue planning policies to hinder negative incentives of over-exploitation. As an example, despite Statistik
Kehutanan 2013 recording only 5.1 million m³ of annual log production from HPH selective logging concessions,
calculations used in this study estimate that recorded production from such concessions should have been 9.5
to 16.7 million m³. This means there is more timber than there should be in the marketplace, especially since the
annual allowable cut is only 9 million m³ a year.
Another important thing to consider is that internal controls on forest conversion are completely inadequate.
Uncontrolled forest conversion occurs because of a corrupt licensing system. Furthermore, administrative
controls over timber produced through forest conversion are not maintained or even recorded properly.
Ministry data published in Statistik Kehutanan 2013 reports only 6.9 million m³ of timber being produced
through forest land clearing, but as explained in Chapter Two, timber production from changing land use or
forest land clearing should have been recorded at between 33.0 and 37.7 million m³. With this gap, it is safe
to say that enormous state losses have resulted from uncontrolled forest conversion. Generally, this can be
attributed not only to the licensing system, but also to logs sourced from conversion being treated differently
in the timber administration system. Some policies, such as the designation of the Penggantian Nilai Tegakan
(PNT) levy, have tried to restrict the rates of forest conversion, but such efforts have been ineffective due to
weak internal controls.
C H A P T E R 7: I N T E R N A L CO N T R O L S A R E I N A D E Q UAT E F O R E N S U R I N G ACCO U N TA B I L I T Y I N T I M B E R A D M I N I S T R AT I O N A N D N O N - TAX R E V E N U E CO L L E C T I O N
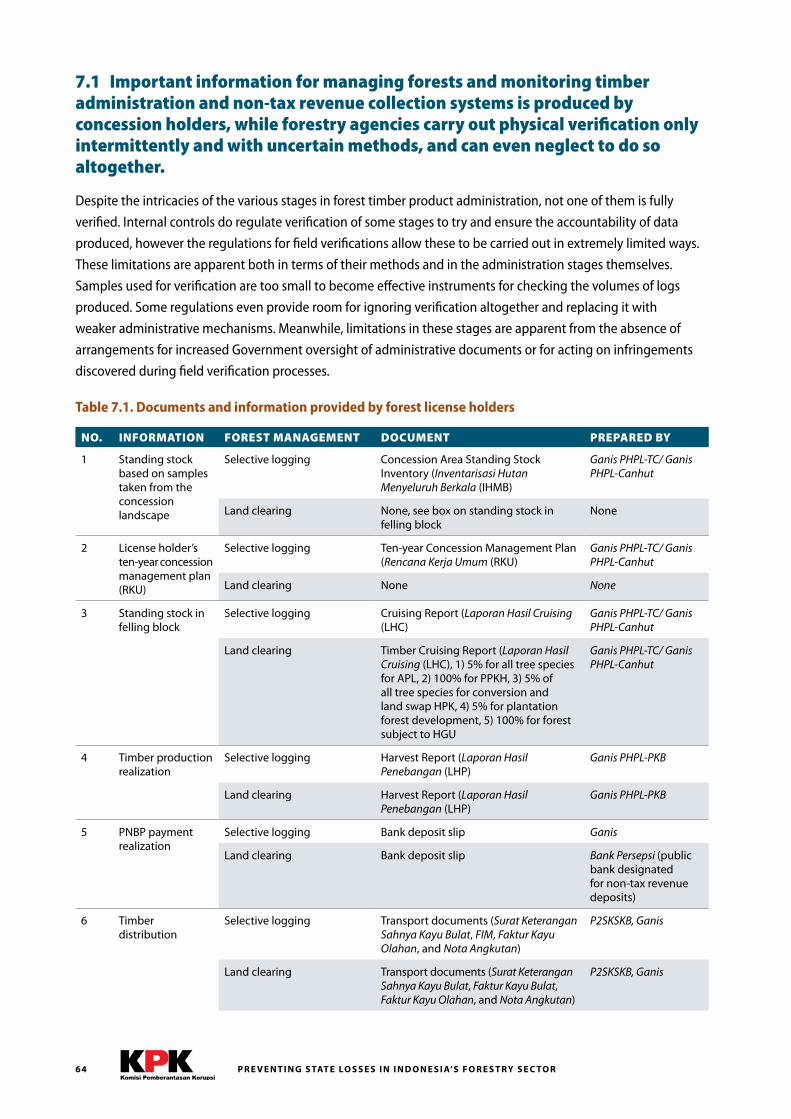
P R E V E N T I N G S TAT E LO S S E S I N I N D O N E S I A’S F O R E S T RY S E C TO R64
7.1 Important information for managing forests and monitoring timber administration and non-tax revenue collection systems is produced by concession holders, while forestry agencies carry out physical verification only intermittently and with uncertain methods, and can even neglect to do so altogether.
Despite the intricacies of the various stages in forest timber product administration, not one of them is fully
verified. Internal controls do regulate verification of some stages to try and ensure the accountability of data
produced, however the regulations for field verifications allow these to be carried out in extremely limited ways.
These limitations are apparent both in terms of their methods and in the administration stages themselves.
Samples used for verification are too small to become effective instruments for checking the volumes of logs
produced. Some regulations even provide room for ignoring verification altogether and replacing it with
weaker administrative mechanisms. Meanwhile, limitations in these stages are apparent from the absence of
arrangements for increased Government oversight of administrative documents or for acting on infringements
discovered during field verification processes.
Table 7.1. Documents and information provided by forest license holders
NO. INFORMATION FOREST MANAGEMENT DOCUMENT PREPARED BY
1 Standing stock based on samples taken from the concession landscape
Selective logging Concession Area Standing Stock Inventory (Inventarisasi Hutan Menyeluruh Berkala (IHMB)
Ganis PHPL-TC/ Ganis PHPL-Canhut
Land clearing None, see box on standing stock in felling block
None
2 License holder’s ten-year concession management plan (RKU)
Selective logging Ten-year Concession Management Plan (Rencana Kerja Umum (RKU)
Ganis PHPL-TC/ Ganis PHPL-Canhut
Land clearing None None
3 Standing stock in felling block
Selective logging Cruising Report (Laporan Hasil Cruising (LHC)
Ganis PHPL-TC/ Ganis PHPL-Canhut
Land clearing Timber Cruising Report (Laporan Hasil Cruising (LHC), 1) 5% for all tree species for APL, 2) 100% for PPKH, 3) 5% of all tree species for conversion and land swap HPK, 4) 5% for plantation forest development, 5) 100% for forest subject to HGU
Ganis PHPL-TC/ Ganis PHPL-Canhut
4 Timber production realization
Selective logging Harvest Report (Laporan Hasil Penebangan (LHP)
Ganis PHPL-PKB
Land clearing Harvest Report (Laporan Hasil Penebangan (LHP)
Ganis PHPL-PKB
5 PNBP payment realization
Selective logging Bank deposit slip Ganis
Land clearing Bank deposit slip Bank Persepsi (public bank designated for non-tax revenue deposits)
6 Timber distribution
Selective logging Transport documents (Surat Keterangan Sahnya Kayu Bulat, FIM, Faktur Kayu Olahan, and Nota Angkutan)
P2SKSKB, Ganis
Land clearing Transport documents (Surat Keterangan Sahnya Kayu Bulat, Faktur Kayu Bulat, Faktur Kayu Olahan, and Nota Angkutan)
P2SKSKB, Ganis
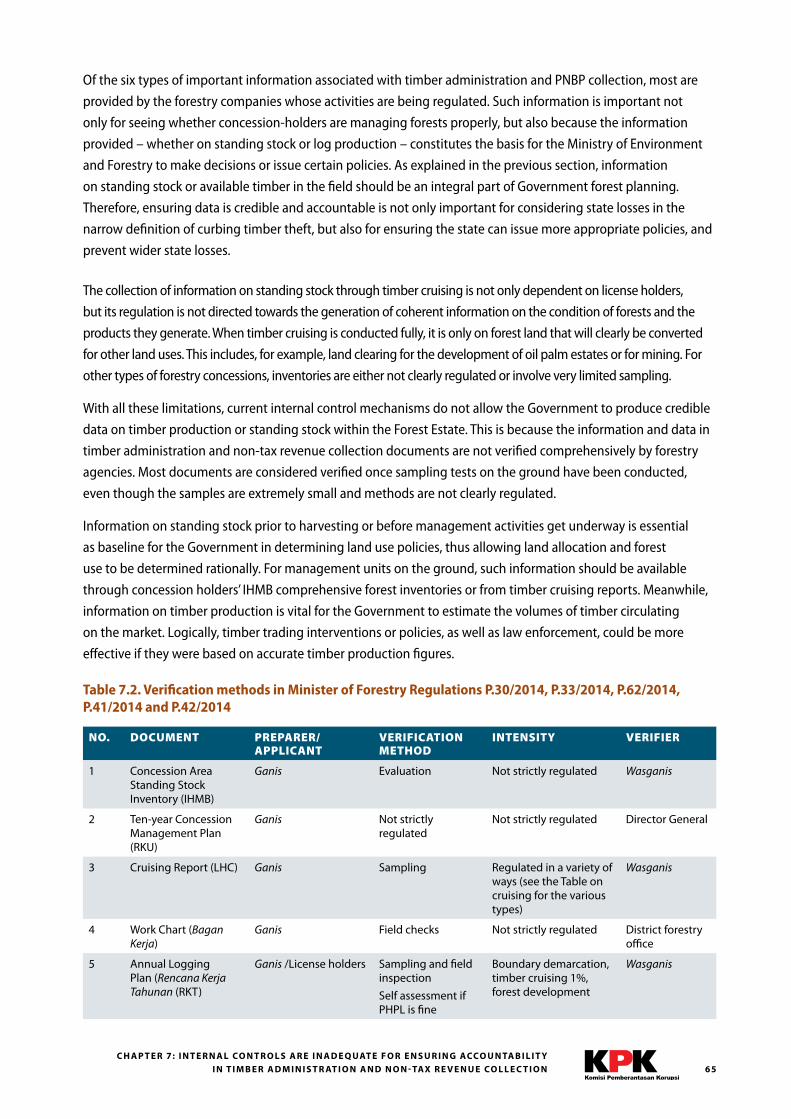
65C H A P T E R 7: I N T E R N A L CO N T R O L S A R E I N A D E Q UAT E F O R E N S U R I N G ACCO U N TA B I L I T Y
I N T I M B E R A D M I N I S T R AT I O N A N D N O N - TAX R E V E N U E CO L L E C T I O N
Of the six types of important information associated with timber administration and PNBP collection, most are
provided by the forestry companies whose activities are being regulated. Such information is important not
only for seeing whether concession-holders are managing forests properly, but also because the information
provided – whether on standing stock or log production – constitutes the basis for the Ministry of Environment
and Forestry to make decisions or issue certain policies. As explained in the previous section, information
on standing stock or available timber in the field should be an integral part of Government forest planning.
Therefore, ensuring data is credible and accountable is not only important for considering state losses in the
narrow definition of curbing timber theft, but also for ensuring the state can issue more appropriate policies, and
prevent wider state losses.
The collection of information on standing stock through timber cruising is not only dependent on license holders,
but its regulation is not directed towards the generation of coherent information on the condition of forests and the
products they generate. When timber cruising is conducted fully, it is only on forest land that will clearly be converted
for other land uses. This includes, for example, land clearing for the development of oil palm estates or for mining. For
other types of forestry concessions, inventories are either not clearly regulated or involve very limited sampling.
With all these limitations, current internal control mechanisms do not allow the Government to produce credible
data on timber production or standing stock within the Forest Estate. This is because the information and data in
timber administration and non-tax revenue collection documents are not verified comprehensively by forestry
agencies. Most documents are considered verified once sampling tests on the ground have been conducted,
even though the samples are extremely small and methods are not clearly regulated.
Information on standing stock prior to harvesting or before management activities get underway is essential
as baseline for the Government in determining land use policies, thus allowing land allocation and forest
use to be determined rationally. For management units on the ground, such information should be available
through concession holders’ IHMB comprehensive forest inventories or from timber cruising reports. Meanwhile,
information on timber production is vital for the Government to estimate the volumes of timber circulating
on the market. Logically, timber trading interventions or policies, as well as law enforcement, could be more
effective if they were based on accurate timber production figures.
Table 7.2. Verification methods in Minister of Forestry Regulations P.30/2014, P.33/2014, P.62/2014, P.41/2014 and P.42/2014
NO. DOCUMENT PREPARER/ APPLICANT
VERIFICATION METHOD
INTENSITY VERIFIER
1 Concession Area Standing Stock Inventory (IHMB)
Ganis Evaluation Not strictly regulated Wasganis
2 Ten-year Concession Management Plan (RKU)
Ganis Not strictly regulated
Not strictly regulated Director General
3 Cruising Report (LHC) Ganis Sampling Regulated in a variety of ways (see the Table on cruising for the various types)
Wasganis
4 Work Chart (Bagan Kerja)
Ganis Field checks Not strictly regulated District forestry office
5 Annual Logging Plan (Rencana Kerja Tahunan (RKT)
Ganis /License holders Sampling and field inspection
Self assessment if PHPL is fine
Boundary demarcation, timber cruising 1%, forest development
Wasganis
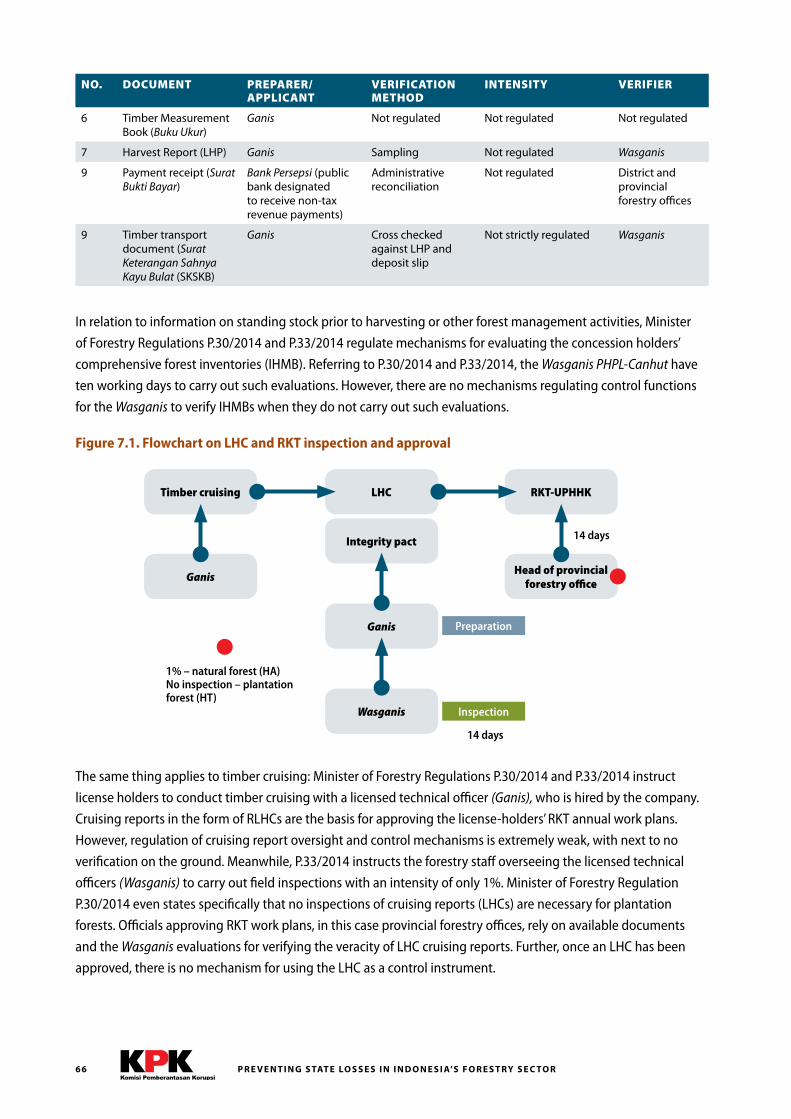
P R E V E N T I N G S TAT E LO S S E S I N I N D O N E S I A’S F O R E S T RY S E C TO R66
NO. DOCUMENT PREPARER/ APPLICANT
VERIFICATION METHOD
INTENSITY VERIFIER
6 Timber Measurement Book (Buku Ukur)
Ganis Not regulated Not regulated Not regulated
7 Harvest Report (LHP) Ganis Sampling Not regulated Wasganis
9 Payment receipt (Surat Bukti Bayar)
Bank Persepsi (public bank designated to receive non-tax revenue payments)
Administrative reconciliation
Not regulated District and provincial forestry offices
9 Timber transport document (Surat Keterangan Sahnya Kayu Bulat (SKSKB)
Ganis Cross checked against LHP and deposit slip
Not strictly regulated Wasganis
In relation to information on standing stock prior to harvesting or other forest management activities, Minister
of Forestry Regulations P.30/2014 and P.33/2014 regulate mechanisms for evaluating the concession holders’
comprehensive forest inventories (IHMB). Referring to P.30/2014 and P.33/2014, the Wasganis PHPL-Canhut have
ten working days to carry out such evaluations. However, there are no mechanisms regulating control functions
for the Wasganis to verify IHMBs when they do not carry out such evaluations.
Figure 7.1. Flowchart on LHC and RKT inspection and approval
The same thing applies to timber cruising: Minister of Forestry Regulations P.30/2014 and P.33/2014 instruct
license holders to conduct timber cruising with a licensed technical officer (Ganis), who is hired by the company.
Cruising reports in the form of RLHCs are the basis for approving the license-holders’ RKT annual work plans.
However, regulation of cruising report oversight and control mechanisms is extremely weak, with next to no
verification on the ground. Meanwhile, P.33/2014 instructs the forestry staff overseeing the licensed technical
officers (Wasganis) to carry out field inspections with an intensity of only 1%. Minister of Forestry Regulation
P.30/2014 even states specifically that no inspections of cruising reports (LHCs) are necessary for plantation
forests. Officials approving RKT work plans, in this case provincial forestry offices, rely on available documents
and the Wasganis evaluations for verifying the veracity of LHC cruising reports. Further, once an LHC has been
approved, there is no mechanism for using the LHC as a control instrument.
Preparation
Inspection
Timber cruising LHC RKT-UPHHK
Head of provincial forestry office
Ganis
Integrity pact
Ganis
Wasganis
1% – natural forest (HA) No inspection – plantation forest (HT)
14 days
14 days
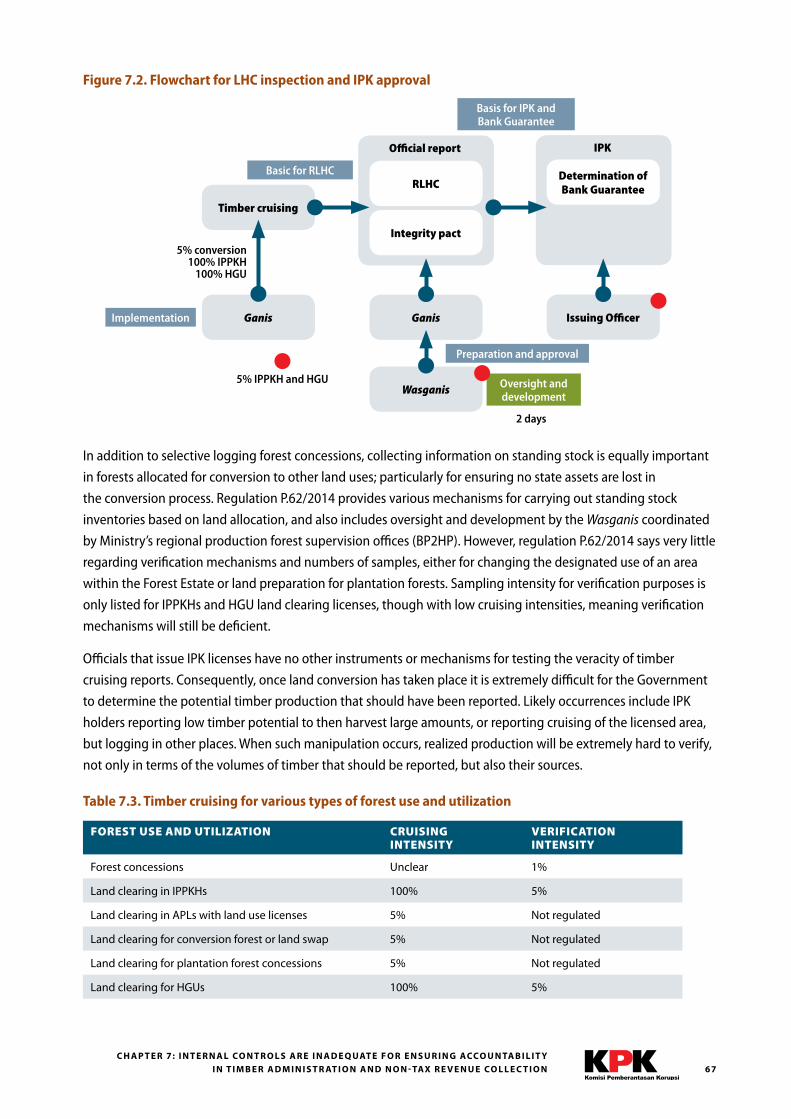
67C H A P T E R 7: I N T E R N A L CO N T R O L S A R E I N A D E Q UAT E F O R E N S U R I N G ACCO U N TA B I L I T Y
I N T I M B E R A D M I N I S T R AT I O N A N D N O N - TAX R E V E N U E CO L L E C T I O N
Figure 7.2. Flowchart for LHC inspection and IPK approval
In addition to selective logging forest concessions, collecting information on standing stock is equally important
in forests allocated for conversion to other land uses; particularly for ensuring no state assets are lost in
the conversion process. Regulation P.62/2014 provides various mechanisms for carrying out standing stock
inventories based on land allocation, and also includes oversight and development by the Wasganis coordinated
by Ministry’s regional production forest supervision offices (BP2HP). However, regulation P.62/2014 says very little
regarding verification mechanisms and numbers of samples, either for changing the designated use of an area
within the Forest Estate or land preparation for plantation forests. Sampling intensity for verification purposes is
only listed for IPPKHs and HGU land clearing licenses, though with low cruising intensities, meaning verification
mechanisms will still be deficient.
Officials that issue IPK licenses have no other instruments or mechanisms for testing the veracity of timber
cruising reports. Consequently, once land conversion has taken place it is extremely difficult for the Government
to determine the potential timber production that should have been reported. Likely occurrences include IPK
holders reporting low timber potential to then harvest large amounts, or reporting cruising of the licensed area,
but logging in other places. When such manipulation occurs, realized production will be extremely hard to verify,
not only in terms of the volumes of timber that should be reported, but also their sources.
Table 7.3. Timber cruising for various types of forest use and utilization
FOREST USE AND UTILIZATION CRUISING INTENSITY
VERIFICATION INTENSITY
Forest concessions Unclear 1%
Land clearing in IPPKHs 100% 5%
Land clearing in APLs with land use licenses 5% Not regulated
Land clearing for conversion forest or land swap 5% Not regulated
Land clearing for plantation forest concessions 5% Not regulated
Land clearing for HGUs 100% 5%
Official report
Implementation
Oversight and development
Timber cruising
RLHC
IPK
Issuing OfficerGanis
Integrity pact
Ganis
Wasganis5% IPPKH and HGU
5% conversion100% IPPKH
100% HGU
2 days
Basis for IPK and Bank Guarantee
Basic for RLHC Determination of Bank Guarantee
Preparation and approval
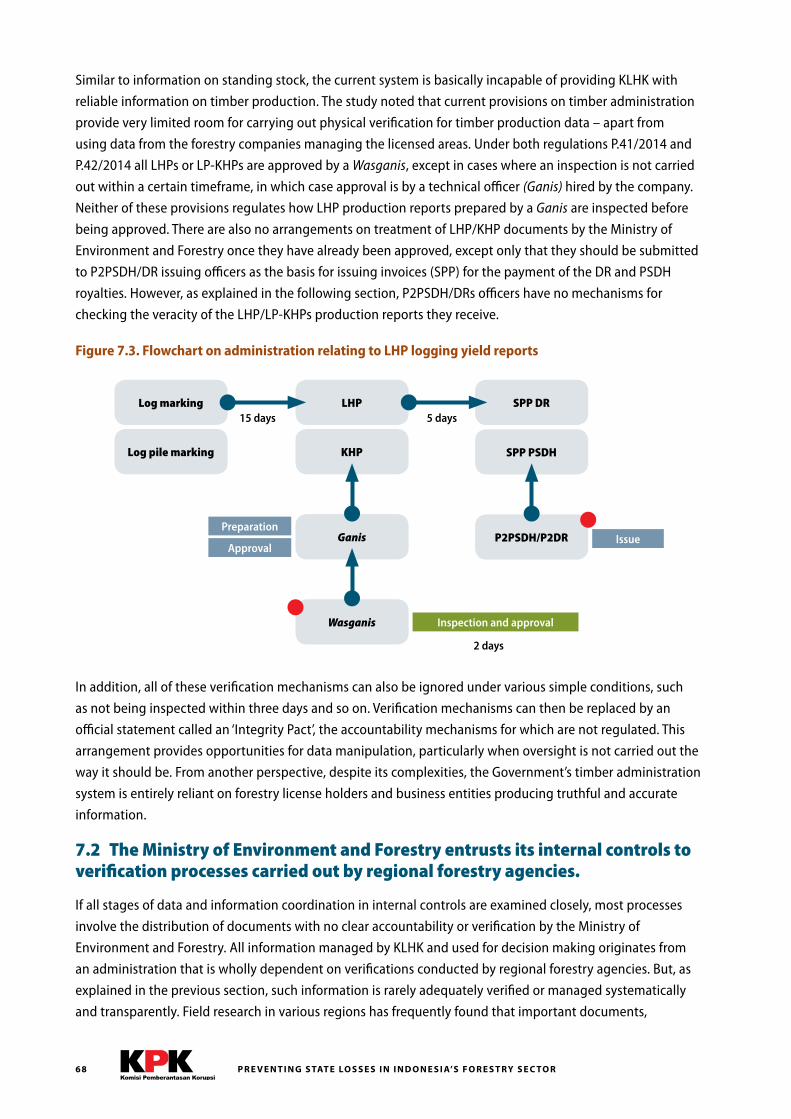
P R E V E N T I N G S TAT E LO S S E S I N I N D O N E S I A’S F O R E S T RY S E C TO R68
Similar to information on standing stock, the current system is basically incapable of providing KLHK with
reliable information on timber production. The study noted that current provisions on timber administration
provide very limited room for carrying out physical verification for timber production data – apart from
using data from the forestry companies managing the licensed areas. Under both regulations P.41/2014 and
P.42/2014 all LHPs or LP-KHPs are approved by a Wasganis, except in cases where an inspection is not carried
out within a certain timeframe, in which case approval is by a technical officer (Ganis) hired by the company.
Neither of these provisions regulates how LHP production reports prepared by a Ganis are inspected before
being approved. There are also no arrangements on treatment of LHP/KHP documents by the Ministry of
Environment and Forestry once they have already been approved, except only that they should be submitted
to P2PSDH/DR issuing officers as the basis for issuing invoices (SPP) for the payment of the DR and PSDH
royalties. However, as explained in the following section, P2PSDH/DRs officers have no mechanisms for
checking the veracity of the LHP/LP-KHPs production reports they receive.
Figure 7.3. Flowchart on administration relating to LHP logging yield reports
In addition, all of these verification mechanisms can also be ignored under various simple conditions, such
as not being inspected within three days and so on. Verification mechanisms can then be replaced by an
official statement called an ‘Integrity Pact’, the accountability mechanisms for which are not regulated. This
arrangement provides opportunities for data manipulation, particularly when oversight is not carried out the
way it should be. From another perspective, despite its complexities, the Government’s timber administration
system is entirely reliant on forestry license holders and business entities producing truthful and accurate
information.
7.2 The Ministry of Environment and Forestry entrusts its internal controls to verification processes carried out by regional forestry agencies.
If all stages of data and information coordination in internal controls are examined closely, most processes
involve the distribution of documents with no clear accountability or verification by the Ministry of
Environment and Forestry. All information managed by KLHK and used for decision making originates from
an administration that is wholly dependent on verifications conducted by regional forestry agencies. But, as
explained in the previous section, such information is rarely adequately verified or managed systematically
and transparently. Field research in various regions has frequently found that important documents,
IssuePreparation
Approval
Inspection and approval
Log marking LHP SPP DR
P2PSDH/P2DR
SPP PSDHLog pile marking KHP
Ganis
Wasganis
5 days15 days
2 days
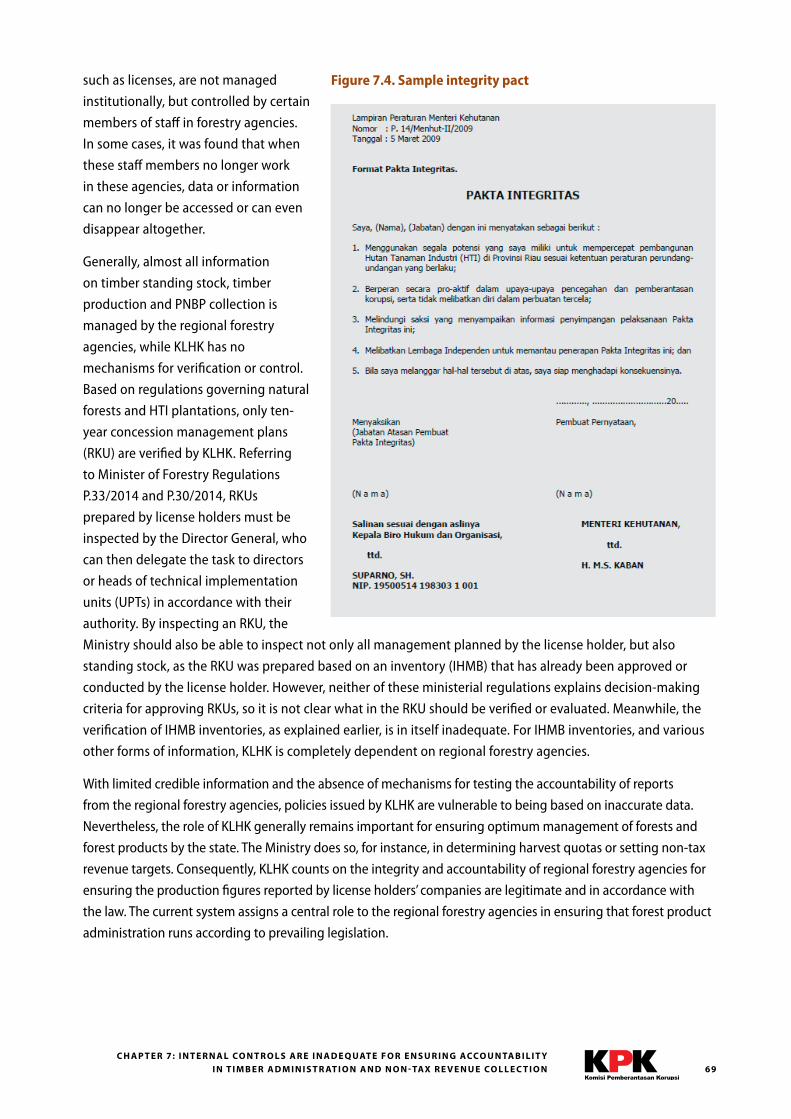
69C H A P T E R 7: I N T E R N A L CO N T R O L S A R E I N A D E Q UAT E F O R E N S U R I N G ACCO U N TA B I L I T Y
I N T I M B E R A D M I N I S T R AT I O N A N D N O N - TAX R E V E N U E CO L L E C T I O N
such as licenses, are not managed
institutionally, but controlled by certain
members of staff in forestry agencies.
In some cases, it was found that when
these staff members no longer work
in these agencies, data or information
can no longer be accessed or can even
disappear altogether.
Generally, almost all information
on timber standing stock, timber
production and PNBP collection is
managed by the regional forestry
agencies, while KLHK has no
mechanisms for verification or control.
Based on regulations governing natural
forests and HTI plantations, only ten-
year concession management plans
(RKU) are verified by KLHK. Referring
to Minister of Forestry Regulations
P.33/2014 and P.30/2014, RKUs
prepared by license holders must be
inspected by the Director General, who
can then delegate the task to directors
or heads of technical implementation
units (UPTs) in accordance with their
authority. By inspecting an RKU, the
Ministry should also be able to inspect not only all management planned by the license holder, but also
standing stock, as the RKU was prepared based on an inventory (IHMB) that has already been approved or
conducted by the license holder. However, neither of these ministerial regulations explains decision-making
criteria for approving RKUs, so it is not clear what in the RKU should be verified or evaluated. Meanwhile, the
verification of IHMB inventories, as explained earlier, is in itself inadequate. For IHMB inventories, and various
other forms of information, KLHK is completely dependent on regional forestry agencies.
With limited credible information and the absence of mechanisms for testing the accountability of reports
from the regional forestry agencies, policies issued by KLHK are vulnerable to being based on inaccurate data.
Nevertheless, the role of KLHK generally remains important for ensuring optimum management of forests and
forest products by the state. The Ministry does so, for instance, in determining harvest quotas or setting non-tax
revenue targets. Consequently, KLHK counts on the integrity and accountability of regional forestry agencies for
ensuring the production figures reported by license holders’ companies are legitimate and in accordance with
the law. The current system assigns a central role to the regional forestry agencies in ensuring that forest product
administration runs according to prevailing legislation.
Figure 7.4. Sample integrity pact
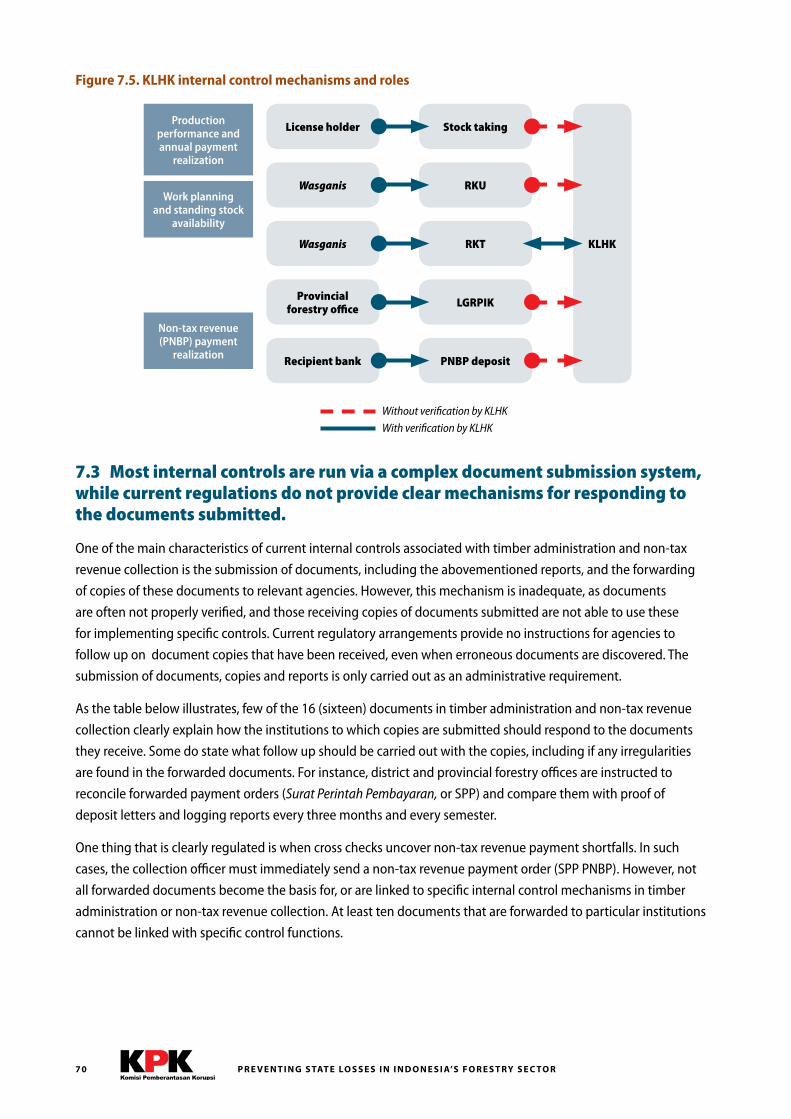
P R E V E N T I N G S TAT E LO S S E S I N I N D O N E S I A’S F O R E S T RY S E C TO R70
7.3 Most internal controls are run via a complex document submission system, while current regulations do not provide clear mechanisms for responding to the documents submitted.
One of the main characteristics of current internal controls associated with timber administration and non-tax
revenue collection is the submission of documents, including the abovementioned reports, and the forwarding
of copies of these documents to relevant agencies. However, this mechanism is inadequate, as documents
are often not properly verified, and those receiving copies of documents submitted are not able to use these
for implementing specific controls. Current regulatory arrangements provide no instructions for agencies to
follow up on document copies that have been received, even when erroneous documents are discovered. The
submission of documents, copies and reports is only carried out as an administrative requirement.
As the table below illustrates, few of the 16 (sixteen) documents in timber administration and non-tax revenue
collection clearly explain how the institutions to which copies are submitted should respond to the documents
they receive. Some do state what follow up should be carried out with the copies, including if any irregularities
are found in the forwarded documents. For instance, district and provincial forestry offices are instructed to
reconcile forwarded payment orders (Surat Perintah Pembayaran, or SPP) and compare them with proof of
deposit letters and logging reports every three months and every semester.
One thing that is clearly regulated is when cross checks uncover non-tax revenue payment shortfalls. In such
cases, the collection officer must immediately send a non-tax revenue payment order (SPP PNBP). However, not
all forwarded documents become the basis for, or are linked to specific internal control mechanisms in timber
administration or non-tax revenue collection. At least ten documents that are forwarded to particular institutions
cannot be linked with specific control functions.
Figure 7.5. KLHK internal control mechanisms and roles
License holder
Wasganis
Wasganis
Provincial forestry office
Recipient bank
Stock taking
RKU
RKT
LGRPIK
PNBP deposit
KLHK
Production performance and annual payment
realization
Work planning and standing stock
availability
Non-tax revenue (PNBP) payment
realization
Without verification by KLHK
With verification by KLHK
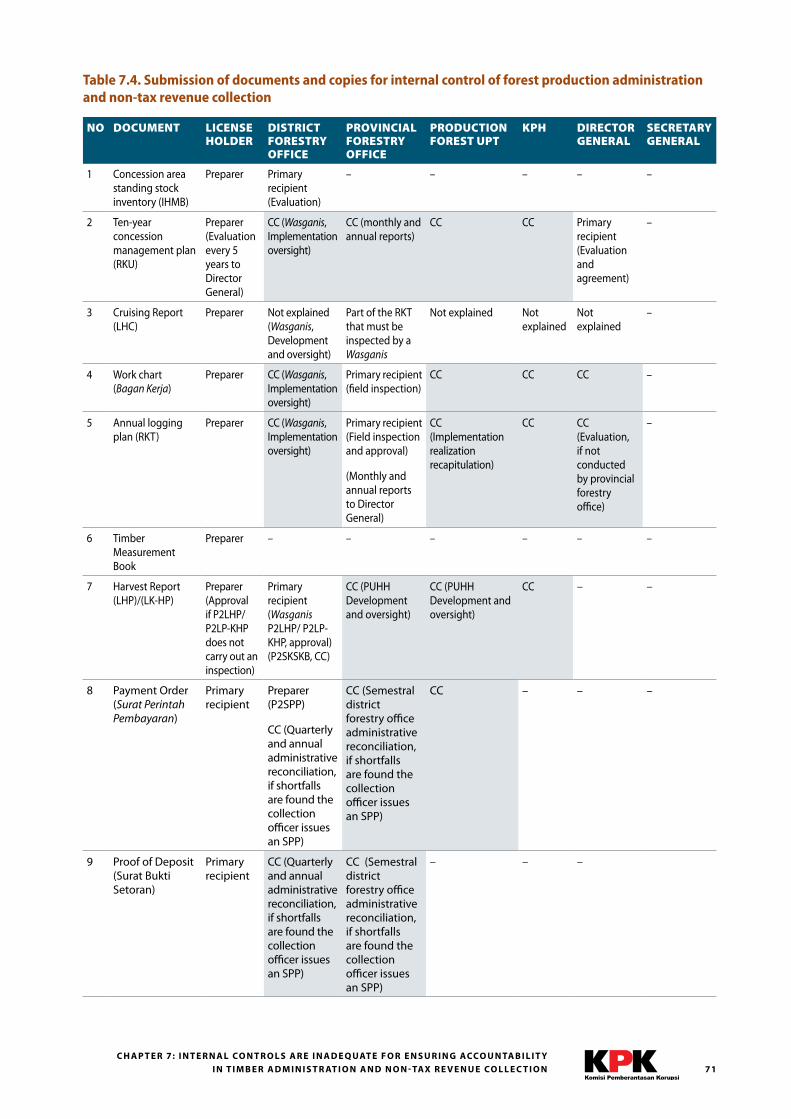
71C H A P T E R 7: I N T E R N A L CO N T R O L S A R E I N A D E Q UAT E F O R E N S U R I N G ACCO U N TA B I L I T Y
I N T I M B E R A D M I N I S T R AT I O N A N D N O N - TAX R E V E N U E CO L L E C T I O N
Table 7.4. Submission of documents and copies for internal control of forest production administration and non-tax revenue collection
NO DOCUMENT LICENSE HOLDER
DISTRICT FORESTRY OFFICE
PROVINCIAL FORESTRY OFFICE
PRODUCTION FOREST UPT
KPH DIRECTOR GENERAL
SECRETARY GENERAL
1 Concession area standing stock inventory (IHMB)
Preparer Primary recipient (Evaluation)
– – – – –
2 Ten-year concession management plan (RKU)
Preparer (Evaluation every 5 years to Director General)
CC (Wasganis, Implementation oversight)
CC (monthly and annual reports)
CC CC Primary recipient (Evaluation and agreement)
–
3 Cruising Report (LHC)
Preparer Not explained (Wasganis, Development and oversight)
Part of the RKT that must be inspected by a Wasganis
Not explained Not explained
Not explained
–
4 Work chart (Bagan Kerja)
Preparer CC (Wasganis, Implementation oversight)
Primary recipient (field inspection)
CC CC CC –
5 Annual logging plan (RKT)
Preparer CC (Wasganis, Implementation oversight)
Primary recipient (Field inspection and approval)
(Monthly and annual reports to Director General)
CC (Implementation realization recapitulation)
CC CC (Evaluation, if not conducted by provincial forestry office)
–
6 Timber Measurement Book
Preparer – – – – – –
7 Harvest Report (LHP)/(LK-HP)
Preparer (Approval if P2LHP/ P2LP-KHP does not carry out an inspection)
Primary recipient (Wasganis P2LHP/ P2LP-KHP, approval) (P2SKSKB, CC)
CC (PUHH Development and oversight)
CC (PUHH Development and oversight)
CC – –
8 Payment Order (Surat Perintah Pembayaran)
Primary recipient
Preparer (P2SPP)
CC (Quarterly and annual administrative reconciliation, if shortfalls are found the collection officer issues an SPP)
CC (Semestral district forestry office administrative reconciliation, if shortfalls are found the collection officer issues an SPP)
CC – – –
9 Proof of Deposit (Surat Bukti Setoran)
Primary recipient
CC (Quarterly and annual administrative reconciliation, if shortfalls are found the collection officer issues an SPP)
CC (Semestral district forestry office administrative reconciliation, if shortfalls are found the collection officer issues an SPP)
– – –
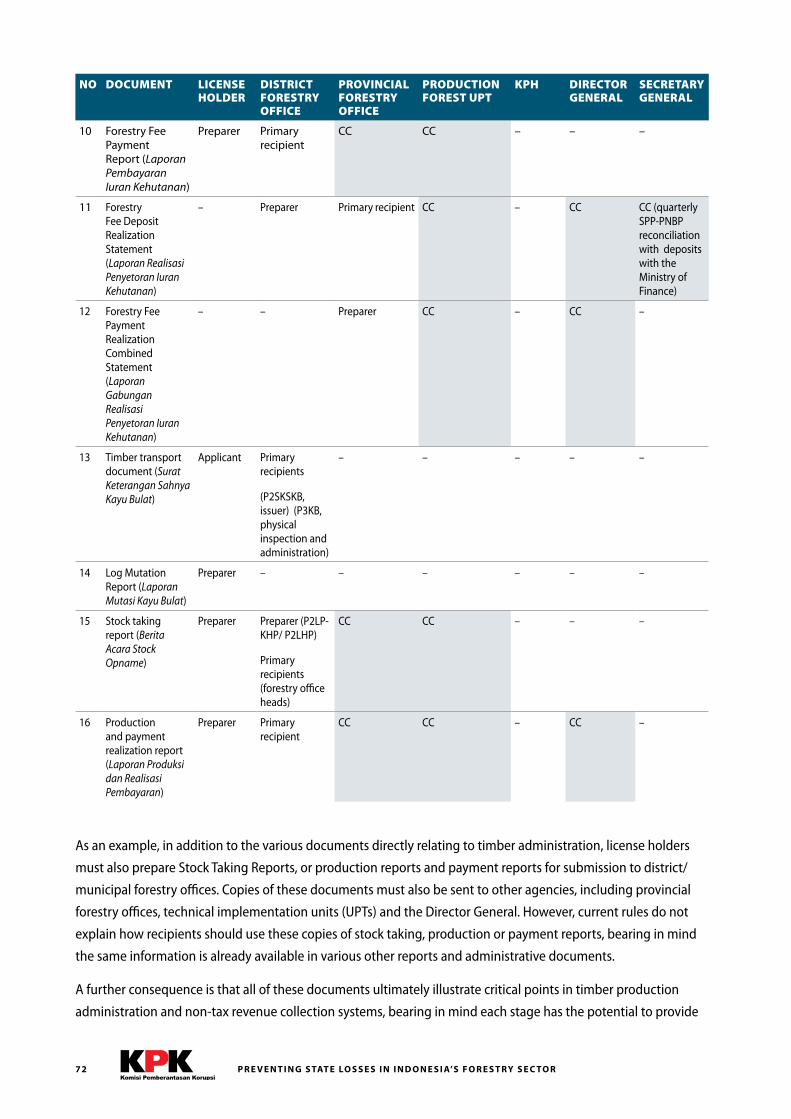
P R E V E N T I N G S TAT E LO S S E S I N I N D O N E S I A’S F O R E S T RY S E C TO R72
NO DOCUMENT LICENSE HOLDER
DISTRICT FORESTRY OFFICE
PROVINCIAL FORESTRY OFFICE
PRODUCTION FOREST UPT
KPH DIRECTOR GENERAL
SECRETARY GENERAL
10 Forestry Fee Payment Report (Laporan Pembayaran Iuran Kehutanan)
Preparer Primary recipient
CC CC – – –
11 Forestry Fee Deposit Realization Statement (Laporan Realisasi Penyetoran Iuran Kehutanan)
– Preparer Primary recipient CC – CC CC (quarterly SPP-PNBP reconciliation with deposits with the Ministry of Finance)
12 Forestry Fee Payment Realization Combined Statement (Laporan Gabungan Realisasi Penyetoran Iuran Kehutanan)
– – Preparer CC – CC –
13 Timber transport document (Surat Keterangan Sahnya Kayu Bulat)
Applicant Primary recipients
(P2SKSKB, issuer) (P3KB, physical inspection and administration)
– – – – –
14 Log Mutation Report (Laporan Mutasi Kayu Bulat)
Preparer – – – – – –
15 Stock taking report (Berita Acara Stock Opname)
Preparer Preparer (P2LP-KHP/ P2LHP)
Primary recipients (forestry office heads)
CC CC – – –
16 Production and payment realization report (Laporan Produksi dan Realisasi Pembayaran)
Preparer Primary recipient
CC CC – CC –
As an example, in addition to the various documents directly relating to timber administration, license holders
must also prepare Stock Taking Reports, or production reports and payment reports for submission to district/
municipal forestry offices. Copies of these documents must also be sent to other agencies, including provincial
forestry offices, technical implementation units (UPTs) and the Director General. However, current rules do not
explain how recipients should use these copies of stock taking, production or payment reports, bearing in mind
the same information is already available in various other reports and administrative documents.
A further consequence is that all of these documents ultimately illustrate critical points in timber production
administration and non-tax revenue collection systems, bearing in mind each stage has the potential to provide
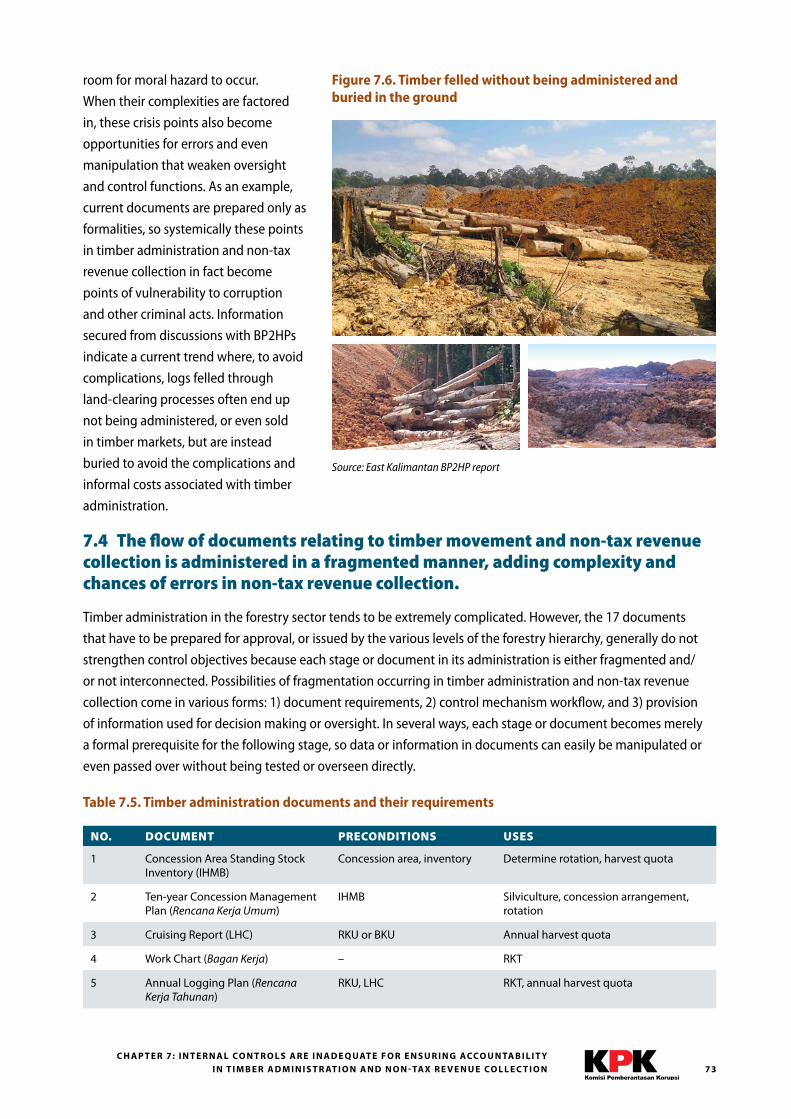
73C H A P T E R 7: I N T E R N A L CO N T R O L S A R E I N A D E Q UAT E F O R E N S U R I N G ACCO U N TA B I L I T Y
I N T I M B E R A D M I N I S T R AT I O N A N D N O N - TAX R E V E N U E CO L L E C T I O N
room for moral hazard to occur.
When their complexities are factored
in, these crisis points also become
opportunities for errors and even
manipulation that weaken oversight
and control functions. As an example,
current documents are prepared only as
formalities, so systemically these points
in timber administration and non-tax
revenue collection in fact become
points of vulnerability to corruption
and other criminal acts. Information
secured from discussions with BP2HPs
indicate a current trend where, to avoid
complications, logs felled through
land-clearing processes often end up
not being administered, or even sold
in timber markets, but are instead
buried to avoid the complications and
informal costs associated with timber
administration.
7.4 The flow of documents relating to timber movement and non-tax revenue collection is administered in a fragmented manner, adding complexity and chances of errors in non-tax revenue collection.
Timber administration in the forestry sector tends to be extremely complicated. However, the 17 documents
that have to be prepared for approval, or issued by the various levels of the forestry hierarchy, generally do not
strengthen control objectives because each stage or document in its administration is either fragmented and/
or not interconnected. Possibilities of fragmentation occurring in timber administration and non-tax revenue
collection come in various forms: 1) document requirements, 2) control mechanism workflow, and 3) provision
of information used for decision making or oversight. In several ways, each stage or document becomes merely
a formal prerequisite for the following stage, so data or information in documents can easily be manipulated or
even passed over without being tested or overseen directly.
Table 7.5. Timber administration documents and their requirements
NO. DOCUMENT PRECONDITIONS USES
1 Concession Area Standing Stock Inventory (IHMB)
Concession area, inventory Determine rotation, harvest quota
2 Ten-year Concession Management Plan (Rencana Kerja Umum)
IHMB Silviculture, concession arrangement, rotation
3 Cruising Report (LHC) RKU or BKU Annual harvest quota
4 Work Chart (Bagan Kerja) – RKT
5 Annual Logging Plan (Rencana Kerja Tahunan)
RKU, LHC RKT, annual harvest quota
Figure 7.6. Timber felled without being administered and buried in the ground
Source: East Kalimantan BP2HP report
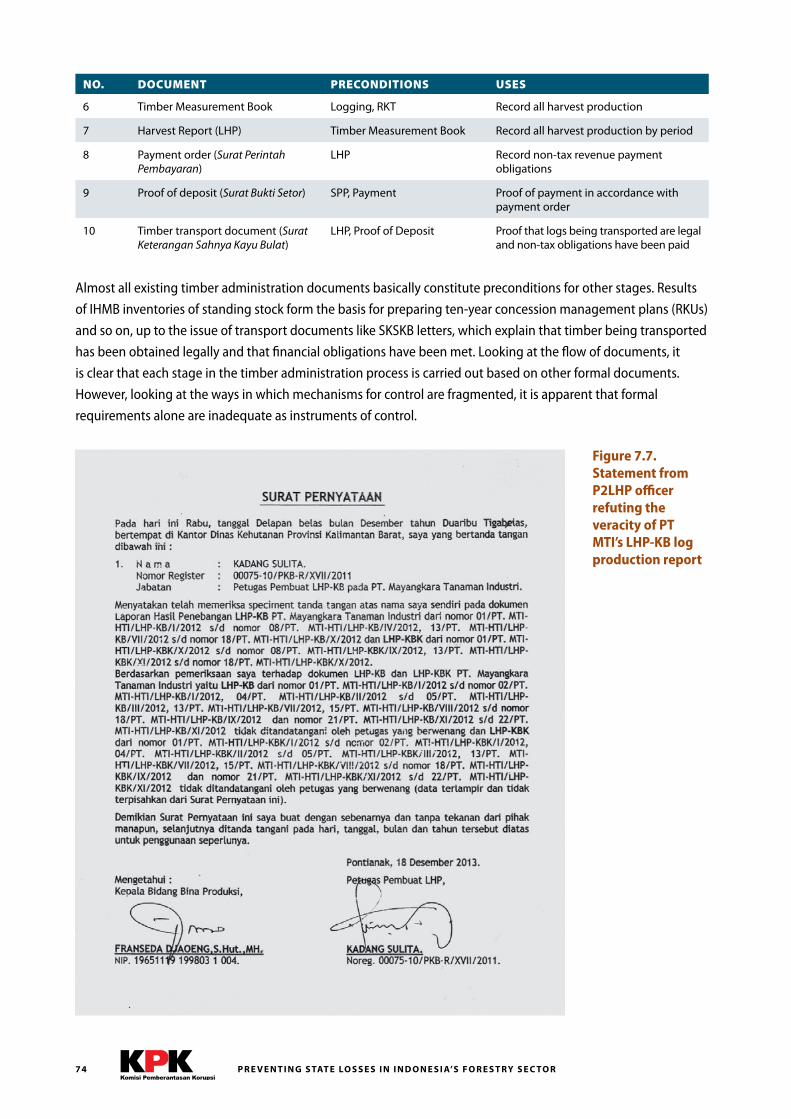
P R E V E N T I N G S TAT E LO S S E S I N I N D O N E S I A’S F O R E S T RY S E C TO R74
NO. DOCUMENT PRECONDITIONS USES
6 Timber Measurement Book Logging, RKT Record all harvest production
7 Harvest Report (LHP) Timber Measurement Book Record all harvest production by period
8 Payment order (Surat Perintah Pembayaran)
LHP Record non-tax revenue payment obligations
9 Proof of deposit (Surat Bukti Setor) SPP, Payment Proof of payment in accordance with payment order
10 Timber transport document (Surat Keterangan Sahnya Kayu Bulat)
LHP, Proof of Deposit Proof that logs being transported are legal and non-tax obligations have been paid
Almost all existing timber administration documents basically constitute preconditions for other stages. Results
of IHMB inventories of standing stock form the basis for preparing ten-year concession management plans (RKUs)
and so on, up to the issue of transport documents like SKSKB letters, which explain that timber being transported
has been obtained legally and that financial obligations have been met. Looking at the flow of documents, it
is clear that each stage in the timber administration process is carried out based on other formal documents.
However, looking at the ways in which mechanisms for control are fragmented, it is apparent that formal
requirements alone are inadequate as instruments of control.
Figure 7.7. Statement from P2LHP officer refuting the veracity of PT MTI’s LHP-KB log production report
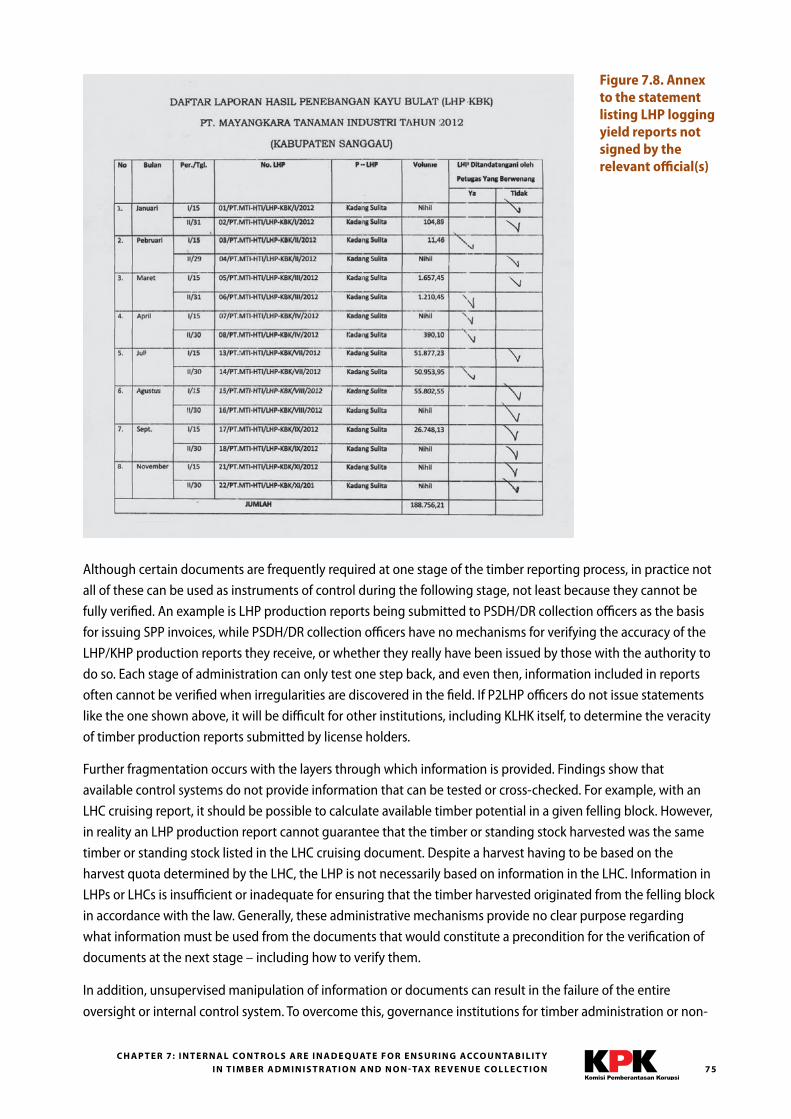
75C H A P T E R 7: I N T E R N A L CO N T R O L S A R E I N A D E Q UAT E F O R E N S U R I N G ACCO U N TA B I L I T Y
I N T I M B E R A D M I N I S T R AT I O N A N D N O N - TAX R E V E N U E CO L L E C T I O N
Although certain documents are frequently required at one stage of the timber reporting process, in practice not
all of these can be used as instruments of control during the following stage, not least because they cannot be
fully verified. An example is LHP production reports being submitted to PSDH/DR collection officers as the basis
for issuing SPP invoices, while PSDH/DR collection officers have no mechanisms for verifying the accuracy of the
LHP/KHP production reports they receive, or whether they really have been issued by those with the authority to
do so. Each stage of administration can only test one step back, and even then, information included in reports
often cannot be verified when irregularities are discovered in the field. If P2LHP officers do not issue statements
like the one shown above, it will be difficult for other institutions, including KLHK itself, to determine the veracity
of timber production reports submitted by license holders.
Further fragmentation occurs with the layers through which information is provided. Findings show that
available control systems do not provide information that can be tested or cross-checked. For example, with an
LHC cruising report, it should be possible to calculate available timber potential in a given felling block. However,
in reality an LHP production report cannot guarantee that the timber or standing stock harvested was the same
timber or standing stock listed in the LHC cruising document. Despite a harvest having to be based on the
harvest quota determined by the LHC, the LHP is not necessarily based on information in the LHC. Information in
LHPs or LHCs is insufficient or inadequate for ensuring that the timber harvested originated from the felling block
in accordance with the law. Generally, these administrative mechanisms provide no clear purpose regarding
what information must be used from the documents that would constitute a precondition for the verification of
documents at the next stage – including how to verify them.
In addition, unsupervised manipulation of information or documents can result in the failure of the entire
oversight or internal control system. To overcome this, governance institutions for timber administration or non-
Figure 7.8. Annex to the statement listing LHP logging yield reports not signed by the relevant official(s)
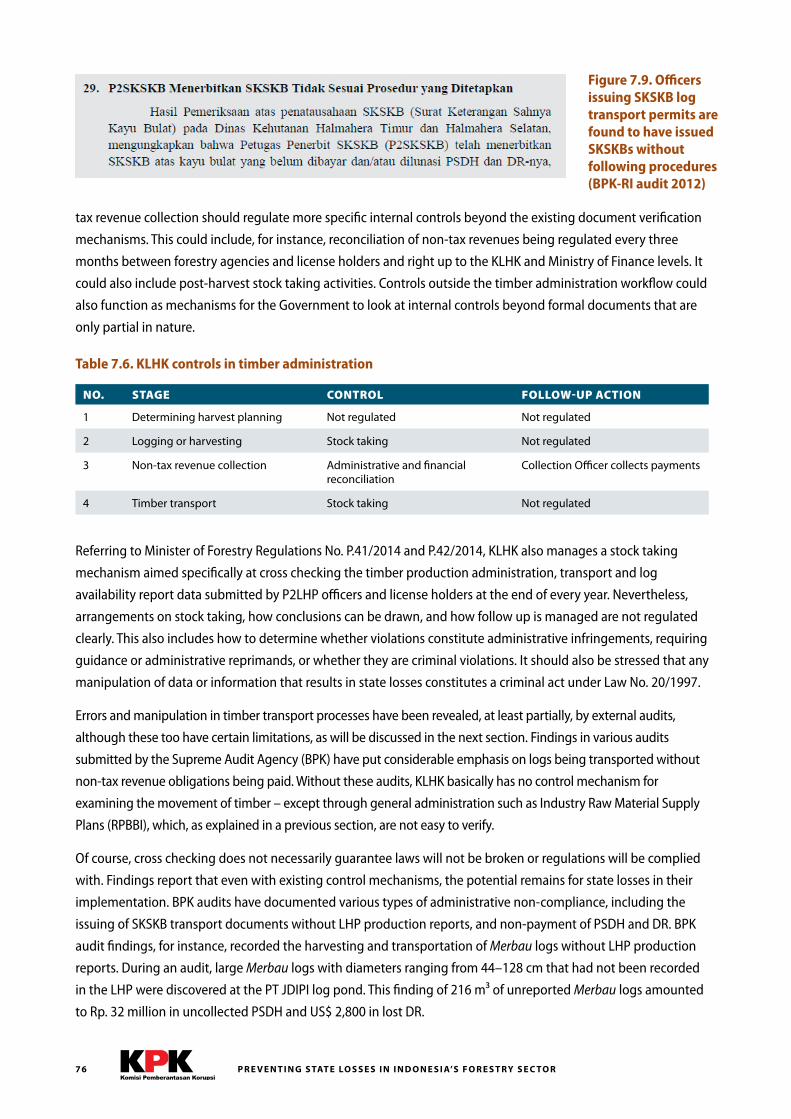
P R E V E N T I N G S TAT E LO S S E S I N I N D O N E S I A’S F O R E S T RY S E C TO R76
tax revenue collection should regulate more specific internal controls beyond the existing document verification
mechanisms. This could include, for instance, reconciliation of non-tax revenues being regulated every three
months between forestry agencies and license holders and right up to the KLHK and Ministry of Finance levels. It
could also include post-harvest stock taking activities. Controls outside the timber administration workflow could
also function as mechanisms for the Government to look at internal controls beyond formal documents that are
only partial in nature.
Table 7.6. KLHK controls in timber administration
NO. STAGE CONTROL FOLLOW-UP ACTION
1 Determining harvest planning Not regulated Not regulated
2 Logging or harvesting Stock taking Not regulated
3 Non-tax revenue collection Administrative and financial reconciliation
Collection Officer collects payments
4 Timber transport Stock taking Not regulated
Referring to Minister of Forestry Regulations No. P.41/2014 and P.42/2014, KLHK also manages a stock taking
mechanism aimed specifically at cross checking the timber production administration, transport and log
availability report data submitted by P2LHP officers and license holders at the end of every year. Nevertheless,
arrangements on stock taking, how conclusions can be drawn, and how follow up is managed are not regulated
clearly. This also includes how to determine whether violations constitute administrative infringements, requiring
guidance or administrative reprimands, or whether they are criminal violations. It should also be stressed that any
manipulation of data or information that results in state losses constitutes a criminal act under Law No. 20/1997.
Errors and manipulation in timber transport processes have been revealed, at least partially, by external audits,
although these too have certain limitations, as will be discussed in the next section. Findings in various audits
submitted by the Supreme Audit Agency (BPK) have put considerable emphasis on logs being transported without
non-tax revenue obligations being paid. Without these audits, KLHK basically has no control mechanism for
examining the movement of timber – except through general administration such as Industry Raw Material Supply
Plans (RPBBI), which, as explained in a previous section, are not easy to verify.
Of course, cross checking does not necessarily guarantee laws will not be broken or regulations will be complied
with. Findings report that even with existing control mechanisms, the potential remains for state losses in their
implementation. BPK audits have documented various types of administrative non-compliance, including the
issuing of SKSKB transport documents without LHP production reports, and non-payment of PSDH and DR. BPK
audit findings, for instance, recorded the harvesting and transportation of Merbau logs without LHP production
reports. During an audit, large Merbau logs with diameters ranging from 44–128 cm that had not been recorded
in the LHP were discovered at the PT JDIPI log pond. This finding of 216 m³ of unreported Merbau logs amounted
to Rp. 32 million in uncollected PSDH and US$ 2,800 in lost DR.
Figure 7.9. Officers issuing SKSKB log transport permits are found to have issued SKSKBs without following procedures (BPK-RI audit 2012)
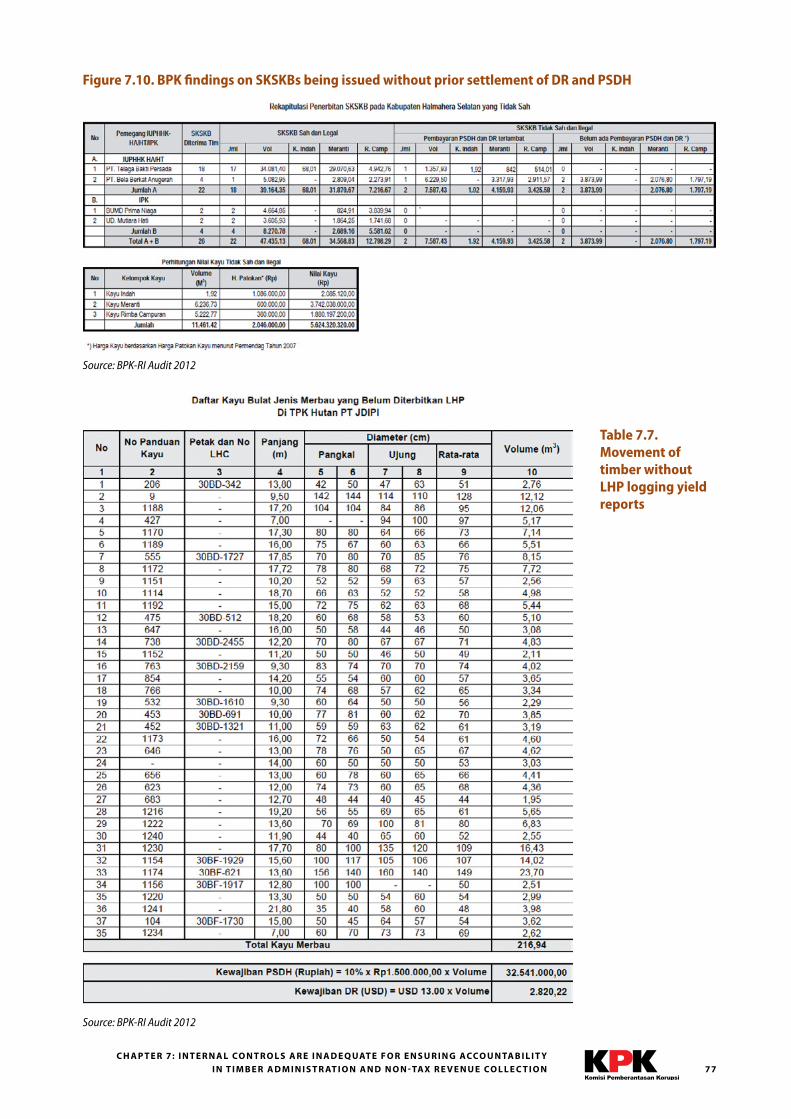
77C H A P T E R 7: I N T E R N A L CO N T R O L S A R E I N A D E Q UAT E F O R E N S U R I N G ACCO U N TA B I L I T Y
I N T I M B E R A D M I N I S T R AT I O N A N D N O N - TAX R E V E N U E CO L L E C T I O N
Table 7.7. Movement of timber without LHP logging yield reports
Source: BPK-RI Audit 2012
Figure 7.10. BPK findings on SKSKBs being issued without prior settlement of DR and PSDH
Source: BPK-RI Audit 2012
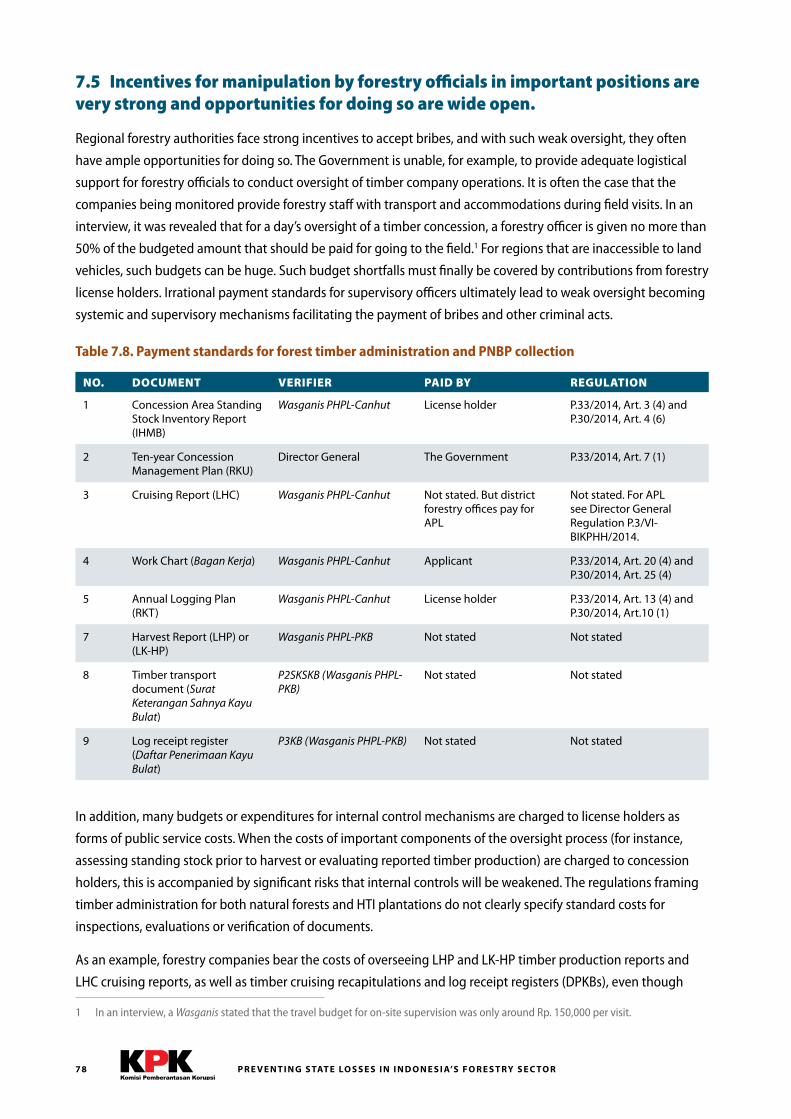
P R E V E N T I N G S TAT E LO S S E S I N I N D O N E S I A’S F O R E S T RY S E C TO R78
7.5 Incentives for manipulation by forestry officials in important positions are very strong and opportunities for doing so are wide open.
Regional forestry authorities face strong incentives to accept bribes, and with such weak oversight, they often
have ample opportunities for doing so. The Government is unable, for example, to provide adequate logistical
support for forestry officials to conduct oversight of timber company operations. It is often the case that the
companies being monitored provide forestry staff with transport and accommodations during field visits. In an
interview, it was revealed that for a day’s oversight of a timber concession, a forestry officer is given no more than
50% of the budgeted amount that should be paid for going to the field.1 For regions that are inaccessible to land
vehicles, such budgets can be huge. Such budget shortfalls must finally be covered by contributions from forestry
license holders. Irrational payment standards for supervisory officers ultimately lead to weak oversight becoming
systemic and supervisory mechanisms facilitating the payment of bribes and other criminal acts.
Table 7.8. Payment standards for forest timber administration and PNBP collection
NO. DOCUMENT VERIFIER PAID BY REGULATION
1 Concession Area Standing Stock Inventory Report (IHMB)
Wasganis PHPL-Canhut License holder P.33/2014, Art. 3 (4) and P.30/2014, Art. 4 (6)
2 Ten-year Concession Management Plan (RKU)
Director General The Government P.33/2014, Art. 7 (1)
3 Cruising Report (LHC) Wasganis PHPL-Canhut Not stated. But district forestry offices pay for APL
Not stated. For APL see Director General Regulation P.3/VI-BIKPHH/2014.
4 Work Chart (Bagan Kerja) Wasganis PHPL-Canhut Applicant P.33/2014, Art. 20 (4) and P.30/2014, Art. 25 (4)
5 Annual Logging Plan (RKT)
Wasganis PHPL-Canhut License holder P.33/2014, Art. 13 (4) and P.30/2014, Art.10 (1)
7 Harvest Report (LHP) or (LK-HP)
Wasganis PHPL-PKB Not stated Not stated
8 Timber transport document (Surat Keterangan Sahnya Kayu Bulat)
P2SKSKB (Wasganis PHPL-PKB)
Not stated Not stated
9 Log receipt register (Daftar Penerimaan Kayu Bulat)
P3KB (Wasganis PHPL-PKB) Not stated Not stated
In addition, many budgets or expenditures for internal control mechanisms are charged to license holders as
forms of public service costs. When the costs of important components of the oversight process (for instance,
assessing standing stock prior to harvest or evaluating reported timber production) are charged to concession
holders, this is accompanied by significant risks that internal controls will be weakened. The regulations framing
timber administration for both natural forests and HTI plantations do not clearly specify standard costs for
inspections, evaluations or verification of documents.
As an example, forestry companies bear the costs of overseeing LHP and LK-HP timber production reports and
LHC cruising reports, as well as timber cruising recapitulations and log receipt registers (DPKBs), even though
1 In an interview, a Wasganis stated that the travel budget for on-site supervision was only around Rp. 150,000 per visit.

79C H A P T E R 7: I N T E R N A L CO N T R O L S A R E I N A D E Q UAT E F O R E N S U R I N G ACCO U N TA B I L I T Y
I N T I M B E R A D M I N I S T R AT I O N A N D N O N - TAX R E V E N U E CO L L E C T I O N
these documents must be approved and inspected in the field. DPKB registers, for instance, must be inspected
by P3KB officers in ports receiving logs. Under such conditions, both inspectors and license holders often have
a common interest (Obidzinski 2004). For license holders, this becomes an opportunity to weaken the control
function, which they have a strong incentive to exploit if it enables them to capture significant economic rent.
When such informal costs are considered economically rational, as found in interviews, some companies even
give monthly wages to the forestry agency’s in-field supervisor (i.e. the Wasganis) to ‘facilitate’ administration
of their forest products. When this happens, oversight mechanisms are not only vulnerable to bribery and other
crimes, but also become structurally corrupt.
P R E V E N T I N G S TAT E LO S S E S I N I N D O N E S I A’S F O R E S T RY S E C TO R80
Chapter 8: External accountability mechanisms are inadequate for preventing state losses from manipulation of information on timber production and non-tax revenue collection. Within the structure of the Indonesian state, few institutions hold as much administrative authority as that vested
in the Ministry of Environment and Forestry. Under the nation’s basic forestry laws, KLHK is assigned primary
responsibility to oversee the management, exploitation, and use of all forest resources located within the Forest
Estate, which covers 131 million hectares. In exercising its authority over these resources, KLHK has prioritized
commercial timber production from selective logging and land clearing and the collection of PNBP forestry
revenues. In managing both the underlying forest resource and the collection of PNBP revenues, KLHK holds
a responsibility to ensure these are managed in a way that supports economic growth, conserves forests, and
provides equity and justice for the Indonesian people.
To a significant degree, the high levels of unreported timber production and under-collection of PNBP revenues
in the forestry sector have been facilitated by the absence of effective external controls to ensure KLHK is fulfilling
these responsibilities. This chapter examines four areas where external controls over KLHK’s administration of
timber production and collection of PNBP have not functioned effectively. These include: inefficient coordination
between KLHK and the Ministry of Finance in setting accountable PNBP collection targets; the absence of
a comprehensive audit of PNBP forestry revenue collection by Indonesia’s Supreme Audit Agency (BPK-RI);
institutional weaknesses in the Government’s SVLK timber legality verification system; and the limited public
accountability demonstrated by KLHK in releasing accurate and verifiable data on timber production and PNBP
collection.
8.1 The Ministry of Finance holds ultimate authority for overseeing collection of PNBP by the Government, but it has done little to hold the Ministry of Environment and Forestry accountable for the low levels of PNBP collected in the forestry sector.
According to Law No. 20/1997 on Non-Tax State Revenues, the Ministry of Finance is responsible for overseeing
the collection of PNBP revenues from all sources, including forests and other natural resources. The Ministry
of Finance is allowed to delegate responsibility to invoice (menagih) and collect (memungut) PNBP to relevant
Government institutions (Instansi Pemerintah), which in turn are required to deposit revenues collected into the
National Treasury account (rekening Kas Negara) (Article 6 paragraph 1 and 2). These institutions are charged with
carrying out this function under the oversight of the Ministry of Finance, and they are subject to legal sanctions
if they fail to fulfill these responsibilities (Article 6 paragraph 3). In the forestry sector, the Ministry of Finance has
delegated authority to collect PNBP to the Ministry of Environment and Forestry (PP No. 12/2014 and P.52/2014).
In carrying out this function, KLHK is required to submit to the Ministry of Finance routine written plans for
PNBP collection and reports of amounts collected in order to ensure the administration of PNBP is planned
81
C H A P T E R 8: E X T E R N A L ACCO U N TA B I L I T Y M E C H A N I S M S A R E I N A D E Q UAT E F O R P R E V E N T I N G S TAT E LO S S E S F R O M M A N I P U L AT I O N O F I N F O R M AT I O N O N
T I M B E R P R O D U C T I O N A N D N O N - TAX R E V E N U E CO L L E C T I O N
and orderly (agar pengelolaan Penerimaan Negara Bukan Pajak terencana dan tertib) (Article 7 paragraph 1 Law
No. 20/1997 and its elucidation). KLHK is required to submit these reports every three months in the form of a
Laporan Realisasi PNBP Triwulan (PP No. 1/2004). According to interviews with officials at KLHK and the Ministry
of Finance, the content of these reports is generally limited to quantitative summaries of planned and realized
receipts from the various royalties, levies, and fees that make up the PNBP in the forestry sector; the amounts
transferred to the National Treasury account (Rekening Kas Umum Negara); as well as the balance of funds in the
Forestry Development Account (Rekening Pembangunan Hutan) and other depository accounts held by KLHK to
manage PNBP receipts.1,2
In reviewing these reports, the Ministry of Finance generally does little more than to assess whether previously
reported receipts have been transferred to the National Treasury Account and whether the balances in the various
accounts match with the financial reports. Without access to accurate data on commercial timber production, the
Ministry of Finance has little basis to evaluate whether the annual PNBP collection targets submitted by KLHK
are a reasonable reflection of the amounts that should be collected. Moreover, without reliable information on
the amounts of PNBP owed and/or collected either by payer (Wajib Bayar) or by region, the Ministry of Finance
has no direct means to determine whether the receipts reported by KLHK are accurate based on the volumes
of wood actually harvested. In short, the Ministry of Finance’s external oversight of KLHK’s collection of PNBP in
the forestry sector is extremely limited and apparently has not gone beyond reconciling receipts after they have
entered Government accounts.
The failure of the Ministry of Finance to exercise greater oversight over KLHK’s collection of PNBP revenues in
the forestry sector, however, cannot be attributed to a lack of data alone. Based on Law No. 20/1997, Article
14, paragraph 2, the Ministry of Finance can request the Finance and Development Supervisory Board (Badan
Pengawasan Keuangan dan Pembangunan, or BPKP) to conduct a special purpose audit of KLHK’s timber product
administration and PNBP revenue collection systems. Given the high rates of deforestation and illegal logging
that have been documented in Indonesia over the past decade, it is surprising that the Ministry of Finance has not
made such a request and taken more direct steps to strengthen KLHK’s performance in PNBP revenue collection.
8.2 The Supreme Audit Agency (BPK-RI) has not yet conducted a comprehensive audit of KLHK’s administrative systems for timber production and PNBP collection, and routine audits of KLHK’s financial statements have not examined how much revenue should be collected.
According to Law No. 15/2006, BPK-RI is an independent agency with a mandate to audit the management of
state finances by the Central Government, Local Government, State Institutions, Bank Indonesia, State-Owned
Enterprises, Public Service Boards, Region-Owned Enterprises and other agencies or institutions which manage
state finances.3 BPK-RI conducts financial audits, performance audits, and special purpose audits.4 It holds
authority to determine the value of state losses caused by violations of the law, whether through intent or
negligence, committed by the treasurers or managers of state-owned enterprises, region-owned enterprises,
agencies, or institutions that manage state finances.5
1 For the DR, these accounts include: 1) Rekening DR Murni, giro dalam dolar AS; 2) Rekening Tunggakan DR, giro dalam dolar AS; and Rekening Pengembalian Pinjaman, giro dalam rupiah.
2 For the PSDH, these accounts include: 1) Rekening PSDH Murni, giro dalam rupiah; and 2) Rekening Tunggakan PSDH, giro dalam rupiah.
3 Law No. 15/2006 on the Supreme Audit Agency, Article 6, paragraph 1
4 Law No. 15/2006 on the Supreme Audit Agency, Article 6, paragraph 3
5 Law No. 15/2006 on the Supreme Audit Agency, Article 10, paragraph 1
P R E V E N T I N G S TAT E LO S S E S I N I N D O N E S I A’S F O R E S T RY S E C TO R82
During the study period, BPK-RI conducted numerous special purpose audits focusing on the administration
of PNBP and other issues related to the management of state finances in the forestry sector. These audits were
carried out at the national level and at the provincial and district levels in several of the major timber producing
regions. Collectively, these audits served an extremely important function by identifying specific cases of state
loss, documenting weaknesses in PNBP revenue collection and management by state institutions and agencies at
each level, and offering recommendations for how these could be addressed.
As an example, a special purpose audit released by BPK-RI in 2012 examined forestry sector PNBP management,
the Forest Development Account, and the forestry Natural Resources Profit Sharing Fund for fiscal years 2009
until the third quarter of 2011 in the Ministry of Forestry, Ministry of Finance, provincial and district/municipal
governments, as well as other relevant institutions in Jakarta, Riau, South Sumatra, East Java, West Kalimantan,
Central Kalimantan, East Kalimantan, North Maluku, West Papua, and Papua.6 In the audit report, BPK-RI listed
29 findings covering specific cases of state loss, weaknesses in financial management, and violations of laws and
regulations. BPK-RI summarized its conclusions as follows:
The BPK audit concludes that the Internal Control Systems (Sistem Pengendalian Internal, or SPI) for managing
PNBP, the Forest Development Account (Rekening Pembangunan Hutan, or RPH), and the forestry Natural
Resource Profit Sharing Fund (Dana Bagi Hasil Sumber Daya Alam, or DBH SDA) are inadequate and have yet to
meet the principle of compliance . This is because of the continuing presence of weak policies and weaknesses in
PNBP collection, and management of the RPH, and forestry DBH SDA, which increase risks of PNBP targets not
being achieved, state losses, and forest degradation . . . .
Although these special purpose audits document extensive problems in the collection and administration of
PNBP in the forestry sector, BPK-RI has never conducted a comprehensive audit to determine the overall scale
of state losses from unreported timber production and the under-collection of PNBP revenues. With the current
study estimating such large state losses, it is now essential that BPK-RI carry out a thorough audit of the state’s
administrative systems for overseeing timber production and the collection of PNBP in the forestry sector.
The general objective of such a comprehensive audit is to provide input for improving the forestry PNBP
collection system in order to prevent further state losses from under-collection of DR, PSDH, PNT, and PKH
revenues. Specific objectives are as follows:
1. Calculating timber production amounts licensed by the central and/or regional governments in the audit period;
2. Estimating actual amounts of timber produced in the audit period;
3. Calculating the amounts of DR, PSDH, PNT, and PKH the central Government should have received in the audit period;
4. Calculating the amounts of forestry resources PNBP collected in accordance with prevailing laws and regulations;
5. Calculating the amounts of uncollected, under-collected and overdue forestry PNBP revenues;
6. Assessing the quality of internal controls for forestry PNBP collection systems;
6 Supreme Audit Agency of the Republic of Indonesia, Audit Report (Special Purpose Audit) Fiscal Year 2011, Semester II – forestry sector PNBP management, the Forest Development Account, and the Forestry Natural Resources Profit Sharing Fund for fiscal years 2009 until the third quarter of 2011 in the Ministry of Forestry, Ministry of Finance, provincial and district/municipal governments, as well as other relevant institutions in Jakarta, Riau, South Sumatra, East Java, West Kalimantan, Central Kalimantan, East Kalimantan, North Maluku, West Papua, and Papua, Number: 07/LHP/XVII/01/2012, dated 26 January 2012.
83
C H A P T E R 8: E X T E R N A L ACCO U N TA B I L I T Y M E C H A N I S M S A R E I N A D E Q UAT E F O R P R E V E N T I N G S TAT E LO S S E S F R O M M A N I P U L AT I O N O F I N F O R M AT I O N O N
T I M B E R P R O D U C T I O N A N D N O N - TAX R E V E N U E CO L L E C T I O N
7. Assessing the quality of external controls for forestry PNBP collection systems;
8. Evaluating the timber benchmark price (harga patokan) for forestry PNBP and forestry PNBP rates;
9. Preparing recommendations for recognizing companies and public officials that comply with prevailing laws and regulations;
10. Preparing recommendations for imposing sanctions on companies and public officials that fail to comply with prevailing laws and regulations; and
11. Preparing recommendations for improving forestry PNBP collection systems specifically for DR, PSDH, PNT, and PKH.
A precedent for conducting such a comprehensive audit of forest royalties can be found in a 1999 audit of the
Reforestation Fund, which was commissioned by the Ministry of Finance as part of the Government’s Letter
of Intent (LoI) with the International Monetary Fund signed in January 1998 (Barr et al. 2011). This audit was
conducted by the international auditing firm Ernst & Young, and it examined the Government’s collection,
management, and losses from the Reforestation Fund during the five-year period FY1993/94–FY 1997/98 (Ernst
& Young 1999). The Ernst & Young audit documented state losses of US$ 5.2 billion, approximately 50 percent of
which came from under-collection of the DR while the remainder came from mismanagement after the DR funds
entered the state accounts.
On a separate point, it is notable that BPK-RI has not addressed the issues of state losses from uncollected PNBP
revenues and the significant deterioration of the underlying forest resource due to unreported timber production
in its annual audits of the Ministry of Environment and Forestry. These issues are not explained in KLHK financial
reports and Central Government Financial Reports (Laporan Keuangan Pemerintah Pusat, or LKPP) even though
such reports are the main mechanism for public accountability from the Minister of Environment and Forestry
and the Government. BPK-RI gave an unqualified opinion (Wajar Tanpa Pengecualian, or WTP) for 2011 and 2012
Financial Reports and WTP with explanation due to problems with the budgetary notes for 2013. BPK-RI reports
of audits of LKPP for the same years also failed to explain either losses of forestry PNBP, or deforestation and
forest degradation.
8.3 In principle, the SVLK Timber Legality Verification System represents an important step towards ensuring legality of timber and processed wood products, but the system’s effectiveness is limited by its focus on auditing administrative compliance with only limited verification in the field.
Over the past decade, the Government has taken a series of measures both on its own and in cooperation with
international organizations and other governments to curb illegal logging within the forest estate. Among the
most important of these measures has been the implementation of Indonesia’s Timber Legality Verification
System (Sistem Verifikasi Legalitas Kayu, or SVLK) . SVLK is an “operator-based licensing” approach to legality
certification, and it began implementation in September 2009 based on P.38/Menhut-II/2009. This regulation was
revised in 2011 as P.68/Menhut-II/2011. Since 2013, SVLK certification has become mandatory for all Indonesian
exporters of specified wood products.
The auditing procedure for SVLK is largely based on review of documentation to ensure that the company is in
possession of the correct license and planning documents. The procedure does include a field visit component,
but these visits are typically very brief, and always scheduled with the company well beforehand. There are no
provisions for surprise visits by the auditing agency, which forestry experts have indicated as a critical weakness.
P R E V E N T I N G S TAT E LO S S E S I N I N D O N E S I A’S F O R E S T RY S E C TO R84
Furthermore, companies that have already secured SVLK certification are also granted the right to self-approval
for three years.
In addition, consultations on SVLK began in 2003 at a time when, as this study points out, much of the timber
from natural forests entering the processing industries came from HPH selective logging concessions. SVLK was
understandably designed to audit and certify HPH operations. However, now the majority of timber from natural
forests is coming from land clearing sites, not selective logging areas. But the SVLK procedure has not adapted to
this shift, leaving loopholes that could potentially lead to SVLK certified processing operations sourcing timber
that has not been reported and/or from unlicensed areas. For example, a sawmill or pulp mill may receive SVLK
certification without the auditing agency making a field check to land-clearing areas where timber entering the
mill is sourced.
8.4 The Ministry of Environment and Forestry’s SI-PUHH online information system is an important step towards greater transparency in timber production and PNBP collection, but its current form does not achieve sufficient transparency for public accountability.
The SI-PUHH system is, in part, intended to increase transparency of timber production and PNBP collection. The
online database is linked from KLHK’s website, and it includes information for about 60% of timber production
from HPH concessions. The information includes the volumes listed in Timber Production Reports (Laporan Hasil
Penebangan, or LHP), along with the document number, as well as the corresponding DR and PSDH obligations
and payments (Surat Perintah Pembayaran and Surat Bukti Bayar). This is a strong foundation from which KLHK
can strengthen and widen the system.
By not including all sources of timber production – including from land clearing (which, according to reported
statistics, is supplying increasing amounts of natural forest timber relative to HPHs), plantation forests,
community forests, and Perum Perhutani – the SI-PUHH system is only recording around 10% of total timber
production even when all HPH production is included (not only the present 60%).
Also, the information from the LHP timber production reports displayed on SI-PUHH only includes realized
volumes. It does not include the realized area, which could be used for determining productivity. Nor does
SI-PUHH include planned production volumes or area, which is essential information to assess a company’s
performance relative to the plan approved by the government. For this, the SI-PUHH system should include full
copies of official inventory documents (IHMB), along with harvest and management planning documents (RKU
and RKT). Alongside this information, it could provide links to spatial data of concession locations, linked to
KLHK’s existing WebGIS system.
85
Chapter 9: Ineffective law enforcement in the forestry sector has facilitated the emergence of a ‘shadow economy’ in illegally harvested timber.The poor quality of law enforcement in Indonesia’s forestry sector, in combination with an ineffective timber
reporting system, has provided the conditions for a shadow economy in the trade of timber that has not been
reported to the state. Until now, law enforcement agencies have yet to formulate a comprehensive strategy to
tackle forestry sector crimes, and enforcement actions that have been taken frequently focus on inneffective
targets. Law enforcement of this kind, even when it is carried out, will never be capable of providing an adequate
deterrent to illegal activities in the forestry sector. Moreover, existing law enforcement institutions make effective
oversight impossible. The pervasive nature of corruption in forestry governance means that control and oversight
of the forestry sector has become increasingly weak.
9.1 Government law enforcement policies have yet to use economic approaches, including enforcement strategies for curbing tax evasion and other financial crimes, as the basis for tackling criminal activity in the forestry sector.
The significant disparity between the value of economic rents associated with legal and illegal timber provides
incentives for perpetrators of forestry crime to secure huge profits from the illegal timber market. Substantial
state losses occurred consistently throughout the 12-year study period, as explained in earlier sections, leading to
the conclusion that the organized trade and use of illegally harvested timber continues unabated. To overcome
these economically motivated crimes, conventional approaches to law enforcement in the timber sector, which
generally focus on catching perpetrators in the field, are inadequate. The cases of PT Asian Agri and Labora
Sitorus, for instance, reaffirmed the organized and systematic character of criminal activity related to commercial
forestry and plantation development and the powerful economic incentives involved in each. As these crimes
generate enormous proceeds, this economic motive makes the proceeds themselves the lifeblood of the crime.
Yet, the Government appears not to have a comprehensive strategy for law enforcement against forestry crimes
that targets large-scale corporate actors and white-collar criminals. For example, the National Medium-Term
Development Plan (RPJMN) for 2015–2019 makes no mention of specific strategies and directives for eradicating
organized forestry crime by targeting major perpetrators or by using a ‘follow the money’ approach in attempting
to recoup state losses. Law enforcement trends have changed very little over the past 12 years. Even since
the promulgation of Law No. 18/2013 on Eradication and Prevention of Forest Destruction, law enforcement
continues to target perpetrators in the field, and has even been applied against farmers working on land for
which they held the rights.
From a total of 48 cases examined, the highest numbers of those convicted under Law No. 18/2013 have been
farmers and drivers, with average sentences of 16 months imprisonment (see Table 9.1). Not one of these
convictions was linked with economic crime or used anti-money laundering laws to trace the proceeds of the
crimes. Consequently, law enforcement efforts have generally been applied only against small-scale perpetrators,
such as truck drivers and boat crews, while the ultimate beneficiaries of forestry crime are not held to account.
C H A P T E R 9: I N E F F E C T I V E L AW E N F O RC E M E N T I N T H E F O R E S T RY S E C TO R H A S FAC I L I TAT E D T H E E M E RG E N C E O F A ‘S H A D OW E CO N O M Y’ I N I L L E G A L LY H A RV E S T E D T I M B E R
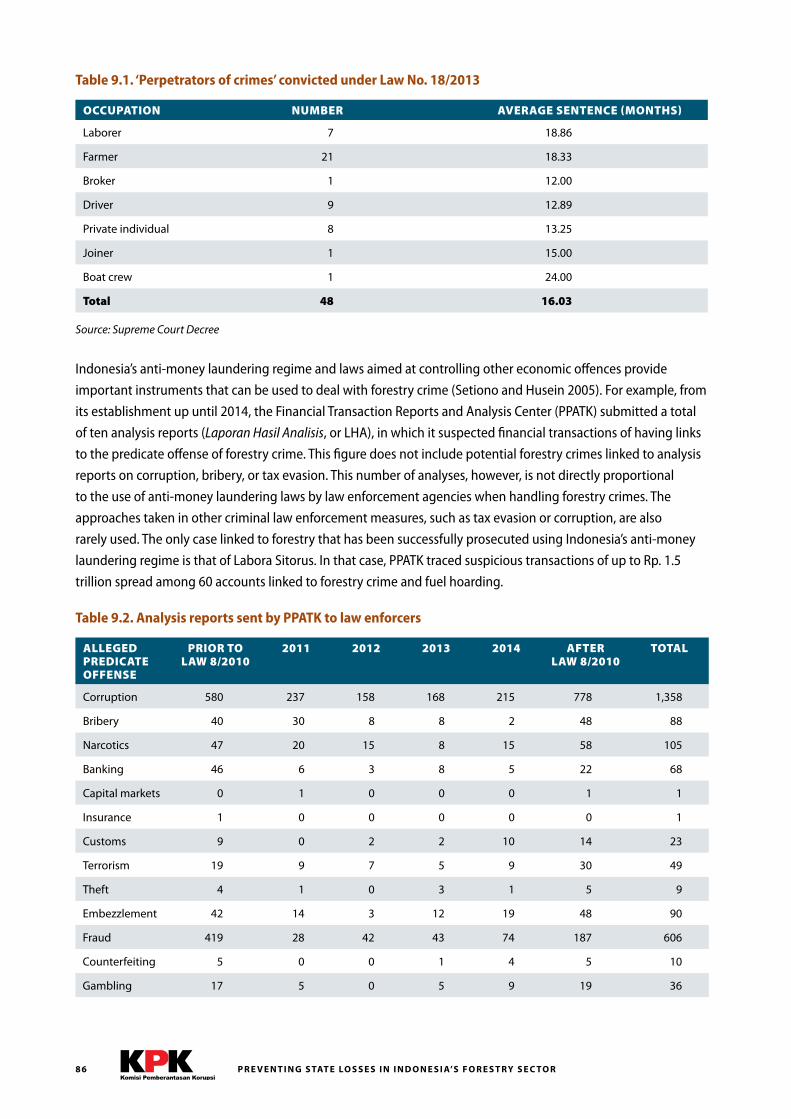
P R E V E N T I N G S TAT E LO S S E S I N I N D O N E S I A’S F O R E S T RY S E C TO R86
Table 9.1. ‘Perpetrators of crimes’ convicted under Law No. 18/2013
OCCUPATION NUMBER AVERAGE SENTENCE (MONTHS)
Laborer 7 18.86
Farmer 21 18.33
Broker 1 12.00
Driver 9 12.89
Private individual 8 13.25
Joiner 1 15.00
Boat crew 1 24.00
Total 48 16.03
Source: Supreme Court Decree
Indonesia’s anti-money laundering regime and laws aimed at controlling other economic offences provide
important instruments that can be used to deal with forestry crime (Setiono and Husein 2005). For example, from
its establishment up until 2014, the Financial Transaction Reports and Analysis Center (PPATK) submitted a total
of ten analysis reports (Laporan Hasil Analisis, or LHA), in which it suspected financial transactions of having links
to the predicate offense of forestry crime. This figure does not include potential forestry crimes linked to analysis
reports on corruption, bribery, or tax evasion. This number of analyses, however, is not directly proportional
to the use of anti-money laundering laws by law enforcement agencies when handling forestry crimes. The
approaches taken in other criminal law enforcement measures, such as tax evasion or corruption, are also
rarely used. The only case linked to forestry that has been successfully prosecuted using Indonesia’s anti-money
laundering regime is that of Labora Sitorus. In that case, PPATK traced suspicious transactions of up to Rp. 1.5
trillion spread among 60 accounts linked to forestry crime and fuel hoarding.
Table 9.2. Analysis reports sent by PPATK to law enforcers
ALLEGED PREDICATE OFFENSE
PRIOR TOLAW 8/2010
2011 2012 2013 2014 AFTERLAW 8/2010
TOTAL
Corruption 580 237 158 168 215 778 1,358
Bribery 40 30 8 8 2 48 88
Narcotics 47 20 15 8 15 58 105
Banking 46 6 3 8 5 22 68
Capital markets 0 1 0 0 0 1 1
Insurance 1 0 0 0 0 0 1
Customs 9 0 2 2 10 14 23
Terrorism 19 9 7 5 9 30 49
Theft 4 1 0 3 1 5 9
Embezzlement 42 14 3 12 19 48 90
Fraud 419 28 42 43 74 187 606
Counterfeiting 5 0 0 1 4 5 10
Gambling 17 5 0 5 9 19 36
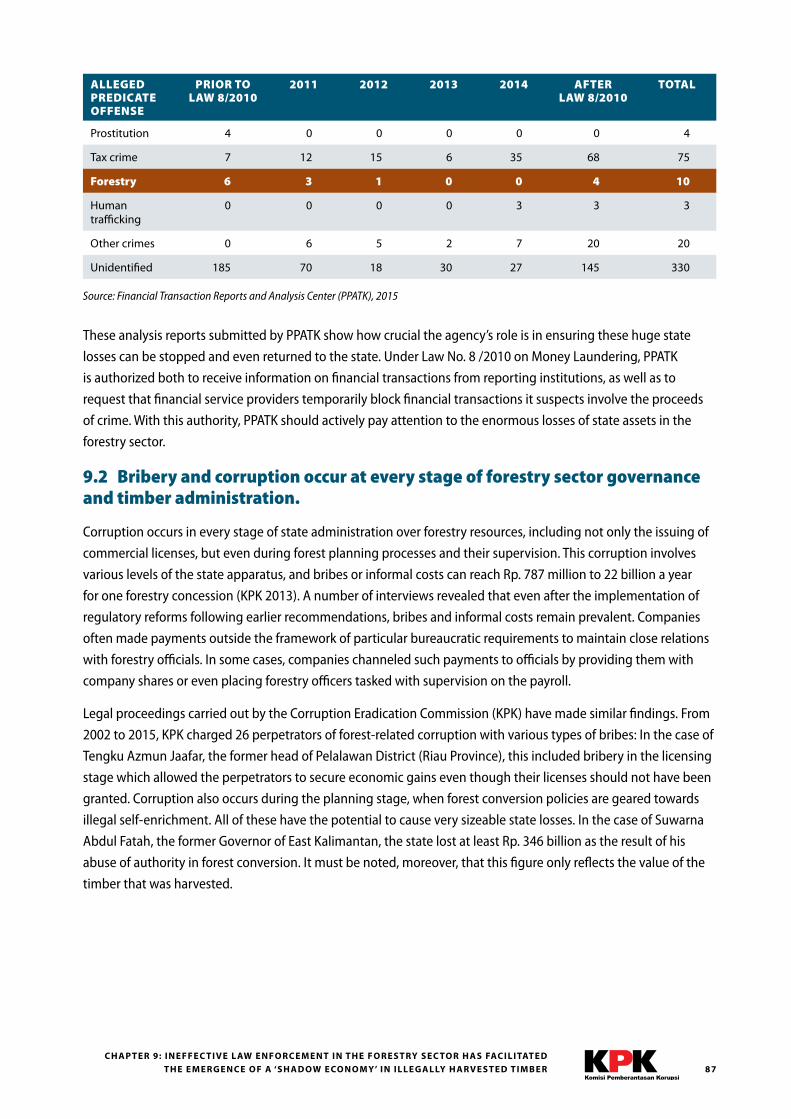
87C H A P T E R 9: I N E F F E C T I V E L AW E N F O RC E M E N T I N T H E F O R E S T RY S E C TO R H A S FAC I L I TAT E D
T H E E M E RG E N C E O F A ‘S H A D OW E CO N O M Y’ I N I L L E G A L LY H A RV E S T E D T I M B E R
ALLEGED PREDICATE OFFENSE
PRIOR TOLAW 8/2010
2011 2012 2013 2014 AFTERLAW 8/2010
TOTAL
Prostitution 4 0 0 0 0 0 4
Tax crime 7 12 15 6 35 68 75
Forestry 6 3 1 0 0 4 10
Human trafficking
0 0 0 0 3 3 3
Other crimes 0 6 5 2 7 20 20
Unidentified 185 70 18 30 27 145 330
Source: Financial Transaction Reports and Analysis Center (PPATK), 2015
These analysis reports submitted by PPATK show how crucial the agency’s role is in ensuring these huge state
losses can be stopped and even returned to the state. Under Law No. 8 /2010 on Money Laundering, PPATK
is authorized both to receive information on financial transactions from reporting institutions, as well as to
request that financial service providers temporarily block financial transactions it suspects involve the proceeds
of crime. With this authority, PPATK should actively pay attention to the enormous losses of state assets in the
forestry sector.
9.2 Bribery and corruption occur at every stage of forestry sector governance and timber administration.
Corruption occurs in every stage of state administration over forestry resources, including not only the issuing of
commercial licenses, but even during forest planning processes and their supervision. This corruption involves
various levels of the state apparatus, and bribes or informal costs can reach Rp. 787 million to 22 billion a year
for one forestry concession (KPK 2013). A number of interviews revealed that even after the implementation of
regulatory reforms following earlier recommendations, bribes and informal costs remain prevalent. Companies
often made payments outside the framework of particular bureaucratic requirements to maintain close relations
with forestry officials. In some cases, companies channeled such payments to officials by providing them with
company shares or even placing forestry officers tasked with supervision on the payroll.
Legal proceedings carried out by the Corruption Eradication Commission (KPK) have made similar findings. From
2002 to 2015, KPK charged 26 perpetrators of forest-related corruption with various types of bribes: In the case of
Tengku Azmun Jaafar, the former head of Pelalawan District (Riau Province), this included bribery in the licensing
stage which allowed the perpetrators to secure economic gains even though their licenses should not have been
granted. Corruption also occurs during the planning stage, when forest conversion policies are geared towards
illegal self-enrichment. All of these have the potential to cause very sizeable state losses. In the case of Suwarna
Abdul Fatah, the former Governor of East Kalimantan, the state lost at least Rp. 346 billion as the result of his
abuse of authority in forest conversion. It must be noted, moreover, that this figure only reflects the value of the
timber that was harvested.
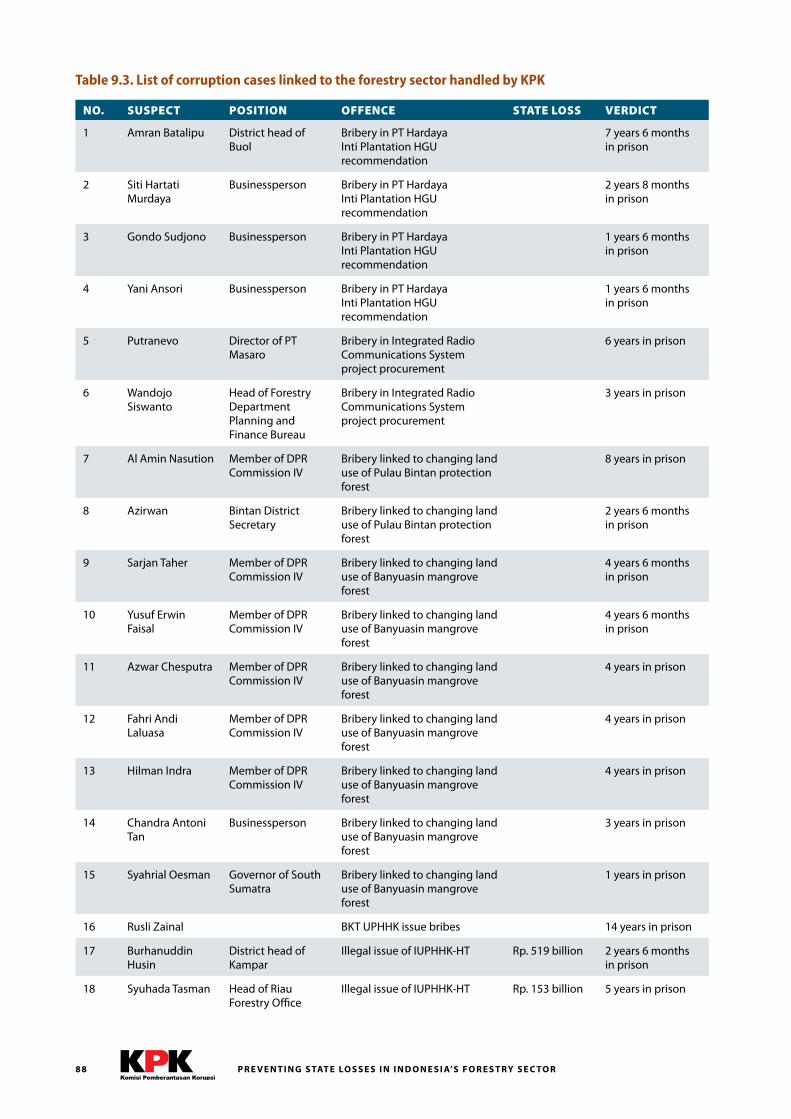
P R E V E N T I N G S TAT E LO S S E S I N I N D O N E S I A’S F O R E S T RY S E C TO R88
Table 9.3. List of corruption cases linked to the forestry sector handled by KPK
NO. SUSPECT POSITION OFFENCE STATE LOSS VERDICT
1 Amran Batalipu District head of Buol
Bribery in PT Hardaya Inti Plantation HGU recommendation
7 years 6 months in prison
2 Siti Hartati Murdaya
Businessperson Bribery in PT Hardaya Inti Plantation HGU recommendation
2 years 8 months in prison
3 Gondo Sudjono Businessperson Bribery in PT Hardaya Inti Plantation HGU recommendation
1 years 6 months in prison
4 Yani Ansori Businessperson Bribery in PT Hardaya Inti Plantation HGU recommendation
1 years 6 months in prison
5 Putranevo Director of PT Masaro
Bribery in Integrated Radio Communications System project procurement
6 years in prison
6 Wandojo Siswanto
Head of Forestry Department Planning and Finance Bureau
Bribery in Integrated Radio Communications System project procurement
3 years in prison
7 Al Amin Nasution Member of DPR Commission IV
Bribery linked to changing land use of Pulau Bintan protection forest
8 years in prison
8 Azirwan Bintan District Secretary
Bribery linked to changing land use of Pulau Bintan protection forest
2 years 6 months in prison
9 Sarjan Taher Member of DPR Commission IV
Bribery linked to changing land use of Banyuasin mangrove forest
4 years 6 months in prison
10 Yusuf Erwin Faisal
Member of DPR Commission IV
Bribery linked to changing land use of Banyuasin mangrove forest
4 years 6 months in prison
11 Azwar Chesputra Member of DPR Commission IV
Bribery linked to changing land use of Banyuasin mangrove forest
4 years in prison
12 Fahri Andi Laluasa
Member of DPR Commission IV
Bribery linked to changing land use of Banyuasin mangrove forest
4 years in prison
13 Hilman Indra Member of DPR Commission IV
Bribery linked to changing land use of Banyuasin mangrove forest
4 years in prison
14 Chandra Antoni Tan
Businessperson Bribery linked to changing land use of Banyuasin mangrove forest
3 years in prison
15 Syahrial Oesman Governor of South Sumatra
Bribery linked to changing land use of Banyuasin mangrove forest
1 years in prison
16 Rusli Zainal BKT UPHHK issue bribes 14 years in prison
17 Burhanuddin Husin
District head of Kampar
Illegal issue of IUPHHK-HT Rp. 519 billion 2 years 6 months in prison
18 Syuhada Tasman Head of Riau Forestry Office
Illegal issue of IUPHHK-HT Rp. 153 billion 5 years in prison
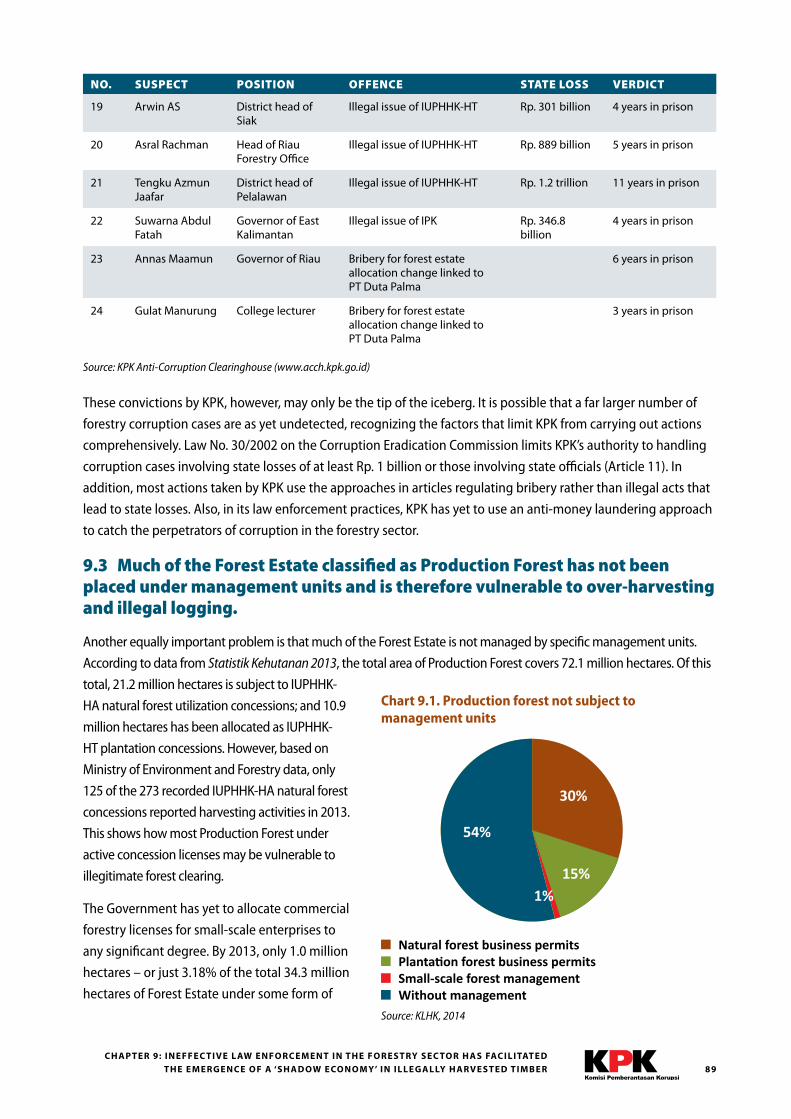
89C H A P T E R 9: I N E F F E C T I V E L AW E N F O RC E M E N T I N T H E F O R E S T RY S E C TO R H A S FAC I L I TAT E D
T H E E M E RG E N C E O F A ‘S H A D OW E CO N O M Y’ I N I L L E G A L LY H A RV E S T E D T I M B E R
NO. SUSPECT POSITION OFFENCE STATE LOSS VERDICT
19 Arwin AS District head of Siak
Illegal issue of IUPHHK-HT Rp. 301 billion 4 years in prison
20 Asral Rachman Head of Riau Forestry Office
Illegal issue of IUPHHK-HT Rp. 889 billion 5 years in prison
21 Tengku Azmun Jaafar
District head of Pelalawan
Illegal issue of IUPHHK-HT Rp. 1.2 trillion 11 years in prison
22 Suwarna Abdul Fatah
Governor of East Kalimantan
Illegal issue of IPK Rp. 346.8 billion
4 years in prison
23 Annas Maamun Governor of Riau Bribery for forest estate allocation change linked to PT Duta Palma
6 years in prison
24 Gulat Manurung College lecturer Bribery for forest estate allocation change linked to PT Duta Palma
3 years in prison
Source: KPK Anti-Corruption Clearinghouse (www .acch .kpk .go .id)
These convictions by KPK, however, may only be the tip of the iceberg. It is possible that a far larger number of
forestry corruption cases are as yet undetected, recognizing the factors that limit KPK from carrying out actions
comprehensively. Law No. 30/2002 on the Corruption Eradication Commission limits KPK’s authority to handling
corruption cases involving state losses of at least Rp. 1 billion or those involving state officials (Article 11). In
addition, most actions taken by KPK use the approaches in articles regulating bribery rather than illegal acts that
lead to state losses. Also, in its law enforcement practices, KPK has yet to use an anti-money laundering approach
to catch the perpetrators of corruption in the forestry sector.
9.3 Much of the Forest Estate classified as Production Forest has not been placed under management units and is therefore vulnerable to over-harvesting and illegal logging.
Another equally important problem is that much of the Forest Estate is not managed by specific management units.
According to data from Statistik Kehutanan 2013, the total area of Production Forest covers 72.1 million hectares. Of this
total, 21.2 million hectares is subject to IUPHHK-
HA natural forest utilization concessions; and 10.9
million hectares has been allocated as IUPHHK-
HT plantation concessions. However, based on
Ministry of Environment and Forestry data, only
125 of the 273 recorded IUPHHK-HA natural forest
concessions reported harvesting activities in 2013.
This shows how most Production Forest under
active concession licenses may be vulnerable to
illegitimate forest clearing.
The Government has yet to allocate commercial
forestry licenses for small-scale enterprises to
any significant degree. By 2013, only 1.0 million
hectares – or just 3.18% of the total 34.3 million
hectares of Forest Estate under some form of
Source: KLHK, 2014
Natural forest business permitsPlantation forest business permitsSmall-scale forest managementWithout management
Chart 9.1. Production forest not subject to management units
30%
54%
15%1%
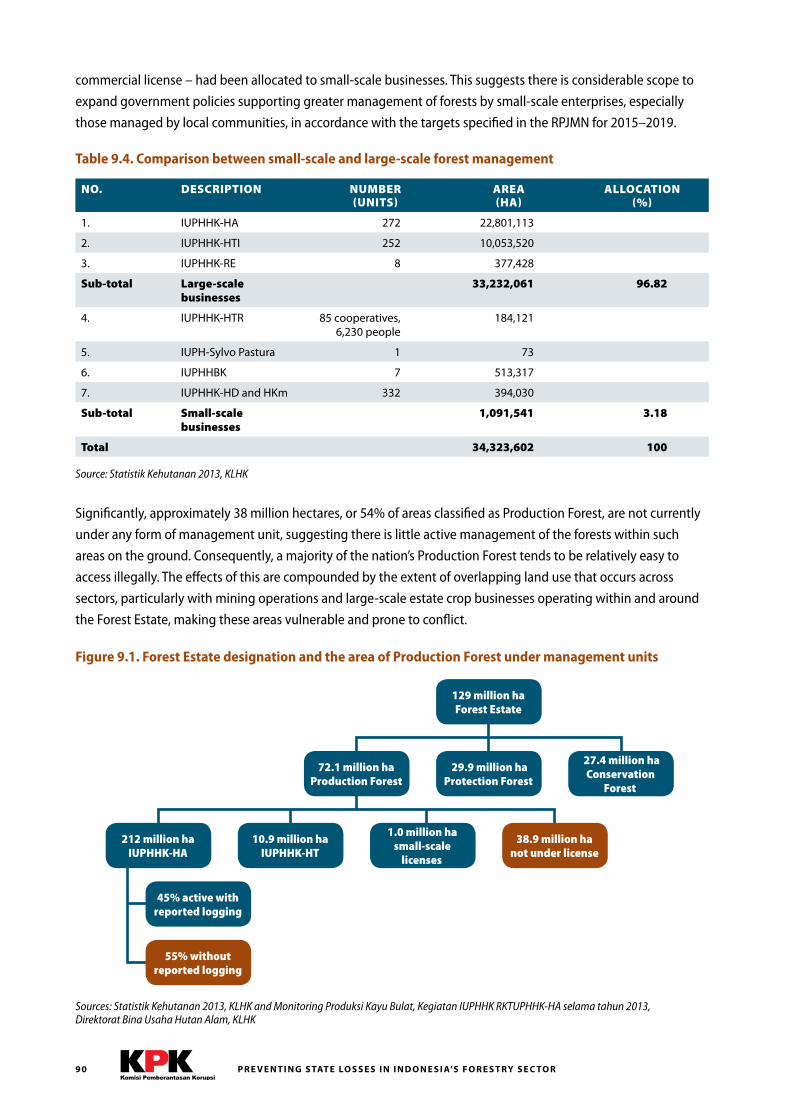
P R E V E N T I N G S TAT E LO S S E S I N I N D O N E S I A’S F O R E S T RY S E C TO R90
commercial license – had been allocated to small-scale businesses. This suggests there is considerable scope to
expand government policies supporting greater management of forests by small-scale enterprises, especially
those managed by local communities, in accordance with the targets specified in the RPJMN for 2015–2019.
Table 9.4. Comparison between small-scale and large-scale forest management
NO. DESCRIPTION NUMBER (UNITS)
AREA (HA)
ALLOCATION (%)
1. IUPHHK-HA 272 22,801,113
2. IUPHHK-HTI 252 10,053,520
3. IUPHHK-RE 8 377,428
Sub-total Large-scale businesses
33,232,061 96.82
4. IUPHHK-HTR 85 cooperatives, 6,230 people
184,121
5. IUPH-Sylvo Pastura 1 73
6. IUPHHBK 7 513,317
7. IUPHHK-HD and HKm 332 394,030
Sub-total Small-scale businesses
1,091,541 3.18
Total 34,323,602 100
Source: Statistik Kehutanan 2013, KLHK
Significantly, approximately 38 million hectares, or 54% of areas classified as Production Forest, are not currently
under any form of management unit, suggesting there is little active management of the forests within such
areas on the ground. Consequently, a majority of the nation’s Production Forest tends to be relatively easy to
access illegally. The effects of this are compounded by the extent of overlapping land use that occurs across
sectors, particularly with mining operations and large-scale estate crop businesses operating within and around
the Forest Estate, making these areas vulnerable and prone to conflict.
129 million ha Forest Estate
72.1 million ha Production Forest
29.9 million ha Protection Forest
27.4 million ha Conservation
Forest
212 million ha IUPHHK-HA
10.9 million ha IUPHHK-HT
1.0 million ha small-scale
licenses
38.9 million ha not under license
45% active with reported logging
55% without reported logging
Figure 9.1. Forest Estate designation and the area of Production Forest under management units
Sources: Statistik Kehutanan 2013, KLHK and Monitoring Produksi Kayu Bulat, Kegiatan IUPHHK RKTUPHHK-HA selama tahun 2013, Direktorat Bina Usaha Hutan Alam, KLHK
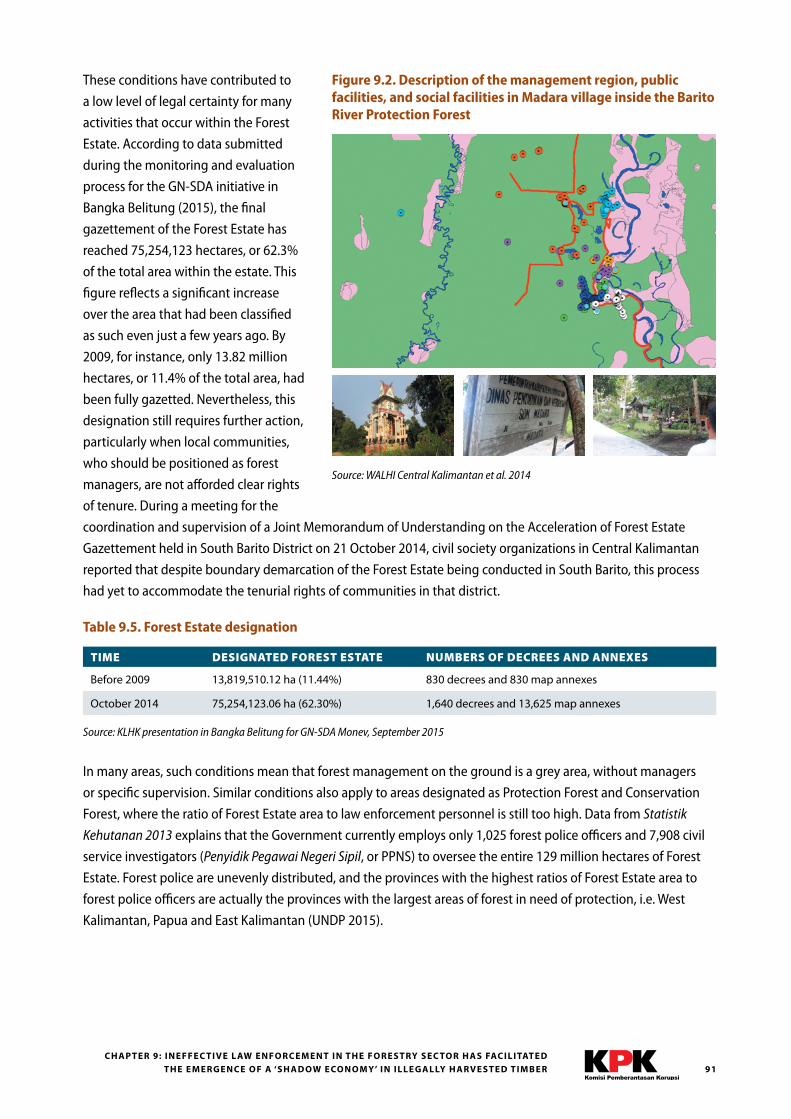
91C H A P T E R 9: I N E F F E C T I V E L AW E N F O RC E M E N T I N T H E F O R E S T RY S E C TO R H A S FAC I L I TAT E D
T H E E M E RG E N C E O F A ‘S H A D OW E CO N O M Y’ I N I L L E G A L LY H A RV E S T E D T I M B E R
These conditions have contributed to
a low level of legal certainty for many
activities that occur within the Forest
Estate. According to data submitted
during the monitoring and evaluation
process for the GN-SDA initiative in
Bangka Belitung (2015), the final
gazettement of the Forest Estate has
reached 75,254,123 hectares, or 62.3%
of the total area within the estate. This
figure reflects a significant increase
over the area that had been classified
as such even just a few years ago. By
2009, for instance, only 13.82 million
hectares, or 11.4% of the total area, had
been fully gazetted. Nevertheless, this
designation still requires further action,
particularly when local communities,
who should be positioned as forest
managers, are not afforded clear rights
of tenure. During a meeting for the
coordination and supervision of a Joint Memorandum of Understanding on the Acceleration of Forest Estate
Gazettement held in South Barito District on 21 October 2014, civil society organizations in Central Kalimantan
reported that despite boundary demarcation of the Forest Estate being conducted in South Barito, this process
had yet to accommodate the tenurial rights of communities in that district.
Table 9.5. Forest Estate designation
TIME DESIGNATED FOREST ESTATE NUMBERS OF DECREES AND ANNEXES
Before 2009 13,819,510.12 ha (11.44%) 830 decrees and 830 map annexes
October 2014 75,254,123.06 ha (62.30%) 1,640 decrees and 13,625 map annexes
Source: KLHK presentation in Bangka Belitung for GN-SDA Monev, September 2015
In many areas, such conditions mean that forest management on the ground is a grey area, without managers
or specific supervision. Similar conditions also apply to areas designated as Protection Forest and Conservation
Forest, where the ratio of Forest Estate area to law enforcement personnel is still too high. Data from Statistik
Kehutanan 2013 explains that the Government currently employs only 1,025 forest police officers and 7,908 civil
service investigators (Penyidik Pegawai Negeri Sipil, or PPNS) to oversee the entire 129 million hectares of Forest
Estate. Forest police are unevenly distributed, and the provinces with the highest ratios of Forest Estate area to
forest police officers are actually the provinces with the largest areas of forest in need of protection, i.e. West
Kalimantan, Papua and East Kalimantan (UNDP 2015).
Source: WALHI Central Kalimantan et al . 2014
Figure 9.2. Description of the management region, public facilities, and social facilities in Madara village inside the Barito River Protection Forest
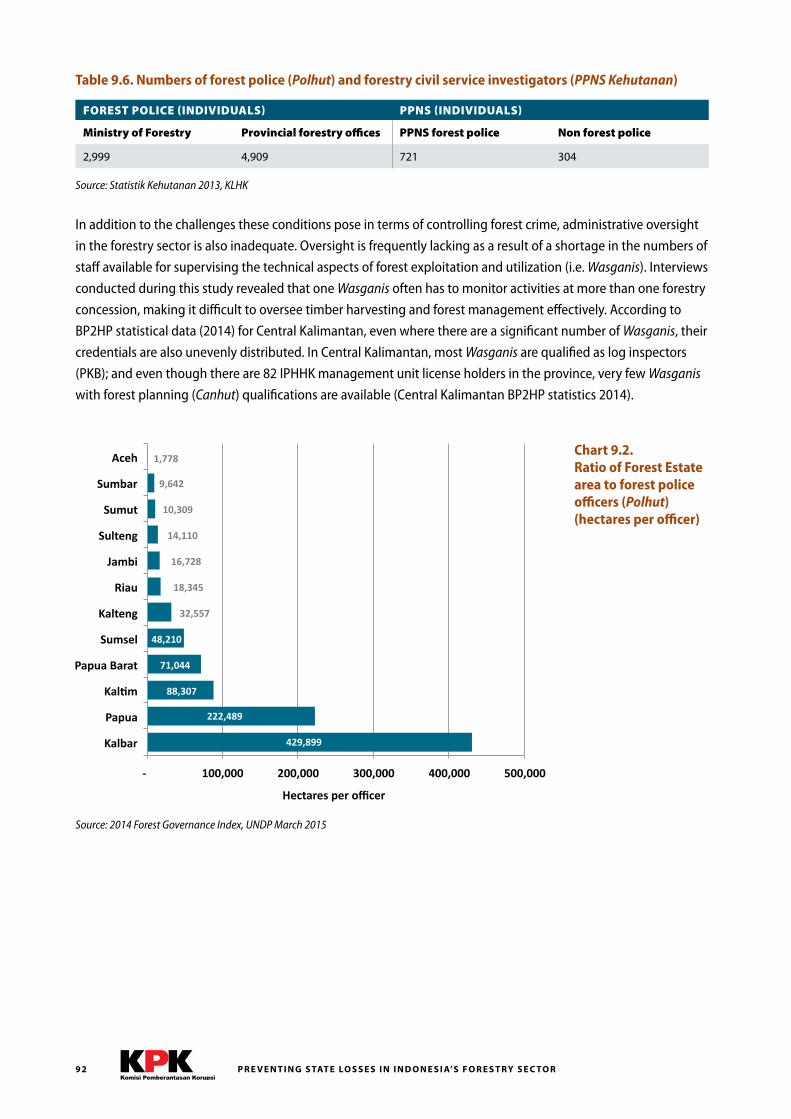
P R E V E N T I N G S TAT E LO S S E S I N I N D O N E S I A’S F O R E S T RY S E C TO R92
Table 9.6. Numbers of forest police (Polhut) and forestry civil service investigators (PPNS Kehutanan)
FOREST POLICE (INDIVIDUALS) PPNS (INDIVIDUALS)
Ministry of Forestry Provincial forestry offices PPNS forest police Non forest police
2,999 4,909 721 304
Source: Statistik Kehutanan 2013, KLHK
In addition to the challenges these conditions pose in terms of controlling forest crime, administrative oversight
in the forestry sector is also inadequate. Oversight is frequently lacking as a result of a shortage in the numbers of
staff available for supervising the technical aspects of forest exploitation and utilization (i.e. Wasganis). Interviews
conducted during this study revealed that one Wasganis often has to monitor activities at more than one forestry
concession, making it difficult to oversee timber harvesting and forest management effectively. According to
BP2HP statistical data (2014) for Central Kalimantan, even where there are a significant number of Wasganis, their
credentials are also unevenly distributed. In Central Kalimantan, most Wasganis are qualified as log inspectors
(PKB); and even though there are 82 IPHHK management unit license holders in the province, very few Wasganis
with forest planning (Canhut) qualifications are available (Central Kalimantan BP2HP statistics 2014).
429,899
222,489
88,307
71,044
48,210
32,557
18,345
16,728
14,110
10,309
9,642
1,778
-‐ 100,000 200,000 300,000 400,000 500,000
Kalbar
Papua
Kal6m
Papua Barat
Sumsel
Kalteng
Riau
Jambi
Sulteng
Sumut
Sumbar
Aceh Chart 9.2. Ratio of Forest Estate area to forest police officers (Polhut) (hectares per officer)
Source: 2014 Forest Governance Index, UNDP March 2015
Hectares per officer
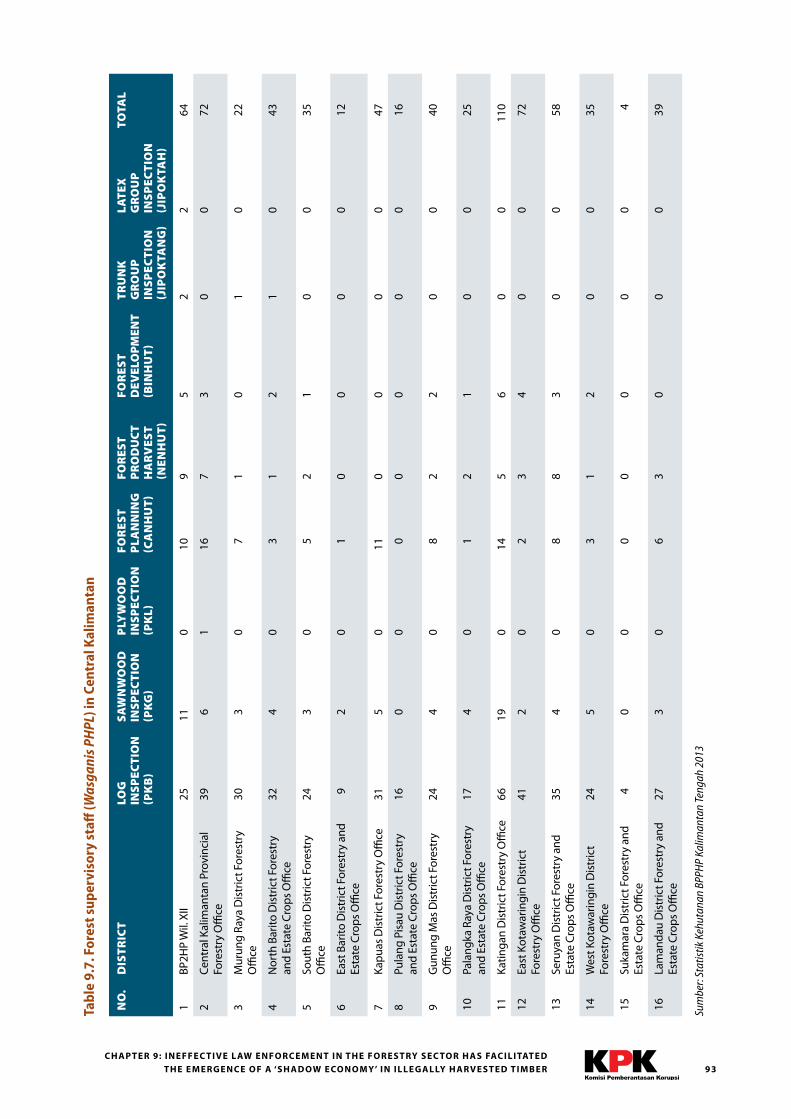
93C H A P T E R 9: I N E F F E C T I V E L AW E N F O RC E M E N T I N T H E F O R E S T RY S E C TO R H A S FAC I L I TAT E D
T H E E M E RG E N C E O F A ‘S H A D OW E CO N O M Y’ I N I L L E G A L LY H A RV E S T E D T I M B E R
Tabl
e 9.
7. F
ores
t sup
ervi
sory
sta
ff (W
asga
nis P
HPL
) in
Cent
ral K
alim
anta
n
NO
.D
IST
RIC
TLO
G
INSP
ECT
ION
(P
KB
)
SAW
NW
OO
D
INSP
ECT
ION
(P
KG
)
PLY
WO
OD
IN
SPEC
TIO
N
(PK
L)
FOR
EST
P
LAN
NIN
G
(CA
NH
UT
)
FOR
EST
P
RO
DU
CT
H
AR
VES
T
(NEN
HU
T)
FOR
EST
D
EVEL
OP
MEN
T
(BIN
HU
T)
TR
UN
K
GR
OU
P
INS
PEC
TIO
N
(JIP
OK
TAN
G)
LAT
EX
GR
OU
P
INS
PEC
TIO
N
(JIP
OK
TAH
)
TOTA
L
1BP
2HP
Wil.
XII
2511
010
95
22
64
2Ce
ntra
l Kal
iman
tan
Prov
inci
al
Fore
stry
Offi
ce39
61
167
30
072
3M
urun
g Ra
ya D
istr
ict F
ores
try
Offi
ce30
30
71
01
022
4N
orth
Bar
ito D
istr
ict F
ores
try
and
Esta
te C
rops
Offi
ce32
40
31
21
043
5So
uth
Barit
o D
istr
ict F
ores
try
Offi
ce24
30
52
10
035
6Ea
st B
arito
Dis
tric
t For
estr
y an
d Es
tate
Cro
ps O
ffice
92
01
00
00
12
7Ka
puas
Dis
tric
t For
estr
y O
ffice
315
011
00
00
47
8Pu
lang
Pis
au D
istr
ict F
ores
try
and
Esta
te C
rops
Offi
ce16
00
00
00
016
9G
unun
g M
as D
istr
ict F
ores
try
Offi
ce24
40
82
20
040
10Pa
lang
ka R
aya
Dis
tric
t For
estr
y an
d Es
tate
Cro
ps O
ffice
174
01
21
00
25
11Ka
tinga
n D
istr
ict F
ores
try
Offi
ce66
190
145
60
011
0
12Ea
st K
otaw
arin
gin
Dis
tric
t Fo
rest
ry O
ffice
412
02
34
00
72
13Se
ruya
n D
istr
ict F
ores
try
and
Esta
te C
rops
Offi
ce35
40
88
30
058
14W
est K
otaw
arin
gin
Dis
tric
t Fo
rest
ry O
ffice
245
03
12
00
35
15Su
kam
ara
Dis
tric
t For
estr
y an
d Es
tate
Cro
ps O
ffice
40
00
00
00
4
16La
man
dau
Dis
tric
t For
estr
y an
d Es
tate
Cro
ps O
ffice
273
06
30
00
39
Sum
ber:
Stat
istik
Keh
utan
an B
PPH
P Ka
liman
tan
Teng
ah 2
013
P R E V E N T I N G S TAT E LO S S E S I N I N D O N E S I A’S F O R E S T RY S E C TO R94
Chapter 10: Indonesia’s forest royalty rates are set at levels that facilitate only limited capture of economic rents by the Government and provide implicit incentives for unsustainable forest management.The exploitation of natural resources often generates economic rent, defined as “supra-normal profits” or
economic returns above and beyond “normal” profits. Forest economic rent can be especially high when
primary forest is logged, according to Karsenty (2010), “since this type of forest yields the benefit of centuries of
biomass accumulation which will not be reconstituted under the common 25–40 years felling cycle enforced in
managed forests in tropical countries.” Economic rent can also be generated through land clearing in areas of
degraded forest if producers’ input costs are sufficiently low and/or market prices for any timber harvested are
sufficiently high.
Under most forest fiscal systems, a central objective of timber royalties, levies, and fees is to facilitate capture
of economic rents by governments, which would otherwise go to the timber producers. In countries such
as Indonesia, where forests are administered by the state, the government’s capture of forest rents serves
two important purposes. First, it secures economic value from the forest resource that can be used by public
institutions, presumably for the benefit of the country’s citizens. In cases where governments fail to capture forest
rents, much of the value of forest products is lost and benefits only a handful of people.
Second, the capture of forest rents by governments serves as an important deterrent to over-harvesting and
other unsustainable management practices (Repetto and Gillis 1998). When timber companies are able to
obtain rents from their logging operations, these supra-normal profits often encourage them to extract as much
value from the forests they manage as quickly as possible, regardless of the longer term impacts on the forest
resource. In theory, governments can deter such short-term management practices by setting royalty rates at
levels that allow the concession-holder to earn normal profits (typically assumed to be based on a 25% return on
investment) without accessing rents.1
10.1 Historically, Indonesia’s forest royalty system has been irrational, and allowed forest concession holders to capture significant economic rents.
During the 1980s and 1990s, numerous economic analyses of Indonesia’s forestry sector documented high levels
of economic rent being generated by commercial logging under the country’s HPH timber concession system
(Kartodihardjo 1999; Brown 1999; Scotland 1997; Ahmad and Ramli 1991; Gillis 1988; Ruzicka 1979). At that time,
most concession-holders were still carrying out first rotation harvesting of primary forest and earning supra-
normal profits through selective logging of large-diameter Meranti and other high-value timber. These studies
found that the Government’s concession fees and timber royalties – including the DR and the Forest Product Fee
(Iuran Hasil Hutan, or IHH), the precursor to the PSDH – were set at rates that allowed the state to capture only a
1 This assumes minimal transaction costs. If this assumption is considered, then bribery/extortion causes barriers to raising forestry royalty rates as explained below.
95
C H A P T E R 10: I N D O N E S I A’S F O R E S T ROYA LT Y R AT E S H AV E B E E N S E T AT L E V E L S T H AT FAC I L I TAT E O N LY L I M I T E D C A P T U R E O F E CO N O M I C R E N TS BY T H E G OV E R N M E N T A N D
P ROV I D E I M P L I C I T I N C E N T I V E S F O R U N S U S TA I N A B L E F O R E S T M A N AG E M E N T
small portion of the rents being generated. In effect, the Government’s forest fiscal system during this period was
designed to facilitate the transfer of economic rents from the nation’s forest estate to private timber concession-
holders, many of which were closely connected to political elites.
This report does not analyze the economic costs or profitability of commercial timber production in Indonesia
during the study period, and therefore, does not provide quantitative estimates of the economic rents that
may have been generated. However, two major trends within the sector suggest that forestry companies
have continued to capture economic rents, at least over the short-term. First, as many HPH concessions have
approached the end of their initial 35-year rotation period, commercial logging companies have had a strong
economic incentive to ignore guidelines for sustainable forest management and, instead, to harvest the
remaining timber in whatever way is most profitable. The low levels of oversight by state forestry agencies and
wide opportunities for corruption suggest that many forest license holders have routinely harvested volumes
above those approved in their annual work plans and/or logged outside their approved cutting blocks. In
this way, because timber production costs have increased as access to high-value, large-diameter timber has
declined, many concession holders have sought to maintain their access to economic rents by over-harvesting
and evading royalty payments.
Second, the sharp increase in forest land clearing as a source of commercial wood production has allowed
forestry companies to capture sizeable economic rents. The unit costs of harvesting timber through land
clearing are substantially lower than they are for selective logging of timber under Indonesia’s HPH concession
regulations. On the one hand, land clearing is by definition a short-term activity and does not require long-
term investments in infrastructure or sustainable concession management. On the other hand, companies
holding land-clearing licenses are permitted to harvest the entire standing stock, as opposed to logging
selectively. With DR and PSDH rates set well below the stumpage value of the timber, land-clearing companies
can generate very high levels of profit, especially when they clear areas with a standing stock of 100 m3/ha
or more.
10.2 In nominal terms, DR rates have changed little since the late 1990s, and their value in real terms and as a percentage of market prices has declined significantly.
Since it was introduced in 1990, the Reforestation Fund, or Dana Reboisasi, has been structured as a volume-
based levy with rates differentiated according to species, size class, and the region where the timber is harvested.
DR rates are supposed to be adjusted periodically based on market conditions and other variables. In theory,
this structure should allow the Government to set DR rates at optimal levels that facilitate state collection of
economic rents (or some targeted portion of these) without harming commercial logging companies by cutting
into their “normal profits”. Because the DR is differentiated according to species, size class, and region of harvest,
rates can in principle be set at levels that are highly attuned to frequent changes in harvesting and transport
costs (industry inputs) and the prices of logs in either domestic or international timber markets.
In practice, the Government has not used the adjustment of DR rates as an effective fiscal tool. In nominal terms,
DR rates have changed very little since the late 1990s (see Table 10.1). Yet between 1998 and 2014, domestic
market prices for timber have more than tripled, according to data from the ITTO, so as a percentage of market
price, DR rates have decreased (see Chart 10.1). At US$ 13–16 per m3, for example, the DR rate for Meranti was
equivalent to approximately 25% of the domestic market price when the fee was originally set in 1998. That fee
has not changed in the last 17 years (except for a 3% increase in 2014 for logs over 50 cm), and in 2015 the DR fee
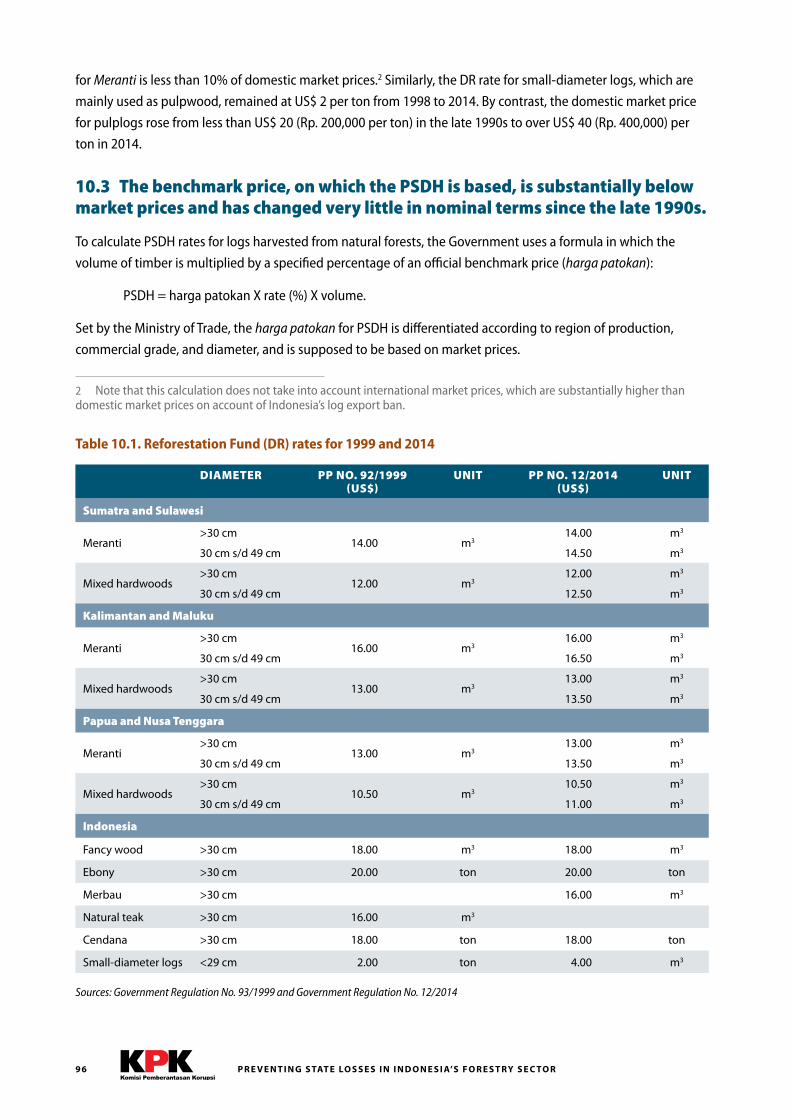
P R E V E N T I N G S TAT E LO S S E S I N I N D O N E S I A’S F O R E S T RY S E C TO R96
DIAMETER PP NO. 92/1999 (US$)
UNIT PP NO. 12/2014 (US$)
UNIT
Sumatra and Sulawesi
Meranti >30 cm
14.00 m314.00 m3
30 cm s/d 49 cm 14.50 m3
Mixed hardwoods>30 cm
12.00 m312.00 m3
30 cm s/d 49 cm 12.50 m3
Kalimantan and Maluku
Meranti >30 cm
16.00 m316.00 m3
30 cm s/d 49 cm 16.50 m3
Mixed hardwoods>30 cm
13.00 m313.00 m3
30 cm s/d 49 cm 13.50 m3
Papua and Nusa Tenggara
Meranti >30 cm
13.00 m313.00 m3
30 cm s/d 49 cm 13.50 m3
Mixed hardwoods>30 cm
10.50 m310.50 m3
30 cm s/d 49 cm 11.00 m3
Indonesia
Fancy wood >30 cm 18.00 m3 18.00 m3
Ebony >30 cm 20.00 ton 20.00 ton
Merbau >30 cm 16.00 m3
Natural teak >30 cm 16.00 m3
Cendana >30 cm 18.00 ton 18.00 ton
Small-diameter logs <29 cm 2.00 ton 4.00 m3
Sources: Government Regulation No . 93/1999 and Government Regulation No . 12/2014
for Meranti is less than 10% of domestic market prices.2 Similarly, the DR rate for small-diameter logs, which are
mainly used as pulpwood, remained at US$ 2 per ton from 1998 to 2014. By contrast, the domestic market price
for pulplogs rose from less than US$ 20 (Rp. 200,000 per ton) in the late 1990s to over US$ 40 (Rp. 400,000) per
ton in 2014.
10.3 The benchmark price, on which the PSDH is based, is substantially below market prices and has changed very little in nominal terms since the late 1990s.
To calculate PSDH rates for logs harvested from natural forests, the Government uses a formula in which the
volume of timber is multiplied by a specified percentage of an official benchmark price (harga patokan):
PSDH = harga patokan X rate (%) X volume.
Set by the Ministry of Trade, the harga patokan for PSDH is differentiated according to region of production,
commercial grade, and diameter, and is supposed to be based on market prices.
2 Note that this calculation does not take into account international market prices, which are substantially higher than domestic market prices on account of Indonesia’s log export ban.
Table 10.1. Reforestation Fund (DR) rates for 1999 and 2014
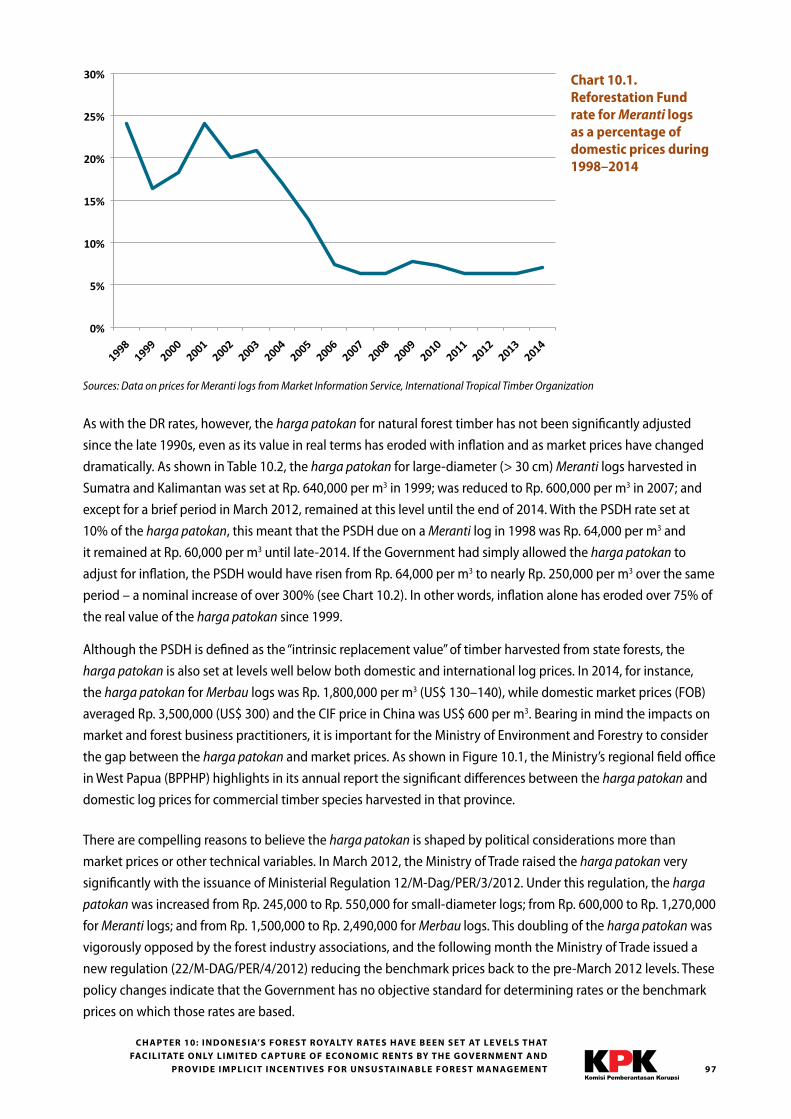
97
C H A P T E R 10: I N D O N E S I A’S F O R E S T ROYA LT Y R AT E S H AV E B E E N S E T AT L E V E L S T H AT FAC I L I TAT E O N LY L I M I T E D C A P T U R E O F E CO N O M I C R E N TS BY T H E G OV E R N M E N T A N D
P ROV I D E I M P L I C I T I N C E N T I V E S F O R U N S U S TA I N A B L E F O R E S T M A N AG E M E N T
0%
5%
10%
15%
20%
25%
30%
1998
1999
2000
2001
2002
2003
2004
2005
2006
2007
2008
2009
2010
2011
2012
2013
2014
Prosentase Tarif Dana Reboisasi dari Harga Meran?
Chart 10.1. Reforestation Fund rate for Meranti logs as a percentage of domestic prices during 1998–2014
As with the DR rates, however, the harga patokan for natural forest timber has not been significantly adjusted
since the late 1990s, even as its value in real terms has eroded with inflation and as market prices have changed
dramatically. As shown in Table 10.2, the harga patokan for large-diameter (> 30 cm) Meranti logs harvested in
Sumatra and Kalimantan was set at Rp. 640,000 per m3 in 1999; was reduced to Rp. 600,000 per m3 in 2007; and
except for a brief period in March 2012, remained at this level until the end of 2014. With the PSDH rate set at
10% of the harga patokan, this meant that the PSDH due on a Meranti log in 1998 was Rp. 64,000 per m3 and
it remained at Rp. 60,000 per m3 until late-2014. If the Government had simply allowed the harga patokan to
adjust for inflation, the PSDH would have risen from Rp. 64,000 per m3 to nearly Rp. 250,000 per m3 over the same
period – a nominal increase of over 300% (see Chart 10.2). In other words, inflation alone has eroded over 75% of
the real value of the harga patokan since 1999.
Although the PSDH is defined as the “intrinsic replacement value” of timber harvested from state forests, the
harga patokan is also set at levels well below both domestic and international log prices. In 2014, for instance,
the harga patokan for Merbau logs was Rp. 1,800,000 per m3 (US$ 130–140), while domestic market prices (FOB)
averaged Rp. 3,500,000 (US$ 300) and the CIF price in China was US$ 600 per m3. Bearing in mind the impacts on
market and forest business practitioners, it is important for the Ministry of Environment and Forestry to consider
the gap between the harga patokan and market prices. As shown in Figure 10.1, the Ministry’s regional field office
in West Papua (BPPHP) highlights in its annual report the significant differences between the harga patokan and
domestic log prices for commercial timber species harvested in that province.
There are compelling reasons to believe the harga patokan is shaped by political considerations more than
market prices or other technical variables. In March 2012, the Ministry of Trade raised the harga patokan very
significantly with the issuance of Ministerial Regulation 12/M-Dag/PER/3/2012. Under this regulation, the harga
patokan was increased from Rp. 245,000 to Rp. 550,000 for small-diameter logs; from Rp. 600,000 to Rp. 1,270,000
for Meranti logs; and from Rp. 1,500,000 to Rp. 2,490,000 for Merbau logs. This doubling of the harga patokan was
vigorously opposed by the forest industry associations, and the following month the Ministry of Trade issued a
new regulation (22/M-DAG/PER/4/2012) reducing the benchmark prices back to the pre-March 2012 levels. These
policy changes indicate that the Government has no objective standard for determining rates or the benchmark
prices on which those rates are based.
Sources: Data on prices for Meranti logs from Market Information Service, International Tropical Timber Organization
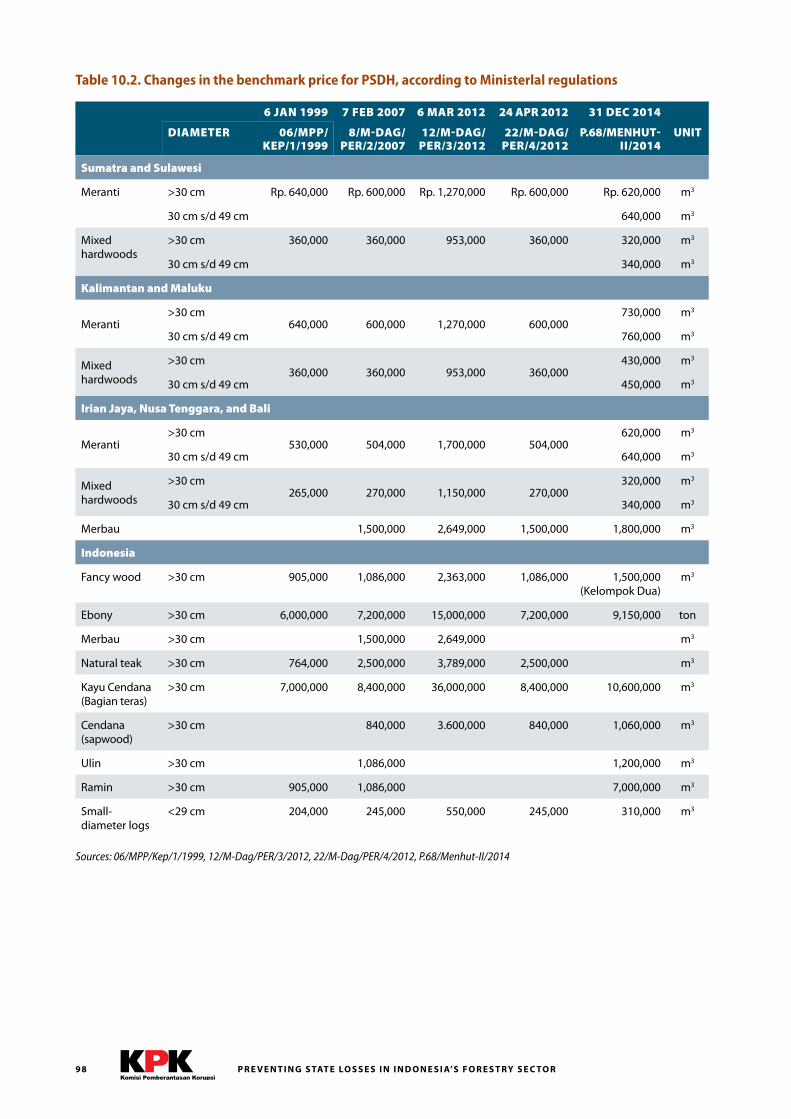
P R E V E N T I N G S TAT E LO S S E S I N I N D O N E S I A’S F O R E S T RY S E C TO R98
6 JAN 1999 7 FEB 2007 6 MAR 2012 24 APR 2012 31 DEC 2014
DIAMETER 06/MPP/KEP/1/1999
8/M-DAG/PER/2/2007
12/M-DAG/PER/3/2012
22/M-DAG/PER/4/2012
P.68/MENHUT-II/2014
UNIT
Sumatra and Sulawesi
Meranti >30 cm Rp. 640,000 Rp. 600,000 Rp. 1,270,000 Rp. 600,000 Rp. 620,000 m3
30 cm s/d 49 cm 640,000 m3
Mixed hardwoods
>30 cm 360,000 360,000 953,000 360,000 320,000 m3
30 cm s/d 49 cm 340,000 m3
Kalimantan and Maluku
Meranti >30 cm
640,000 600,000 1,270,000 600,000730,000 m3
30 cm s/d 49 cm 760,000 m3
Mixed hardwoods
>30 cm360,000 360,000 953,000 360,000
430,000 m3
30 cm s/d 49 cm 450,000 m3
Irian Jaya, Nusa Tenggara, and Bali
Meranti >30 cm
530,000 504,000 1,700,000 504,000620,000 m3
30 cm s/d 49 cm 640,000 m3
Mixed hardwoods
>30 cm265,000 270,000 1,150,000 270,000
320,000 m3
30 cm s/d 49 cm 340,000 m3
Merbau 1,500,000 2,649,000 1,500,000 1,800,000 m3
Indonesia
Fancy wood >30 cm 905,000 1,086,000 2,363,000 1,086,000 1,500,000 (Kelompok Dua)
m3
Ebony >30 cm 6,000,000 7,200,000 15,000,000 7,200,000 9,150,000 ton
Merbau >30 cm 1,500,000 2,649,000 m3
Natural teak >30 cm 764,000 2,500,000 3,789,000 2,500,000 m3
Kayu Cendana (Bagian teras)
>30 cm 7,000,000 8,400,000 36,000,000 8,400,000 10,600,000 m3
Cendana (sapwood)
>30 cm 840,000 3.600,000 840,000 1,060,000 m3
Ulin >30 cm 1,086,000 1,200,000 m3
Ramin >30 cm 905,000 1,086,000 7,000,000 m3
Small-diameter logs
<29 cm 204,000 245,000 550,000 245,000 310,000 m3
Table 10.2. Changes in the benchmark price for PSDH, according to Ministerlal regulations
Sources: 06/MPP/Kep/1/1999, 12/M-Dag/PER/3/2012, 22/M-Dag/PER/4/2012, P .68/Menhut-II/2014
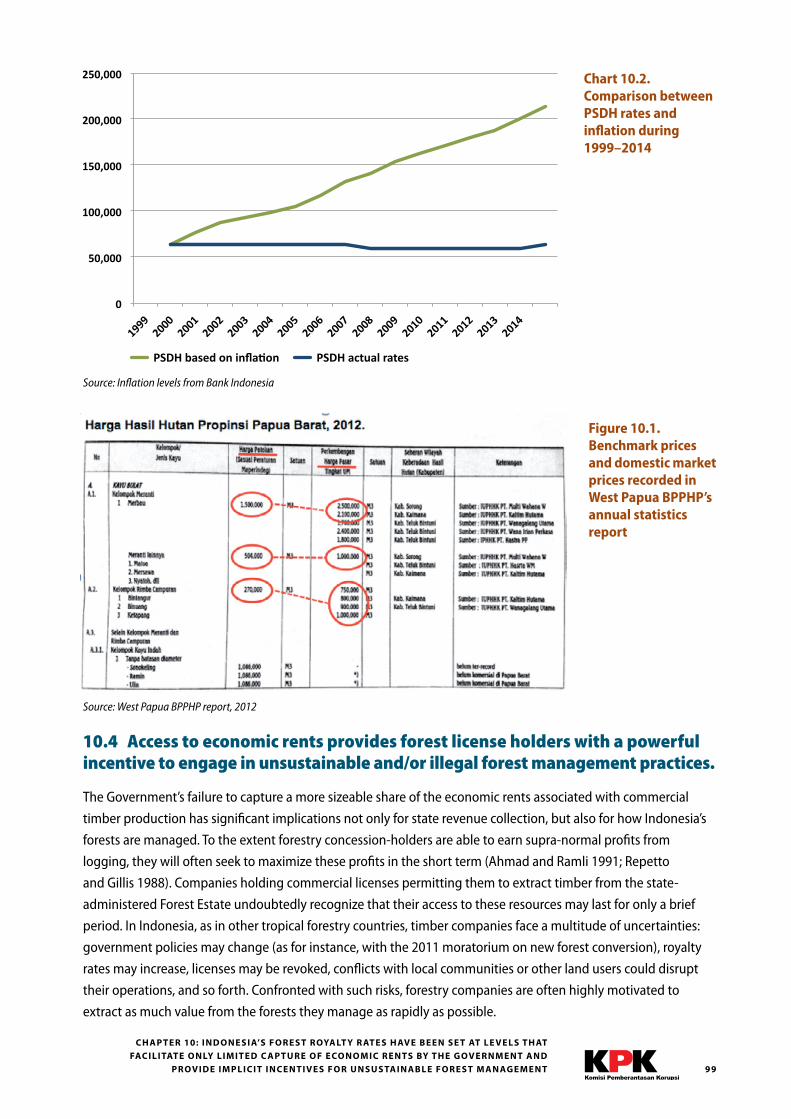
99
C H A P T E R 10: I N D O N E S I A’S F O R E S T ROYA LT Y R AT E S H AV E B E E N S E T AT L E V E L S T H AT FAC I L I TAT E O N LY L I M I T E D C A P T U R E O F E CO N O M I C R E N TS BY T H E G OV E R N M E N T A N D
P ROV I D E I M P L I C I T I N C E N T I V E S F O R U N S U S TA I N A B L E F O R E S T M A N AG E M E N T
0
50,000
100,000
150,000
200,000
250,000
1999
2000
2001
2002
2003
2004
2005
2006
2007
2008
2009
2010
2011
2012
2013
2014
PSDH berbasis inflasi PSDH yang sebenarnya
Chart 10.2. Comparison between PSDH rates and inflation during 1999–2014
Source: Inflation levels from Bank Indonesia
Figure 10.1. Benchmark prices and domestic market prices recorded in West Papua BPPHP’s annual statistics report
Source: West Papua BPPHP report, 2012
10.4 Access to economic rents provides forest license holders with a powerful incentive to engage in unsustainable and/or illegal forest management practices.
The Government’s failure to capture a more sizeable share of the economic rents associated with commercial
timber production has significant implications not only for state revenue collection, but also for how Indonesia’s
forests are managed. To the extent forestry concession-holders are able to earn supra-normal profits from
logging, they will often seek to maximize these profits in the short term (Ahmad and Ramli 1991; Repetto
and Gillis 1988). Companies holding commercial licenses permitting them to extract timber from the state-
administered Forest Estate undoubtedly recognize that their access to these resources may last for only a brief
period. In Indonesia, as in other tropical forestry countries, timber companies face a multitude of uncertainties:
government policies may change (as for instance, with the 2011 moratorium on new forest conversion), royalty
rates may increase, licenses may be revoked, conflicts with local communities or other land users could disrupt
their operations, and so forth. Confronted with such risks, forestry companies are often highly motivated to
extract as much value from the forests they manage as rapidly as possible.
PSDH based on inflation PSDH actual rates
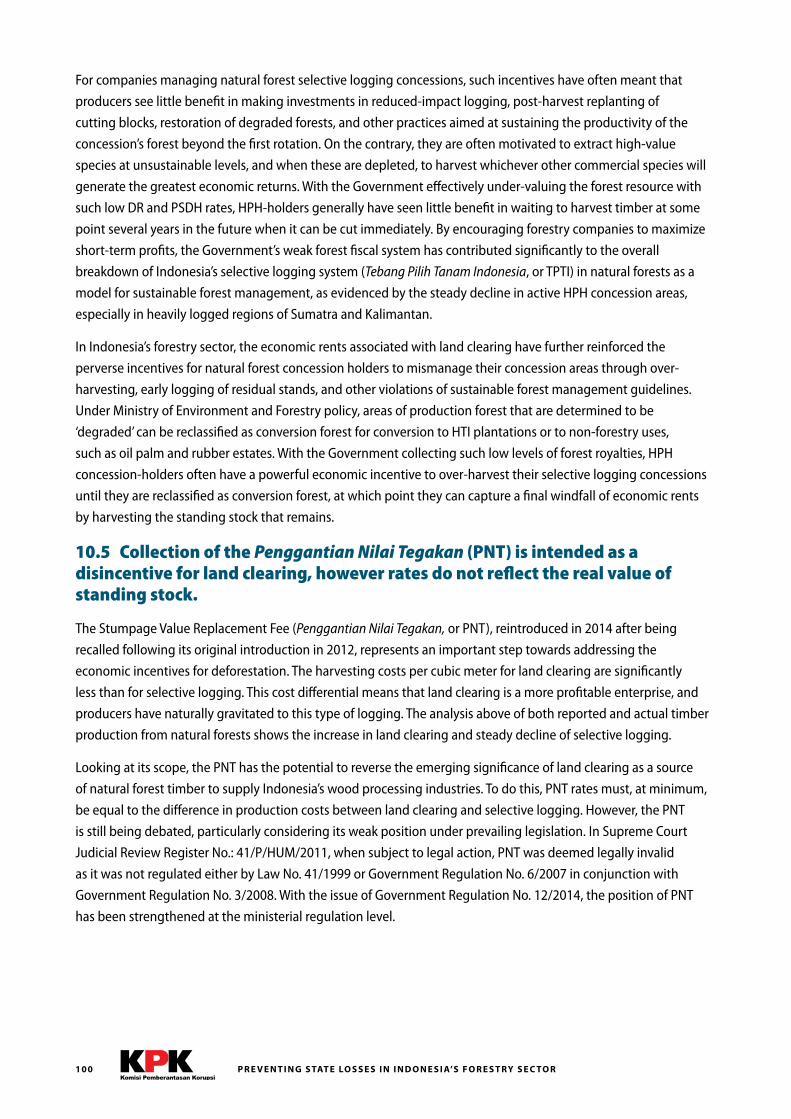
P R E V E N T I N G S TAT E LO S S E S I N I N D O N E S I A’S F O R E S T RY S E C TO R100
For companies managing natural forest selective logging concessions, such incentives have often meant that
producers see little benefit in making investments in reduced-impact logging, post-harvest replanting of
cutting blocks, restoration of degraded forests, and other practices aimed at sustaining the productivity of the
concession’s forest beyond the first rotation. On the contrary, they are often motivated to extract high-value
species at unsustainable levels, and when these are depleted, to harvest whichever other commercial species will
generate the greatest economic returns. With the Government effectively under-valuing the forest resource with
such low DR and PSDH rates, HPH-holders generally have seen little benefit in waiting to harvest timber at some
point several years in the future when it can be cut immediately. By encouraging forestry companies to maximize
short-term profits, the Government’s weak forest fiscal system has contributed significantly to the overall
breakdown of Indonesia’s selective logging system (Tebang Pilih Tanam Indonesia, or TPTI) in natural forests as a
model for sustainable forest management, as evidenced by the steady decline in active HPH concession areas,
especially in heavily logged regions of Sumatra and Kalimantan.
In Indonesia’s forestry sector, the economic rents associated with land clearing have further reinforced the
perverse incentives for natural forest concession holders to mismanage their concession areas through over-
harvesting, early logging of residual stands, and other violations of sustainable forest management guidelines.
Under Ministry of Environment and Forestry policy, areas of production forest that are determined to be
‘degraded’ can be reclassified as conversion forest for conversion to HTI plantations or to non-forestry uses,
such as oil palm and rubber estates. With the Government collecting such low levels of forest royalties, HPH
concession-holders often have a powerful economic incentive to over-harvest their selective logging concessions
until they are reclassified as conversion forest, at which point they can capture a final windfall of economic rents
by harvesting the standing stock that remains.
10.5 Collection of the Penggantian Nilai Tegakan (PNT) is intended as a disincentive for land clearing, however rates do not reflect the real value of standing stock.
The Stumpage Value Replacement Fee (Penggantian Nilai Tegakan, or PNT), reintroduced in 2014 after being
recalled following its original introduction in 2012, represents an important step towards addressing the
economic incentives for deforestation. The harvesting costs per cubic meter for land clearing are significantly
less than for selective logging. This cost differential means that land clearing is a more profitable enterprise, and
producers have naturally gravitated to this type of logging. The analysis above of both reported and actual timber
production from natural forests shows the increase in land clearing and steady decline of selective logging.
Looking at its scope, the PNT has the potential to reverse the emerging significance of land clearing as a source
of natural forest timber to supply Indonesia’s wood processing industries. To do this, PNT rates must, at minimum,
be equal to the difference in production costs between land clearing and selective logging. However, the PNT
is still being debated, particularly considering its weak position under prevailing legislation. In Supreme Court
Judicial Review Register No.: 41/P/HUM/2011, when subject to legal action, PNT was deemed legally invalid
as it was not regulated either by Law No. 41/1999 or Government Regulation No. 6/2007 in conjunction with
Government Regulation No. 3/2008. With the issue of Government Regulation No. 12/2014, the position of PNT
has been strengthened at the ministerial regulation level.
101C H A P T E R 11: T I M B E R P RO D U C T I O N A D M I N I S T R AT I O N A N D N O N - TAX R E V E N U E CO L L E C T I O N
I N T H E F O R E S T RY S E C TO R A R E N OT D I R E C T E D AT T H E B ROA D E R P U B L I C I N T E R E S T
Chapter 11: Timber production administration and non-tax revenue collection in the forestry sector are not directed at the broader public interest.The weaknesses explained in the last five chapters show that the PNBP collection and timber administration
systems suffer from poor data management, lack of internal controls, weak external accountability, insufficient
law enforcement, and outdated rates. Taken together, these weaknesses mitigate the benefits to the country of
timber production while doing little to protect against the negative impacts.
In Indonesia, natural forests are a precious resource because they are a source of subsistence and livelihoods
for tens of millions of people living in and around the Forest Estate. Indonesia’s natural forest also has intrinsic
environmental value, both in terms of biodiversity and carbon storage. So when the Government decides to
harvest this resource and convert forested areas for other land uses, it should be a deliberate decision that
weighs the cost of depleting the resource with the benefits that the country and its citizens can gain from
doing so.
The Government of Indonesia could pursue various policy objectives through its timber production
administration and non-tax revenue collection systems such as: achieving revenue targets set by policymakers;
ensuring livelihood sources for communities in forested regions; preparing supplies of timber to the country’s
wood-processing industries; and/or limiting deforestation and environmental damage. Once its policy objectives
are defined through planning processes that consider all the tradeoffs and determine priorities that suit the
public interest, then the Government’s timber production administration and PNBP collection systems can
become the tools used to achieve those objectives.
But these systems, as they currently function, are not sharp and effective tools for achieving the objectives
set by policymakers. As the previous chapter describes, the current system persists from a time when it was
intentionally designed to ensure rent capture by private interests connected with the ruling elite. The civil
servants tasked with implementing the systems struggle to make them work, but this has been largely a losing
battle both from the perspective of revenue collection and sustainable forest management. That is, revenue
collection is much lower than it should be while the forest resource is quickly being depleted.
PNBP targets are set in an opaque process with little to no input from the Ministry of Finance and other
institutions outside the Ministry of Environment and Forests, and these targets are disconnected from the
decisions made about timber production. The current system relies on province and district level forestry offices
(Dinas Kehutanan) approving annual logging plans submitted by companies. Though KLHK receives copies
of these plans, they provide no coordinating function to ensure that such logging plans, in aggregate, help
Indonesia achieve policy objectives. And even though KLHK reviews the ten-year logging plans for each forestry
concession-holder, this study found no evidence to suggest that even this review at the central government
level is done in respect to achieving non-tax revenue, timber production, or environmental targets. Rather, this
review is conducted within the Directorate General of Production Forestry (BUK, now renamed PHPL) without
much involvement from the Directorate General of Forest Planology. The end result is that Indonesia’s timber
P R E V E N T I N G S TAT E LO S S E S I N I N D O N E S I A’S F O R E S T RY S E C TO R102
production system is de facto controlled by companies, and the Government has very limited ability to harness
this natural resource for the benefit of the country and its people.
The low levels of collection efficiency described in Chapter 3 indicate a poorly functioning system, but they also
point to a huge opportunity. If previously it was assumed that increasing PNBP collection had to come at the cost
of more rapid forest destruction, these results demonstrate that in fact there is tremendous scope to increase
PNBP collection and at the same time decrease forest destruction. Such a positive-sum solution is an achievable
goal, not a far-fetched dream, but it does require acute awareness of the current systems’ weaknesses by all
institutions involved and an appreciation of how they impact the way timber production translates into benefits
for the country and people of Indonesia.
103
Section III: Towards an accountable and efficient timber administration and non-tax revenue collection system
P R E V E N T I N G S TAT E LO S S E S I N I N D O N E S I A’S F O R E S T RY S E C TO R104
Chapter 12: Roadmap for fixing the systemWithin the context of the National Movement to Save Indonesia’s Natural Resources (Gerakan Nasional
Penyelamatan Sumber Daya Alam, or GN-SDA), KPK will be working together with the Ministry of Environment
and Forestry, the Ministry of Finance, the Supreme Audit Agency (BPK-RI), the Financial Transaction Reports and
Analysis Center (PPATK), regional governments and other institutions to address the weaknesses identified by
this study. The findings are a starting point for establishing a more concerted focus on harnessing the economic
benefits of Indonesia’s forestry sector to support a more just and prosperous society.
For this to happen, the institutions tasked with managing Indonesia’s forests, ensuring government revenue
collection, providing accountability, and enforcing forest and financial laws must commit to addressing the
significant weaknesses demonstrated in this study. With this study, KPK calls on the Government to examine the
study’s findings and to decide on the concrete steps it will take.
As the first step, the Ministry of Environment and Forestry, the Ministry of Finance, the Supreme Audit Agency,
and PPATK will be required to submit action plans that address the study’s findings and aim to improve timber
production administration and PNBP revenue collection systems in the forestry sector. Within the GN-SDA
framework, civil society organizations can become part of this improved implementation by providing responses
to this study, and monitoring its implementation. These action plans are expected to be prepared within 30 days
from the date of this study’s release. As the next step, KPK will then coordinate review of all the action plans and
consider CSO responses and, based on the results of that review process, facilitate discussions with officials of the
respective institutions to revise and refine the action plans. The deadline for agreeing on revised action plans will
be 90 days from this study’s presentation. Following a signing ceremony shortly following that date, the action
plans will immediately enter the implementation phase.
KPK recommends that at minimum these action plans include:
12.1 A comprehensive audit of non-tax forest revenues conducted by BPK-RI
This study provides quantitative estimates of state losses from unreported timber production and under-
collection of PNBP during 2003–2014. These results indicate that the loss of state assets from Indonesia’s forestry
sector has occurred on a scale that requires a comprehensive audit by Indonesia’s Supreme Audit Agency (BPK-
RI). This audit should include a thorough analysis of the Government’s PNBP collection system in the forestry
sector and should seek to determine how much revenue should be collected under the current forest fiscal
system. This audit will serve as the basis for subsequent actions to strengthen the Government’s PNBP forest
revenue collection system and to prevent future losses of state assets from the forestry sector. KPK will coordinate
with BPK to determine the scope, methodology, and timetable for this audit.
12.2 All timber production from state-administered forests reported on KLHK’s online and publicly-accessible SI-PUHH system, including official inventory, planning, production, non-tax revenue payment, and mill timber consumption reports
This study documents significant issues in management of data for timber production and PNBP collection.
The SI-PUHH system hosted on KLHK’s website is a positive step for greater transparency and accountability.
At present, however, it only includes production and PNBP data from some HPH selective logging concession-
105C H A P T E R 12: ROA D M A P F O R F I X I N G T H E S YS T E M
holders, and none from other sources of production such as land clearing. Therefore, it is imperative that the
SI-PUHH online system include all timber production in Indonesia, both from natural forests (HPH concessions
and land clearing by IPK license holders), as well as plantation forests (HTI plantations, Perum Perhutani, and
Hutan Rakyat).
This study also shows inconsistencies between production data in the SI-PUHH system and KLHK’s internal
timber production monitoring reports. To ensure that these inconsistencies do not persist, KLHK must upload
the official production reports, PNBP payment obligations (Surat Perintah Pembayaran), and proof of PNBP
payment (Surat Bukti Bayar). Furthermore, the SI-PUHH system must also include the inventory (IHMB, ITSP) and
planning documents (RKU and RKT) for every forestry company. Only then will KLHK and other institutions such
as the Ministry of Finance, as well as the general public, be able to verify the truthfulness of production reports
and accuracy of PNBP payments. This upgrade of the SI-PUHH system will be a critical tool for transparency,
accountability, and performance enhancement in Indonesia’s forestry sector.
12.3 Spatial monitoring tools used to verify forest inventory for all land-clearing areas prior to forest land-clearing
This study indicates that the majority of unreported timber production, and the source of largest state loss,
comes from land-clearing sites, mainly for oil palm and rubber estates, pulpwood concessions, and mining areas.
It also documents that inventory and production reports rely on company self-reporting and the system of
verification depends on field checks by local forestry officials. These systems are highly vulnerable to corruption
and fraud, resulting in widespread under-reporting of production and under-collection of PNBP.
Spatial monitoring tools that use satellite data should be used to address these problems. The Government of
Indonesia already has existing resources that should be incorporated into the solution. The National Aeronautics
and Space Agency (Lembaga Penerbangan dan Antariksa Nasional, or LAPAN) collects satellite data, and KLHK’s
Directorate General of Forest Planology already analyzes this data for environmental and forest planning
purposes. Now this spatial monitoring data must be used to assess standing stock on land-clearing sites before
it is harvested, and that information must be used to verify that companies’ post-harvest production reports are
accurate and PNBP obligations are met.
12.4 Enhanced law enforcement actions, including use of anti money laundering laws, against all actors identified to be under-reporting timber production and/or evading payments of forest royalties
This study indicates that unreported timber production is happening on a massive scale. Stronger law
enforcement measures can provide a deterrent that changes this condition. Forestry companies and their owners
must be held responsible for over-harvesting, under-reporting, and/or harvesting outside designated concession
and work plan areas. Until now, law enforcement measures have largely focused on small-scale timber producers,
while large timber operations harvest with impunity. This study also estimates the market value of unreported
timber production, which represents the potential value of assets stolen from the state. Together with KPK
and other law enforcement agencies, PPATK must pursue the proceeds from the sale of these stolen assets,
empowered by Indonesia’s anti-money laundering law which lists forestry crime as a predicate offense. Such
actions should also encourage banks and other financial institutions to conduct enhanced due diligence and
monitoring of suspicious transactions to ensure they are not involved in laundering money associated with illegal
forestry activities.
P R E V E N T I N G S TAT E LO S S E S I N I N D O N E S I A’S F O R E S T RY S E C TO R106
12.5 In-depth review of the structure and rates of royalty fees to determine how the Government will increase collection efficiency and capture full economic rent on timber production
DR and PSDH rates have barely changed since the late 1990s, during which time their real value has dropped
relative to inflation and the market price of timber. Without a non-political mechanism to adjust rates on a
routine basis, the Government cannot use the DR and PSDH – and other forms of forest royalties, including the
PNT – effectively as fiscal tools to capture economic rent. KLHK and the Ministry of Finance must perform a
detailed review of the current rates and formulate a mechanism for adjusting these rates according to production
costs and market prices. This mechanism should aim to be free of political interference, which has hampered the
effective implementation of the current mechanism for setting PNBP rates in the forestry sector.
This in-depth review should also consider whether the current system of determining PNBP obligations based
on post-harvest production reporting is effective, or whether other ways to calculate royalty fees may be easier
to implement. For example, this review should consider whether an area-based fee tied to standing stock and
payable prior to harvesting may be a more efficient way to collect PNBP from land-clearing areas.
12.6 Routine coordination between KLHK and the Ministry of Finance to plan forestry non-tax revenue targets based on empirical assessments of actual timber production levels
This study highlights that the Ministry of Finance exercises only very limited external oversight of KLHK’s
collection of PNBP in the forestry sector and its efforts are generally limited to reconciling PNBP receipts after
they enter Government accounts. The Ministry of Finance must collaborate with KLHK and other relevant
agencies to develop a mechanism to set PNBP collection targets based on the amounts that should be collected
in relation to actual (reported and unreported) timber production levels. KPK will support these efforts by
coordinating an inter-agency team to analyze state losses from unreported timber production and uncollected
PNBP in the forestry sector for subsequent years following this initial study. Ultimately, efforts to reform the
PNBP collection and timber administration systems will be judged by the metrics included in these reports:
PNBP collection efficiency; Government economic rent capture; sustainably-sourced raw materials for wood
processing industries and community-based enterprises; and the rate at which Indonesia’s natural forests are lost
to deforestation and forest degradation.
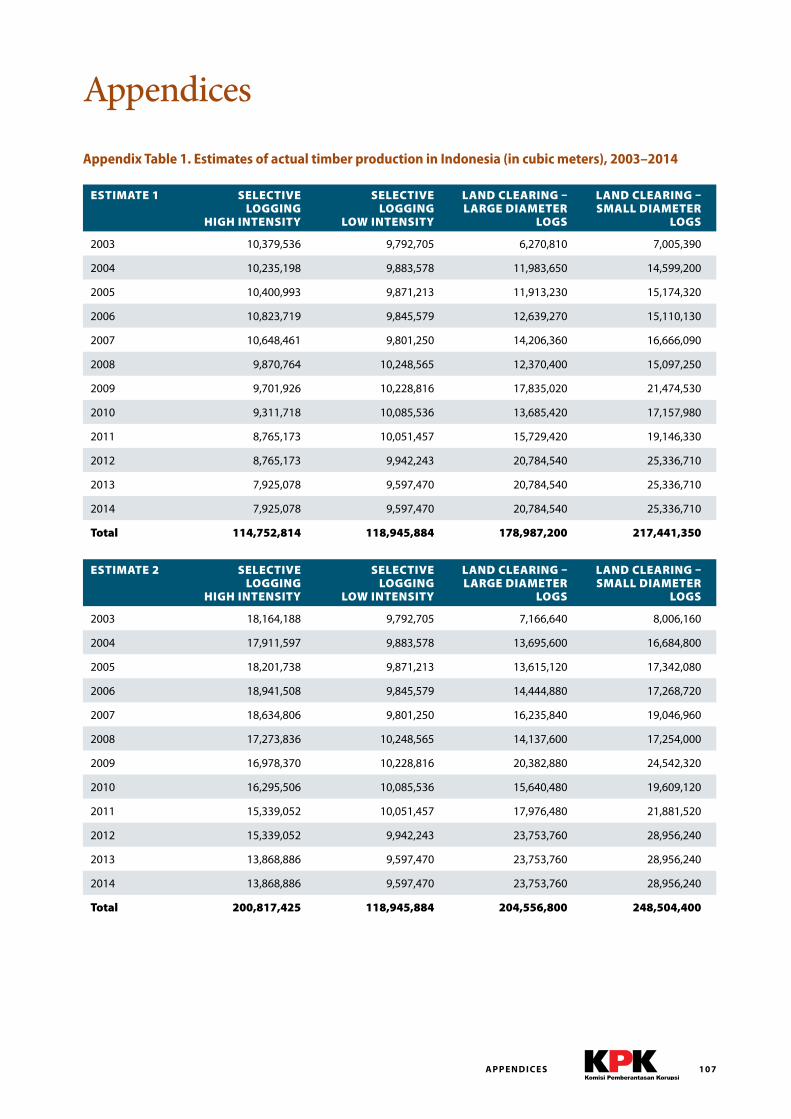
107
ESTIMATE 1 SELECTIVE LOGGING
HIGH INTENSITY
SELECTIVE LOGGING
LOW INTENSITY
LAND CLEARING – LARGE DIAMETER
LOGS
LAND CLEARING – SMALL DIAMETER
LOGS
2003 10,379,536 9,792,705 6,270,810 7,005,390
2004 10,235,198 9,883,578 11,983,650 14,599,200
2005 10,400,993 9,871,213 11,913,230 15,174,320
2006 10,823,719 9,845,579 12,639,270 15,110,130
2007 10,648,461 9,801,250 14,206,360 16,666,090
2008 9,870,764 10,248,565 12,370,400 15,097,250
2009 9,701,926 10,228,816 17,835,020 21,474,530
2010 9,311,718 10,085,536 13,685,420 17,157,980
2011 8,765,173 10,051,457 15,729,420 19,146,330
2012 8,765,173 9,942,243 20,784,540 25,336,710
2013 7,925,078 9,597,470 20,784,540 25,336,710
2014 7,925,078 9,597,470 20,784,540 25,336,710
Total 114,752,814 118,945,884 178,987,200 217,441,350
ESTIMATE 2 SELECTIVE LOGGING
HIGH INTENSITY
SELECTIVE LOGGING
LOW INTENSITY
LAND CLEARING – LARGE DIAMETER
LOGS
LAND CLEARING – SMALL DIAMETER
LOGS
2003 18,164,188 9,792,705 7,166,640 8,006,160
2004 17,911,597 9,883,578 13,695,600 16,684,800
2005 18,201,738 9,871,213 13,615,120 17,342,080
2006 18,941,508 9,845,579 14,444,880 17,268,720
2007 18,634,806 9,801,250 16,235,840 19,046,960
2008 17,273,836 10,248,565 14,137,600 17,254,000
2009 16,978,370 10,228,816 20,382,880 24,542,320
2010 16,295,506 10,085,536 15,640,480 19,609,120
2011 15,339,052 10,051,457 17,976,480 21,881,520
2012 15,339,052 9,942,243 23,753,760 28,956,240
2013 13,868,886 9,597,470 23,753,760 28,956,240
2014 13,868,886 9,597,470 23,753,760 28,956,240
Total 200,817,425 118,945,884 204,556,800 248,504,400
Appendix Table 1. Estimates of actual timber production in Indonesia (in cubic meters), 2003–2014
Appendices
A P P E N D I C E S
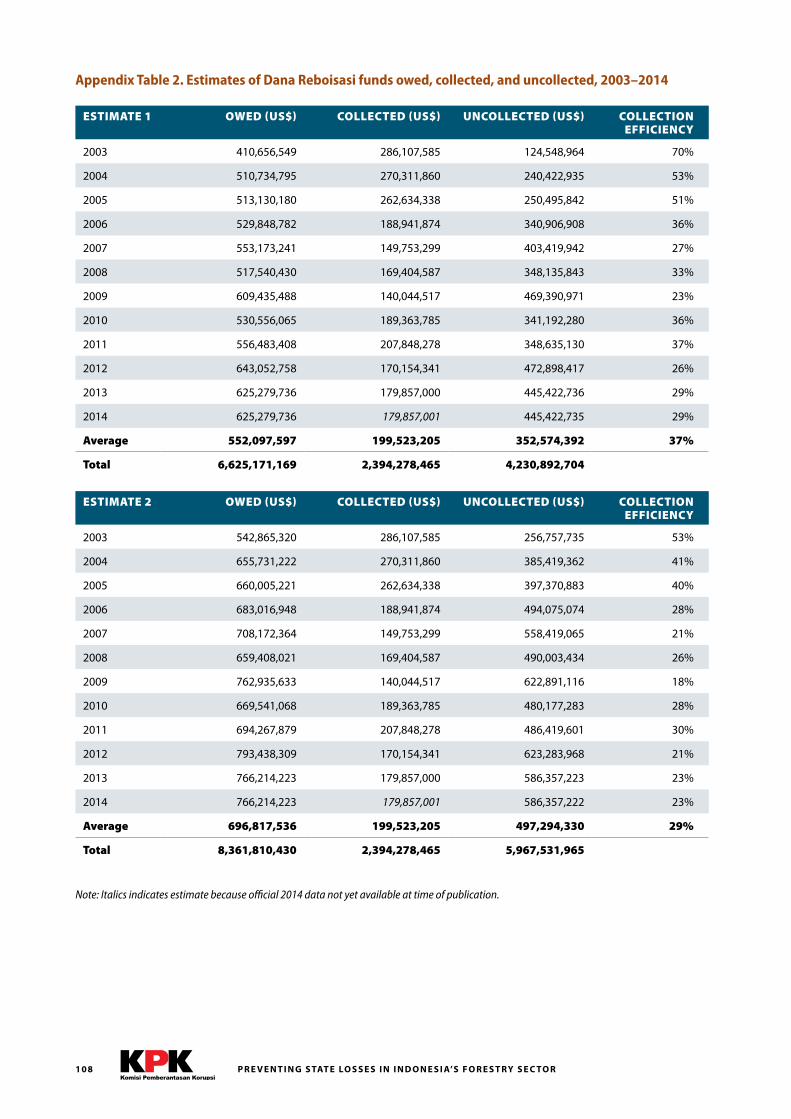
P R E V E N T I N G S TAT E LO S S E S I N I N D O N E S I A’S F O R E S T RY S E C TO R108
ESTIMATE 1 OWED (US$) COLLECTED (US$) UNCOLLECTED (US$) COLLECTION EFFICIENCY
2003 410,656,549 286,107,585 124,548,964 70%
2004 510,734,795 270,311,860 240,422,935 53%
2005 513,130,180 262,634,338 250,495,842 51%
2006 529,848,782 188,941,874 340,906,908 36%
2007 553,173,241 149,753,299 403,419,942 27%
2008 517,540,430 169,404,587 348,135,843 33%
2009 609,435,488 140,044,517 469,390,971 23%
2010 530,556,065 189,363,785 341,192,280 36%
2011 556,483,408 207,848,278 348,635,130 37%
2012 643,052,758 170,154,341 472,898,417 26%
2013 625,279,736 179,857,000 445,422,736 29%
2014 625,279,736 179,857,001 445,422,735 29%
Average 552,097,597 199,523,205 352,574,392 37%
Total 6,625,171,169 2,394,278,465 4,230,892,704
ESTIMATE 2 OWED (US$) COLLECTED (US$) UNCOLLECTED (US$) COLLECTION EFFICIENCY
2003 542,865,320 286,107,585 256,757,735 53%
2004 655,731,222 270,311,860 385,419,362 41%
2005 660,005,221 262,634,338 397,370,883 40%
2006 683,016,948 188,941,874 494,075,074 28%
2007 708,172,364 149,753,299 558,419,065 21%
2008 659,408,021 169,404,587 490,003,434 26%
2009 762,935,633 140,044,517 622,891,116 18%
2010 669,541,068 189,363,785 480,177,283 28%
2011 694,267,879 207,848,278 486,419,601 30%
2012 793,438,309 170,154,341 623,283,968 21%
2013 766,214,223 179,857,000 586,357,223 23%
2014 766,214,223 179,857,001 586,357,222 23%
Average 696,817,536 199,523,205 497,294,330 29%
Total 8,361,810,430 2,394,278,465 5,967,531,965
Note: Italics indicates estimate because official 2014 data not yet available at time of publication .
Appendix Table 2. Estimates of Dana Reboisasi funds owed, collected, and uncollected, 2003–2014
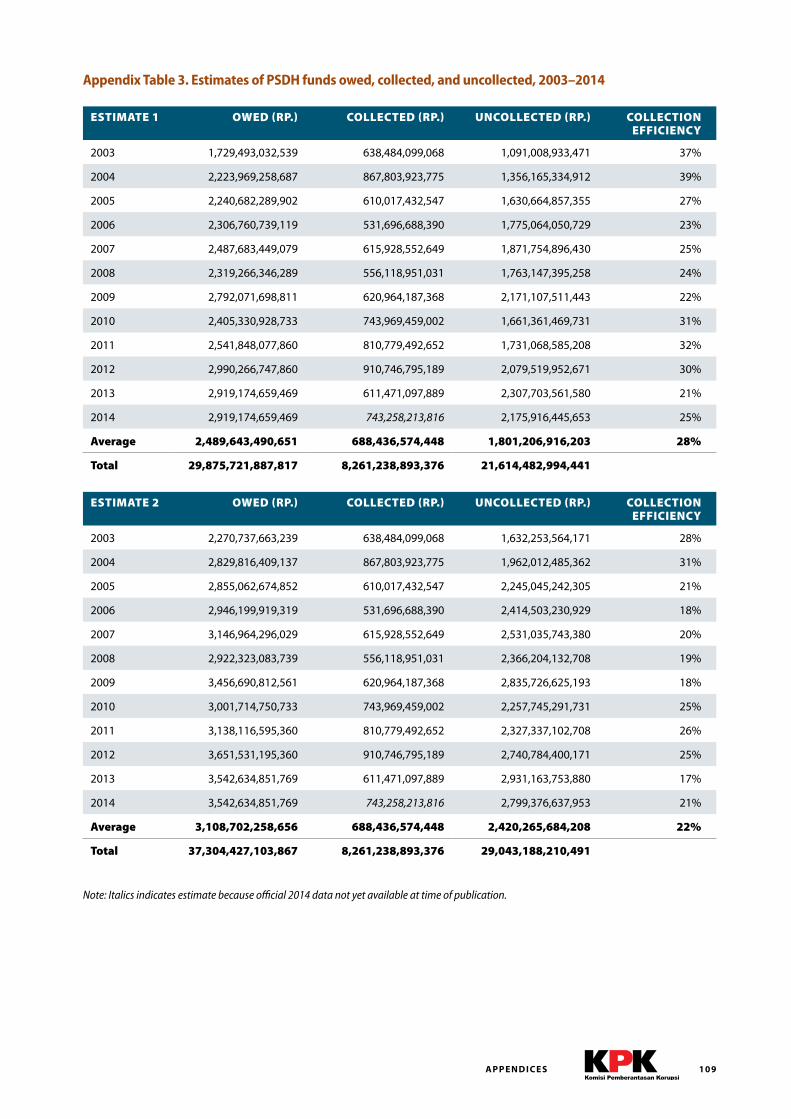
109A P P E N D I C E S
ESTIMATE 1 OWED (RP.) COLLECTED (RP.) UNCOLLECTED (RP.) COLLECTION EFFICIENCY
2003 1,729,493,032,539 638,484,099,068 1,091,008,933,471 37%
2004 2,223,969,258,687 867,803,923,775 1,356,165,334,912 39%
2005 2,240,682,289,902 610,017,432,547 1,630,664,857,355 27%
2006 2,306,760,739,119 531,696,688,390 1,775,064,050,729 23%
2007 2,487,683,449,079 615,928,552,649 1,871,754,896,430 25%
2008 2,319,266,346,289 556,118,951,031 1,763,147,395,258 24%
2009 2,792,071,698,811 620,964,187,368 2,171,107,511,443 22%
2010 2,405,330,928,733 743,969,459,002 1,661,361,469,731 31%
2011 2,541,848,077,860 810,779,492,652 1,731,068,585,208 32%
2012 2,990,266,747,860 910,746,795,189 2,079,519,952,671 30%
2013 2,919,174,659,469 611,471,097,889 2,307,703,561,580 21%
2014 2,919,174,659,469 743,258,213,816 2,175,916,445,653 25%
Average 2,489,643,490,651 688,436,574,448 1,801,206,916,203 28%
Total 29,875,721,887,817 8,261,238,893,376 21,614,482,994,441
ESTIMATE 2 OWED (RP.) COLLECTED (RP.) UNCOLLECTED (RP.) COLLECTION EFFICIENCY
2003 2,270,737,663,239 638,484,099,068 1,632,253,564,171 28%
2004 2,829,816,409,137 867,803,923,775 1,962,012,485,362 31%
2005 2,855,062,674,852 610,017,432,547 2,245,045,242,305 21%
2006 2,946,199,919,319 531,696,688,390 2,414,503,230,929 18%
2007 3,146,964,296,029 615,928,552,649 2,531,035,743,380 20%
2008 2,922,323,083,739 556,118,951,031 2,366,204,132,708 19%
2009 3,456,690,812,561 620,964,187,368 2,835,726,625,193 18%
2010 3,001,714,750,733 743,969,459,002 2,257,745,291,731 25%
2011 3,138,116,595,360 810,779,492,652 2,327,337,102,708 26%
2012 3,651,531,195,360 910,746,795,189 2,740,784,400,171 25%
2013 3,542,634,851,769 611,471,097,889 2,931,163,753,880 17%
2014 3,542,634,851,769 743,258,213,816 2,799,376,637,953 21%
Average 3,108,702,258,656 688,436,574,448 2,420,265,684,208 22%
Total 37,304,427,103,867 8,261,238,893,376 29,043,188,210,491
Appendix Table 3. Estimates of PSDH funds owed, collected, and uncollected, 2003–2014
Note: Italics indicates estimate because official 2014 data not yet available at time of publication .
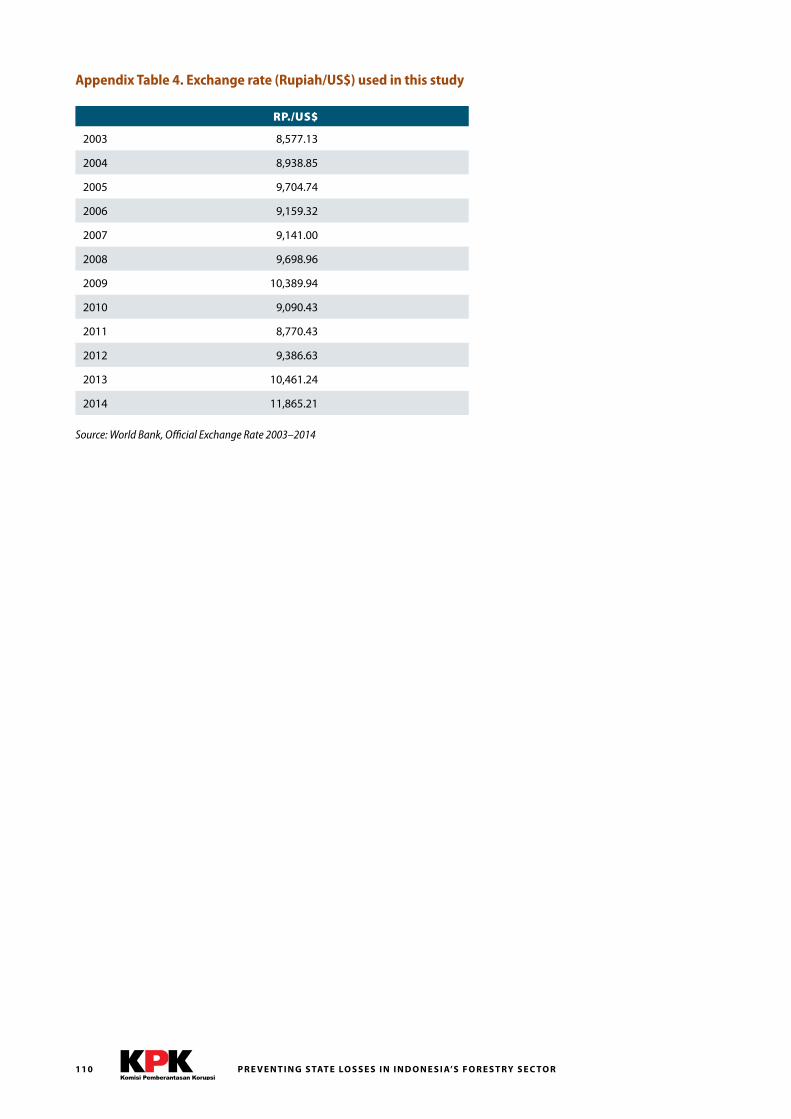
P R E V E N T I N G S TAT E LO S S E S I N I N D O N E S I A’S F O R E S T RY S E C TO R110
Appendix Table 4. Exchange rate (Rupiah/US$) used in this study
Source: World Bank, Official Exchange Rate 2003–2014
RP./US$
2003 8,577.13
2004 8,938.85
2005 9,704.74
2006 9,159.32
2007 9,141.00
2008 9,698.96
2009 10,389.94
2010 9,090.43
2011 8,770.43
2012 9,386.63
2013 10,461.24
2014 11,865.21
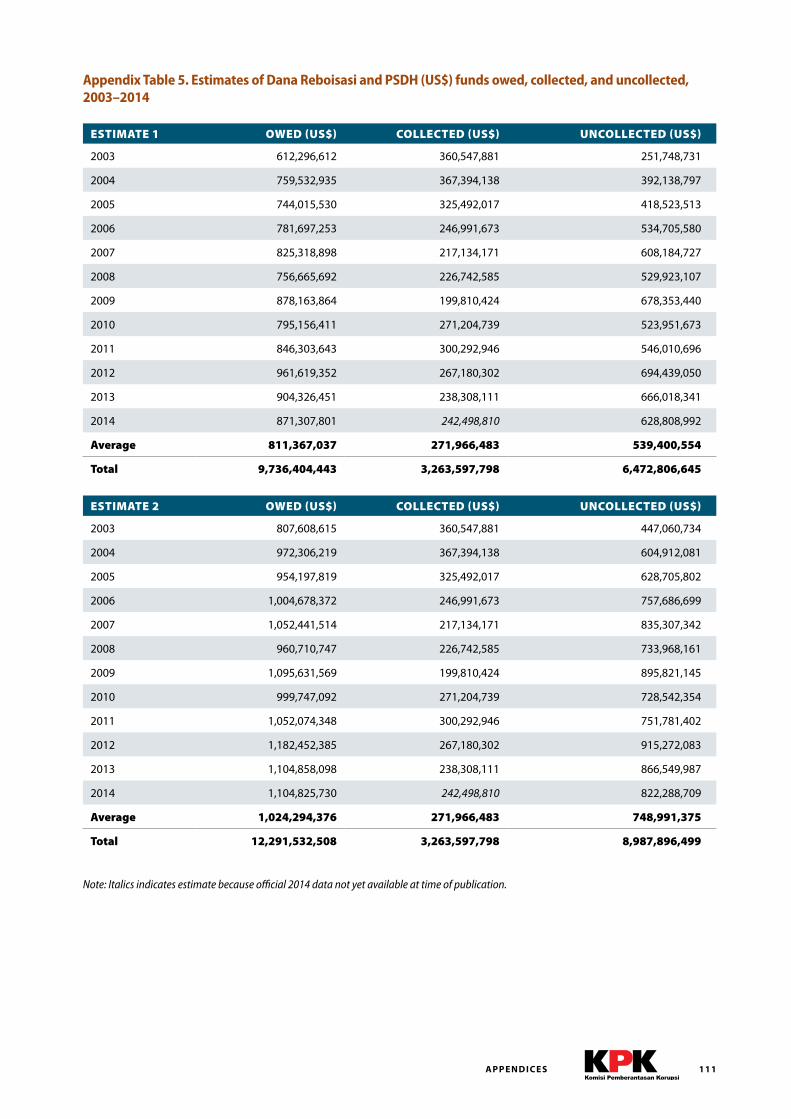
111A P P E N D I C E S
ESTIMATE 1 OWED (US$) COLLECTED (US$) UNCOLLECTED (US$)
2003 612,296,612 360,547,881 251,748,731
2004 759,532,935 367,394,138 392,138,797
2005 744,015,530 325,492,017 418,523,513
2006 781,697,253 246,991,673 534,705,580
2007 825,318,898 217,134,171 608,184,727
2008 756,665,692 226,742,585 529,923,107
2009 878,163,864 199,810,424 678,353,440
2010 795,156,411 271,204,739 523,951,673
2011 846,303,643 300,292,946 546,010,696
2012 961,619,352 267,180,302 694,439,050
2013 904,326,451 238,308,111 666,018,341
2014 871,307,801 242,498,810 628,808,992
Average 811,367,037 271,966,483 539,400,554
Total 9,736,404,443 3,263,597,798 6,472,806,645
ESTIMATE 2 OWED (US$) COLLECTED (US$) UNCOLLECTED (US$)
2003 807,608,615 360,547,881 447,060,734
2004 972,306,219 367,394,138 604,912,081
2005 954,197,819 325,492,017 628,705,802
2006 1,004,678,372 246,991,673 757,686,699
2007 1,052,441,514 217,134,171 835,307,342
2008 960,710,747 226,742,585 733,968,161
2009 1,095,631,569 199,810,424 895,821,145
2010 999,747,092 271,204,739 728,542,354
2011 1,052,074,348 300,292,946 751,781,402
2012 1,182,452,385 267,180,302 915,272,083
2013 1,104,858,098 238,308,111 866,549,987
2014 1,104,825,730 242,498,810 822,288,709
Average 1,024,294,376 271,966,483 748,991,375
Total 12,291,532,508 3,263,597,798 8,987,896,499
Note: Italics indicates estimate because official 2014 data not yet available at time of publication .
Appendix Table 5. Estimates of Dana Reboisasi and PSDH (US$) funds owed, collected, and uncollected, 2003–2014
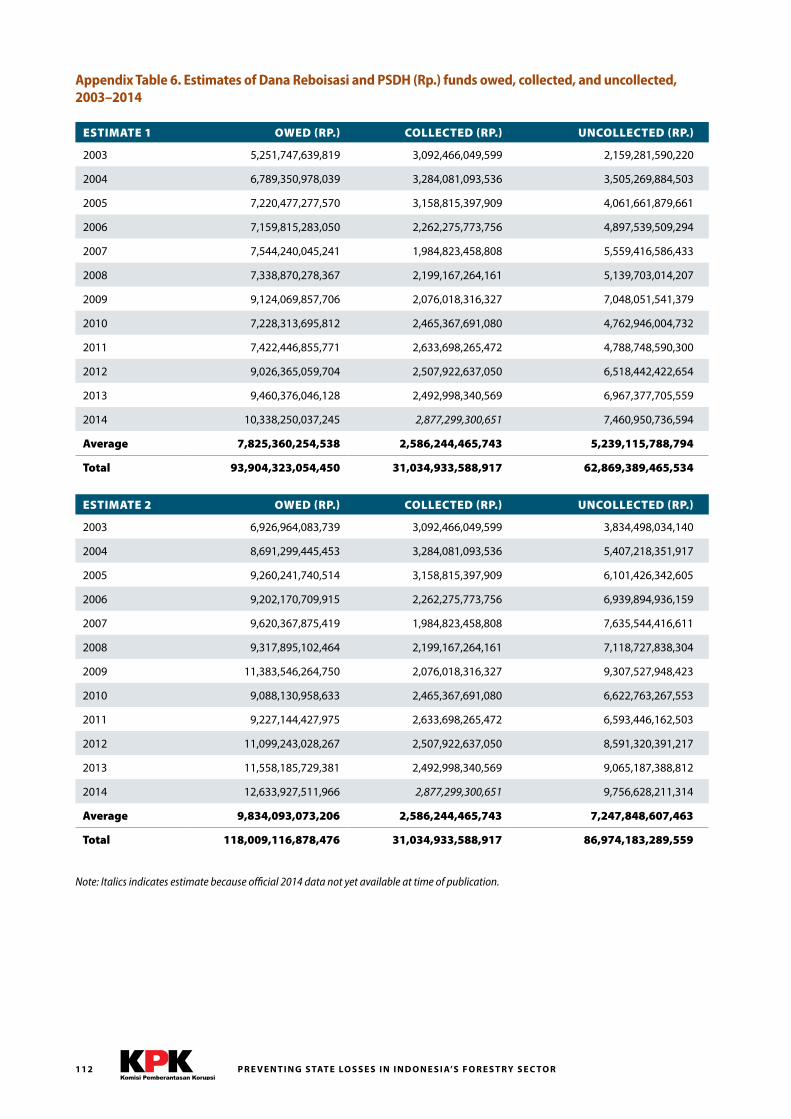
P R E V E N T I N G S TAT E LO S S E S I N I N D O N E S I A’S F O R E S T RY S E C TO R112
Note: Italics indicates estimate because official 2014 data not yet available at time of publication .
ESTIMATE 1 OWED (RP.) COLLECTED (RP.) UNCOLLECTED (RP.)
2003 5,251,747,639,819 3,092,466,049,599 2,159,281,590,220
2004 6,789,350,978,039 3,284,081,093,536 3,505,269,884,503
2005 7,220,477,277,570 3,158,815,397,909 4,061,661,879,661
2006 7,159,815,283,050 2,262,275,773,756 4,897,539,509,294
2007 7,544,240,045,241 1,984,823,458,808 5,559,416,586,433
2008 7,338,870,278,367 2,199,167,264,161 5,139,703,014,207
2009 9,124,069,857,706 2,076,018,316,327 7,048,051,541,379
2010 7,228,313,695,812 2,465,367,691,080 4,762,946,004,732
2011 7,422,446,855,771 2,633,698,265,472 4,788,748,590,300
2012 9,026,365,059,704 2,507,922,637,050 6,518,442,422,654
2013 9,460,376,046,128 2,492,998,340,569 6,967,377,705,559
2014 10,338,250,037,245 2,877,299,300,651 7,460,950,736,594
Average 7,825,360,254,538 2,586,244,465,743 5,239,115,788,794
Total 93,904,323,054,450 31,034,933,588,917 62,869,389,465,534
ESTIMATE 2 OWED (RP.) COLLECTED (RP.) UNCOLLECTED (RP.)
2003 6,926,964,083,739 3,092,466,049,599 3,834,498,034,140
2004 8,691,299,445,453 3,284,081,093,536 5,407,218,351,917
2005 9,260,241,740,514 3,158,815,397,909 6,101,426,342,605
2006 9,202,170,709,915 2,262,275,773,756 6,939,894,936,159
2007 9,620,367,875,419 1,984,823,458,808 7,635,544,416,611
2008 9,317,895,102,464 2,199,167,264,161 7,118,727,838,304
2009 11,383,546,264,750 2,076,018,316,327 9,307,527,948,423
2010 9,088,130,958,633 2,465,367,691,080 6,622,763,267,553
2011 9,227,144,427,975 2,633,698,265,472 6,593,446,162,503
2012 11,099,243,028,267 2,507,922,637,050 8,591,320,391,217
2013 11,558,185,729,381 2,492,998,340,569 9,065,187,388,812
2014 12,633,927,511,966 2,877,299,300,651 9,756,628,211,314
Average 9,834,093,073,206 2,586,244,465,743 7,247,848,607,463
Total 118,009,116,878,476 31,034,933,588,917 86,974,183,289,559
Appendix Table 6. Estimates of Dana Reboisasi and PSDH (Rp.) funds owed, collected, and uncollected, 2003–2014
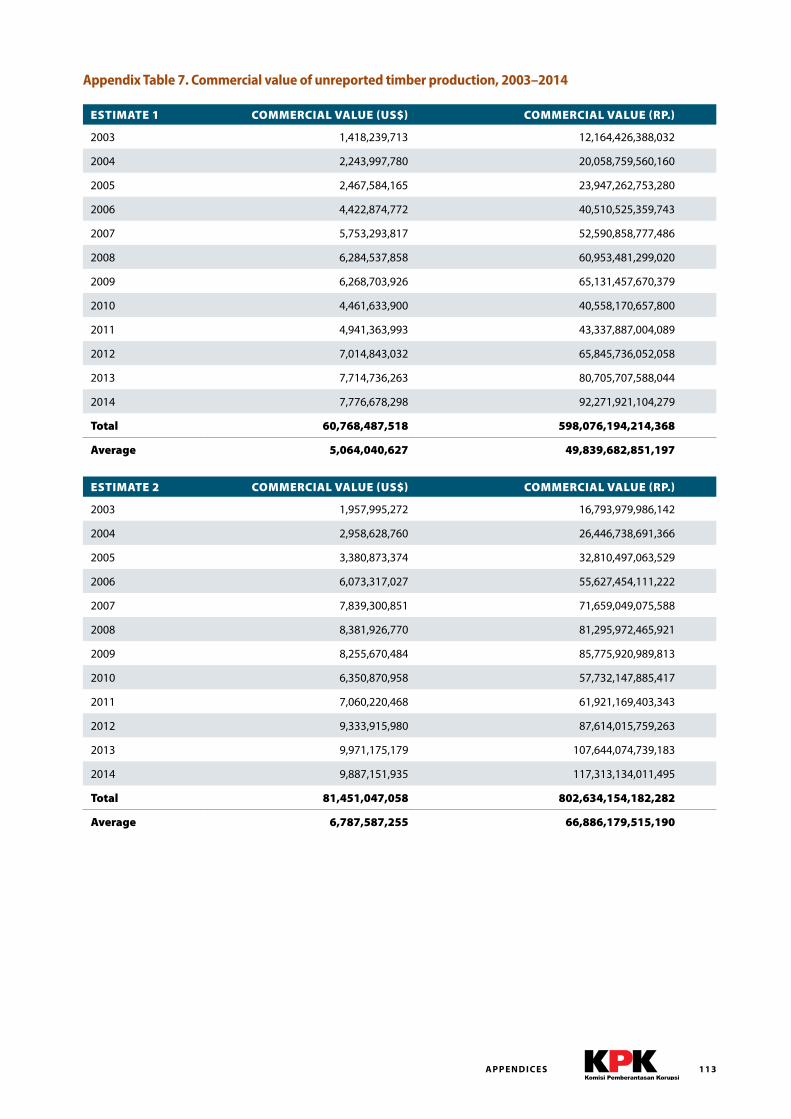
113A P P E N D I C E S
ESTIMATE 1 COMMERCIAL VALUE (US$) COMMERCIAL VALUE (RP.)
2003 1,418,239,713 12,164,426,388,032
2004 2,243,997,780 20,058,759,560,160
2005 2,467,584,165 23,947,262,753,280
2006 4,422,874,772 40,510,525,359,743
2007 5,753,293,817 52,590,858,777,486
2008 6,284,537,858 60,953,481,299,020
2009 6,268,703,926 65,131,457,670,379
2010 4,461,633,900 40,558,170,657,800
2011 4,941,363,993 43,337,887,004,089
2012 7,014,843,032 65,845,736,052,058
2013 7,714,736,263 80,705,707,588,044
2014 7,776,678,298 92,271,921,104,279
Total 60,768,487,518 598,076,194,214,368
Average 5,064,040,627 49,839,682,851,197
ESTIMATE 2 COMMERCIAL VALUE (US$) COMMERCIAL VALUE (RP.)
2003 1,957,995,272 16,793,979,986,142
2004 2,958,628,760 26,446,738,691,366
2005 3,380,873,374 32,810,497,063,529
2006 6,073,317,027 55,627,454,111,222
2007 7,839,300,851 71,659,049,075,588
2008 8,381,926,770 81,295,972,465,921
2009 8,255,670,484 85,775,920,989,813
2010 6,350,870,958 57,732,147,885,417
2011 7,060,220,468 61,921,169,403,343
2012 9,333,915,980 87,614,015,759,263
2013 9,971,175,179 107,644,074,739,183
2014 9,887,151,935 117,313,134,011,495
Total 81,451,047,058 802,634,154,182,282
Average 6,787,587,255 66,886,179,515,190
Appendix Table 7. Commercial value of unreported timber production, 2003–2014
P R E V E N T I N G S TAT E LO S S E S I N I N D O N E S I A’S F O R E S T RY S E C TO R114
Sources CitedAbood, S. A., Lee, J. S. H., Burivalova, Z., Garcia-Ulloa, J. and Koh, L. P. 2015. “Relative Contributions of the Logging,
Fiber, Oil Palm, and Mining Industries to Forest Loss in Indonesia.” Conservation Letters, 8: 58–67.
Ahmad, M. and Ramli, R. 1991. Rente ekonomi dalam pengelolaan hutan alam . WALHI. Jakarta, Indonesia.
ANTARA News. 2015. “Menteri Siti Nurbaya : pelaku illegal logging itu teroris,” Antaranews.com, 21 February.
Badan Pemeriksa Keuangan Republik Indonesia (BPK-RI). 2011. Laporan Hasil Pemeriksaan (Pemeriksaan
Dengan Tujuan Tertentu) Semester II Tahun Anggaran 2011 Atas Pengelolaan PNBP Sektor Kehutanan, Rekening
Pembangunan Hutan, Dan Dana Bagi Hasil Sumber Daya Alam Kehutanan Tahun Anggaran 2009 S.D. 2011
(Triwulan III) Pada Kementerian Kehutanan, Kementerian Keuangan, Dan Pemerintah Provinsi Dan Kabupaten/
Kota, Serta Instansi Terkait Lainnya Di Jakarta, Provinsi Riau, Sumatera Selatan, Jawa Timur, Kalimantan Barat,
Kalimantan Tengah, Kalimantan Timur, Maluku Utara, Papua Barat, Dan Papua. Jakarta: Badan Pemeriksa
Keuangan Republik Indonesia. Auditorat Utama Keuangan Negara IV.
Badan Pengelola REDD+ (BP-REDD+). 2015. National Forest Reference Emission Level for Deforestation and Forest
Degradation in the Context of the Activities Referred to in Decision 1/CP . 16, Paragraph 70 (REDD+) Under the UNFCCC:
A Reference for Decision-Makers . BP-REDD+ Indonesia, Jakarta.
Badan Penelitian dan Pengembangan (Litbang) Kehutanan. 2011. “Review Tentang Illegal Logging Sebagai
Ancaman Terhadap Sumberdaya Hutan dan Implementasi Kegiatan Pengurangan Emisi dari Deforestasi
dan Degradasi (REDD) di Indonesia.” Pusat Penelitian dan Pengembangan Perubahan Iklim dan Kebijakan,
Kementerian Kehutanan, Bogor.
Barr, C., Dermawan, A., Purnomo, H. and Komarudin, H. 2010. Financial governance and Indonesia’s Reforestation
Fund during the Soeharto and post-Soeharto periods, 1989–2009: A political economic analysis of lessons for REDD+ .
Occasional Paper 60. CIFOR. Bogor.
Brown, D. W. 1999. “Addicted to Rent: Corporate and Spatial Distribution of Forest Resources in Indonesia;
Implications for Forest Sustainability and Government Policy,” DFID/Indonesia-UK Tropical Forest Management
Program, Report No. PFM/EC/99/06.
Departemen Kehutanan dan Badan Pusat Statistik. 2009. Identifikasi Desa di Dalam dan di Sekitar Kawasan Hutan .
Jakarta.
Detiknews. 2013. “Kemenhut Gandeng Kopassus Basmi Pembalakan Liar,” www.detik.com, 26 September.
Dewan Nasional Perubahan Iklim (DNPI), Indonesia. 2010. Indonesia’s Greenhouse Gas Abatement Cost Curve.
National Council on Climate Change, Jakarta. August. 56 pp.
Ernst & Young. 1999. Special audit of the Reforestation Fund – Final report. Unpublished audit report prepared by
Ernst & Young Corporate Nominees Limited for Ministry of Finance, Indonesia. 27 December. Jakarta, Indonesia.
Gillis, M. 1988. “Indonesia: Public Policies, Resource Management, and the Tropical Forest” in Public Policies and the
Misuse of Forest Resources, ed. R. Repetto and M. Gillis. New York: Cambridge University Press, pp. 43–114.
GOFC-GOLD (Global Observation of Forest and Land Cover Dynamics). 2010. A sourcebook of methods and
procedures for monitoring and reporting anthropogenic greenhouse gas emissions and removals caused by
115
deforestation, gains and losses of carbon stocks in forests remaining forests, and forestation. GOFC-GOLD Report
version COP16-1, (GOFC-GOLD Project Office, Natural Resources Canada, Alberta, Canada).
Gunarso, P. Hartoyo, M. E., Agus, F. and Killeen, T. J. 2013. Oil Palm and Land Use Change in Indonesia, Malaysia,
and Papua New Guinea. Reports from the Technical Panels of the 2nd Greenhouse Gas Working Group of the
Roundtable on Sustainable Palm Oil (RSPO).
Hansen, M. C. et al. 2013. “High-resolution global maps of 21st-century forest cover change.” Science . 342:
850–853.
Harwell, E. 2009. “Wild Money”: The Human Rights Consequences of Illegal Logging and Corruption in Indonesia’s
Forestry Sector . Human Rights Watch. https://www.hrw.org/report/2009/12/01/wild-money/human-rights-
consequences-illegal-logging-and-corruption-indonesias.
Hukum Online. 2010. “Menhut Kecam Pembalakan Liar: Hitungan Satgas PMH, pembalakan liar bisa merugikan
negara Rp158 triliun,” www.hukumonline.com, 31 December.
International Tropical Timber Organization (ITTO). Various years. Market Information Service. http://www.itto.int/
market_information_service/.
International Tropical Timber Organization (ITTO). 2002. ITTO guidelines for the restoration, management and
rehabilitation of degraded and secondary tropical forests. ITTO Policy Development Series No. 13.
Kartodihardo, H. 2006. “Masalah Kapasitas Kelembagaan dan Arah Kebijakan Kehutanan: Studi Tiga Kasus.” Jurnal
Managemen Hutan Tropika. Vol. 12, No. 3.
Kartodihardjo, Hariadi. 1999. “Economic Loss of the State in Managing Natural Forest.” Unpublished report.
Telapak Indonesia and Environmental Investigation Agency. 24 August.
Kementerian Lingkungan Hidup dan Hutan (KLHK). 2015. Penyelesaian Konflik pada Hutan Tanaman Industri:
Database 2014 . Jakarta.
Kementerian Lingkungan Hidup dan Hutan (KLHK). 2014. Statistik Kehutanan Indonesia 2013 . Direktorat Jenderal
Planologi Kehutanan. Jakarta.
Kementerian Lingkungan Hidup dan Hutan (KLHK). 2013. Statistik Kehutanan Indonesia 2012 . Direktorat Jenderal
Planologi Kehutanan. Jakarta.
Kementerian Lingkungan Hidup dan Hutan (KLHK). 2012. Statistik Kehutanan Indonesia 2011 . Direktorat Jenderal
Planologi Kehutanan. Jakarta.
Kementerian Lingkungan Hidup dan Hutan (KLHK). 2011. Statistik Kehutanan Indonesia 2010 . Direktorat Jenderal
Planologi Kehutanan. Jakarta.
Kementerian Lingkungan Hidup dan Hutan (KLHK). 2010. Statistik Kehutanan Indonesia 2009 . Direktorat Jenderal
Planologi Kehutanan. Jakarta.
Kementerian Lingkungan Hidup dan Hutan (KLHK). 2009. Statistik Kehutanan Indonesia 2008 . Direktorat Jenderal
Planologi Kehutanan. Jakarta.
Kementerian Lingkungan Hidup dan Hutan (KLHK). 2008. Statistik Kehutanan Indonesia 2007 . Direktorat Jenderal
Planologi Kehutanan. Jakarta.
S O U RC E S C I T E D
P R E V E N T I N G S TAT E LO S S E S I N I N D O N E S I A’S F O R E S T RY S E C TO R116
Luttrell, C., Obidzinski, K., Brockhaus, M., Muharrom, E., Petkova, E., Wardell, A. and Halperin, J. 2011 Lessons for
REDD+ from measures to control illegal logging in Indonesia. United Nations Office on Drugs and Crime and
Center for International Forestry Research, Jakarta and Bogor, Indonesia. United Nations Office on Drugs and
Crime and Center for International Forestry Research.
Manurung, E.G.T., Simangunsong, B.C.H., Sukadri, D., Widyantoro, B., Justianto, A., Ramadhan, S., Sumardjani, L.,
Rochadi, D., Permadi, P., Priyono, B.M. and Supriyanto, B. 2007. Road map revitalisasi industri kehutanan Indonesia
(Road map for revitalising Indonesia’s forestry industry). Ministry of Forestry, Jakarta, Indonesia.
Margono, B.A., Potapov, P.V., Turubanova, S., Stolle, F., and Hansen, M.C. 2014. “Primary forest cover loss in Indonesia
over 2000-2012,” Nature Climate Change 4: 730–735.
Margono, B.A. et al. 2012. “Mapping and monitoring deforestation and forest degradation in Sumatra
(Indonesia) using Landsat time series data sets from 1990 to 2010.” Environmental Research Letters. Vol. 7 No. 3.
Maturana, J. 2005. “Economic Costs and Benefits of Allocating Forest Land for Industrial Tree Plantation
Development in Indonesia.” CIFOR Working Paper No. 30.
Obidzinski, K. 2005. “Illegal Logging in Indonesia: Myth and Reality” in Resosudarmo, Budy P. (ed) The Politics and
Economics of Indonesia’s Natural Resources . ANU Press. Canberra.
Potapov, P.V. et al. 2008. “Mapping the world’s intact forest landscapes.” Remote Sensing Ecology and Society, 13, 51
(online journal).
Repetto, R. and Gillis, M. (eds). 1988. Public Policies and the Misuse of Forest Resources, ed. Robert Repetto and
Malcolm Gillis. New York: Cambridge University Press.
Republika. 2013. “Kemenhut Usul Pengadilan Khusus Bagi Pembalak Liar.” www.republikaonline.com. 6 February.
Ruzicka, Ivan. 1979. “Rent Appropriation in Indonesian Logging: East Kalimantan 1972/73–1976/77.” Bulletin of
Indonesian Economic Studies, Vol. XV, pp. 45–74.
Scotland, N. and Whiteman, A. 1997. “Economic Rent in the Indonesian Forest Sector, Volume 4: The Forest
Concession Industry.” Indonesia-UK Tropical Forest Management Program, ODA-DFID Report No. SMAT/EC/97/04,
Jakarta, Indonesia.
Setiono, B. and Husein, Y. 2005. Memerangi Kejahatan Kehutanan dan Mendorong Prinsip Kehati-hatian
Perbankan untuk Mewujudkan Pengelolaan Hutan yang Berkelanjutan: Pendekatan Anti Pencucian Uang. CIFOR
Occasional Paper No. 44. Bogor: Center For International Forestry Research.
Smith, J., Obidzinski, K., Subardi, and Suramenggala, I. 2003. “Illegal logging, collusive corruption, and
fragmented government in Kalimantan, Indonesia.” International Forestry Review 5 (3), 293–302.
Sri Mulyani. 2015. “The case for inclusive green growth.” Speech delivered at Indonesia Green Infrastructure Summit,
Jakarta. 9 June. [http://www.worldbank.org/en/news/speech/2015/06/09/the-case-for-inclusive-green-growth].
Suara Alam. 2013. “Tahun 2013, Negara Rugi 1,17 Triliun Akibat Perambahan Hutan,” www.suaraalam.com, 27
December.
Wood Resources International. Various years. Wood Resource Quarterly . http://woodprices.com/wood-resource-
quarterly/.
117S O U RC E S C I T E D
Laws and Regulations
Undang-Undang Republik Indonesia Nomor 41 Tahun 1999 tentang Kehutanan
Undang-Undang Republik Indonesia Nomor 20 Tahun 1997 tentang Penerimaan Negara Bukan Pajak
Undang-Undang Republik Indonesia Nomor 17 Tahun 2003 tentang Keuangan Negara
Undang-Undang Republik Indonesia Nomor 1 Tahun 2004 tentang Perbendaharaan Negara
Undang-Undang Republik Indonesia Nomor 15 Tahun 2006 tentang Badan Pemeriksa Keuangan
Undang-Undang Republik Indonesia Nomor 8 Tahun 2010 tentang Pemberantasan Tindak Pidana Pencucian Uang
Undang-Undang Republik Indonesia Nomor 7 Tahun 2006 tentang Pengesahan United Nations Convention
Against Corruption
Undang-Undang Republik Indonesia Nomor 30 Tahun 2002 tentang Komisi Pemberantasan Korupsi
Undang-Undang Republik Indonesia Nomor 18 Tahun 2013 tentang Pencehan dan Pemberantasan
Perusakan Hutan
Peraturan Pemerintah Republik Indonesia Nomor 1 Tahun 2004 tentang Tata Cara Penyampaian Rencana Dan
Laporan Realisasi Penerimaan Negara Bukan Pajak
Peraturan Pemerintah Republik Indonesia Nomor 35 Tahun 2002 tentang Dana Reboisasi
Peraturan Pemerintah Republik Indonesia Nomor 1 Tahun 2004 tentang Tata Cara Penyampaian Rencana Dan
Laporan Realisasi Penerimaan Negara Bukan Pajak
Peraturan Pemerintah Republik Indonesia Nomor 51 Tahun 1998 tentang Provisi Sumber Daya Hutan
Peraturan Pemerintah Republik Indonesia Nomor 92 Tahun 1999 tentang Perubahan Kedua Atas Peraturan
Pemerintah Republik Indonesia Nomor 59 Tahun 1998 tentang Tarif Atas Jenis Penerimaan Negara Bukan Pajak
Yang Berlaku Pada Departemen Kehutanan Dan Perkebunan
Peraturan Menteri Kehutanan Republik Indonesia Nomor P.52/Menhut-II/2014 tentang Tata Cara Pengenaan,
Pemungutan, dan Penyetoran Provisi Sumber Daya Hutan, Dana Reboisasi, Penggantian Nilai Teggakan, dan
Ganti Rugi Tegakan.
Peraturan Menteri Keuangan Republik Indonesia Nomor 152/PMK .2/2014 tentang Petunjuk Penyusunan
Rencana Penerimaan Negara Bukan Pajak Kementerian Negara/Lembaga
Peraturan Menteri Kehutanan Republik Indonesia Nomor P.33/Menhut-II/2014 tentang Inventarisasi Hutan
Menyeluruh Berkala Dan Rencana Kerja Pada Izin Pemanfaatan Hasil Hutan Kayu Pada Hutan Alam
Peraturan Menteri Kehutanan Nomor P.30/Menhut-II/2014 tentang Inventarisasi Hutan Menyeluruh Berkala dan
Rencana Kerja Pada Usaha Pemanfaatan Hasil Hutan Kayu Hutan Tanaman Industri
Peraturan Menteri Kehutanan Republik Indonesia Nomor P.41/Menhut-II/2014 tentang Penatausahaan Hasil
Hutan Kayu Yang Berasal Dari Hutan Alam
Peraturan Menteri Kehutanan Republik Indonesia Nomor P.42/Menhut-II/2014 tentang Penatausahaan Hasil
Hutan Kayu Yang Berasal Dari Hutan Tanaman

P R E V E N T I N G S TAT E LO S S E S I N I N D O N E S I A’S F O R E S T RY S E C TO R118
Cover photo: Yusuf Ahmad