Embed Size (px)
Citation preview
U.S. Department of Health & Human Services
Centers for Medicare & Medicaid Services
Payment Year 2014 End-Stage Renal Disease
Quality Incentive Program
Preview Performance Score Report
July 29, 2013
SAMPLE

Payment Year 2014 ESRD QIP Preview Performance Score Report Facility Name CMS Certification Number: 999999
Payment Year 2014 ESRD QIP Preview Performance Score Report Page 1
Background The purpose of the End-Stage Renal Disease (ESRD) Quality Incentive Program (QIP) is to improve patient care by setting performance standards for quality of care. Facilities failing to meet these standards may be subject to a payment reduction of up to 2%. The ESRD QIP was established by Congress under the Medicare Improvements for Patients and Providers Act of 2008 (MIPPA) and is administered by the Centers for Medicare & Medicaid Services (CMS). The Final Rule outlining the program for Payment Year (PY) 2014 (CMS-1577-F) was published in the Federal Register on November 10, 2011.
Scoring Your facility’s Total Performance Score is 51 points out of a total of 100 possible points. Table 1 summarizes your facility’s performance scores. Information on how these scores are calculated is provided later in this document. Clinical measures account for 90% of the Total Performance Score, and reporting measures make up 10% of that total.
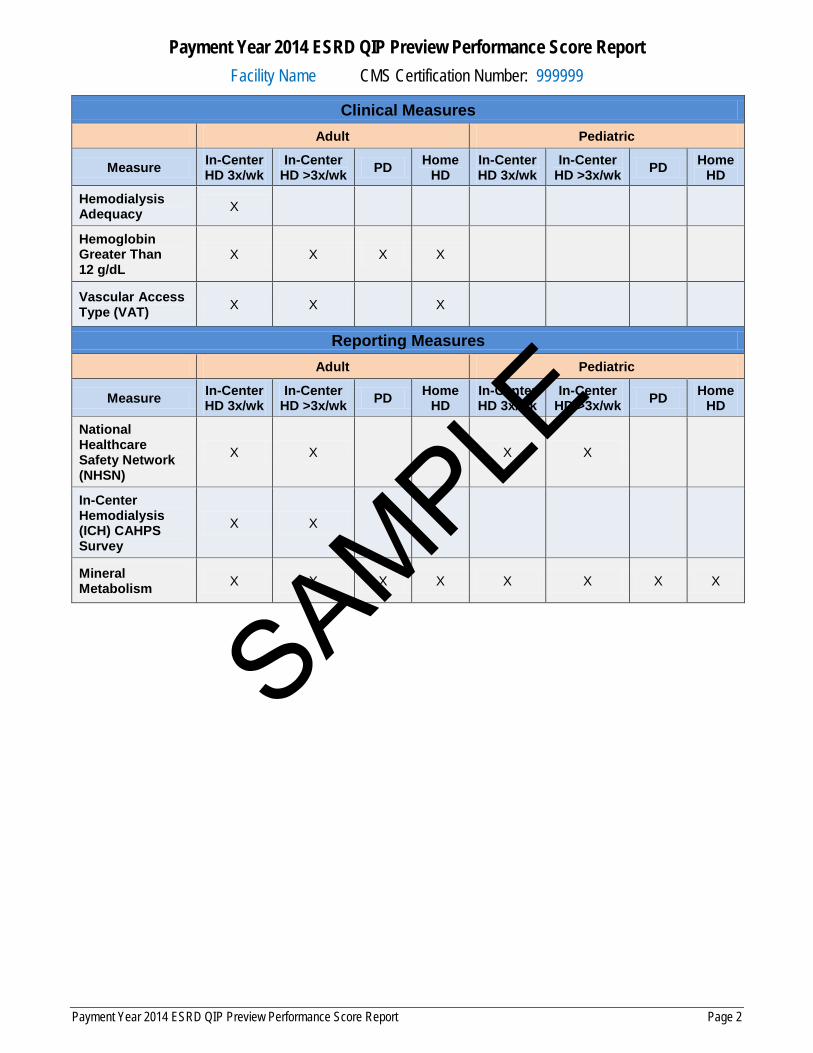
Not all measures apply to all populations. If your facility does not meet the case minimum for a clinical measure in the performance period (i.e., 11 cases meeting the criteria for the measure), or if a reporting measure does not apply to your facility, then your facility is not scored on that measure (appearing as a “no score calculated” result). For instance, in the case of adult home hemodialysis, the Dialysis Adequacy clinical measure does not apply, nor do the NHSN Dialysis Event Reporting or the Patient Experience of Care Survey Attestation reporting measures.
The following chart illustrates measure eligibility for adult and pediatric facilities alike. A complete explanation of the ESRD QIP performance rate calculations, including inclusion criteria for each measure, can be found in the Guide to the PY 2014 ESRD QIP Performance Score Report, available at http://www.DialysisReports.org. You may want to use this document to help answer patients’ questions about your facility’s Performance Score Certificate (PSC).
SAMPLE
Payment Year 2014 ESRD QIP Preview Performance Score Report Facility Name CMS Certification Number: 999999
Payment Year 2014 ESRD QIP Preview Performance Score Report Page 2
Clinical Measures Adult Pediatric
Measure In-Center HD 3x/wk
In-Center HD >3x/wk PD Home
HD In-Center HD 3x/wk
In-Center HD >3x/wk PD Home
HD
Hemodialysis Adequacy X
Hemoglobin Greater Than 12 g/dL
X X X X
Vascular Access Type (VAT) X X
X
Reporting Measures Adult Pediatric
Measure In-Center HD 3x/wk
In-Center HD >3x/wk PD Home
HD In-Center HD 3x/wk
In-Center HD >3x/wk PD Home
HD
National Healthcare Safety Network (NHSN)
X X
X X
In-Center Hemodialysis (ICH) CAHPS Survey
X X
Mineral Metabolism X X X X X X X X
SAMPLE
Payment Year 2014 ESRD QIP Preview Performance Score Report Facility Name CMS Certification Number: 999999
Payment Year 2014 ESRD QIP Preview Performance Score Report Page 3
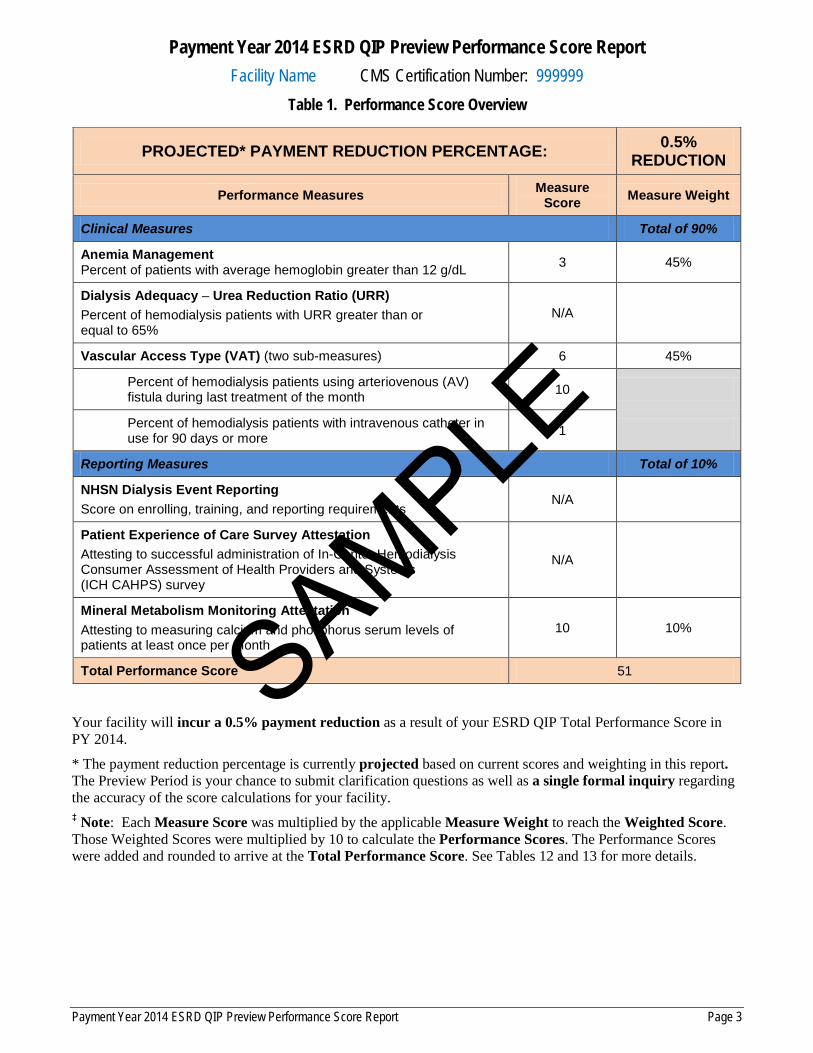
Table 1. Performance Score Overview
PROJECTED* PAYMENT REDUCTION PERCENTAGE: 0.5% REDUCTION
Performance Measures Measure Score Measure Weight
Clinical Measures Total of 90%
Anemia Management Percent of patients with average hemoglobin greater than 12 g/dL 3 45%
Dialysis Adequacy – Urea Reduction Ratio (URR) Percent of hemodialysis patients with URR greater than or equal to 65%
N/A
Vascular Access Type (VAT) (two sub-measures) 6 45%
Percent of hemodialysis patients using arteriovenous (AV) fistula during last treatment of the month 10
Percent of hemodialysis patients with intravenous catheter in use for 90 days or more 1
Reporting Measures Total of 10%
NHSN Dialysis Event Reporting Score on enrolling, training, and reporting requirements
N/A
Patient Experience of Care Survey Attestation Attesting to successful administration of In-Center Hemodialysis Consumer Assessment of Health Providers and Systems (ICH CAHPS) survey
N/A
Mineral Metabolism Monitoring Attestation Attesting to measuring calcium and phosphorus serum levels of patients at least once per month
10 10%
Total Performance Score 51
Your facility will incur a 0.5% payment reduction as a result of your ESRD QIP Total Performance Score in PY 2014.
* The payment reduction percentage is currently projected based on current scores and weighting in this report. The Preview Period is your chance to submit clarification questions as well as a single formal inquiry regarding the accuracy of the score calculations for your facility. ‡ Note: Each Measure Score was multiplied by the applicable Measure Weight to reach the Weighted Score. Those Weighted Scores were multiplied by 10 to calculate the Performance Scores. The Performance Scores were added and rounded to arrive at the Total Performance Score. See Tables 12 and 13 for more details.
SAMPLE
Payment Year 2014 ESRD QIP Preview Performance Score Report Facility Name CMS Certification Number: 999999
Payment Year 2014 ESRD QIP Preview Performance Score Report Page 4
Introduction The purpose of this Preview Performance Score Report (PSR) is to provide your facility with information regarding:
• Your performance on the quality measures during the Performance Period • Information regarding the quality measures • Your ESRD QIP Total Performance Score and how your score was calculated
• Information regarding how Medicare payments to your facility will be affected as a result of your Total Performance Score
During the Preview Period (July 29, 2013, through August 29, 2013), your facility has the opportunity to preview your performance scores and communicate with CMS through the www.DialysisReports.org website. You may submit two types of communications.
• Clarification Question(s): Your facility has the opportunity to ask as many questions as necessary to fully understand how your scores were calculated. For example, you might have questions about how a performance rate is calculated or what data was included in your facility’s calculations.
• Formal Inquiry (limited to one per facility): If you believe there is an error in your facility’s score calculation, your facility also has the opportunity to provide CMS with a specific explanation or evidence of why you believe there was an error. A facility may only submit one formal inquiry during the Preview Period.
CMS will address your formal inquiry prior to finalizing your facility’s performance score, finalizing your payment reduction percentage, and publishing your PSC. Use the following website to submit clarification questions and/or one formal inquiry: https://secure.DialysisReports.org
CMS recommends that you submit your clarification questions prior to August 1 to ensure that you receive a response with enough time to submit a formal inquiry, if desired.
Important: Your facility has until August 29, 2013, to review this report and ask questions. Only clarification questions and the one formal inquiry submitted during the Preview Period (July 29 – August 29, 2013) will receive a response.
Scores In the fall of 2013, your performance rates and Total Performance Score, as well as those scores of other dialysis facilities, will be finalized and made available to the public on the Dialysis Facility Compare (DFC) website at: http://www.medicare.gov/dialysis/home.asp
Certificate In December 2013, your PSC will be posted on https://secure.DialysisReports.org for you to download and post at your facility within 5 business days of the certificate being made available.
Important: All facilities are required by law to print and display their PSCs prominently in a public area for the
duration of calendar year 2014, even if the facility did not receive a Total Performance Score.
SAMPLE
Payment Year 2014 ESRD QIP Preview Performance Score Report Facility Name CMS Certification Number: 999999
Payment Year 2014 ESRD QIP Preview Performance Score Report Page 5
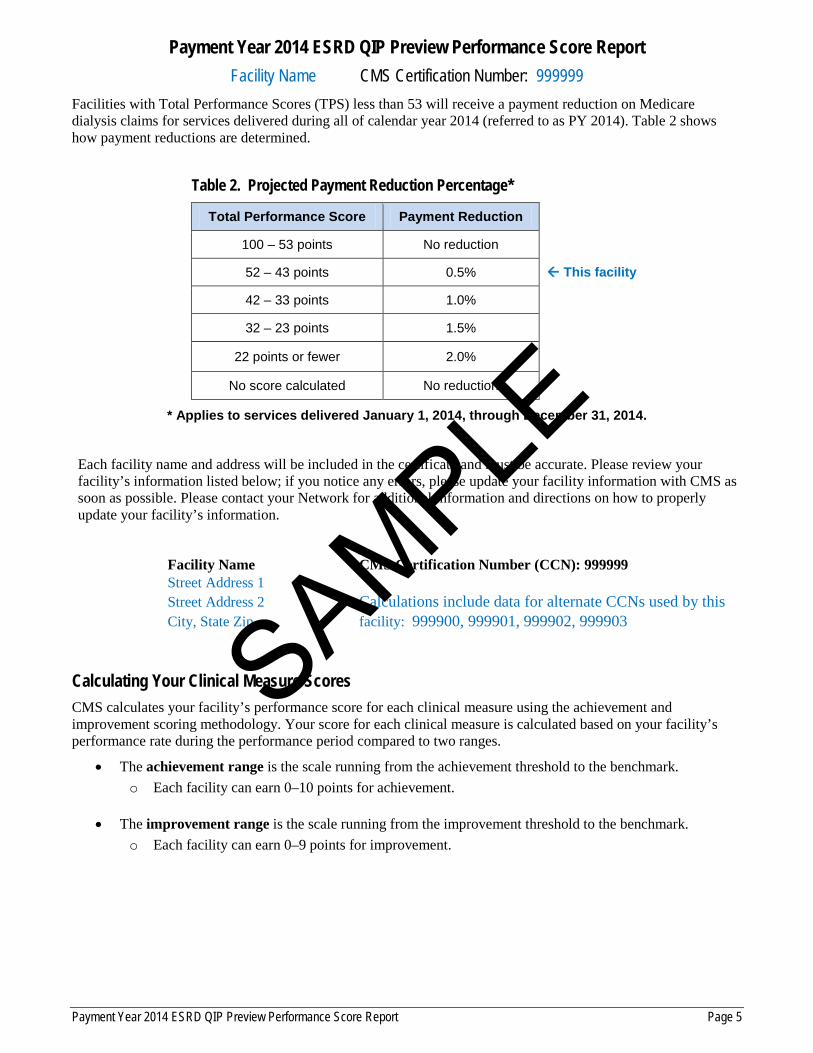
Facilities with Total Performance Scores (TPS) less than 53 will receive a payment reduction on Medicare dialysis claims for services delivered during all of calendar year 2014 (referred to as PY 2014). Table 2 shows how payment reductions are determined.
Table 2. Projected Payment Reduction Percentage*
Total Performance Score Payment Reduction
100 – 53 points No reduction
52 – 43 points 0.5% This facility
42 – 33 points 1.0%
32 – 23 points 1.5%
22 points or fewer 2.0%
No score calculated No reduction
* Applies to services delivered January 1, 2014, through December 31, 2014.
Each facility name and address will be included in the certificate and must be accurate. Please review your facility’s information listed below; if you notice any errors, please update your facility information with CMS as soon as possible. Please contact your Network for additional information and directions on how to properly update your facility’s information.
Facility Name CMS Certification Number (CCN): 999999 Street Address 1 Street Address 2 Calculations include data for alternate CCNs used by this City, State Zip facility: 999900, 999901, 999902, 999903
Calculating Your Clinical Measure Scores CMS calculates your facility’s performance score for each clinical measure using the achievement and improvement scoring methodology. Your score for each clinical measure is calculated based on your facility’s performance rate during the performance period compared to two ranges.
• The achievement range is the scale running from the achievement threshold to the benchmark. o Each facility can earn 0–10 points for achievement.
• The improvement range is the scale running from the improvement threshold to the benchmark. o Each facility can earn 0–9 points for improvement.
SAMPLE
Payment Year 2014 ESRD QIP Preview Performance Score Report Facility Name CMS Certification Number: 999999
Payment Year 2014 ESRD QIP Preview Performance Score Report Page 6
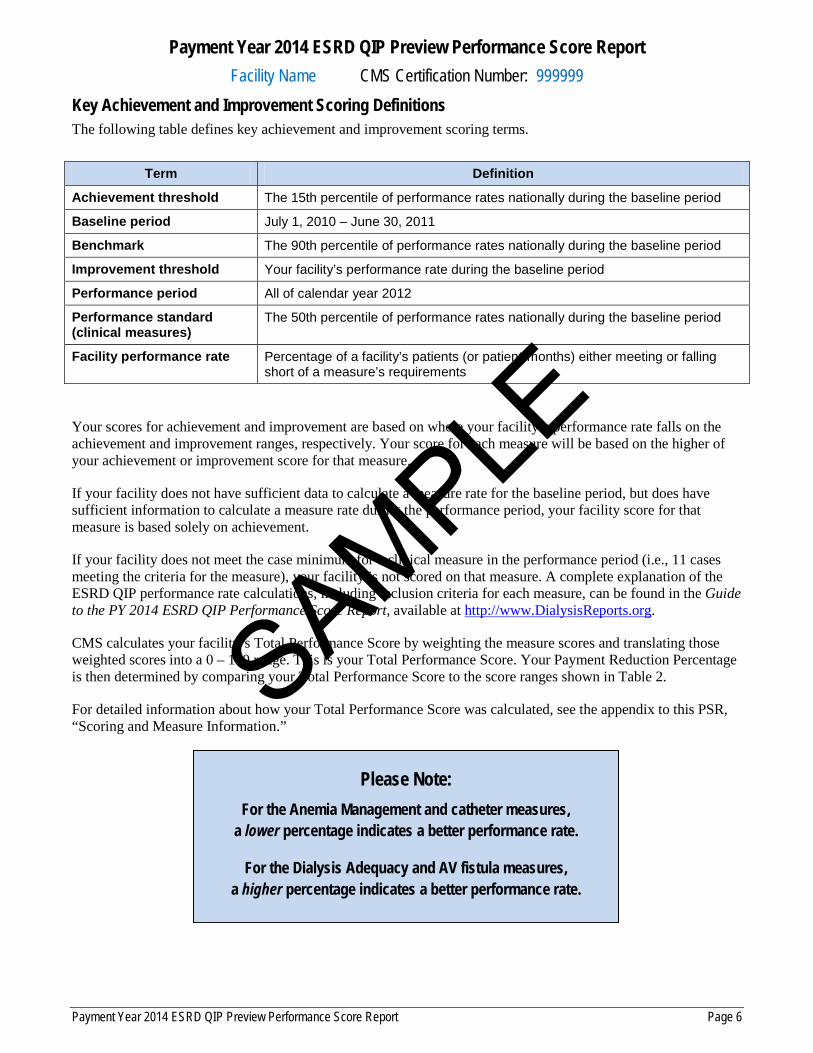
Key Achievement and Improvement Scoring Definitions The following table defines key achievement and improvement scoring terms.
Term Definition
Achievement threshold The 15th percentile of performance rates nationally during the baseline period
Baseline period July 1, 2010 – June 30, 2011
Benchmark The 90th percentile of performance rates nationally during the baseline period
Improvement threshold Your facility’s performance rate during the baseline period
Performance period All of calendar year 2012
Performance standard (clinical measures)
The 50th percentile of performance rates nationally during the baseline period
Facility performance rate Percentage of a facility’s patients (or patient-months) either meeting or falling short of a measure’s requirements
Your scores for achievement and improvement are based on where your facility’s performance rate falls on the achievement and improvement ranges, respectively. Your score for each measure will be based on the higher of your achievement or improvement score for that measure.
If your facility does not have sufficient data to calculate a measure rate for the baseline period, but does have sufficient information to calculate a measure rate during the performance period, your facility score for that measure is based solely on achievement.
If your facility does not meet the case minimum for a clinical measure in the performance period (i.e., 11 cases meeting the criteria for the measure), your facility is not scored on that measure. A complete explanation of the ESRD QIP performance rate calculations, including inclusion criteria for each measure, can be found in the Guide to the PY 2014 ESRD QIP Performance Score Report, available at http://www.DialysisReports.org.
CMS calculates your facility’s Total Performance Score by weighting the measure scores and translating those weighted scores into a 0 – 100 range. This is your Total Performance Score. Your Payment Reduction Percentage is then determined by comparing your Total Performance Score to the score ranges shown in Table 2.
For detailed information about how your Total Performance Score was calculated, see the appendix to this PSR, “Scoring and Measure Information.”
Please Note: For the Anemia Management and catheter measures,
a lower percentage indicates a better performance rate.
For the Dialysis Adequacy and AV fistula measures, a higher percentage indicates a better performance rate.
SAMPLE

Payment Year 2014 ESRD QIP Preview Performance Score Report Facility Name CMS Certification Number: 999999
Payment Year 2014 ESRD QIP Preview Performance Score Report Page 7
Table 3 outlines the weight assigned to each category of measures based on the number of measures for which a score is received.
Table 3. TPS Contributions of Clinical Measures with Scores and Reporting Measures with Scores
Number of Clinical Measures
with Scores
Number of Reporting Measures
with Scores
Clinical Measures Total Weight
of Total Performance Score
Reporting Measures Total Weight
of Total Performance Score
1 – 3 1 – 3 90% 10%
1 – 3 0 100% 0%
0 1 – 3 0% 100%
0 0 No Total Performance Score
Measure scores within each category are weighted equally, adding up to the total weight for that measure category.
Facility Score Calculations The following tables show the step-by-step calculations used to determine your scores for each PY 2014 ESRD QIP measure.
SAMPLE
Payment Year 2014 ESRD QIP Preview Performance Score Report Facility Name CMS Certification Number: 999999
Payment Year 2014 ESRD QIP Preview Performance Score Report Page 8
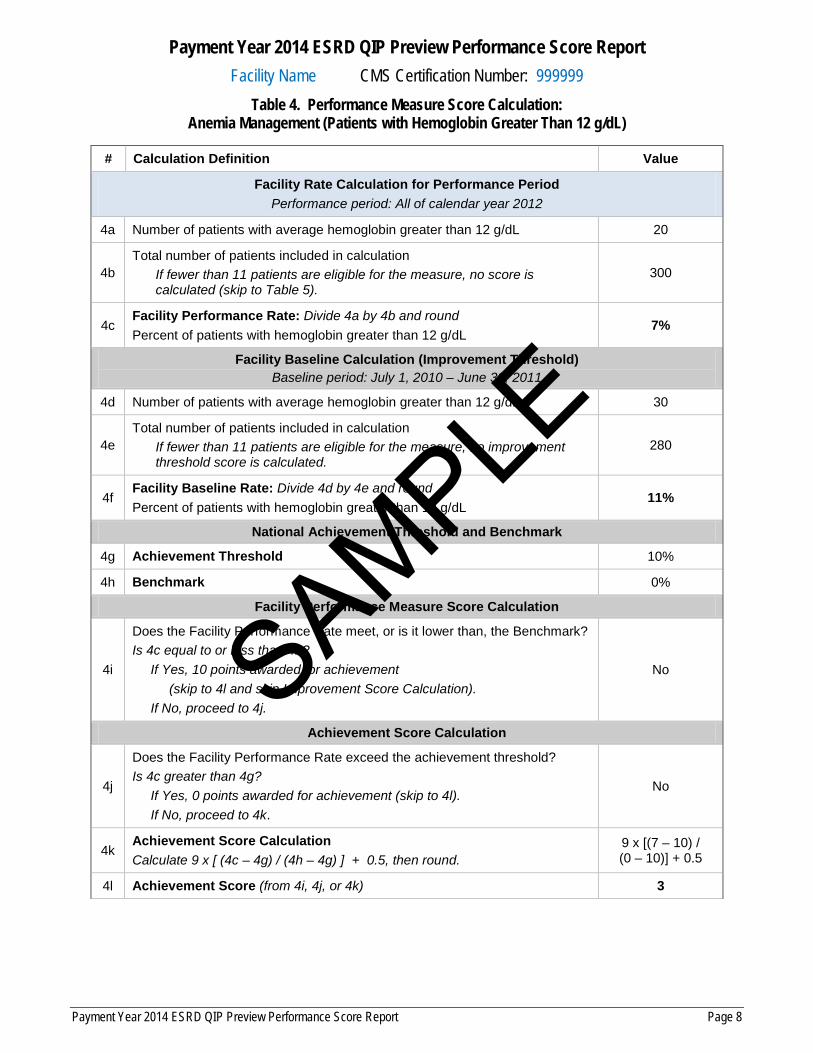
Table 4. Performance Measure Score Calculation: Anemia Management (Patients with Hemoglobin Greater Than 12 g/dL)
# Calculation Definition Value
Facility Rate Calculation for Performance Period Performance period: All of calendar year 2012
4a Number of patients with average hemoglobin greater than 12 g/dL 20
4b Total number of patients included in calculation
If fewer than 11 patients are eligible for the measure, no score is calculated (skip to Table 5).
300
4c Facility Performance Rate: Divide 4a by 4b and round Percent of patients with hemoglobin greater than 12 g/dL
7%
Facility Baseline Calculation (Improvement Threshold) Baseline period: July 1, 2010 – June 30, 2011
4d Number of patients with average hemoglobin greater than 12 g/dL 30
4e Total number of patients included in calculation
If fewer than 11 patients are eligible for the measure, no improvement threshold score is calculated.
280
4f Facility Baseline Rate: Divide 4d by 4e and round Percent of patients with hemoglobin greater than 12 g/dL
11%
National Achievement Threshold and Benchmark
4g Achievement Threshold 10%
4h Benchmark 0%
Facility Performance Measure Score Calculation
4i
Does the Facility Performance Rate meet, or is it lower than, the Benchmark? Is 4c equal to or less than 4h? If Yes, 10 points awarded for achievement (skip to 4l and skip Improvement Score Calculation). If No, proceed to 4j.
No
Achievement Score Calculation
4j
Does the Facility Performance Rate exceed the achievement threshold? Is 4c greater than 4g? If Yes, 0 points awarded for achievement (skip to 4l). If No, proceed to 4k.
No
4k Achievement Score Calculation Calculate 9 x [ (4c – 4g) / (4h – 4g) ] + 0.5, then round.
9 x [(7 – 10) / (0 – 10)] + 0.5
4l Achievement Score (from 4i, 4j, or 4k) 3
SAMPLE
Payment Year 2014 ESRD QIP Preview Performance Score Report Facility Name CMS Certification Number: 999999
Payment Year 2014 ESRD QIP Preview Performance Score Report Page 9
# Calculation Definition Value
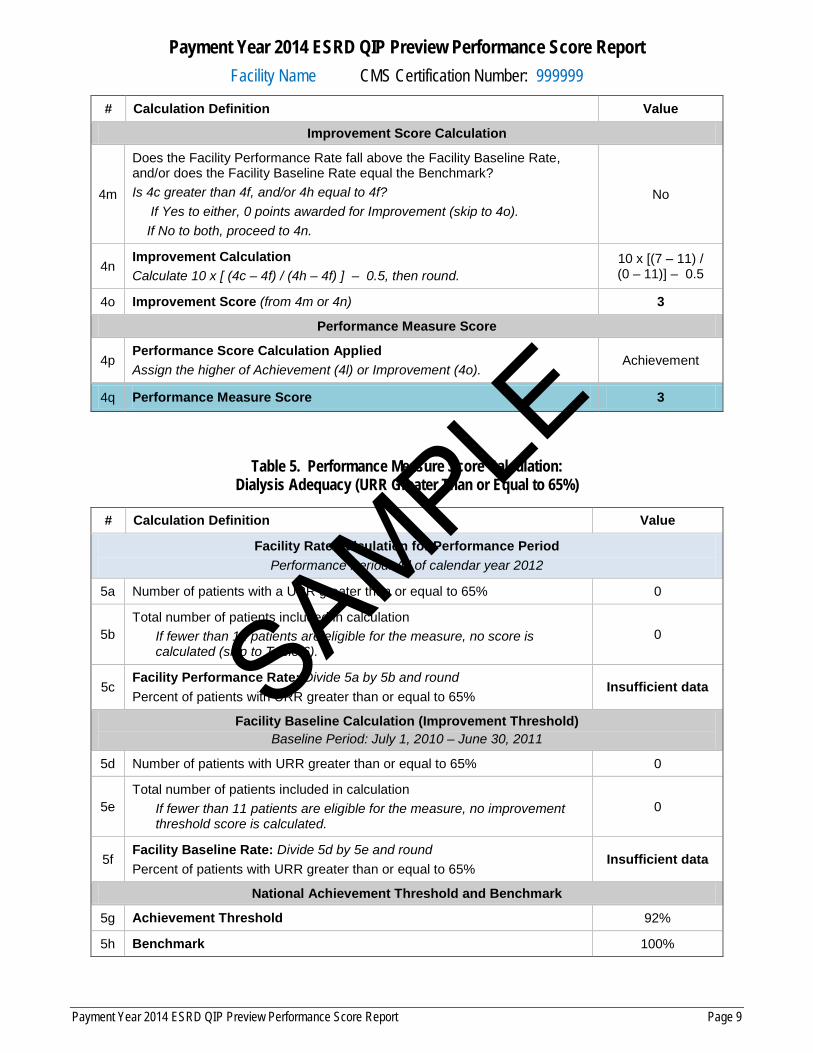
Improvement Score Calculation
4m
Does the Facility Performance Rate fall above the Facility Baseline Rate, and/or does the Facility Baseline Rate equal the Benchmark? Is 4c greater than 4f, and/or 4h equal to 4f? If Yes to either, 0 points awarded for Improvement (skip to 4o). If No to both, proceed to 4n.
No
4n Improvement Calculation Calculate 10 x [ (4c – 4f) / (4h – 4f) ] – 0.5, then round.
10 x [(7 – 11) / (0 – 11)] – 0.5
4o Improvement Score (from 4m or 4n) 3
Performance Measure Score
4p Performance Score Calculation Applied Assign the higher of Achievement (4l) or Improvement (4o).
Achievement
4q Performance Measure Score 3
Table 5. Performance Measure Score Calculation: Dialysis Adequacy (URR Greater Than or Equal to 65%)
# Calculation Definition Value
Facility Rate Calculation for Performance Period Performance Period: All of calendar year 2012
5a Number of patients with a URR greater than or equal to 65% 0
5b Total number of patients included in calculation
If fewer than 11 patients are eligible for the measure, no score is calculated (skip to Table 6).
0
5c Facility Performance Rate: Divide 5a by 5b and round Percent of patients with URR greater than or equal to 65%
Insufficient data
Facility Baseline Calculation (Improvement Threshold) Baseline Period: July 1, 2010 – June 30, 2011
5d Number of patients with URR greater than or equal to 65% 0
5e Total number of patients included in calculation
If fewer than 11 patients are eligible for the measure, no improvement threshold score is calculated.
0
5f Facility Baseline Rate: Divide 5d by 5e and round Percent of patients with URR greater than or equal to 65%
Insufficient data
National Achievement Threshold and Benchmark
5g Achievement Threshold 92%
5h Benchmark 100%
SAMPLE
Payment Year 2014 ESRD QIP Preview Performance Score Report Facility Name CMS Certification Number: 999999
Payment Year 2014 ESRD QIP Preview Performance Score Report Page 10
# Calculation Definition Value
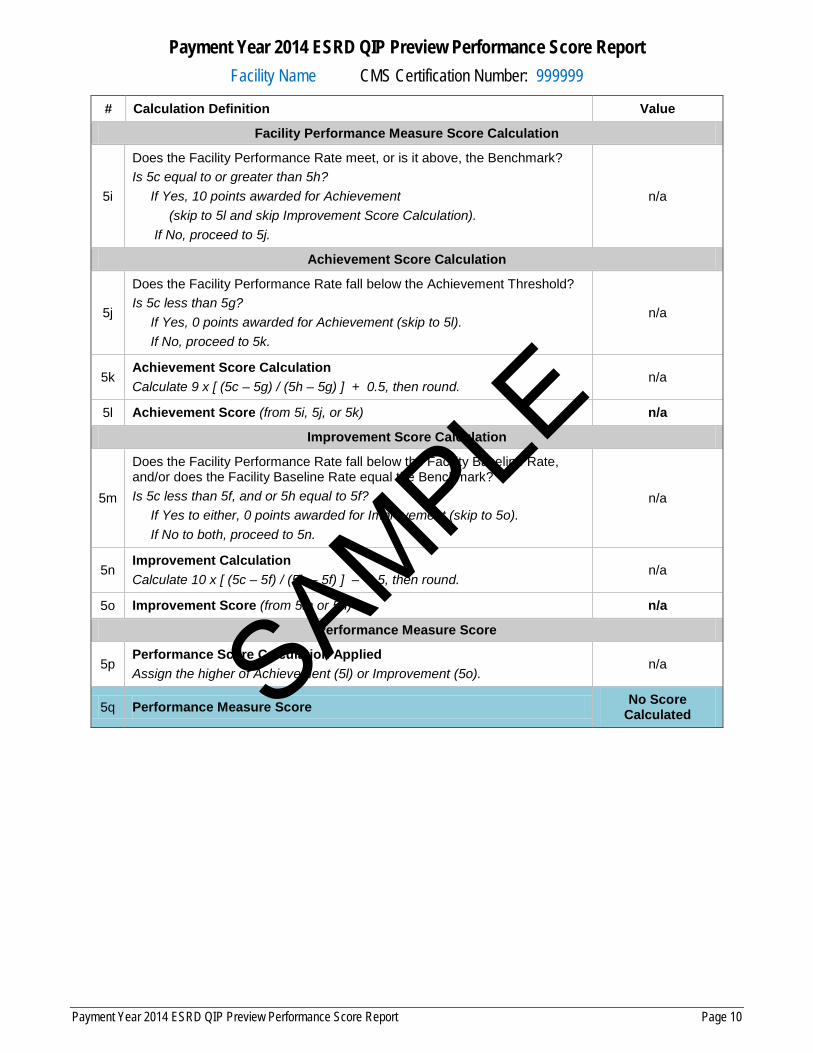
Facility Performance Measure Score Calculation
5i
Does the Facility Performance Rate meet, or is it above, the Benchmark? Is 5c equal to or greater than 5h? If Yes, 10 points awarded for Achievement (skip to 5l and skip Improvement Score Calculation). If No, proceed to 5j.
n/a
Achievement Score Calculation
5j
Does the Facility Performance Rate fall below the Achievement Threshold? Is 5c less than 5g? If Yes, 0 points awarded for Achievement (skip to 5l). If No, proceed to 5k.
n/a
5k Achievement Score Calculation Calculate 9 x [ (5c – 5g) / (5h – 5g) ] + 0.5, then round.
n/a
5l Achievement Score (from 5i, 5j, or 5k) n/a
Improvement Score Calculation
5m
Does the Facility Performance Rate fall below the Facility Baseline Rate, and/or does the Facility Baseline Rate equal the Benchmark? Is 5c less than 5f, and or 5h equal to 5f? If Yes to either, 0 points awarded for Improvement (skip to 5o). If No to both, proceed to 5n.
n/a
5n Improvement Calculation Calculate 10 x [ (5c – 5f) / (5h – 5f) ] – 0.5, then round.
n/a
5o Improvement Score (from 5m or 5n) n/a
Performance Measure Score
5p Performance Score Calculation Applied Assign the higher of Achievement (5l) or Improvement (5o).
n/a
5q Performance Measure Score No Score Calculated
SAMPLE
Payment Year 2014 ESRD QIP Preview Performance Score Report Facility Name CMS Certification Number: 999999
Payment Year 2014 ESRD QIP Preview Performance Score Report Page 11
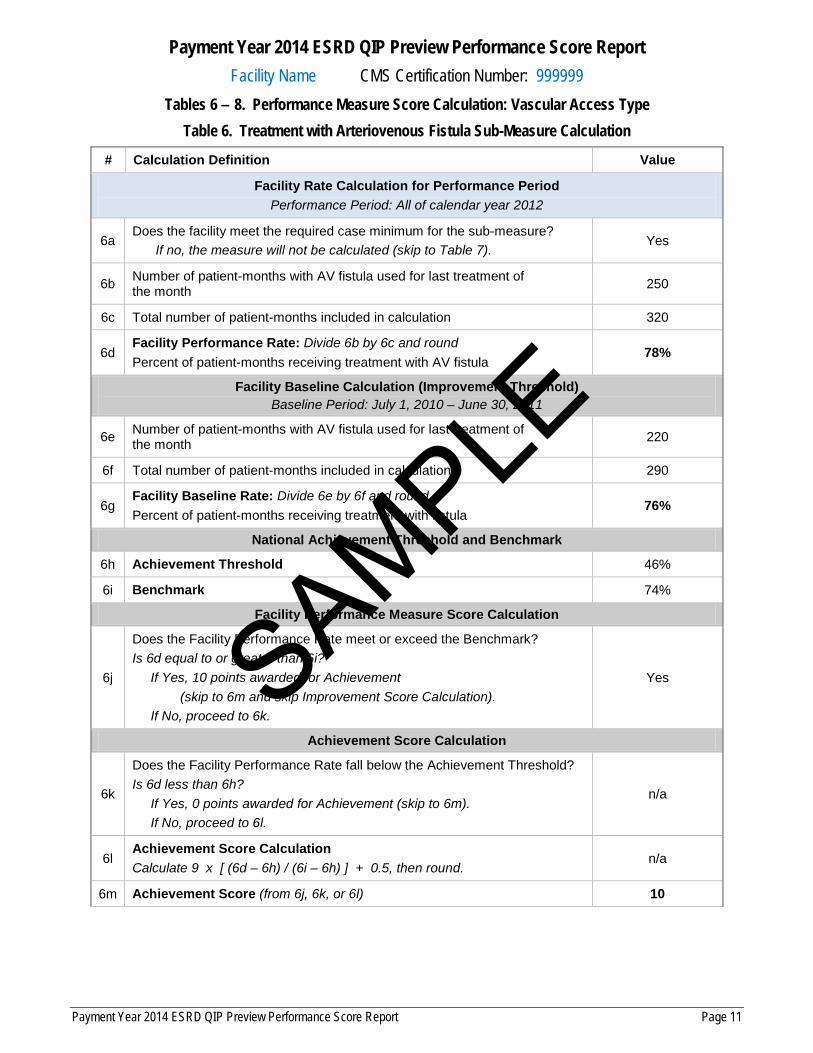
Tables 6 – 8. Performance Measure Score Calculation: Vascular Access Type Table 6. Treatment with Arteriovenous Fistula Sub-Measure Calculation
# Calculation Definition Value
Facility Rate Calculation for Performance Period Performance Period: All of calendar year 2012
6a Does the facility meet the required case minimum for the sub-measure?
If no, the measure will not be calculated (skip to Table 7). Yes
6b Number of patient-months with AV fistula used for last treatment of the month 250
6c Total number of patient-months included in calculation 320
6d Facility Performance Rate: Divide 6b by 6c and round Percent of patient-months receiving treatment with AV fistula
78%
Facility Baseline Calculation (Improvement Threshold) Baseline Period: July 1, 2010 – June 30, 2011
6e Number of patient-months with AV fistula used for last treatment of the month 220
6f Total number of patient-months included in calculation 290
6g Facility Baseline Rate: Divide 6e by 6f and round Percent of patient-months receiving treatment with fistula
76%
National Achievement Threshold and Benchmark
6h Achievement Threshold 46%
6i Benchmark 74%
Facility Performance Measure Score Calculation
6j
Does the Facility Performance Rate meet or exceed the Benchmark? Is 6d equal to or greater than 6i? If Yes, 10 points awarded for Achievement (skip to 6m and skip Improvement Score Calculation). If No, proceed to 6k.
Yes
Achievement Score Calculation
6k
Does the Facility Performance Rate fall below the Achievement Threshold? Is 6d less than 6h? If Yes, 0 points awarded for Achievement (skip to 6m). If No, proceed to 6l.
n/a
6l Achievement Score Calculation Calculate 9 x [ (6d – 6h) / (6i – 6h) ] + 0.5, then round.
n/a
6m Achievement Score (from 6j, 6k, or 6l) 10
SAMPLE

Payment Year 2014 ESRD QIP Preview Performance Score Report Facility Name CMS Certification Number: 999999
Payment Year 2014 ESRD QIP Preview Performance Score Report Page 12
# Calculation Definition Value
Improvement Score Calculation
6n
Does the Facility Performance Rate fall below the Facility Baseline Rate, and/or does the Facility Baseline Rate equal the Benchmark? Is 6d less than 6g, and/or 6i equal to 6g? If Yes to either, 0 points awarded for Improvement (skip to 6p). If No to both, proceed to 6o.
n/a
6o Improvement Calculation Calculate 10 x [ (6d – 6g) / (6i – 6g) ] – 0.5, then round.
n/a
6p Improvement Score (from 6n or 6o) n/a
Performance Sub-Measure Score
6q Performance Score Calculation Applied Assign the higher of Achievement (6m) or Improvement (6n). Achievement
6r Performance Sub-Measure Score 10
Table 7. Treatment with Catheter Sub-Measure Calculation
# Calculation Definition Value
Facility Rate Calculation for Performance Period Performance Period: All of calendar year 2012
7a Does the facility meet the required case minimum for the sub-measure?
If no, the measure will not be calculated (skip to Table 8). Yes
7b Number of patient-months with catheter in use for at least 90 days 70
7c Total number of patient-months included in calculation 320
7d Facility Performance Rate: Divide 7b by 7c and round Percent of patient-months with catheter in use for at least 90 days
22%
Facility Baseline Calculation (Improvement Threshold) Baseline Period: July 1, 2010 – June 30, 2011
7e Number of patient-months with catheter in use for at least 90 days 70
7f Total number of patient-months included in calculation 290
7g Facility Baseline Rate: Divide 7e by 7f and round Percent of patient-months with catheter in use for at least 90 days
24%
National Achievement Threshold and Benchmark
7h Achievement Threshold 24%
7i Benchmark 5%
SAMPLE
Payment Year 2014 ESRD QIP Preview Performance Score Report Facility Name CMS Certification Number: 999999
Payment Year 2014 ESRD QIP Preview Performance Score Report Page 13
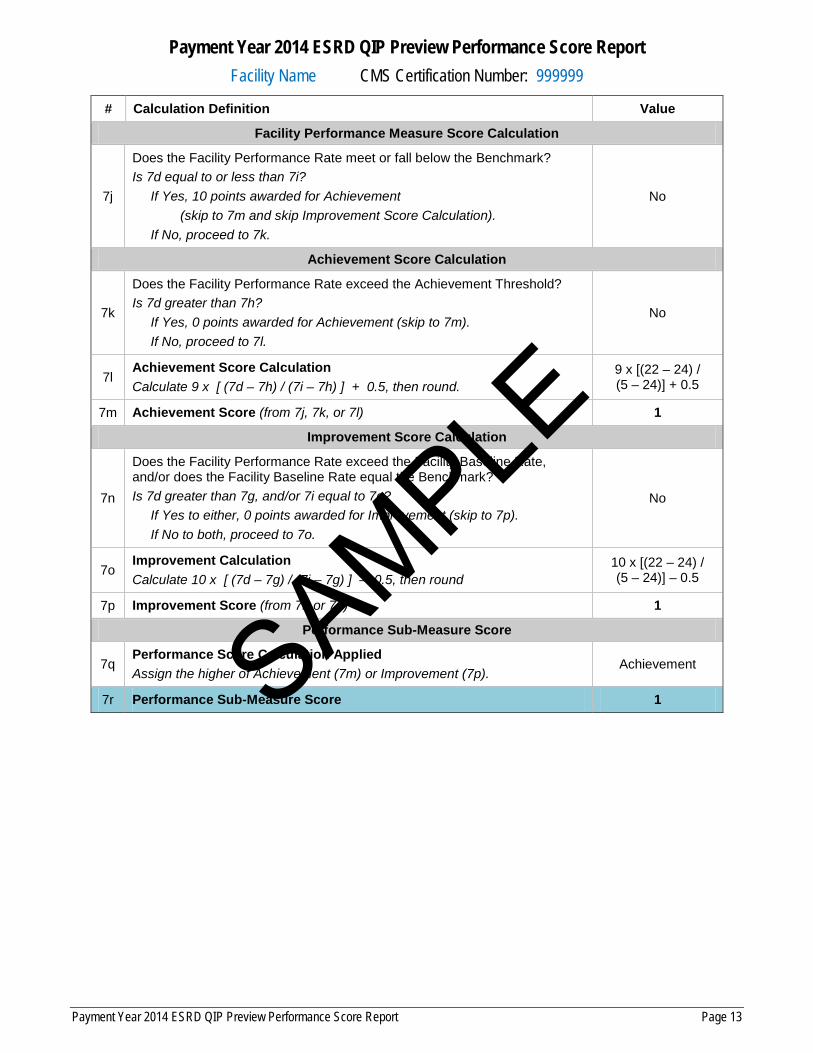
# Calculation Definition Value
Facility Performance Measure Score Calculation
7j
Does the Facility Performance Rate meet or fall below the Benchmark? Is 7d equal to or less than 7i? If Yes, 10 points awarded for Achievement (skip to 7m and skip Improvement Score Calculation). If No, proceed to 7k.
No
Achievement Score Calculation
7k
Does the Facility Performance Rate exceed the Achievement Threshold? Is 7d greater than 7h? If Yes, 0 points awarded for Achievement (skip to 7m). If No, proceed to 7l.
No
7l Achievement Score Calculation Calculate 9 x [ (7d – 7h) / (7i – 7h) ] + 0.5, then round.
9 x [(22 – 24) / (5 – 24)] + 0.5
7m Achievement Score (from 7j, 7k, or 7l) 1
Improvement Score Calculation
7n
Does the Facility Performance Rate exceed the Facility Baseline Rate, and/or does the Facility Baseline Rate equal the Benchmark? Is 7d greater than 7g, and/or 7i equal to 7g? If Yes to either, 0 points awarded for Improvement (skip to 7p). If No to both, proceed to 7o.
No
7o Improvement Calculation Calculate 10 x [ (7d – 7g) / (7i – 7g) ] – 0.5, then round
10 x [(22 – 24) / (5 – 24)] – 0.5
7p Improvement Score (from 7n or 7o) 1
Performance Sub-Measure Score
7q Performance Score Calculation Applied Assign the higher of Achievement (7m) or Improvement (7p).
Achievement
7r Performance Sub-Measure Score 1
SAMPLE
Payment Year 2014 ESRD QIP Preview Performance Score Report Facility Name CMS Certification Number: 999999
Payment Year 2014 ESRD QIP Preview Performance Score Report Page 14
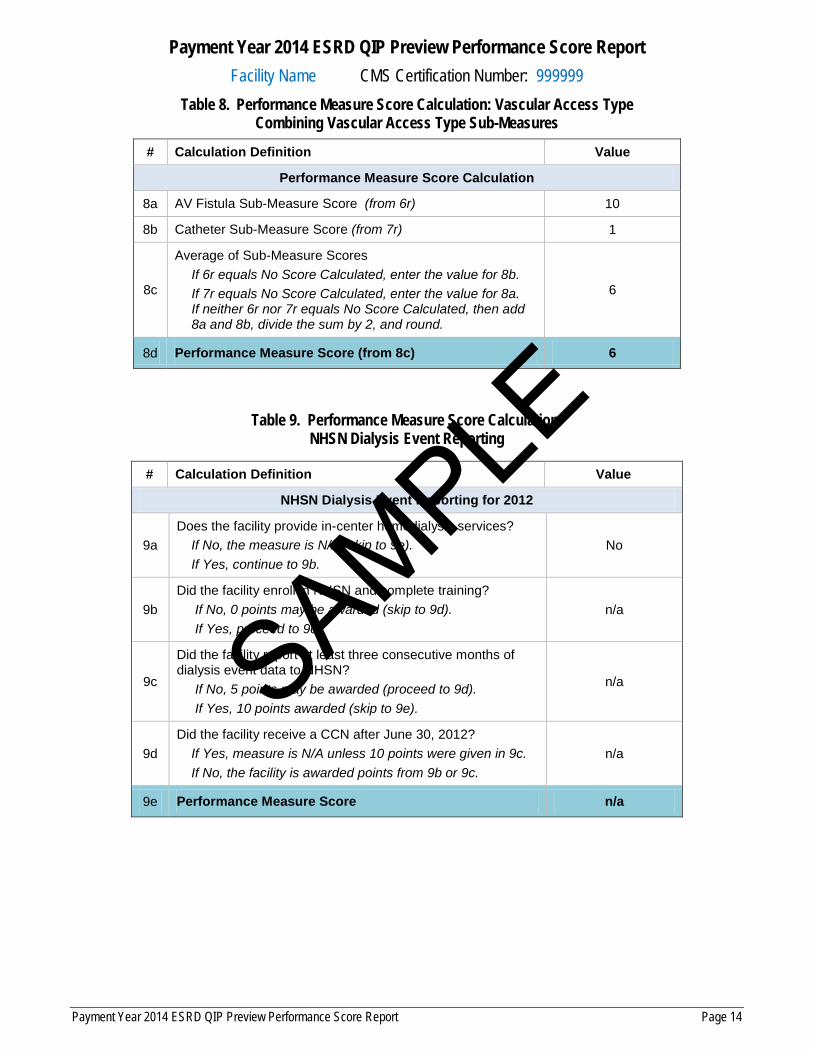
Table 8. Performance Measure Score Calculation: Vascular Access Type Combining Vascular Access Type Sub-Measures
# Calculation Definition Value
Performance Measure Score Calculation
8a AV Fistula Sub-Measure Score (from 6r) 10
8b Catheter Sub-Measure Score (from 7r) 1
8c
Average of Sub-Measure Scores If 6r equals No Score Calculated, enter the value for 8b. If 7r equals No Score Calculated, enter the value for 8a. If neither 6r nor 7r equals No Score Calculated, then add 8a and 8b, divide the sum by 2, and round.
6
8d Performance Measure Score (from 8c) 6
Table 9. Performance Measure Score Calculation: NHSN Dialysis Event Reporting
# Calculation Definition Value
NHSN Dialysis Event Reporting for 2012
9a Does the facility provide in-center hemodialysis services? If No, the measure is N/A (skip to 9e). If Yes, continue to 9b.
No
9b Did the facility enroll in NHSN and complete training? If No, 0 points may be awarded (skip to 9d). If Yes, proceed to 9c.
n/a
9c
Did the facility report at least three consecutive months of dialysis event data to NHSN? If No, 5 points may be awarded (proceed to 9d). If Yes, 10 points awarded (skip to 9e).
n/a
9d Did the facility receive a CCN after June 30, 2012? If Yes, measure is N/A unless 10 points were given in 9c. If No, the facility is awarded points from 9b or 9c.
n/a
9e Performance Measure Score n/a
SAMPLE
Payment Year 2014 ESRD QIP Preview Performance Score Report Facility Name CMS Certification Number: 999999
Payment Year 2014 ESRD QIP Preview Performance Score Report Page 15
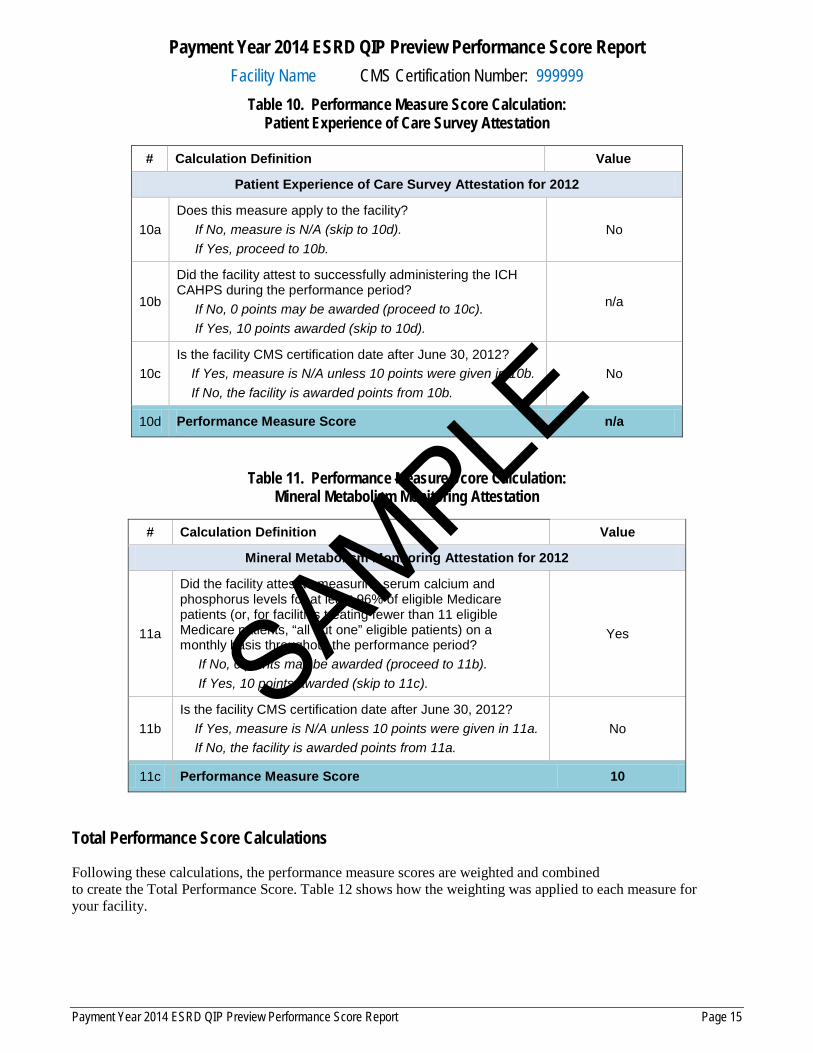
Table 10. Performance Measure Score Calculation: Patient Experience of Care Survey Attestation
# Calculation Definition Value
Patient Experience of Care Survey Attestation for 2012
10a Does this measure apply to the facility? If No, measure is N/A (skip to 10d). If Yes, proceed to 10b.
No
10b
Did the facility attest to successfully administering the ICH CAHPS during the performance period? If No, 0 points may be awarded (proceed to 10c). If Yes, 10 points awarded (skip to 10d).
n/a
10c Is the facility CMS certification date after June 30, 2012? If Yes, measure is N/A unless 10 points were given in 10b. If No, the facility is awarded points from 10b.
No
10d Performance Measure Score n/a
Table 11. Performance Measure Score Calculation: Mineral Metabolism Monitoring Attestation
# Calculation Definition Value
Mineral Metabolism Monitoring Attestation for 2012
11a
Did the facility attest to measuring serum calcium and phosphorus levels for at least 96% of eligible Medicare patients (or, for facilities treating fewer than 11 eligible Medicare patients, “all but one” eligible patients) on a monthly basis throughout the performance period? If No, 0 points may be awarded (proceed to 11b). If Yes, 10 points awarded (skip to 11c).
Yes
11b Is the facility CMS certification date after June 30, 2012? If Yes, measure is N/A unless 10 points were given in 11a. If No, the facility is awarded points from 11a.
No
11c Performance Measure Score 10
Total Performance Score Calculations
Following these calculations, the performance measure scores are weighted and combined to create the Total Performance Score. Table 12 shows how the weighting was applied to each measure for your facility.
SAMPLE
Payment Year 2014 ESRD QIP Preview Performance Score Report Facility Name CMS Certification Number: 999999
Payment Year 2014 ESRD QIP Preview Performance Score Report Page 16
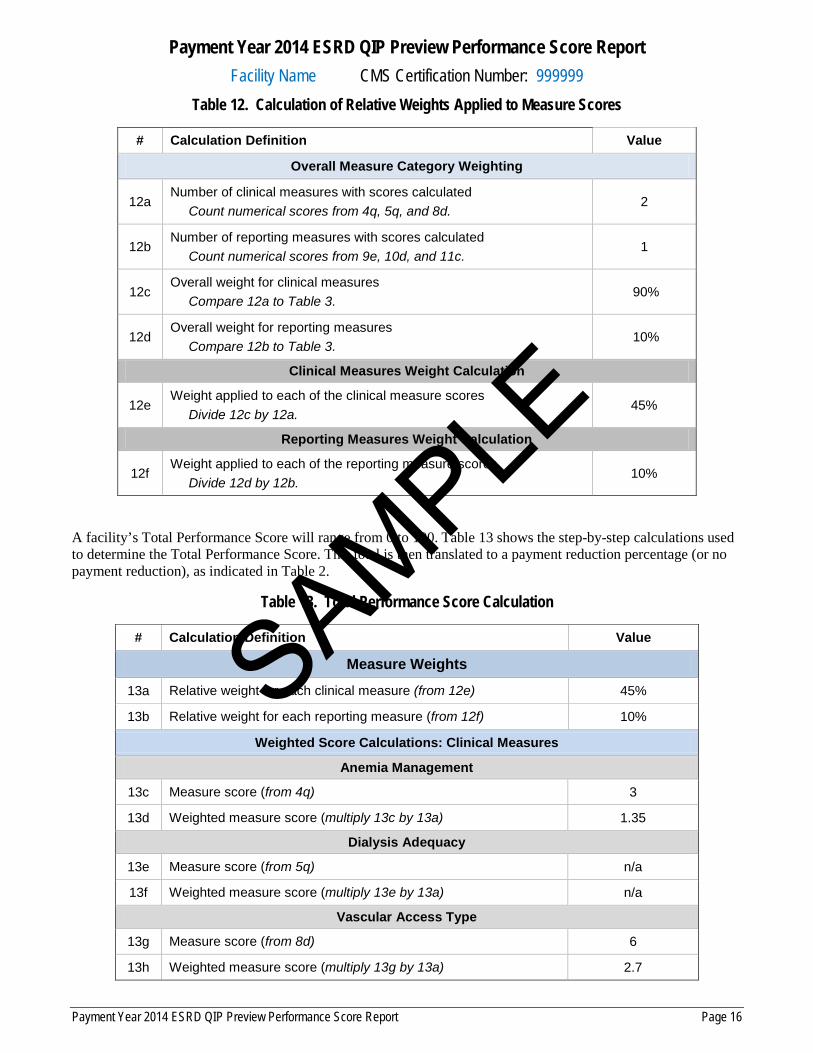
Table 12. Calculation of Relative Weights Applied to Measure Scores
# Calculation Definition Value
Overall Measure Category Weighting
12a Number of clinical measures with scores calculated Count numerical scores from 4q, 5q, and 8d.
2
12b Number of reporting measures with scores calculated Count numerical scores from 9e, 10d, and 11c.
1
12c Overall weight for clinical measures Compare 12a to Table 3.
90%
12d Overall weight for reporting measures Compare 12b to Table 3.
10%
Clinical Measures Weight Calculation
12e Weight applied to each of the clinical measure scores Divide 12c by 12a.
45%
Reporting Measures Weight Calculation
12f Weight applied to each of the reporting measure scores Divide 12d by 12b.
10%
A facility’s Total Performance Score will range from 0 to 100. Table 13 shows the step-by-step calculations used to determine the Total Performance Score. This total is then translated to a payment reduction percentage (or no payment reduction), as indicated in Table 2.
Table 13. Total Performance Score Calculation
# Calculation Definition Value
Measure Weights
13a Relative weight for each clinical measure (from 12e) 45%
13b Relative weight for each reporting measure (from 12f) 10%
Weighted Score Calculations: Clinical Measures
Anemia Management
13c Measure score (from 4q) 3
13d Weighted measure score (multiply 13c by 13a) 1.35
Dialysis Adequacy
13e Measure score (from 5q) n/a
13f Weighted measure score (multiply 13e by 13a) n/a
Vascular Access Type
13g Measure score (from 8d) 6
13h Weighted measure score (multiply 13g by 13a) 2.7
SAMPLE
Payment Year 2014 ESRD QIP Preview Performance Score Report Facility Name CMS Certification Number: 999999
Payment Year 2014 ESRD QIP Preview Performance Score Report Page 17
# Calculation Definition Value
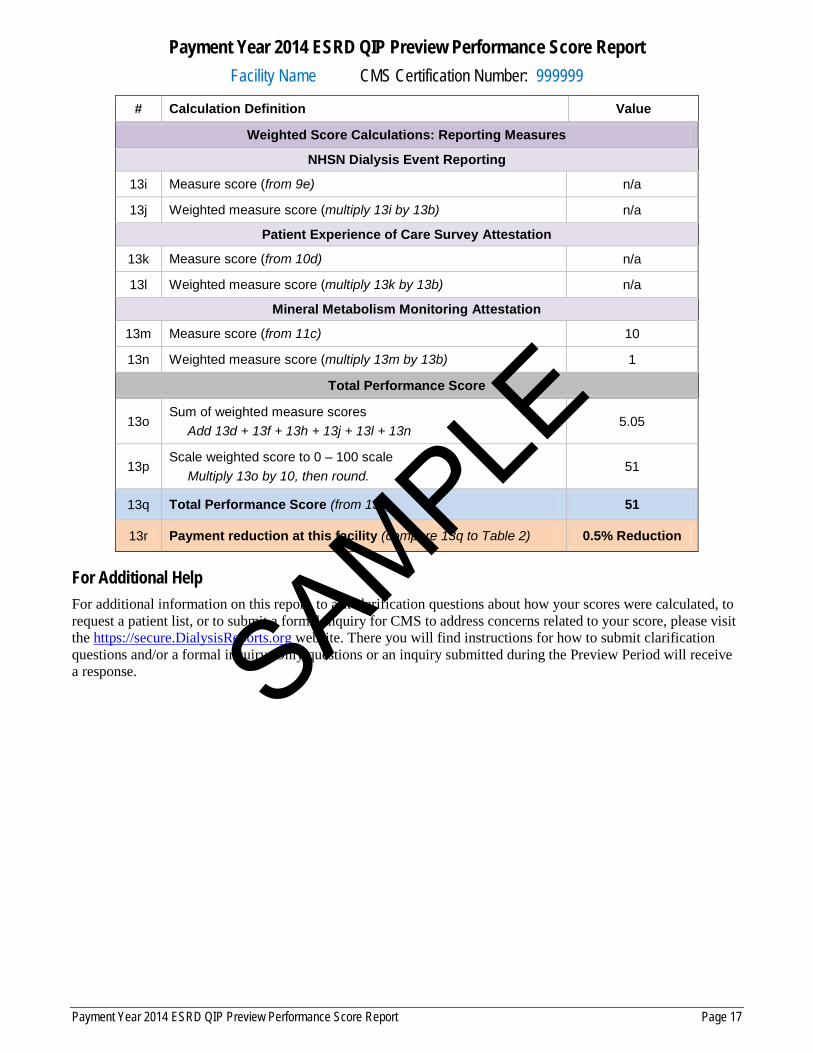
Weighted Score Calculations: Reporting Measures
NHSN Dialysis Event Reporting
13i Measure score (from 9e) n/a
13j Weighted measure score (multiply 13i by 13b) n/a
Patient Experience of Care Survey Attestation
13k Measure score (from 10d) n/a
13l Weighted measure score (multiply 13k by 13b) n/a
Mineral Metabolism Monitoring Attestation
13m Measure score (from 11c) 10
13n Weighted measure score (multiply 13m by 13b) 1
Total Performance Score
13o Sum of weighted measure scores Add 13d + 13f + 13h + 13j + 13l + 13n
5.05
13p Scale weighted score to 0 – 100 scale Multiply 13o by 10, then round.
51
13q Total Performance Score (from 13p) 51
13r Payment reduction at this facility (compare 13q to Table 2) 0.5% Reduction
For Additional Help For additional information on this report, to ask clarification questions about how your scores were calculated, to request a patient list, or to submit a formal inquiry for CMS to address concerns related to your score, please visit the https://secure.DialysisReports.org website. There you will find instructions for how to submit clarification questions and/or a formal inquiry. Only questions or an inquiry submitted during the Preview Period will receive a response.
SAMPLE

Payment Year 2014 ESRD QIP Preview Performance Score Report Facility Name CMS Certification Number: 999999
Payment Year 2014 ESRD QIP Preview Performance Score Report Page 18
Key Terms
Term Definition
Achievement Range In calculating clinical measure scores, a scale that runs from the achievement threshold to the benchmark.
Achievement Score
Clinical score comparing the facility’s performance during the performance period to the performance of all other facilities during the baseline period.
Achievement Threshold
The 15th percentile of performance rates nationally during the baseline period.
Baseline Period Range of time (usually a full year) used to gather data and determine the rates against which a facility’s rates during the performance period are compared for the purposes of measure scoring.
Benchmark The 90th percentile of performance rates nationally during the baseline period.
Clarification Question(s)
A question that you may submit to CMS to obtain more information about how your facility’s scores were calculated.
Clinical Measure A measure that scores facilities based on the quality of services provided to patients with ESRD with regard to anemia management, dialysis adequacy, and vascular access. Clinical measures are scored based on facility achievement and improvement alike.
CMS Certification Number (CCN)
A number assigned to a facility for billing and administrative purposes. Each facility has a primary CCN but may potentially submit claims under alternate CCNs. The CCN is sometimes referred to as the billing number, provider number, or Online Survey Certification and Reporting System (OSCAR) number.
Facility Medicare-certified entity that provides outpatient dialysis for ESRD beneficiaries.
Formal Inquiry The submission of evidence to CMS with a specific explanation or evidence of why you believe that an error occurred in the calculation of your scores. A facility may only submit one formal inquiry during the Preview Period.
SAMPLE
Payment Year 2014 ESRD QIP Preview Performance Score Report Facility Name CMS Certification Number: 999999
Payment Year 2014 ESRD QIP Preview Performance Score Report Page 19
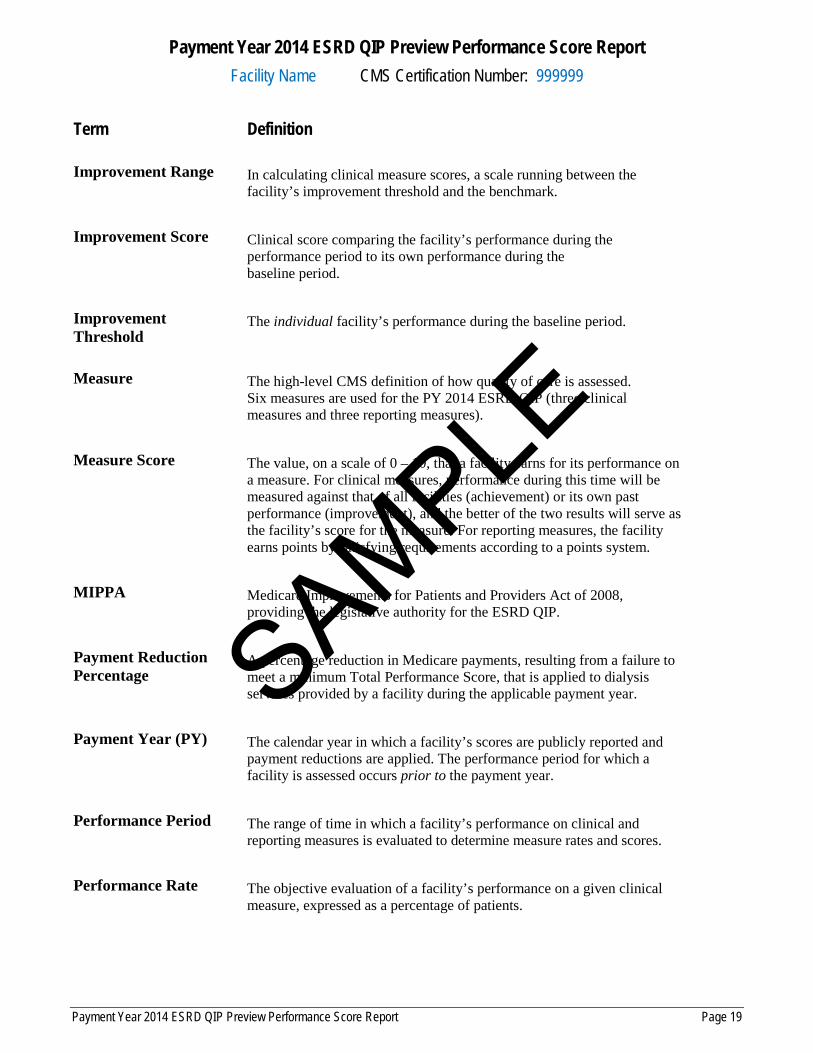
Term Definition
Improvement Range In calculating clinical measure scores, a scale running between the facility’s improvement threshold and the benchmark.
Improvement Score Clinical score comparing the facility’s performance during the performance period to its own performance during the baseline period.
Improvement Threshold
The individual facility’s performance during the baseline period.
Measure The high-level CMS definition of how quality of care is assessed. Six measures are used for the PY 2014 ESRD QIP (three clinical measures and three reporting measures).
Measure Score The value, on a scale of 0 – 10, that a facility earns for its performance on a measure. For clinical measures, performance during this time will be measured against that of all facilities (achievement) or its own past performance (improvement), and the better of the two results will serve as the facility’s score for the measure. For reporting measures, the facility earns points by satisfying requirements according to a points system.
MIPPA Medicare Improvements for Patients and Providers Act of 2008, providing the legislative authority for the ESRD QIP.
Payment Reduction Percentage
A percentage reduction in Medicare payments, resulting from a failure to meet a minimum Total Performance Score, that is applied to dialysis services provided by a facility during the applicable payment year.
Payment Year (PY) The calendar year in which a facility’s scores are publicly reported and payment reductions are applied. The performance period for which a facility is assessed occurs prior to the payment year.
Performance Period The range of time in which a facility’s performance on clinical and reporting measures is evaluated to determine measure rates and scores.
Performance Rate The objective evaluation of a facility’s performance on a given clinical measure, expressed as a percentage of patients.
SAMPLE

Payment Year 2014 ESRD QIP Preview Performance Score Report Facility Name CMS Certification Number: 999999
Payment Year 2014 ESRD QIP Preview Performance Score Report Page 20
Term Definition
Performance Score Certificate (PSC)
A document produced for the general public for each facility that summarizes the facility’s ESRD QIP performance information. The certificate must be posted in a location visible to the facility’s patients for all of calendar year 2014.
Preview Period The 30-day period when facilities may review calculations related to their performance scores and projected payment reduction percentage and submit questions to CMS about these calculations. A facility may submit requests for technical assistance in using the website, clarification questions to better understand how its score(s) were calculated, or one formal inquiry to address concerns about its score(s).
Reporting Measure A measure that scores facilities based on whether they provided particular data during the performance period with regard to infections, the conduct of patient-satisfaction surveys, and mineral metabolism. Reporting measures in the ESRD QIP are designed to provide data upon which the program can establish future clinical measures, including the calculation of performance standards, benchmarks, and achievement thresholds.
Total Performance Score
The aggregate, weighted score of all measure scores for a year. The Total Performance Score is calculated using a weighting system that reflects the facility’s performance on the measures as well as CMS’s judgment regarding the importance of each measure.
SAMPLE
Payment Year 2014 ESRD QIP Preview Performance Score Report Facility Name CMS Certification Number: 999999
Payment Year 2014 ESRD QIP Preview Performance Score Report Page 21
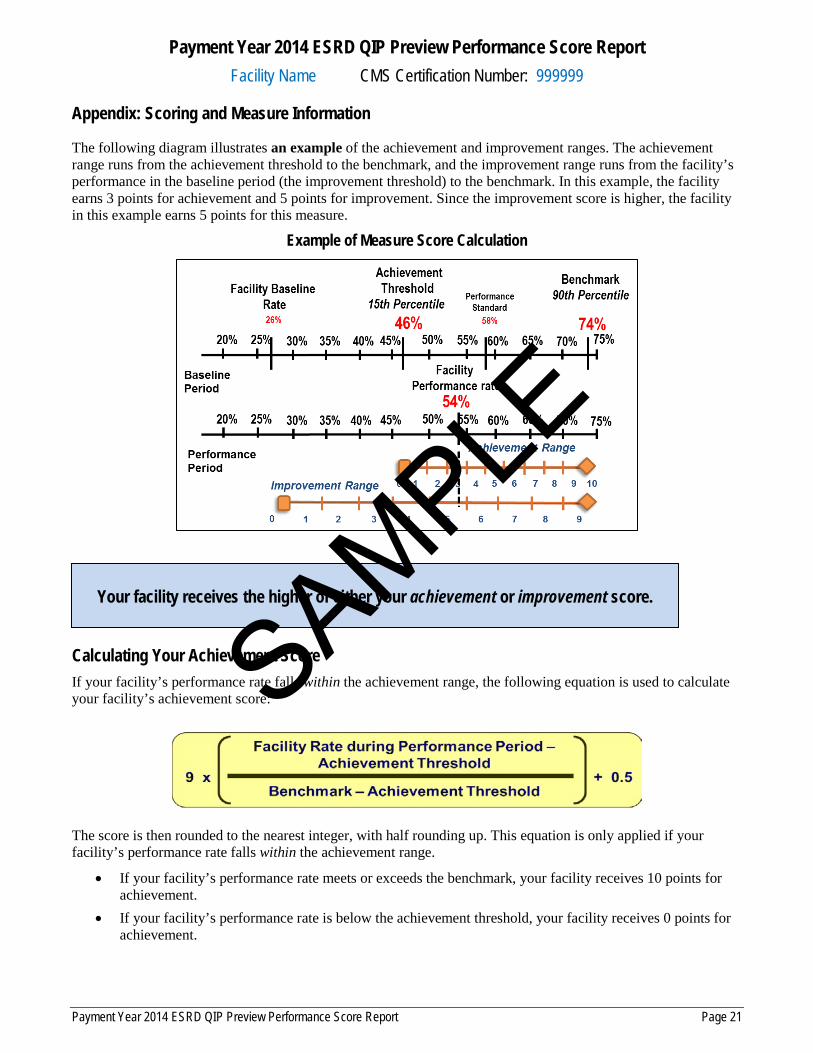
Appendix: Scoring and Measure Information
The following diagram illustrates an example of the achievement and improvement ranges. The achievement range runs from the achievement threshold to the benchmark, and the improvement range runs from the facility’s performance in the baseline period (the improvement threshold) to the benchmark. In this example, the facility earns 3 points for achievement and 5 points for improvement. Since the improvement score is higher, the facility in this example earns 5 points for this measure.
Example of Measure Score Calculation
Calculating Your Achievement Score If your facility’s performance rate falls within the achievement range, the following equation is used to calculate your facility’s achievement score:
The score is then rounded to the nearest integer, with half rounding up. This equation is only applied if your facility’s performance rate falls within the achievement range.
• If your facility’s performance rate meets or exceeds the benchmark, your facility receives 10 points for achievement.
• If your facility’s performance rate is below the achievement threshold, your facility receives 0 points for achievement.
Your facility receives the higher of either your achievement or improvement score.
SAMPLE
Payment Year 2014 ESRD QIP Preview Performance Score Report Facility Name CMS Certification Number: 999999
Payment Year 2014 ESRD QIP Preview Performance Score Report Page 22
• If your facility’s performance rate falls between the achievement threshold and the benchmark, your facility score is calculated using the equation above, resulting in an achievement score of 1 to 10.
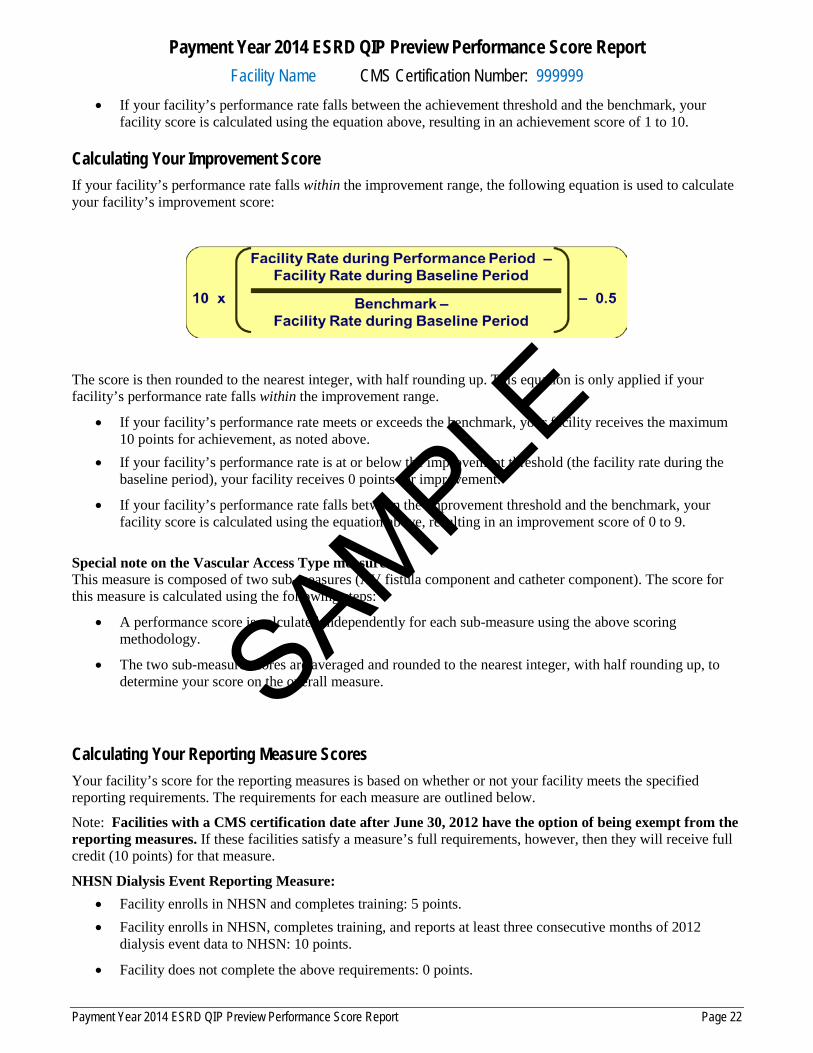
Calculating Your Improvement Score If your facility’s performance rate falls within the improvement range, the following equation is used to calculate your facility’s improvement score:
The score is then rounded to the nearest integer, with half rounding up. This equation is only applied if your facility’s performance rate falls within the improvement range.
• If your facility’s performance rate meets or exceeds the benchmark, your facility receives the maximum 10 points for achievement, as noted above.
• If your facility’s performance rate is at or below the improvement threshold (the facility rate during the baseline period), your facility receives 0 points for improvement.
• If your facility’s performance rate falls between the improvement threshold and the benchmark, your facility score is calculated using the equation above, resulting in an improvement score of 0 to 9.
Special note on the Vascular Access Type measure: This measure is composed of two sub-measures (AV fistula component and catheter component). The score for this measure is calculated using the following steps:
• A performance score is calculated independently for each sub-measure using the above scoring methodology.
• The two sub-measure scores are averaged and rounded to the nearest integer, with half rounding up, to determine your score on the overall measure.
Calculating Your Reporting Measure Scores Your facility’s score for the reporting measures is based on whether or not your facility meets the specified reporting requirements. The requirements for each measure are outlined below.
Note: Facilities with a CMS certification date after June 30, 2012 have the option of being exempt from the reporting measures. If these facilities satisfy a measure’s full requirements, however, then they will receive full credit (10 points) for that measure.
NHSN Dialysis Event Reporting Measure: • Facility enrolls in NHSN and completes training: 5 points. • Facility enrolls in NHSN, completes training, and reports at least three consecutive months of 2012
dialysis event data to NHSN: 10 points.
• Facility does not complete the above requirements: 0 points.
SAMPLE
Payment Year 2014 ESRD QIP Preview Performance Score Report Facility Name CMS Certification Number: 999999
Payment Year 2014 ESRD QIP Preview Performance Score Report Page 23
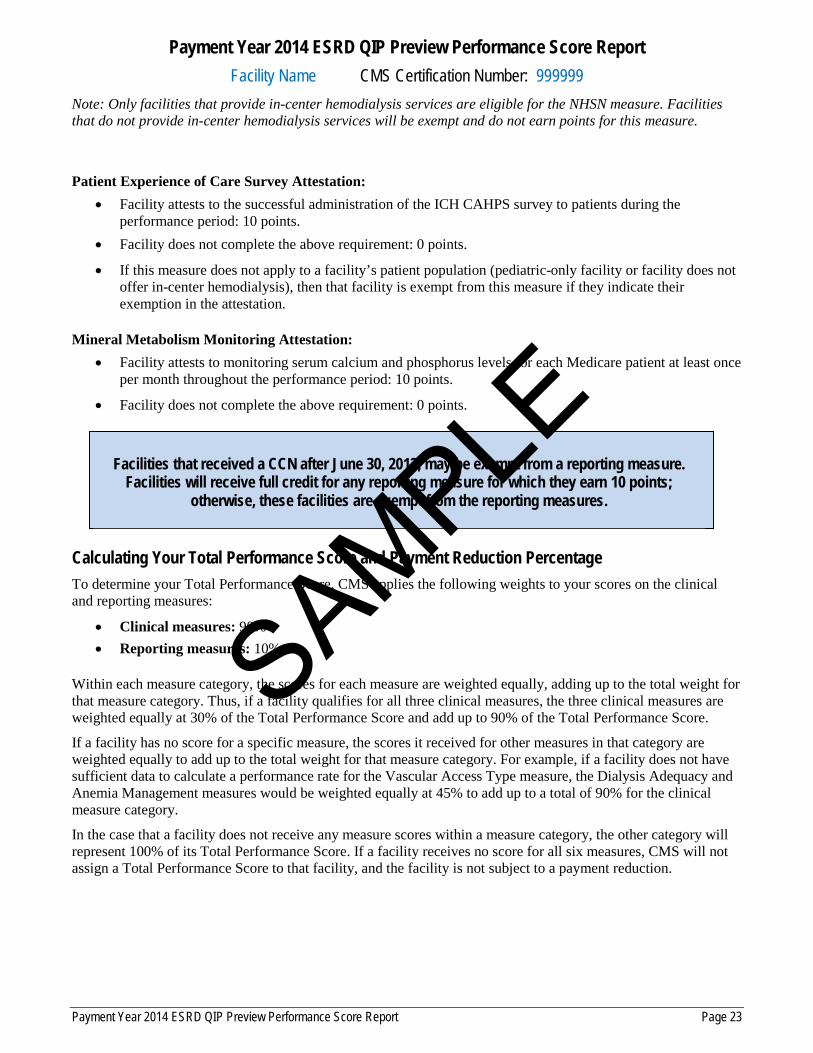
Note: Only facilities that provide in-center hemodialysis services are eligible for the NHSN measure. Facilities that do not provide in-center hemodialysis services will be exempt and do not earn points for this measure.
Patient Experience of Care Survey Attestation: • Facility attests to the successful administration of the ICH CAHPS survey to patients during the
performance period: 10 points. • Facility does not complete the above requirement: 0 points.
• If this measure does not apply to a facility’s patient population (pediatric-only facility or facility does not offer in-center hemodialysis), then that facility is exempt from this measure if they indicate their exemption in the attestation.
Mineral Metabolism Monitoring Attestation: • Facility attests to monitoring serum calcium and phosphorus levels for each Medicare patient at least once
per month throughout the performance period: 10 points.
• Facility does not complete the above requirement: 0 points.
Calculating Your Total Performance Score and Payment Reduction Percentage To determine your Total Performance Score, CMS applies the following weights to your scores on the clinical and reporting measures:
• Clinical measures: 90% • Reporting measures: 10%
Within each measure category, the scores for each measure are weighted equally, adding up to the total weight for that measure category. Thus, if a facility qualifies for all three clinical measures, the three clinical measures are weighted equally at 30% of the Total Performance Score and add up to 90% of the Total Performance Score.
If a facility has no score for a specific measure, the scores it received for other measures in that category are weighted equally to add up to the total weight for that measure category. For example, if a facility does not have sufficient data to calculate a performance rate for the Vascular Access Type measure, the Dialysis Adequacy and Anemia Management measures would be weighted equally at 45% to add up to a total of 90% for the clinical measure category.
In the case that a facility does not receive any measure scores within a measure category, the other category will represent 100% of its Total Performance Score. If a facility receives no score for all six measures, CMS will not assign a Total Performance Score to that facility, and the facility is not subject to a payment reduction.
Facilities that received a CCN after June 30, 2012, may be exempt from a reporting measure. Facilities will receive full credit for any reporting measure for which they earn 10 points;
otherwise, these facilities are exempt from the reporting measures.
SAMPLE