Embed Size (px)
Citation preview

A QUARTER CENTURY HISTORY OF PC PRICES AND QUALITY - PAGE 1 -
PRICE AND QUALITY OF DESKTOP AND MOBILE PERSONAL COMPUTERS:
A QUARTER CENTURY OF HISTORY
by
Ernst R. Berndt, Ellen R. Dulberger and Neal J. Rappaport*
*Professor of Applied Economics, MIT Sloan School of Management and Director, NBER Program on Technological Progress and Productivity Measurement; Economist and Director of Business Strategy, Global Services, IBM Corporation; Associate Professor of Economics, Air Force Academy and NBER. We gratefully acknowledge financial support from the National Science Foundation to the National Bureau of Economic Research, research assistance from Joshua Kloth and Michael Potts, and discussions with the late Zvi Griliches. Any opinions and views expressed in this paper are only those of the authors, and do not necessarily reflect views of the research sponsors or the institutions with whom the authors are affiliated. DOCUMENT NAME: PC2000 DOCUMENT DATE: 17 JULY 2000

A QUARTER CENTURY HISTORY OF PC PRICES AND QUALITY - PAGE 2 -
PRICE AND QUALITY OF DESKTOP AND MOBILE PERSONAL COMPUTERS:
A QUARTER CENTURY OF HISTORY
by
Ernst R. Berndt, Ellen R. Dulberger and Neal J. Rappaport
ABSTRACT
In this paper we examine quality-adjusted price indexes for personal computers (PCs) from 1976, the year in which PCs were first introduced, through 1999, using hedonic price regression methods. We focus in particular on the equality of coefficients across mobile (luggable, laptop, and notebook) and desktop PCs, and on the stability of coefficients over time. Using 1976-1999 annual PC data on prices and characteristics, we find quality-adjusted PC prices have fallen by about a factor of about 1600 for desktop models, implying an AAGR of about -27%. Until about 1994, quality-adjusted prices of mobile models did not fall as rapidly as those of desktop PCs, but since then trends have been similar. Price declines have been larger in the 1990s than in the 1970s and 1980s, and have been larger in the late 1990s than in the early part of the decade. Beginning about 1987 and continuing thereafter, the relationship between prices and PC characteristics differs between desktop and mobile models. Moreover, for desktop models, coefficient estimates on characteristics differ significantly by year beginning in 1987, and for mobile PCs, by 1993. There does not appear to be a monotonic trend in coefficient estimates on characteristics over time. Ernst R. Berndt Ellen R. Dulberger Neal J. Rappaport MIT Sloan School IBM Global Services HQ USAFA/DFEG 50 Memorial Drive, E52-452 Route 100 2354 Fairchild Dr. Cambridge, MA 02142 Somers, NY 10589 Suite 6D87 (617)-253-2665 (914)-766-2215 USAFA, CO 80840-6238 [email protected] [email protected] (719)-333-8725 Neal.Rappaport@ usafa.af.mil

A QUARTER CENTURY HISTORY OF PC PRICES AND QUALITY - PAGE 3 -
PRICE AND QUALITY OF DESKTOP AND MOBILE PERSONAL COMPUTERS:
A QUARTER CENTURY OF HISTORY
by Ernst R. Berndt, Ellen R. Dulberger and Neal J. Rappaport
I. INTRODUCTION
The year 1976 marked not only the 200th birthday of the United States, but it was also
the year in which personal computers were first introduced commercially into the US market. In
the quarter century since then, there has been enormous technological progress and quality
improvement.1 For example, IBM-compatible desktop PCs were launched in the early 1980s;
luggable, then portable, laptop and eventually notebook PCs came on the scene in the late 1980s
and early 1990s. By the late 1990s PCs had evolved with multimedia capabilities, connectivity
to the Internet, all in ever smaller physical sizes, and for prices sometimes less than $1000.
Today's PCs typically embody megabytes of random access memory, gigabtyes of hard disk
memory, and process commands at speeds up to 1000 megahertz. In 1976, PCs had only several
kilobytes of RAM, had no hard disk at all, processed commands at snail-like speeds of less than
one MHZ, yet cost several thousand dollars.2
For government economic statistical agencies publishing measures of price change and
real output growth, the tasks of reliably tracking the computer industry and its suppliers, and
adjusting prices for quality changes, are formidable ones. Until 1986, the Bureau of Economic
Analysis computed real output growth in the computer industry assuming that the implicit price
deflator for mainframe computers was constant at 1.000. Following on a collaborative research
project with researchers at the IBM Corporation, in 1986 the BEA began adjusting mainframe
computer prices for quality change, using hedonic pricing methods.3 Four years later in 1990,
the Bureau of Labor Statistics published its first experimental quality-adjusted producer price
index for the mainframe computer industry, also based on hedonic price methods.4 Today the
BLS publishes separate producer price indexes for computers and for semiconductors that
incorporate estimates of quality change, and although the BLS' consumer price index does not

A QUARTER CENTURY HISTORY OF PC PRICES AND QUALITY - PAGE 4 -
publish a separate price index for computers, PCs are a component of its CPI item category
entitled "Information Processing Equipment".5
The hedonic regression methods employed by researchers and government statisticians to
adjust PC prices for quality change typically rely on pooled cross-section and time series data,
and necessarily assume a certain amount of parameter equality across various models, as well as
parameter stability over time. When technological progress is extremely rapid, however, the
assumption of parameter stability over time on, say, PC characteristics such as megahertz (MHZ)
speed, random access memory (RAM) size and hard disk storage capacity may plausibly be
called into question. Similarly, one might expect that the price effects of changes in
characteristics over time, such as those involving hard disk memory capacity, might differ for
desktop and notebook PCs.
In this paper we report on results from an initial examination of the stability of PC
hedonic price coefficients over the past quarter century, and on the equality of the hedonic price
coefficients between desktop and mobile models. Using 1976-1999 annual PC data on prices
and characteristics, and building on a hedonic aggregation method that apparently was first
discussed by Triplett [1990b], we find that beginning in 1987 the relationship between prices and
PC characteristics differed between desktops and mobiles, suggesting that based on the Triplett
criteria, since 1987 they could not be reliably aggregated. Moreover, by 1987 parameter
estimates on desktop PC characteristics differed significantly from each other in adjacent year
regressions, implying that parameter estimates varied annually; for mobile PCs, annual variation
was significant beginning in 1993. Thus the issues of parameter equality across models, and
stability over time, are apparently empirically significant. We discuss implications of parameter
instability for price index construction, and consider alternative ways of incorporating the
hedonic price measures into price indexes for desktop and mobile PCs. We begin with an
overview of data sources and trends.
A QUARTER CENTURY HISTORY OF PC PRICES AND QUALITY - PAGE 5 -
II. PC DATA SOURCES AND DATA TRENDS
Our 1976-1999 data set covers a remarkable period of technological changes in the PC
industry and encompasses revolutionary changes in how individuals use PCs. Our basic unit of
observation is a distinctly identified personal computer model available in the US. Over the 24
years, we have 9042 observations, an average of about 375 models per year. Although
undoubtedly an incomplete data set, we are reasonably confident that it is representative of
trends in the overall market. Most of the data covers machines produced by the larger
manufacturers, implying that the models in our data set constitute a large percentage of overall
PC market sales.
Our data gathering project has consisted of three separate efforts over the last decade.
For the 1976-88 time period, our data come primarily from mail order magazine and newspaper
advertisements listing a vendor, model, and computer attributes such as speed, memory, and
storage capacity.6 Although these data sources provided useful information on actual
transactions (not just list) prices, the amount of technical information available was limited.
Over the 1982-88 time period, proprietary sales data from the International Data Corporation was
available for about 950 of the 1,265 models in the estimation sample. The 1976-81 and 1982-88
data are described in greater detail in Berndt and Griliches [1993].
From 1989 through 1999, we rely on a more standardized source of information, namely,
Datapro and the Gartner Group. Details on the 1989-92 data are given in Berndt, Griliches and
Rappaport [1995]. Briefly, the 1989-92 data come from the Data Information Services Group,
then a division of McGraw-Hill. The price data are list prices of the particular base model, rather
than transactions prices. However, a considerable amount of data on technical characteristics is
available. For a subset of the models, we have proprietary quantity sales data available from the
International Data Corporation.7 From 1993 through 1999, we employ data from the Gartner
Group. These data are comparable with the 1989-92 Datapro series. We have not yet been able
to gain access to 1993-99 proprietary sales data at the level of individual models, although we
are currently investigating the feasibility of employing sales data at the model-processor type

A QUARTER CENTURY HISTORY OF PC PRICES AND QUALITY - PAGE 6 -
level of aggregation.
Although the coverage spans the entire 24 year history of PCs, our data set has a number
of limitations. First, the 1982-88 observations capture transactions rather than list prices, while
1989 onward represent list prices. The rapid growth of mail order in the 1990s suggests that the
gap between list and transactions prices has likely closed. To the extent this has occurred, it is
likely that our price series will overstate price declines since 1989. However, it is widely known
that in 1992 major brand manufacturers changed pricing strategies to bring list prices down
considerably to match others' transactions prices. Thus, while price declines might be overstated
for 1989-92, since then any bias is likely to be much smaller. Moreover, since the principal
switch from transactions to list prices occurs between 1988 and 1989, it is likely that we
understate any price decline occurring between 1988 and 1989.
A second limitation of our data is that for 1976-81 and since 1993, we do not have access
to quantity sales data. Thus in the price index computations we report here, we implicitly weight
all models equally. To the extent the demand curve for PCs is downward sloping, we expect that
competitive forces would favor PCs with lower quality-adjusted prices, and that leading-selling
models would be those experiencing the largest quality-adjusted price declines compared to the
previous year's models. To the extent this has occurred, one might expect use of unweighted
model data to result in understated price declines. It is worth noting, however, that in Berndt,
Griliches and Rappaport [1995], price indexes based on unweighted adjacent year regressions
yielded almost identical 1982-88 average annual growth rates (AAGRs) as those based on
Divisia indexes employing quantity sales data: the AAGRs were -23.22% and -23.90%,
respectively, for mobile PCs, and -31.15% and -31.93% for desktop PCs.
Finally, implementation of hedonic regression methods requires making a decision on
what types of variables one should include as regressors to measure the most salient price-
determining characteristics. This is particularly problematic when one covers a time period
encompassing dramatic technological change, as has occurred in the PC market. To facilitate
comparability over time, in this paper we select a limited number of characteristics, but as

A QUARTER CENTURY HISTORY OF PC PRICES AND QUALITY - PAGE 7 -
discussed in the next section, we allow parameter estimates on these characteristics to vary
annually, thereby permitting a relatively unrestricted impact of the estimated changes in
characteristics on price. The characteristics we focus on here include hard disk memory (in
megabytes -- MB), processor speed (in megahertz -- MHZ), the amount of RAM memory (MB),
and dummy variables for whether the model included a CD-ROM. To accommodate possible
brand effects in a parsimonious manner, we include a dummy variable for computers made by
Apple, and another combining many of the "name-brand" IBM-compatible computers (Compaq,
Dell, Gateway, HP, IBM, NEC, Toshiba and Zenith). All other brands are therefore in the
referenced intercept term.
There are many ways in which one could describe price and quality change in the PC
market. Sample means, by year, for prices and a number of characteristics, separately for mobile
and desktop models, are given in Appendix Table 1. In Figure 1 we also present a very simple
description. On the left vertical axis we plot mean PC model price for each year, on the right
vertical axis we plot the mean value of the logarithm of MHZ speed. While mean prices rose
from 1976 to about 1989 and then fell again after 1989, over the entire 1976-99 time period there
has been a steady increase in mean lnMHZ -- a linear regression of mean lnMHZ on time has a
slope coefficient estimate of 0.2362 (R2 of 0.9558), implying an AAGR of about 27% per year.8
III. ISSUES IN SPECIFYING AND ESTIMATING PC HEDONIC PRICE EQUATIONS
We now briefly discussion various specification and estimation issues. Let the price of
PC model i in year t be Pit, let the value of the jth
characteristic for that model be Xijt, and let Tt
be a time dummy variable having the value of unity in year t, else being zero.
A. PARAMETER EQUALITY ACROSS DESKTOP AND MOBILE PC MODELS
To examine parameter equality across classes of models, we distinguish desktop PCs
from mobile PCs, designating desktops with the first subscript being D, and for mobile PCs, M,
i.e., the value of the jth
characteristic for desktop (mobile) model i in year t is XDijt (XMijt).
In an unrestricted single cross-section specification, separate hedonic regression

A QUARTER CENTURY HISTORY OF PC PRICES AND QUALITY - PAGE 8 -
equations are specified for desktop and mobile PCs:
ln PDijt = αDt + ÓjâDjtXDijt + εDijt for desktop PCs, and (1)
ln PMijt = áMt + ÓjßMjtXMijt + εMijt for mobile PCs, (2)
where ln denotes natural logarithm, the ε 's are random disturbance terms, and the á's and â's are
parameters to be estimated. Note that âDjt (âMjt) represents the marginal price effect of a small
change in desktop (mobile) characteristic j in time period t, other things equal. We employ the
log-log hedonic price equation functional form, since based on Box-Cox criteria, in previous
research Berndt, Griliches and Rappaport have found it to be the preferred functional form.
Hence, when j is a continuous variable, âDjt and âMjt are partial elasticities of price with respect to
characteristic j.
In a partially restricted cross-section specification, all "slope" coefficients are equal
across desktop and mobile PCs, but the intercept term is allowed to differ between desktop and
mobile PCs, i.e., while áDt ≠ áMt, it is assumed that âDjt = âMjt = âjt for all j=1,...,J characteristics.
Here the marginal effects of a change in each characteristic are the same for desktop and mobile
PCs. In this partially restricted yearly specification, the hedonic price equation to be estimated
takes the form
ln Pijt = áDtDit + áMtMit + ÓjâjtXijt + åijt (3)
where Pijt and Xijt are "stacked" vectors of desktop and mobile PC observations, åijt is a stacked
vector of random disturbances for desktop and mobile PCs, Dit is a dummy variable equal to one
only if model i is a desktop model, else it is zero, and Mit is a dummy variable equal to one only
if model i is a mobile model, else it is zero.
In a fully restricted cross-section specification, in addition to the constraint that laptop
and mobile slope coefficients are equal, it is assumed that intercept terms are equal, i.e., âDjt =
âMjt = âjt for all j=1,...,J characteristics, and áDt = áMt = át. In this specification, quality-adjusted
price indexes are identical for desktop and mobile PCs. The corresponding fully restricted yearly
hedonic price equation to be estimated takes the form
ln Pijt = át + ÓjâjtXijt + åijt. (4)

A QUARTER CENTURY HISTORY OF PC PRICES AND QUALITY - PAGE 9 -
B. PARAMETER STABILITY OVER TIME
An alternative dimension of parameter equality involves stability over time. To abstract
from issues involving lack of parameter equality across classes of models, assume for the
moment that based on results of hypothesis tests, we are dealing with a set of models over which
the null hypothesis of either partial or full parameter equality has not been rejected, or, if partial
parameter equality has been rejected, we are separately estimating cross-section hedonic price
equations for desktop and mobile PCs. To keep our notation manageable, however, we now omit
the D and M initial subscripts.
In the unrestricted adjacent time period regressions for time periods t and t-1, separate
equations are specified for each time period:
ln Pij,t -1 = át-1 + Ójâj,t -1Xij,t -1 + åij, t-1, and (5)
ln Pij,t = át + Ójâj,tXij,t + åij,t. (6)
In the common and widely used partially restricted adjacent time period regressions, it is
assumed that each slope coefficient is equal (stable) in adjacent years, but that the intercept terms
differ, i.e., âj,t = âj,t -1 = âj for all j =1,...,J, but át ≠ át-1. These parameter restrictions are frequently
imposed by estimating adjacent time period hedonic price regressions having the form
ln Pijô = át,t-1 + atTt + ÓjâjXijô + åijô, (7)
where Pijô, Xijô and åijô are stacked vectors of observations for time periods t-1 and t, and since Tt
is a dummy variable taking on the value of one if the observation is in time period t (else it is
zero), at is the differential intercept for time period t relative to time period t-1, i.e., at ≡ át - át-1.
With this partially restricted adjacent year regression specification, frequently the quality-
adjusted price index for year t relative to year t-1 is computed simply by exponentiating at.9
When slope coefficients of more than two adjacent time periods are constrained to be identical
while intercept terms are permitted to differ, quality-adjusted price indexes relative to the base
time period are often computed using the sequence of exponentiated time period-specific
intercept differentials, i.e., the sequence of exp(at), exp(at+1), exp(at+2), etc.10

A QUARTER CENTURY HISTORY OF PC PRICES AND QUALITY - PAGE 10 -
Finally, in the fully temporally restricted hedonic price specification, it is assumed that
not only are all slope coefficients in the adjacent time period regressions involving Eqns. (5) and
(6) identical, but so too are the intercept terms, i.e., âj,t = âj,t -1 = âj for all j = 1,,,,J, and át = át-1 =
á, which implies that at = 0. The corresponding fully temporally restricted hedonic price
equation is of the form
ln Pijô = á + ÓjâjXijô + åijô. (8)
When the constraints in Eqn. (8) hold, the quality-adjusted hedonic price index for time period t
is the same as that for time period t-1.
One way of interpreting parameter inequality over time is in terms of neutral and non-
neutral technological progress, as in the theory of cost and production. Specifically, in
exponentiated (non-logarithmic) form, one can re-write Eqn. (6), allowing for time-varying
elasticities, as
ijtP = tá • ÐjXijt ijtjtâå . (9)
If the relationship between characteristics and price is time-invariant, i.e., if the âjt elasticities are
constant, or if technological change is characteristic-neutral, then one can rewrite Eqn. (9) as
ijtP = tá • ÐjXijt ijtjâå , (10)
which is analogous to the familiar Cobb-Douglas functional form.
C. HYPOTHESIS TESTING AND THE COMPUTATION OF QUALITY-ADJUSTED
PRICE INDEXES

A QUARTER CENTURY HISTORY OF PC PRICES AND QUALITY - PAGE 11 -
Hypothesis tests involving these various specifications can be carried out using the well-
known Chow test under the assumption of i.i.d normality of the disturbance terms. Alternatively,
one can compute standard errors using the White procedure that allows for heteroskedasticity,
and then use as an estimate of the (X'Ù-1
X) matrix that estimate obtained from the regression
involving the null hypothesis.11
Consistent with the hedonic aggregation approach outlined in Triplett [1990b], we
implement the sequence of hypothesis tests by first running yearly regressions separately for
desktop and mobile PCs as in Eqns. (1) and (2), and testing whether the restrictions in Eqn. (3)
are valid. If these restrictions are not rejected, we impose them, and continue on with various
temporal stability tests. If the restrictions in Eqn. (3) are rejected, we do not impose them, and
instead continue on with various temporal stability tests, separately for desktop and mobile PCs.
To assess parameter stability over time for the desktop and mobile PCs, we first estimate
cross-sectional hedonic price equations for each pair of adjacent time periods, as in Eqns. (5) and
(6), and then test whether the restrictions in Eqn. (7) are valid. If these restrictions are not
rejected, we compute quality adjusted price indexes by chaining the sequence of estimated
exponentiated at's, as discussed above. If, however, the parameter restrictions in Eqn. (7) are
rejected, we compute various quality adjusted price indexes for successive time periods by
employing parameter estimates from the separate adjacent time period cross-sectional
regressions and computing predicted values based on alternatively the mean values of
characteristics from time period t-1 (analogous to the base period quantity weights used in the
Laspeyres index), from time period t (analogous to the current time period quantity weights used
in the Paasche index), or their geometric mean (the Fisher Ideal index).
D. OTHER ISSUES REGARDING SPECIFICATION AND INTERPRETATION OF
HEDONIC PRICE EQUATIONS
How one interprets estimated coefficients from hedonic price regressions has been the
focus of considerable discussion in the literature.12 Here, following Griliches, we envisage the
hedonic price equations as being reduced form rather than structural, and therefore we do not
A QUARTER CENTURY HISTORY OF PC PRICES AND QUALITY - PAGE 12 -
interpret coefficients on characteristics as distinct measures of either consumers' marginal
evaluations or producers' marginal costs, but rather as the outcome of consumer and producer
optimization in the context of a differentiated product market. We note, however, that if
characteristic quantities are viewed as being jointly determined, then even our relatively agnostic
reduced form interpretation can be called into question.
At least since Ohta and Griliches [1986], there has been a literature comparing use of
technical measures of characteristics (e.g., megahertz speed, hard disk capacity, and random
access memory for computers, horsepower and weight for automobiles) with performance
measures (e.g., millions of instructions executed per second for computers, or miles per gallon
and acceleration for automobiles). In the context of computers, due in part to rapid technological
progress, it has proven to be somewhat difficult to obtain system performance measures that are
valid across models and over time.
A recent study by Chwelos [1999] is of particular interest in this context. Using a Delphi
procedure, Chwelos first surveyed "power users" of PCs such as information system managers
and business users concerning attributes of computer systems that provide value to users. He
then developed an index of system performance measures based on data from published
performance benchmarks. Chwelos also developed a set of technical proxy measures of system
performance. Using data on IBM-PC compatible mobile and desktop systems, Chwelos found
that both performance measures and technical measures yielded satisfactory explanatory power
in hedonic price regressions and more importantly, that they yielded very similar estimates of the
rate of quality-adjusted price change in PC systems. Hence in this study we will employ a set of
technical characteristics as regressors in the hedonic price equations. However, since we allow
the coefficients on these technical characteristics to vary across mobile and desktop PCs, and
over time, we believe they provide an adequate proxy measure of varying PC system
performance as well.13
IV. SUMMARY OF EXISTING RELEVANT LITERATURE
Chow's classic study of mainframe computers reported that quality-adjusted rental prices

A QUARTER CENTURY HISTORY OF PC PRICES AND QUALITY - PAGE 13 -
fell at an average annual growth rate (AAGR) of about -21% between 1960 and 1965. As
regressors to adjust for quality change, Chow used a mix of performance and technical measures
-- multiplication time, memory size and access time. Triplett [1989] reviewed a number of other
hedonic studies on mainframe computers, and formed a "best practice" quality-adjusted price
index; over the 1953-1972 time period, the AAGR of this index was about -27%.
In 1986 the IBM researchers Cole et al. [1986] published results of hedonic price
analyses in which the individual components or "boxes" of a computer system were examined,
rather than the system as a whole. For computer processors, Cole et al. found that over the 1972-
84 time period, the AAGR based on hedonic prices was -19.2%, while that based on a "matched
model" procedure in which one only compares prices on identical models observed in adjacent
years was only -8.5%. The large discrepancy between matched model and hedonic measures
reflects the inability of the matched model procedure to link in the effects of new models in the
first year of their being on the market. Using similar procedures but aggregating over separate
hedonic price equations involving computer processors, intermediate and large hard disk drives,
printers and general-purpose displays, Cartwright [1986] reported an AAGR of -13.8% from
1972 to 1984; Cartwright's estimates, as well as the Ph.D. dissertation by Dulberger [1986],
formed the basis of the BEA's new official price index for mainframe computers. Taking a
longer historical view, Gordon [1989] estimates that a quality-adjusted mainframe price index
for computers declined at an AAGR of -22% from 1951 to 1984.
To the best of our knowledge, the first hedonic studies involving PCs were the
unpublished analyses by Cohen [1988] and by Kim [1989]. Cohen originally gathered price and
characteristics data covering the 1976-87 time period; these data, which he updated to include
1988, were then examined further by Kim. Characteristics data collected by Cohen included
RAM, MHZ, hard disk capacity, number floppy drives, number of slots available for expansion
boards, and the age of the model. As reported in Berndt and Griliches [1993, Table 2.1], based
on hedonic regressions, both Cohen and Kim found AAGRs ranging from -25% to -27% over the
1982-87 time period, while a BEA measure based on list prices and matched models declined at

A QUARTER CENTURY HISTORY OF PC PRICES AND QUALITY - PAGE 14 -
a considerably slower AAGR of about -17%. Interestingly, when Gordon [1990] used matched
model procedures for 21 models observed between 1981 and 1987, based on transactions prices
as advertised in Business Week and PC Magazine rather than list prices, he obtained a
comparable AAGR of -23%.
Other hedonic price studies of PCs include those by Berndt and Griliches [1993] covering
the 1982-88 time period, and by Berndt, Griliches and Rappaport [1995] over the years 1989-
1992. Berndt and Griliches reported that although there was statistical support for parameter
stability over time on characteristics regressors within the 1982-84, 1984-86 and 1986-88 time
periods, between these time periods the null hypothesis of parameter stability on the
characteristics regressors was typically rejected. Based on the hedonic price regressions,
AAGRs of PCs over the 1982-88 time period ranged from about -23% to -25%, and were
remarkably similar for list and discounted prices. When instead of using unweighted averages
based on the hedonic regressions Berndt-Griliches used a Divisia index that incorporated
quantity weights based on proprietary sales data sources, virtually identical AAGRs were
obtained. However, the Divisia index revealed a smoother and less erratic decline than did the
direct hedonic price indexes. Moreover, price declines of incumbent models were typically
larger on average than those on entering and exiting models (about -27%, -22% and -17%,
respectively).
In Berndt, Griliches and Rappaport [1995], a different data source is employed for the
characteristics data, namely, DATAPRO, along with its list price data. When simple arithmetic
means of prices are calculated over the 1989-92 time period, an AAGR of about -11% is
obtained; this increases to about -19% when matched model procedures are employed. Berndt,
Griliches and Rappaport distinguish mobile (transportable, notebook and laptop) models from
desktops, but based on the limited number of mobile model observations and adjacent year
regressions, they are not able to reject parameter stability (except for the intercept term),
although the 1991-92 inference is marginal. For mobile models, the 1989-92 AAGR is -23.2%
based on adjacent year regressions, and -23.9% based on a Divisia index with yearly parameters.

A QUARTER CENTURY HISTORY OF PC PRICES AND QUALITY - PAGE 15 -
For desktop regressions, parameter stability on the characteristics regressions is decisively
rejected in two of the three adjacent year regressions, and is marginal in the other (1990-91).
Quality-adjusted price indexes have rather similar AAGRs across various specifications,
however, ranging from about -31% to -32% between 1989 and 1992. Finally, when price
indexes are first computed separately for desktops and mobile PCs, and then aggregated using
Divisia weighting procedures, the combined desktop-mobile quality-adjusted price index
declines at an AAGR of between 29-30% per year 1989-92, with a particularly large decrease in
1992.
Another PC hedonic price study is that by Nelson, Tanguay and Patterson [1994], based
on IBM-PC compatible desktop-only models over the 1984-91 time period. Using list-price data
and a number of technical characteristics variables, Nelson et al. report that yearly and adjacent-
year regressions yield somewhat erratic results, although coefficients on characteristics variables
typically decline in value over time, with a particularly large drop occurring in 1985-86. Using a
nonlinear specification involving interactions between characteristics coefficients and time,
Nelson et al. report quality-adjusted AAGRs for major manufacturers of about -17.5% between
1984 and 1991, and a larger -24.6% for mail order firms.
The final PC price study reviewed here is that by Chwelos [1999], which was mentioned
and briefly discussed earlier. For mobile/laptop PCs, over the 1990-98 time period, no PC model
was observed in more than one year, thus making the matched model procedure infeasible.
Using benchmark measures of performance (based on Ziff-Davis Benchmark Operations and
published in PC Magazine), Chwelos reports that laptop slope coefficient estimates were stable
over time, suggesting that in terms of price/performance, these performance characteristics have
been evolving at approximately the same rate, and that this rate was adequately captured by the
time dummy variables. Exponentiating the time dummy variables, Chwelos obtained a quality-
adjusted AAGR for laptops of around -39.6%. When Chwelos regressed his laptop processor
performance index on a number of laptop technical characteristic variables (microprocessor,
RAM, and cache dummy variables), he obtained an R2 of 0.9819. It is not entirely surprising,

A QUARTER CENTURY HISTORY OF PC PRICES AND QUALITY - PAGE 16 -
therefore, that when Chwelos used as regressors the technical characteristic variables rather than
the performance measures, the AAGR of the quality-adjusted price index was virtually identical
at -40.0%.
For desktops, Chwelos' PC data are for the years 1992-98. The R2 from a regression of
desktop performance on technical characteristics variables was 0.9925, implying a very strong
relationship between them. However, when performance measures were utilized as regressors,
the AAGR of the quality-adjusted hedonic price index was about -32%, whereas that based on
technical characteristics was slightly larger at about -35%.
V. ECONOMETRIC FINDINGS ON PARAMETER EQUALITY AND PARAMETER
STABILITY
With this as background, we now report on econometric findings obtained from
estimation of a variety of hedonic regression equations.
A. PARAMETER EQUALITY BETWEEN MOBILE AND DESKTOP MODELS
Mobile models have evolved considerably since their introduction in the early 1980s.
Early mobile models were essentially suitcase-sized versions of desktop machines with a smaller
screen replacing the desktop monitor, and as their "luggable" nickname implied, they could be
lugged from place to place but only with some difficulty. With the advent of laptop computers in
the late 1980s and notebooks in the 1990s, true computing portability was achieved. But this
portability came with a cost. In exchange for lighter weight and smaller footprint came slower
processor speeds, less memory, and less storage capacity, all at typically a premium price
relative to a desktop with otherwise similar characteristics.
Nine luggable models first appear in our data set in 1983, increasing to 16 mobile models
in 1984, 22 in 1985, 32 in 1986 and 73 in 1987; by 1999, we observe 1,165 distinct mobile
models.
We estimate parameters in yearly regressions for 1983-99, first allowing for common
slope coefficients for mobile and desktop models but a different intercept, as in Eqn. (3), and
then allowing both for different intercepts and different slope coefficients, as in Eqns. (1) and

A QUARTER CENTURY HISTORY OF PC PRICES AND QUALITY - PAGE 17 -
(2). Although the difference in 1983 intercept terms is insignificant, beginning in 1984 the
difference between mobile and desktop intercepts is positive and statistically significant (p <
0.05), with the magnitude of the difference increasing over time. From 1984 through 1989, the
mean difference in intercept terms is about 0.31, for 1990-93 it increases to about 0.43, then in
1994-96 it increases sharply to about 0.71, and in 1997-99 the mean difference in the mobile vs.
desktop PC increases again to about 0.92. This implies that, when one constrains the
characteristic coefficients (speed, hard disk capacity, memory, CD-ROM, Apple, and IBM-
COM) to be the same across mobile and desktop PCs, in 1997-99 the price of a notebook
computer was about 2.5 times that of desktop having the same technical characteristics.
For each year from 1983 onward, we then test the null hypothesis that the slope
coefficients are equal across mobile and desktop models, against the alternative hypothesis that
both slope and intercept terms differ. Ordinary least squares p-values from this test are plotted in
Figure 2; the results allowing for heteroskedasticity are very similar. As is seen in Figure 2,
except for 1983, beginning in 1987 and for each year thereafter (except 1997), we reject the null
hypothesis of slope parameter equality between mobile and desktop PCs at p-values less than
0.05; for 1984-86, however, the null hypothesis is not rejected at this significance level. The
general pattern, therefore, is that beginning about 1987 and continuing thereafter, the effects of
changes in characteristics on prices differs between desktop and mobile models.
It is also of interest to examine which characteristic coefficients appear to differ between
mobile and desktop models. To conserve space we do not report detailed results, but instead
offer a brief summary. We find that in the mid to late 1990s, the estimated elasticity of price
with respect to hard disk capacity is larger for mobile than desktop PCs, but the price elasticity
with respect to speed is larger for desktops than mobile PCs.
In summary, the proportional price premium charged for mobile vs. desktop models has
increased considerably from 1983 to 1999, and this price premium reflects in part a larger
positive price elasticity with respect to hard disk capacity for mobile vs. desktop models, but a
smaller price impact of speed. Coefficient estimates on characteristics differ significantly
A QUARTER CENTURY HISTORY OF PC PRICES AND QUALITY - PAGE 18 -
between mobile and desktop models, generally beginning in 1987 and continuing annually
thereafter.
B. PARAMETER STABILITY OVER TIME
The null hypothesis of stability of all slope coefficients over time is decisively rejected,
both for desktop and mobile PC models (p-value <0.001). Although it is possible to examine
parameter stability over various lengths of time, separately for mobile and desktop models, we
simplify the analysis here by assessing stability in successive pairs of adjacent year regressions.
As discussed above, because estimated slope coefficients for desktop and mobile PCs do
not generally differ significantly until 1987, we first examine parameter stability for the pooled
sample (but with a distinct mobile intercept) for years up to 1987. We find that up through 1987,
in eight of the ten adjacent year pairs (all pairs except 1978-79 and 1983-84), we cannot reject
the null hypothesis of all slope coefficients being equal in adjacent years.
Since mobile and desktop coefficients differ beginning in 1987, from 1987 onward we
assess parameter stability separately for mobile and desktop PCs. For desktop PCs, as shown in
Figure 3, in the twelve pairs of adjacent years between 1987 and 1999, the null hypothesis of
slope coefficients being equal in adjacent years is rejected in all but one case (1990-91).
However, as is seen in Figure 4, for mobile models the evidence on adjacent year slope
coefficient stability is more mixed. Using a 0.05 significance level for each test, parameter
stability is not rejected in five pairs of adjacent years (1988-89, 1989-90, 1990-91, 1992-93 and
1997-98), but is rejected in seven pairs of years, with a clear predominance in the later years
(1987-88, 1991-92, 1993-94, 1994-95, 1995-96, 1996-97 and 1998-99). The pattern of inference
is essentially unaffected when a heteroskedasticity-consistent disturbance variance-covariance is
employed instead of that based on OLS estimation.
We interpret these findings as suggesting that in the desktop PC segment, particularly
since the late 1980s there have been dramatic non-neutral changes in the relationships among
technical characteristics and price. While there has also been enormous technological progress
in the mobile PC market segment, apparently the nature of relationships among technical

A QUARTER CENTURY HISTORY OF PC PRICES AND QUALITY - PAGE 19 -
characteristics and prices has tended to have been a bit more neutral across characteristics than in
the desktop PC segment, at least until recent years, and these changes are adequately captured by
differential time intercepts.
Since presentation of all parameter estimates would take an enormous amount of space,
in Table 1 we briefly summarize patterns of parameter change over time, separately for desktop
and mobile PCs, over selected time intervals. In the first column of Table 1, we present
parameter (elasticity) estimates based on the pooled over all years (1976-99 for desktops, 1983-
99 for mobile) regressions, in which slope coefficients are constrained to be constant. The
remaining columns of Table 1 are arithmetic means of parameter (elasticity) estimates from the
adjacent year regressions over selected time intervals.
As seen in the top row of Table 1, the elasticity of price with respect to hard disk capacity
was very high at about 0.38 when hard disks initially appeared on desktop PCs in the early
1980s, this elasticity dropped in half to about 0.19 in 1984-89, it dropped even further to about
0.05 in 1990-94, but particularly for mobile PCs it has increased sharply again during 1995-99.
Recall that in the 1980s the early mobile PCs were luggable, in the later 1980s and early 1990s
smaller but still rather heavy and cumbersome portables and laptops appeared, and finally the
very thin and light notebooks have come to predominate in the late 1990s. In recent years space
for hard disk capacity apparently commands a hefty premium in price in mobile PCs -- from
1995-99 the mobile elasticity of 0.36 is three times that for desktops at 0.12.
Trends in processor speed are quite different, as is seen in the second set of rows in
Table 1. Since 1980 for desktop PCs, the elasticity of price with respect to speed has been larger
than that for hard disks, and by the end of the 1990s the desktop elasticity of 0.72 is about twice
that for mobile PCs at 0.34. The pooled regression estimate of 0.53 for desktops is considerably
larger than the 0.33 estimate for mobile PCs.

A QUARTER CENTURY HISTORY OF PC PRICES AND QUALITY - PAGE 20 -
---------------------------------------------------------------------------
Table 1
Mean Values of Elasticity Estimates on Characteristics Variables
Over Selected Time Intervals Pooled Means from Adjacent Year Regressions Characteristic Regression 1976-79 1980-83 1984-89 1990-94 1995-99 Hard disk memory (ln mb) Desktop 0.09 na 0.38 0.19 0.05 0.12 Mobile 0.12 na na 0.18 0.06 0.36 Processor speed (ln mhz) Desktop 0.53 0.19 0.40 0.69 0.53 0.72 Mobile 0.33 na na 0.64 0.40 0.34 Active Memory (ln mb) Desktop 0.34 0.45 0.69 0.34 0.38 0.20 Mobile 0.26 na na 0.32 0.08 0.21 Notes: Based on authors' regression analysis. na is not applicable.
---------------------------------------------------------------------------
Finally, in terms of RAM, as is seen in the bottom set of rows in Table 1, except for
1990-94, elasticities for mobile and desktop models are generally similar, and have fallen over
time. For desktop PCs, the 1995-99 elasticity at 0.20 is less than 30% of its 0.69 value in 1980-
83.
VI. ALTERNATIVE QUALITY-ADJUSTED PRICE INDEX CALCULATIONS
The econometric findings reported above for parameter equality between mobile and
desktop PCs, and parameter stability over time, have implications for the construction and

A QUARTER CENTURY HISTORY OF PC PRICES AND QUALITY - PAGE 21 -
interpretation of quality-adjusted price indexes. We have constructed alternative price indexes
that vary in the way they accommodate parameter inequality across desktop and mobile PCs, and
instability in parameter estimates over time. Alternative results are presented in Table 2.
The simplest and most restrictive procedure is simply to pool observations across all
years, restrict all slope coefficients to be constant over time, allow for a time-invariant dummy
variable for mobile models, and specify yearly time dummy variables. Results from this simplest
way to adjust PC prices for quality change are presented in Column 1 of Table 2. Under these
assumptions, adjusted for quality changes, PC prices have fallen by a factor of 1000 from 1976
through 1999, implying an AAGR of -25.94%. Moreover, prices have declined at about twice
the annual rate in 1994-99 relative to 1977-83 and 1983-99 (-38.72% vs. -18.00% and -17.68%,
respectively).
A slightly less restrictive set of price index calculations involves maintaining the
assumption of stability of all slope coefficient parameters over time, but separately estimating
models for desktop and mobile PCs. Results from these calculations are given in Columns 2 and
3 of Table 2.
For desktop PCs, the 1976/1999 ratio of quality-adjusted prices is 1661:1, and over
the shorter 1983-99 period it is 396:1. Over the entire 1976-99 time period, the AAGR is
-27.46%, but this masks considerable intertemporal heterogeneity. From 1976 through 1989 the
AAGR is a bit more than -18%, but this accelerates to about -34% from 1989 to 1994, and even
further to -41% from 1994 to 1999.
Quality-adjusted price declines are considerable smaller in magnitude for mobile
than desktop PCs, as one sees by comparing Columns (2) and (3). The 1983/99 ratio of quality-
adjusted prices for mobile PCs is 40:1 (about one-tenth of that for desktops), reflecting an AAGR
of -20.59%. Although mobile PC price declines were rather modest in the 1980s (around -8%),
they picked up from 1989 to 1994 (-23%), and even more so in the late 1990s (-32%).

A QUARTER CENTURY HISTORY OF PC PRICES AND QUALITY - PAGE 22 -
--------------------------------------------------------------------------- Table 2
Alternative Price Indexes Adjusted for Quality Change
(1983 = 1.0000) (1) (2) (3) (4) (5) (6) (7) DESKTOP DESKTOP MOBILE MOBILE ALL DESKTOP MOBILE ADJ/YEARLY ADJ/YEARLY ADJ/YEARLY ADJ/YEARLY YEAR POOLED POOLED POOLED LASPEYRES PAASCHE LASPEYRES PAASCHE 1976 4.0100 4.0671 na 6.7666 6.7666 na na 1977 2.2819 2.2420 na 4.3807 4.3807 na na 1978 1.9327 1.8969 na 3.7084 3.7084 na na 1979 2.0035 1.9611 na 3.2008 3.2008 na na 1980 1.9858 1.9440 na 3.0398 3.0398 na na 1981 1.7825 1.7388 na 2.6154 2.6154 na na 1982 1.4549 1.4040 na 1.8300 1.8300 na na 1983 1.0000 1.0000 1.0000 1.0000 1.0000 1.0000 1.0000 1984 0.9967 0.9689 1.2390 0.8425 0.8425 0.8425 0.8425 1985 0.6757 0.6650 0.9490 0.5696 0.5696 0.5696 0.5696 1986 0.4773 0.4604 0.7363 0.3816 0.3816 0.3816 0.3816 1987 0.3624 0.3456 0.5878 0.2739 0.2865 0.2928 0.2928 1988 0.2658 0.2469 0.4633 0.1744 0.1957 0.2093 0.2093 1989 0.3111 0.2897 0.6084 0.1795 0.2165 0.2388 0.2388 1990 0.2631 0.2380 0.5231 0.1341 0.1735 0.2095 0.2095 1991 0.2315 0.2147 0.4780 0.1193 0.1627 0.1932 0.1932 1992 0.1069 0.0937 0.2426 0.0520 0.0682 0.1094 0.1094 1993 0.0843 0.0677 0.2558 0.0385 0.0568 0.1158 0.1158 1994 0.0464 0.0365 0.1664 0.0214 0.0445 0.0832 0.0907 1995 0.0328 0.0253 0.1188 0.0152 0.0425 0.0522 0.0702 1996 0.0206 0.0147 0.0932 0.0099 0.0335 0.0430 0.0462 1997 0.0135 0.0101 0.0651 0.0063 0.0202 0.0253 0.0343 1998 0.0055 0.0037 0.0327 0.0022 0.0113 0.0070 0.0096 1999 0.0040 0.0025 0.0250 0.0016 0.0113 0.0055 0.0064 AAGRs 76-99 -25.94 -27.46 na -30.44 -24.29 na na 83-99 -29.17 -31.19 -20.59 -33.13 -24.45 -27.76 -27.07 76-83 -18.00 -18.16 na -27.29 -27.29 na na 83-89 -17.68 -18.66 - 7.95 -24.89 -22.51 -21.23 -21.23 89-94 -31.65 -33.93 -22.84 -34.65 -27.13 -19.01 -17.60 94-99 -38.72 -41.38 -31.56 -40.47 -24.02 -41.92 -41.15

A QUARTER CENTURY HISTORY OF PC PRICES AND QUALITY - PAGE 23 -
Notes: Calculations based on authors' regression models. na is not applicable. ---------------------------------------------------------------------------
While provocative and intriguing, these price indexes adjusted for quality change depend
on assumptions regarding parameter stability over time. Recall from our earlier econometric
findings discussion that for slope coefficients in yearly regressions, significant differences
between desktops and laptops generally began to appear in 1987, and continued thereafter. For
desktops prior to 1987, the null hypothesis of parameter equality in pairs of adjacent year
regressions was generally not rejected, and thus from 1976 to 1987 use of time dummies from
desktop adjacent year time dummies is acceptable. However, the null hypothesis that desktop
slope coefficients in pairs of successive adjacent year regressions from 1987-88 through 1998-99
were equal was rejected in eleven of twelve cases. To accommodate this parameter instability,
we construct the analogs of Laspeyres and Paasche desktop price indexes beginning in 1987,
using results from yearly desktop regressions. In particular, to construct a Laspeyres-type
quality-adjusted price index between adjacent years t and t+1, we use parameter estimates from
the separate year t and t+1 desktop regressions, we employ as "weights" the means of the
desktop regressors in the "base" year t, and then take the ratio of predicted desktop prices in
years t+1 and t. The analogous Paasche-type quality adjusted price index employs as quantity
weights instead the means of the desktop regressors from the "current" year t+1. Results from
these desktop calculations, linking adjacent year time dummies with Laspeyres and Paasche-type
predicted price ratios, are given in Columns (4) and (5) of Table 2.
Comparing the desktop pooled (Column (2)), adjacent year/yearly Laspeyres (Column
(4)) and adjacent year/yearly Paasche (Column (5)) price indexes, we observe a number of
substantial differences. From 1976 through 1983, for example, use of adjacent year rather than
pooled across year regression coefficients yields a considerably greater rate of price decline
(AAGRs of -27.29% vs. -18.16%). This general differential pattern continues over the 1983-89
time frame, but the differences are not as dramatic.
Although there is a modest difference in 1983-89 AAGRs between the Laspeyres (-
A QUARTER CENTURY HISTORY OF PC PRICES AND QUALITY - PAGE 24 -
24.51%) and Paasche (-22.89%) adjacent year/yearly indexes, the difference between them
increases substantially in 1989-94 (-34.65% vs. -27.13%), and then diverges dramatically in
1994-99 (-40.47% vs. -24.02%). These differential estimates of quality-adjusted price decline
are based on the same yearly regressions, and thus simply reflect the difference in "quantity"
weights, weights that are changing very rapidly. Coincidentally, we believe, the AAGRs of
Laspeyres adjacent year/yearly estimates in 1989-94 (-34.65%) and 1994-99 (-40.47%) are much
closer to those of the temporally pooled desktop only indexes (-33.93% and -41.38%,
respectively).
We now turn to evidence regarding quality-adjusted price declines for mobile PCs.
Recall from above that econometric evidence on parameter stability over time indicated that use
of adjacent year regressions is acceptable up through 1992-93, after which parameter estimates
from yearly regressions are required. We have constructed Laspeyres- and Paasche-type mobile
PC price indexes adjusted for quality change, with linked adjacent year and yearly mobile
regressions, analogous to those for desktops. Results are given in the final two columns of Table
2.
The first striking finding is that when one compares the mobile Laspeyres and Paasche
measures in Columns (6) and (7), unlike the case with desktops, the differences in AAGRs are
relatively small. For 1989-94, the Laspeyres and Paasche prices have annual price declines of
-19.01% and -17.60%, respectively, while in 1994-99 they are -41.92% and -41.15%. The
second clear trend result is that, from 1983 to 1989, and 1989 to 1994, price declines are
generally smaller for mobile than for desktop PCs; from 1994 onward, however, price decline
trends are more similar. Third, it is also striking that when one compares quality-adjusted price
indexes for mobile PCs using a temporally pooled mobile-only hedonic regression (Column (3)
of Table 2), one generally obtains much smaller annual average price declines than when
adjacent year/yearly regression equations are employed (Columns (6) and (7)); this is not always,
the case, however, as is seen for the 1989-94 time period.
One clear lesson that emerges from this comparison, both for desktops and mobile PCs, is

A QUARTER CENTURY HISTORY OF PC PRICES AND QUALITY - PAGE 25 -
that the assumption of parameter stability over time on the characteristics variable is one that is
empirically questionable at best, and has a very large and meaningful impact on the estimated
rate of decline in quality-adjusted PC price indexes.
VII. CONCLUSIONS AND SUGGESTIONS FOR FURTHER RESEARCH
In this paper we have documented a quarter-century of technological progress in the US
market for desktop and mobile PCs. Adjusted for quality change, we find that prices of PCs
have fallen by about a factor of one thousand between 1976 and 1999, implying an AAGR of
about -25%. Price declines have been larger in the 1990s than in the 1970s and 1980s, and have
been larger in the late 1990s than in the early part of the decade.
The task of attempting to track quality-adjusted prices of goods when technological
progress is so rapid and dramatic is a most difficult one. While hedonic methods are being
employed increasingly by government statistical agencies, they frequently rely on assumptions
regarding parameter stability over time, and equality across various sets of models. For PCs, we
find that estimates of market price elasticities with respect to characteristics began to differ
significantly in 1987 between desktop and mobile models, and continued to differ thereafter.
Moreover, for desktop models, these elasticities differed even by year beginning in 1987, and for
mobile PCs, beginning in 1993. For quality-adjusted price indexes to be reliable, such parameter
variability needs to be accommodated. Unfortunately, parameter values do not appear to change
monotonically with time, or across models, and thus it is not obvious how one might adapt
parameter estimates based on data and hedonic price regressions that are several years old. Since
parameter estimation of hedonic regression models is unlikely to be able to be done in real time,
at least in the near future, an implication is that quality-adjusted price indexes for high-tech
products such as PCs will likely only be available on a time-delayed basis.
It is worth noting that there are a number of important limitations to this research. First,
list price data are used from 1989 onward, whereas from 1976 through 1988 a mix of list and
transactions price data were available. Not surprisingly, in almost all our regressions we find a
rather small and uncharacteristic quality-adjusted price increase between 1988 and 1989, which

A QUARTER CENTURY HISTORY OF PC PRICES AND QUALITY - PAGE 26 -
we believe likely reflects this price data transition, rather than a true price increase. Hence,
"true" rates of price decline between pre- and post-1989 are likely to be even larger than
estimated here.
Second, while a limited amount of quantity sales data for PCs was available from 1982-
92, we have not been able yet to gain access to reliable sales data post-1992. Currently we are
investigating possibilities of obtaining sales data that quantify sales by manufacturer and
processor. While such a level of aggregation is less than ideal (numerous models from a
manufacturer may have the same processor), it may provide some additional useful information.
However, based on earlier research, we doubt use of sales data would fundamentally change our
findings in any material manner.
Third, in an attempt to balance the benefits of additional technological detail with the
possibility of somewhat erratic and volatile parameter estimates over time, we have limited our
hedonic analysis here to a rather parsimonious set of specifications. In future research, we
believe it will be important to examine the implications of relaxing the parsimonious
parameterization assumptions.

A QUARTER CENTURY HISTORY OF PC PRICES AND QUALITY - PAGE 27 -
REFERENCES Armknecht, Paul A., Walter F. Lane and Kenneth J. Stewart [1997], "New Products and the U.S. Consumer Price Index," in Timothy F. Bresnahan and Robert J. Gordon, eds., The Economics of New Goods, Studies in Income and Wealth, Vol. 58, Chicago: University of Chicago Press for the National Bureau of Economic Research, 375-396. Baily, Martin N. and Robert J. Gordon [1988], "The Productivity Slowdown, Measurement Issues, and Explosion of Computer Power," Brookings Papers on Economic Activity, 2:1988, 347-420. Berndt, Ernst R. [1991], "The Measurement of Quality Change: Constructing an Hedonic Price Index for Computers using Multiple Regression Methods," ch. 4 in Berndt, The Practice of Econometrics: Classic and Contemporary, Reading, MA: Addison-Wesley Press. Berndt, Ernst R. and Zvi Griliches [1993], "Price Indexes for Microcomputers: An Exploratory Study," Chapter 2 in Murray F. Foss, Marilyn E. Manser and Allan H. Young, eds., Price Measurements and Their Uses, Studies in Income and Wealth, Vol. 57, Chicago: University of Chicago Press for the National Bureau of Economic Research, 63-93. Berndt, Ernst R., Zvi Griliches and Neal Rappaport [1995], "Econometric Estimates of Price Indexes for Personal Computers in the 1990's," Journal of Econometrics, 68:1, July, 243-268. Berry, Steven and Ariel Pakes [2000], "The Pure Characteristics Discrete Choice Model with Application to Price Indices," Presented at the Bureau of Labor Statistics "Issues in Measuring Price Change and Consumption" Conference, Washington DC, June 5-8. Cartwright, David W. [1986], "Improved Deflation of Purchases of Computers," Survey of Current Business, 66:3, March, 7-9. Chow, Gregory C. [1967], "Technological Change and the Demand for Computers," American Economic Review, 57:5, December, 1117-1130. Cohen, Jeremy M. [1988], "Rapid Change in the Personal Computer Market: A Quality-Adjusted Hedonic Price Index, 1976-1987," unpublished S.M. thesis, Massachusetts Institute of Technology, Alfred P. Sloan School of Management, May. Cole, Rosanne, Y. C. Chen, Joan A. Barquin-Stolleman, Ellen R. Dulberger, Nurhan Helvacian and James H. Hodge [1986], "Quality-Adjusted Price Indexes for Computer Processors and Selected Peripheral Equipment," Survey of Current Business, 66:1, January, 41-50. Chwelos, Paul [1999], "Hedonic Approaches to Measuring Price and Quality Change in Personal Computer Systems," Vancouver BC: University of British Columbia, Faculty of Commerce and Business Administration, unpublished Ph.D. dissertation, December.

A QUARTER CENTURY HISTORY OF PC PRICES AND QUALITY - PAGE 28 -
Dulberger, Ellen R. [1989], "The Application of an Hedonic Model to a Quality Adjusted Price Index for Computer Processors", in Dale W. Jorgenson and Ralph Landau, eds., Technology and Capital Formation, Cambridge, MA: The MIT Press, 37-75. Epple, Dennis [1987], "Hedonic Prices and Implicit Markets: Estimating Demand and Supply Functions for Differentiated Products," Journal of Political Economy, 95:1, 59-80. Feenstra, Robert C. [1995], "Exact Hedonic Indexes," Review of Economics and Statistics, 77:4, 634-653. Fixler, Dennis, Charles Fortuna, John Greenlees and Walter Lane [1999], "The Use of Hedonic Regressions to Handle Quality Change: The Experience in the U.S. CPI," Paper presented at the Fifth Meeting of the International Working Group on Price Indices, Reykjavik, Iceland, August. Gandal, Neil [1994], "Hedonic Price Indexes for Spreadsheets and an Empirical Test for Network Externalities," RAND Journal of Economics, 25:1, Spring, 160-170. Gordon, Robert J. [2000], "Does the 'New Economy' Measure up to the Great Inventions of the Past", Journal of Economic Perspectives, forthcoming. Gordon, Robert J. [1989], "The Postwar Evolution of Computer Prices," chapter 3 in Dale W. Jorgenson and Ralph Landau, eds., Technology and Capital Formation, Cambridge, MA: MIT Press, 77-125. Griliches, Zvi [1990], "Hedonic Price Indexes and the Measurement of Capital and Productivity: Some Historical Reflections," in Ernst R. Berndt and Jack E. Triplett, eds., Fifty Years of Economic Measurement, Chicago: University of Chicago Press for the National Bureau of Economic Research, 185-202. Griliches, Zvi [1988], "Postscript on Hedonics," in Zvi Griliches, Technology, Education, and Productivity, New York: Basil Blackwell, Inc., 119-122. Griliches, Zvi [1971], "Introduction: Hedonic Prices Revisited," in Zvi Griliches, ed., Price Indexes and Quality Change: Studies in New Methods of Measurement, Cambridge, MA: Harvard University Press, 3-15. Holdway, Michael [2000], "An Alternative Methodology: Valuing Quality Change for Microprocessors in the PPI," Presented at the Bureau of Labor Statistics "Issues in Measuring Price Change and Consumption" Conference, Washington DC, June 5-8. Jorgenson, Dale W. and Kevin J. Stiroh [2000], "Raising the Speed Limit: U.S. Economic Growth in the Information Age," Brookings Papers on Economic Activity, 1:2000, forthcoming. Kim, Amy Y. [1989], "Hedonic Price Indices and an Examination of the Personal Computer Market," Harvard College, Department of Economics, unpublished honors undergraduate thesis, March.

A QUARTER CENTURY HISTORY OF PC PRICES AND QUALITY - PAGE 29 -
Mann, Charles [2000], "The End of Moore's Law?", Technology Review, 103:3, May/June, 42-48. Markoff, John [1999], "Chip Progress Forecast to Hit A Barrier," New York Times, Saturday, October 9, p. A1. Nelson, Randy A., Tim L. Tanguay and Christopher D. Patterson [1994], "A Quality-Adjusted Price Index for Personal Computers," Journal of Business and Economic Statistics, 12:1, January, 23-31. Ohta, Makoto and Zvi Griliches [1986], "Automobile Prices and Quality: Did the Gasoline Price Increases Change Consumer Tastes in the U.S.", Journal of Business and Economic Statistics, 4:2, April, 187-198. Oliner, Stephen D. [1993], "Constant-Quality Price Change, Depreciation, and Retirement of Mainframe Computers," Chapter 1 in Murray F. Foss, Marilyn E. Manser and Allan H. Young, eds., Price Measurements and Their Uses, Studies in Income and Wealth, Vol. 57, Chicago: University of Chicago Press for the National Bureau of Economic Research, 19-61. Oliner, Stephen D. and Daniel E. Sichel [2000], "The Resurgence of Growth in the late 1990s: Is Information Technology the Story?", working paper, Washington DC: Federal Reserve Board, February. Rosen, Sherwin [1974], "Hedonic Prices and Implicit Markets: Product Differentiation in Pure Competition," Journal of Political Economy, 82:1, 34-55. Sichel, Daniel E. [1999], "Computers and Aggregate Economic Growth: An Update," Business Economics, 34:2, 18-24. Sinclair, James and Brian Catron [1990], "An Experimental Price Index for the Computer Industry," Monthly Labor Review, 113:10, October, 16-24. Sliker, Brian [2000], "A Note on Valuing Technological Change for Microprocessors in the Producer Price Index," Washington DC: U.S. Bureau of Labor Statistics, draft manuscript, May 9. Stavins, Joanna [1995], "Model Entry and Exit in a Differentiated Product Industry: The Personal Computer Market," Review of Economics and Statistics, 77:3, April, 571-584. Triplett, Jack E. [2000], Handbook on Quality Adjustment of Price Indexes for Information and Communication Technology Products, draft book manuscript, Washington DC, May. Triplett, Jack E. [1990a], "Hedonic Methods in Statistical Agency Environments: An Intellectual Biopsy," in Ernst R. Berndt and Jack E. Triplett, eds., Fifty Years of Economic Measurement, Chicago: University of Chicago Press for the National Bureau of Economic

A QUARTER CENTURY HISTORY OF PC PRICES AND QUALITY - PAGE 30 -
Research, 207-233. Triplett, Jack E. [1990b], "The Theory of Industrial and Occupational Classifications and Related Phenomena," Proceedings of the 1990 Annual Research Conference, U.S. Department of Commerce, Bureau of the Census, Issued August, pp. 9-25. Triplett, Jack E. [1989], "Price and Tecchnological Change in a Capital Good: A Survey of Research on Computers," chapter 4 in Dale W. Jorgenson and Ralph Landau, eds., Technology and Capital Formation, Cambridge, MA: MIT Press, 127-213. Triplett, Jack E. [1986], "The Economic Interpretation of Hedonic Methods," Survey of Current Business, 86:1, January, 36-40. White, Halbert L. [1980], "A Heteroskedasticity-Consistent Covariance Matrix Estimator and a Direct Test for Heteroskedasticity," Econometrica, 48:4, May, 817-838.

A QUARTER CENTURY HISTORY OF PC PRICES AND QUALITY - PAGE 31 -
-----------------------------------------------------------------------------
APPENDIX TABLE 1
MEAN PRICES AND VALUES OF SELECTED TECHNCIAL CHARACTERISTICS VARIABLES
ANNUALLY, 1976-1999, SEPARATELY FOR DESKTOP AND MOBILE MODELS
NUMBER OF DOLLAR HARD DISK RANDOM ACCESS PROCESSOR YEAR OBSERVATIONS PRICE CAPACITY - MB MEMORY - MB SPEED - MHZ
DESKTOP MODELS ONLY 1976 10 1897 0 0.00975 1.35 1977 17 1337 0 0.01245 2.06 1978 14 1136 0 0.01027 2.14 1979 26 1890 1.36 0.02093 2.29 1980 36 2025 1.44 0.02658 1.94 1981 38 2243 1.50 0.02948 2.41 1982 50 2388 1.53 0.05525 2.63 1983 76 2629 2.39 0.09912 4.07 1984 114 3015 4.30 0.17600 5.19 1985 92 3034 7.07 0.31443 5.89 1986 156 2757 10.79 0.48821 7.21 1987 324 2916 21.63 0.71086 9.43 1988 298 2992 40.46 0.93662 12.66 1989 173 4615 49.96 1.25225 15.63 1990 457 4426 61.89 1.79204 19.44 1991 322 4436 55.25 2.06353 21.18 1992 505 3399 132.48 5.19604 29.03 1993 943 2527 167.95 4.00502 34.15 1994 362 2031 721.99 5.45304 53.38 1995 476 2150 476.44 8.59644 78.04 1996 202 2593 1390.90 17.27418 140.50 1997 408 1985 1971.50 22.21414 184.28 1998 209 1466 5080.47 52.75000 337.00 1999 1247 1255 7105.97 69.75540 413.68

A QUARTER CENTURY HISTORY OF PC PRICES AND QUALITY - PAGE 32 -
NUMBER OF DOLLAR HARD DISK RANDOM ACCESS PROCESSOR YEAR OBSERVATIONS PRICE CAPACITY - MB MEMORY - MB SPEED - MHZ
MOBILE MODELS ONLY
1983 9 1961 3.00 0.10400 4.11 1984 16 2460 1.00 0.12950 3.70 1985 22 2159 1.86 0.16473 4.24 1986 32 2489 3.91 0.35125 5.62 1987 74 2416 7.74 0.44649 7.42 1988 58 2807 14.47 0.72166 9.87 1989 52 4616 29.10 1.14508 13.15 1990 118 4325 33.57 1.25278 14.37 1991 131 4037 33.44 1.25145 14.87 1992 125 3295 83.12 2.97312 22.75 1993 287 3303 99.56 3.06983 25.29 1994 248 3072 150.57 4.80460 40.75 1995 269 3317 365.18 5.88848 66.01 1996 123 4107 1012.44 11.64228 114.79 1997 79 3490 1383.92 15.64557 137.32 1998 131 3176 4445.04 45.06870 257.66 1999 263 2753 5545.20 55.98021 326.19
-----------------------------------------------------------------------------

A QUARTER CENTURY HISTORY OF PC PRICES AND QUALITY - PAGE 33 -
Footnotes 1Moore's law, originally enunciated by Intel cofounder Gordon Moore in 1965, postulated that the logic density of silicon transistors would double every year (he later changed this to 18 months). Although observers have often questioned the extent to which such progress can continue indefinitely without running into technological barriers, Moore's law is still widely thought to apply today. For recent discussions, see John Markoff [1999] and Charles Mann [2000]. 2Of the ten 1976 PC models in our data set, one model had a speed of 0.5 MHZ, seven had 1 MHZ speed, one had a 2 MHZ speed, and the fasted a speed of 4 MHZ. Prices ranged from $375 to %5037. For other discussions of price and quality change in the PC market, see Cohen [1988], Kim [1989], Berndt and Griliches [1993], Nelson, Tanguay and Patterson [1994], and Stavins [1995]. 3See Cartwright [1986], Cole et al. [1986], Dulberger [1989], Gordon [1989], and Triplett [1986]. For historical discussions, see Baily and Gordon [1988], Berndt [1991, Chapter 4], Griliches [1971, 1988] and Triplett [1990a]. 4Sinclair and Caton [1990]. 5See Fixler, Fortuna, Greenlees and Lane [1999] for further discussion; also see Armknecht, Land and Stewart [1997]. 6Specifically, prices and models were taken from PC Magazine and New York Times, both in June of that year. Additional technical information came from Byte Magazine. 7Unfortunately, Datapro data are not available prior to 1989. 8For hard disk memory, the slope coefficient estimate is even larger at 0.4012 (R2 of 0.9579), implying an AAGR of about 49% per year. 9As long as one is comparing ratios of predicted prices from adjacent year log-price regressions under the assumption of homoskedasticity, one can ignore the exponentiation of 0.5s2, where s is the standard error of the regression. Under heteroskedasticity, however, adjustments for the error variance are appropriate. See Berndt [1991], ch. 4, for further discussion. 10There are of course other more complex ways in which quality-adjusted price indexes can be computed based on estimated hedonic price equations. See Armknecht, Lane and Stewart [1997], Berndt [1991, Chapter 4], Berndt and Griliches [1993], Berndt, Griliches and Rappaport [1995], and Fixler, Fortuna, Greenlees and Lane [1999] for further discussion. 11Here Ù is the variance-covariance matrix of the disturbances. See White [1980]; also see Berndt [1991, Chapter 4]. 12See, for example, Griliches [1971, 1988, 1990], Rosen [1974], Epple [1987], Triplett [1990a], Feenstra [1995] and Berry and Pakes [2000]. 13For discussions of performance vs. technical measures in the context of semiconductors, see Holdway [2000] and Sliker [2000].

Figure 1Personal Computers--1976-1999
Mean Prices, Mean Ln MHZ
0
500
1000
1500
2000
2500
3000
3500
4000
4500
5000
1976
1977
1978
1979
1980
1981
1982
1983
1984
1985
1986
1987
1988
1989
1990
1991
1992
1993
1994
1995
1996
1997
1998
1999
Pric
es ($
)
01
23
45
67
LN M
HZ
Prices MHZ
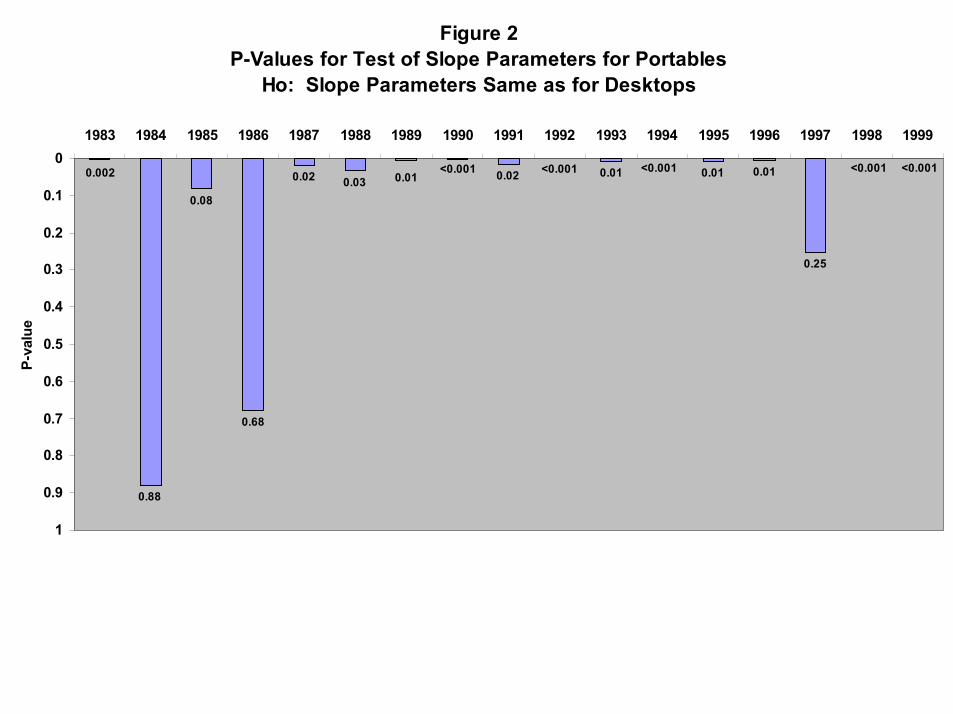
Figure 2P-Values for Test of Slope Parameters for Portables
Ho: Slope Parameters Same as for Desktops
0.88
0.08
0.68
0.02 0.03 0.02 0.01 0.01 0.01
0.25
0.01<0.0010.002 <0.001 <0.001 <0.001<0.001
0
0.1
0.2
0.3
0.4
0.5
0.6
0.7
0.8
0.9
1
1983 1984 1985 1986 1987 1988 1989 1990 1991 1992 1993 1994 1995 1996 1997 1998 1999
P-va
lue

Figure 3Desktop Computers: 1987-99--Adjacent Year vs. Yearly
Ho: Slope Parameters Equal Across Adjacent Years
0.013
0.178
0.041<0.001<0.001<0.001<0.001<0.001<0.001<0.001<0.001<0.001
0
0.25
0.5
0.75
1
87-88 88-89 89-90 90-91 91-92 92-93 93-94 94-95 95-96 96-97 97-98 98-99
P-va
lue
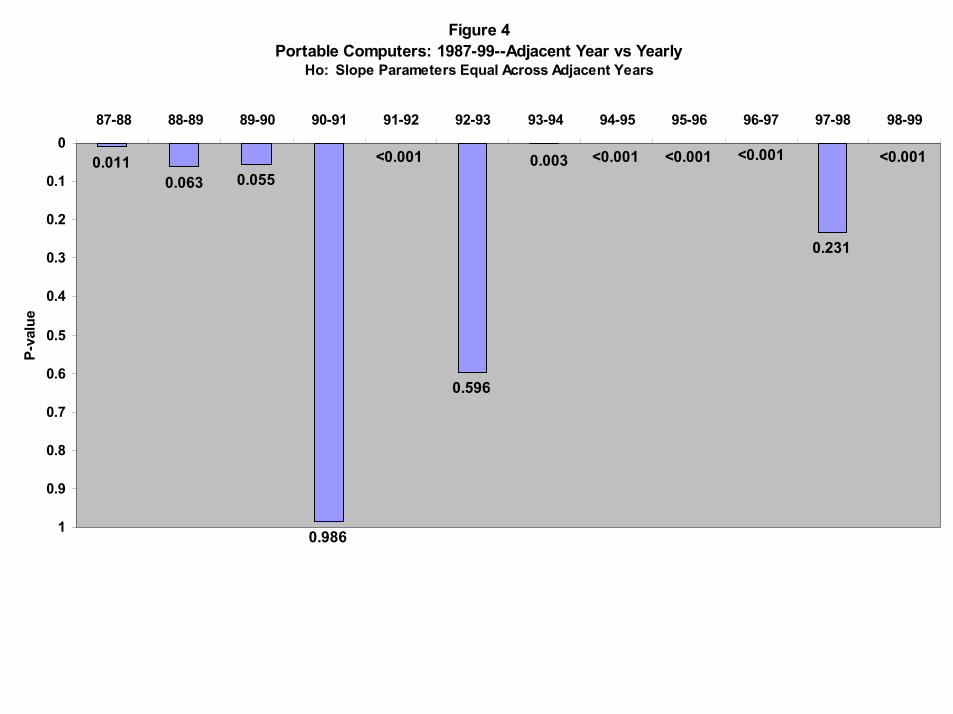
Figure 4Portable Computers: 1987-99--Adjacent Year vs Yearly
Ho: Slope Parameters Equal Across Adjacent Years
0.0110.063 0.055
0.986
0.596
0.231
<0.001<0.001<0.001<0.0010.003<0.0010
0.1
0.2
0.3
0.4
0.5
0.6
0.7
0.8
0.9
1
87-88 88-89 89-90 90-91 91-92 92-93 93-94 94-95 95-96 96-97 97-98 98-99
P-va
lue