Embed Size (px)
Citation preview
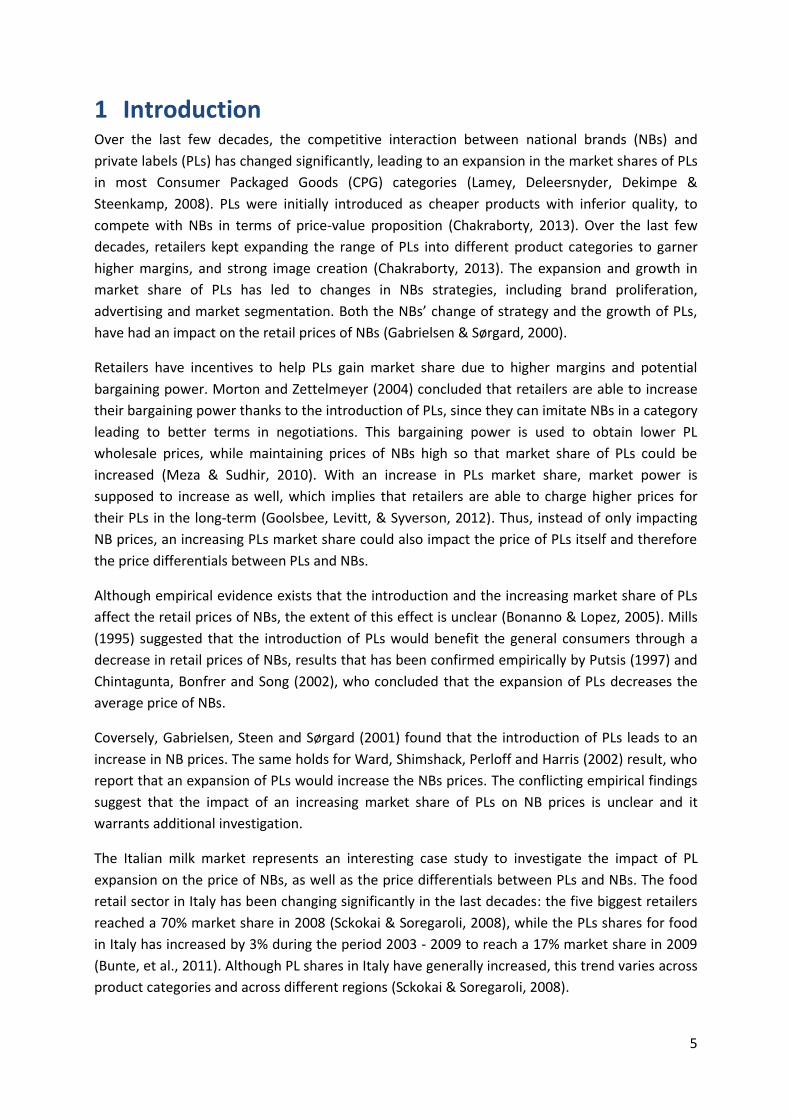
Wageningen University – Department of Social Science
MSc. Thesis Business Economics Chair Group
Price competition between private labels
and national brands in the Italian milk
market
Student: Dammis van Dijk
Registration number: 920720207030
Supervisor: dr. Alessandro Bonanno
MSc. program: Management, Economics and Consumer Studies
Course code: BEC-80436
Period: February 2015 – June 2015
Wageningen University, 2015

2
3
Abstract The European market share of private labels has been growing over the last couple of decades,
affecting the price competition between private labels and national brands. Various empirical
studies have concluded that the growth of private labels has had a positive impact on the prices
of national brands while theoretical papers concluded that this growth impacted negatively the
prices of national brands. The aim of this research is to investigate the effect of the expansion of
private label market shares on the prices of national brands using the Italian milk market as a
case study. Within this case study, the focus will lie on two different milk products, namely fresh
milk and Extended Shelf Life (ESL) milk.
The data used in this research is primarily Italian scanner data coming from the Symphony IRI
group and contains information about milk prices, volumes sold and promotional activities per
region or retail channel. By means of a descriptive and econometric analysis, the effect of an
increasing private label market share on the milk prices of national brands could be measured.
The research results pointed out that the prices of national brands increase when the market
share of private labels is on a low or average level. When the market share increases above
average, the prices of national brands will be impacted negatively for both fresh and ESL milk.

4
Table of Contents 1 Introduction .................................................................................................................................... 5
1.1 Objectives and research questions ......................................................................................... 6
1.1.1 Objective .......................................................................................................................... 6
1.1.2 Research Questions ......................................................................................................... 6
2 Private labels vs. National brands ................................................................................................... 7
2.1 Competition of NBs and PLs .................................................................................................... 7
2.2 National Brands vs. Private Labels in Italy ............................................................................... 9
2.3 Different segments ................................................................................................................ 10
3 Italian milk market ........................................................................................................................ 11
3.1 Northern vs. Southern regions .............................................................................................. 12
4 Data and Methodology ................................................................................................................. 13
4.1 Data and data manipulation .................................................................................................. 13
4.2 Model Specification ............................................................................................................... 13
5 Empirical results ............................................................................................................................ 16
5.1 Descriptive analysis ............................................................................................................... 16
5.1.1 Milk prices ..................................................................................................................... 16
5.1.2 Market shares ................................................................................................................ 18
5.2 Econometric model Results ................................................................................................... 22
5.2.1 Average volume per unit ............................................................................................... 23
5.2.2 Sales under promotion .................................................................................................. 23
5.2.3 Raw milk price ............................................................................................................... 23
5.2.4 Month and Region variables.......................................................................................... 24
6 Conclusions and Recommendations ............................................................................................. 27
6.1 Conclusions ............................................................................................................................ 27
6.2 Recommendations................................................................................................................. 28
6.3 Limitations and future research ............................................................................................ 29
7 References .................................................................................................................................... 30
8 Appendix ....................................................................................................................................... 33
8.1 Regional shares, prices and price differentials ...................................................................... 33
8.2 Regional and time period dummy variables.......................................................................... 34
8.2.1 Fresh milk ...................................................................................................................... 34
8.2.2 ESL milk .......................................................................................................................... 35
8.3 Results STATA econometric model........................................................................................ 36
5
1 Introduction Over the last few decades, the competitive interaction between national brands (NBs) and
private labels (PLs) has changed significantly, leading to an expansion in the market shares of PLs
in most Consumer Packaged Goods (CPG) categories (Lamey, Deleersnyder, Dekimpe &
Steenkamp, 2008). PLs were initially introduced as cheaper products with inferior quality, to
compete with NBs in terms of price-value proposition (Chakraborty, 2013). Over the last few
decades, retailers kept expanding the range of PLs into different product categories to garner
higher margins, and strong image creation (Chakraborty, 2013). The expansion and growth in
market share of PLs has led to changes in NBs strategies, including brand proliferation,
advertising and market segmentation. Both the NBs’ change of strategy and the growth of PLs,
have had an impact on the retail prices of NBs (Gabrielsen & Sørgard, 2000).
Retailers have incentives to help PLs gain market share due to higher margins and potential
bargaining power. Morton and Zettelmeyer (2004) concluded that retailers are able to increase
their bargaining power thanks to the introduction of PLs, since they can imitate NBs in a category
leading to better terms in negotiations. This bargaining power is used to obtain lower PL
wholesale prices, while maintaining prices of NBs high so that market share of PLs could be
increased (Meza & Sudhir, 2010). With an increase in PLs market share, market power is
supposed to increase as well, which implies that retailers are able to charge higher prices for
their PLs in the long-term (Goolsbee, Levitt, & Syverson, 2012). Thus, instead of only impacting
NB prices, an increasing PLs market share could also impact the price of PLs itself and therefore
the price differentials between PLs and NBs.
Although empirical evidence exists that the introduction and the increasing market share of PLs
affect the retail prices of NBs, the extent of this effect is unclear (Bonanno & Lopez, 2005). Mills
(1995) suggested that the introduction of PLs would benefit the general consumers through a
decrease in retail prices of NBs, results that has been confirmed empirically by Putsis (1997) and
Chintagunta, Bonfrer and Song (2002), who concluded that the expansion of PLs decreases the
average price of NBs.
Coversely, Gabrielsen, Steen and Sørgard (2001) found that the introduction of PLs leads to an
increase in NB prices. The same holds for Ward, Shimshack, Perloff and Harris (2002) result, who
report that an expansion of PLs would increase the NBs prices. The conflicting empirical findings
suggest that the impact of an increasing market share of PLs on NB prices is unclear and it
warrants additional investigation.
The Italian milk market represents an interesting case study to investigate the impact of PL
expansion on the price of NBs, as well as the price differentials between PLs and NBs. The food
retail sector in Italy has been changing significantly in the last decades: the five biggest retailers
reached a 70% market share in 2008 (Sckokai & Soregaroli, 2008), while the PLs shares for food
in Italy has increased by 3% during the period 2003 - 2009 to reach a 17% market share in 2009
(Bunte, et al., 2011). Although PL shares in Italy have generally increased, this trend varies across
product categories and across different regions (Sckokai & Soregaroli, 2008).
6
PLs share in the Italian milk market has increased remarkably over the last few decades. PL
market share of refigerated milk (fresh milk) has increased by 7% between 2004 and 2008
(Bunte, et al., 2011). Furthermore, fluctuating consumption of milk products (ISTAT, 2013) and
the differences in market shares of PLs across different Italian regions (Symphony IRI, 2011) may
have an influence on retail prices of NBs or the price differentials between PLs and NBs.
Furthermore, the Italian dairy sector is divided in various segments comprised of both mature
and growing markets.
1.1 Objectives and research questions
1.1.1 Objective The objective of this research is to investigate the effect of an increase in PL market shares on
NBs prices and on the price differentials between PLs and NBs in the Italian fresh and Extended
Shelf Life (ESL) milk markets. In this research we will consider as fresh milk, pasteurized milk with
a limited shelf life (a couple of days). In comparison to fresh milk, ESL milk has an increased shelf
life of 5 to 10 days. The quality profile is similar to that of fresh milk although ESL milk is
processed and packed differently (Kolstad & Rysstad, 2006). Within the Italian market, ESL milk is
a relatively new segment, while fresh milk is a mature segment.
1.1.2 Research Questions To achieve this research objective, the following research questions will need to be answered:
- What are the most recent PLs developments in the Italian milk market ?
- What is the effect of an increase in PL market share on NB fresh and ESL milk prices?
- What is the effect of an increase in PL market share on price differentials between PLs
and NBs?
The remainder of this thesis will proceed as follows: the literature on the competition between
NBs and PLs will be illustrated first, followed by a description of NBs and PLs operating in the
Italian milk market. After describing the data and methodology used in this research, the results
of a descriptive analysis will be presented. Finally, the results of the econometric analysis will be
presented followed by a conclusion and discussion.

7
2 Private labels vs. National brands
2.1 Competition of NBs and PLs PLs products accounted for more than 20% of global grocery sales in 2007 and are expected to
grow to 30% by 2020 (Lamey et al., 2007). The growth of PLs over the last few years could be
attributed to various factors such as an increased effort regarding PLs introductions/programs
(Hoch, 1996), an improvement in PLs quality over time (Steenkamp & Dekimpe, 1997) and the
growing concentration in the retail sector (Hoch and Banerji, 1993). This growing success of PLs
is a serious challenge for NBs since both NBs and PLs are present in the same shelves, which
leads to the competition for consumers’ choice (Dawes & Nenycz-Thiel, 2013).
According to Hoch (1996), a retailer has almost no influence on prices, marketing strategies,
product qualities and brand image of NBs. PLs are the only products for which the retailer could
decide all marketing and inventory investments. By only having influence on PLs, retailers have
increased their efforts regarding the introduction of PLs into various product ranges. The PLs
product range includes exclusivity trademarks, either the retailers’ own name or another name,
which only could be sold by the retailer. Since there is not much influence on NBs, retailers could
use NBs advertising to build store traffic and re-route consumers towards their PLs (Hoch, 2002).
Price shielding is a commonly method by retailers in attracting consumers towards PLs;
whenever a NBs is under promotion, retailers will start promoting PLs while remaining
competitive in price (Hoch, 2002).
The improved quality of PLs has had an impact on the competition between NBs and PLs as well.
Since the last few years, retailers have improved the quality of PLs in order to encourage
consumer loyalty to PLs rather than to NBs. Many consumers consider PLs as having circa the
same quality as NBs (Steenkamp & Dekimpe (1997). Quality is consistently the major factor for
consumers in their decision to repurchase PLs (Hoch, 1996). Since PLs have succeeded in
narrowing the gap of perceived quality, one of the main reasons to buy more expensive NBs has
been eliminated leading to a more extensive competition between NBs and PLs (Steenkamp &
Dekimpe, 1997).
Retail concentration is another factor which has contributed to the success of PLs. This factor
refers to the market-share belonging to the top 5 retailers present in the market. The retailing
environment has seen a significant growth in market dominance of large players with greater
store size, market and negotiating power and an increased range of formats and products (Rubio
& Yague, 2009) (Hollingsworth, 2004). The increased retail concentration has led to a more
intense competition between retailers. The intensity of the retail competition has a positive
impact on PLs market share through the application of more competitive PLs prices and the
increased quality of PLs products (Rubio & Yague, 2009).
According to Hoch and Banerji (1993), PLs are likely to be more successful in a category where
there is not much competition coming from NBs. Whenever PLs have to compete with NBs
within a specific category, it will face difficulty due to (1) competitive variety and (2) advertising
intensity. When there is a high level of variety in products, PLs are pressed to mimic proprietary
8
technology in order to remain competitive to NBs. This requires time, investment and innovation
while it is expected that PLs are not as successful as NBs when a lot of variety is present in a
category. PLs are not as much promoted as NBs since PLs are owned by the retailer. Retailers
mostly spend their advertising budget on prices and places rather than their PLs brand. Since
NBs are more focused on brand advertising and promotional activities than PLs, it is expected
that PLs will obtain a lower market share in that specific category (Hoch and Banerji, 1993).
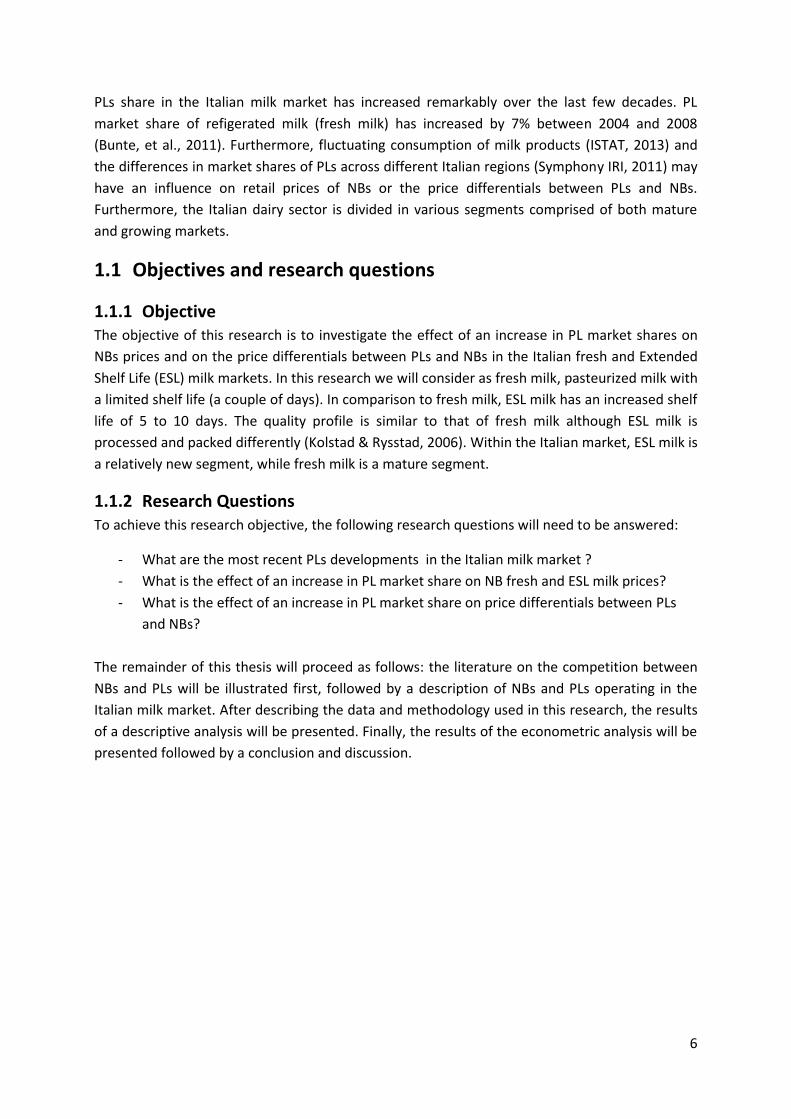
There are several strategic options available to NBs in order to react on the success of PLs. NBs
could improve their competitive position regarding PLs through six strategic options as seen in
Figure 1 (Hoch, 1996).
NBs could (1) wait and do nothing till PLs development is certain and the market is more
stabilized. Reactions to PLs require investments which could not be reversed easily. Secondly, (2)
NBs could increase the distance from PLs in terms of ‘new and improved’ whereby NBs focus
particularly on innovation. Within short product life cycles, innovation will negatively impact PLs
market share. Another option for NBs is (3) to keep their prices constant and relatively higher
than PLs while quality is improved (provide more for the money). By improving the quality of the
product, more effective advertising of NBs could lead to a lower PLs market share. By (4)
reducing the price gap, NBs are able to attract consumers with a higher quality relatively to a
lower price. (5) NBs could also introduce a ‘value flanker’: a lower priced and possible lower-
quality product. The introduction of these products lead to a smaller PLs segment and could be a
useful defensive option against growing PLs. The last possible option is the (6) production of a
PLs by a NBs manufacturer. By selling PLs against lower wholesale costs, excess production
capacities are filled and overall corporate margins could increase (Hoch, 1996).
Figure 1 | Strategic options for NBs to improve the competitive position against PLs Reproduced from: Hoch (1996), Figure 1, p. 5

9
2.2 National Brands vs. Private Labels in Italy The market penetration of PLs in Italy is relatively low (emerging) in comparison to other
European Union member states (Johansson & Burt, 2004). The PLs market share in Italy was
estimated at 17% in 2009 while PLs in Switzerland and United Kingdom hold a market share of
more than 48% while certain product categories show a PLs market share of 100% (Bunte, et al.,
2011).
Figure 2 shows the Italian PLs market share of 2014 and the evolution of this PLs share compared
to a year ago in various categories. After 5 years of growth, the market share of PLs has in
general stopped growing in 2014. Various categories in PLs have not been promoted to previous
years and therefore the PLs market share in various category have decreased (IRI, 2014). PLs
market share is the highest in the frozen food category with almost 27%, followed by
chilled/fresh food (24,8%) and household (23,6%).
Figure 2 | PLs market share in Italy (2014) Reproduced from: ‘Private label in Western Economies: Closing the price gap, losing share. IRI (2014), p. 28
Nowadays consumers are less brand-loyal and are searching for the best available price in the
market. The Italian consumer has also become price sensitive, seeking for high quality products
within various PLs categories. The price sensitivity of Italian consumers leads to a narrowing
price gap between NBs and PLs, which is affecting the sales performance of PLs (Nielsen, 2014).
Another factor impacting the sales performance of PLs in Italy is the increased competition of
NBs which are capturing market shares thanks to high levels of promotional activities. With
these expected negative trends, Italian retailers are repositioning their pricing strategies to
compete against NBs under promotion (IRI, 2014).
According to Nielsen (2014), these trends will in general not affect PLs in the Italian milk market
due to (1) minimal differentiation among milk products, (2) the low level of brand-loyalty on milk
products and (3) a low innovation rate among milk products. From 2004 till 2008, the PLs market
share of Italian pasteurized milk has increased by 7% to reach a 9% market share in 2008 (Bunte,
et al., 2011).

10
2.3 Different segments An increasing market share of PLs may affect the NBs retail prices and price differentials
between PLs and NBs in mature and growing segments differently. Both a mature and growing
segment differ in competition, innovation, investments and consumers’ price sensitivity. In a
growing market, NBs are likely to invest and innovate to remain competitive with PLs while in a
mature market, NBs are more engaged to price reductions and market segmentations to remain
competitive in the face of an increasing market share of PLs (Ward, et al., 2002).
The two products analysed in this research are operating in different segments. Fresh milk is
operating in a mature segment of the Italian milk market. The mature market is in general
characterized by price deflation, increased competition and a reduction of firms (Parrish, Cassill
& Oxenham, 2006). Extended Shelf Life (ESL) milk is operating in a smaller and growing segment
of the Italian milk market. A growing market is often characterized by rapid growth, high levels
of investments and changing prices (Spence, 1979). The differences between these two products
could lead to a different impact of PLs market shares on NBs prices or price differentials.

11
3 Italian milk market The European Union (EU) dairy sector is one of its most important sector. The milk production in
the EU is worth 55 billion Euros and represents around 15 percent of the total EU agricultural
output in 2013 (European Commission, 2014). Italy is, along with Germany, France, the United
Kingdom, Poland and the Netherlands, one of the main dairy producers in the EU. These six
countries account for more than 70% of the EU cow’s milk production. Despite the decline in
total number of dairy farms (47%) and the total number of dairy cows (16%) the growth in milk
yield has increased by 18.4% between 2001 and 2011 across the EU-27 (Marquer, 2013).
The Italian dairy market has been changing as well according to the number of farms and the
production of milk. The number of Italian dairy farms has declined by 80% in the period 1983
(year when the milk quota were introduced) to 2013. In spite of a declining number of dairy
farms, the Italian corresponding production of milk has increased by 254% from 1983 to 2013
(Rosa & Vasciaveo, 2013) which represents a higher milk production per-farm. Besides a
declining number of dairy farms, there has been an extreme change in the distribution of Italian
dairy enterprises in comparison to other European Union members. The market declined by 268
dairy enterprises, as shown in Table 1 (Jongeneel, Burrell, & Kavallari, 2011). As a result of a
decline in dairy enterprises, the average processed milk per enterprise was around 6000 tonnes.
Table 1 | Number of dairy enterprises and quantity of milk processed by dairy enterprises per EU Member state in 2003 and 2009
Reproduced from: ‘Evaluation of CAP measures applied to the dairy sector’ by Jongeneel, R., Burrell, A., & Kavallari, A., 2011, Wageningen UR, p. 237.
Most of the Italian dairy farms are located in Northern Italy as well as the two main processors of
fresh milk, Parmalat and Gruppo Granarolo. Jointly these two processing companies are
responsible for 49% of the total fresh milk market (Symphony IRI, 2012). Other (fresh) milk
processors such as Del Giudice, Newlat, Maremma, Tre Valli-cooperlat etc. account for smaller
market shares within the Italian milk market. The four biggest Italian processors have lost an
overall 8% market share between 2004 and 2008 while the amount of brands in refrigerated milk
has increased from 268 to 413 in 2008 (Bunte, et al., 2011).
12
37%
63%
% Consumption Market Share per Region
Southern Regions
Northern Regions
The milk produced in Italy is sold to consumers through various retail channels. Supermarkets
(62.5%) have the largest market share in milk products while superettes (27.9%) and
hypermarkets (9.60%) follow. Two Italian retailers (Coop Italia and Conad) have the biggest
market share with a turnover of approximately 13,100 million euros and 10,200 million euro in
2013, followed by Auchan (7200 million), Esselunga (6540 million) and Carrefour (5715 million)
(Biasetti, 2013).
With a turnover of 14.900 million euro in 2013, the Italian dairy sector is an important
stakeholder in the Italian food industry. The total Italian milk production of 11 million metric
tonnes is mainly transformed into 3 million tons of fluid milk (fresh and UHT milk) and 1 million
tonnes of cheeses, sold either domestically or exported (INEA, 2014). Domestic consumption of
milk and dairy products represents the six largest consumption share within the food and
beverage industry, with a 13,4% share in 2013 (ISTAT, 2013). The total consumer purchases of
fresh milk has decreased with 1.4% from 2009 to 2010 as Italian consumers spend 1263,90 euros
on fresh milk in 2010 (Rosa & Vasciaveo, 2013).
3.1 Northern vs. Southern regions There has been an economic divide between the Northern and Southern Italian regions since the
early 1900. The Northern regions are industrially developed while the Southern regions have
problems regarding political corruption, organized crime and high unemployment rates (Astarita,
2005). Besides the regional differences in industry development, the Italian population is also
much bigger in the North compared to South Italy (ISTAT, 2015). Both these economic and
demographic differences between North and South are remarkable in the Italian milk market.
Major manufacturers and retailers such as Parmalat, Granarolo, Coop and Conad are operating
in the North of Italy. These major retailers in the North represent almost 60% of the total PLs
sales in 2014. Smaller retailers operating in the South have difficulty investing in their own PLs
growth or face competition from the bigger retail chains (IRI, 2014). These trends are in line with
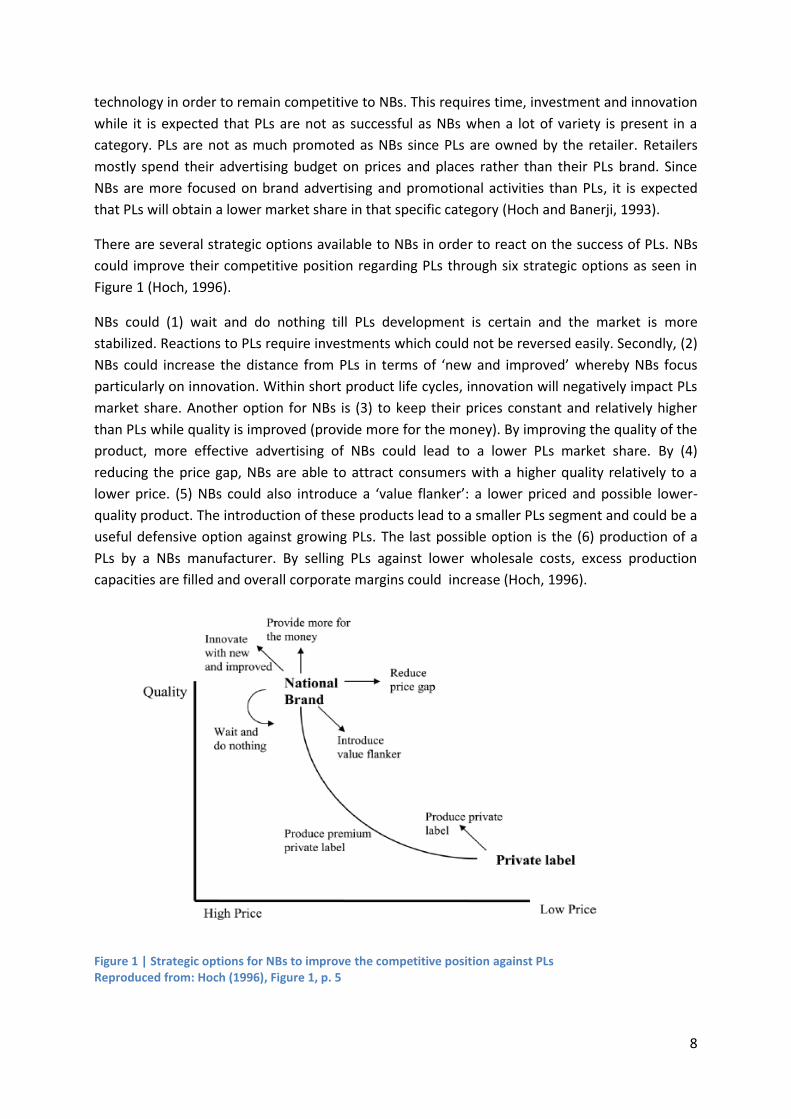
the consumer sales for Italian milk market. Consumer sales of fresh milk are relatively higher in
the Northern regions in comparison to the Southern Italian regions as shown in Figure 3.1 The
differences in consumer sales can be related to both the economic and demographic differences
per region.
Figure 3: % Sales in Volume (Fresh milk) per region 2011-2012 Source: Authors’ calculations on Symphony IRI Data (2011)
1 The Northern Italian regions consist out of Valle d’Aosta, Piemonte, Liguria, Lombardia, Trentino, Veneto,
Friuli Venezia Giulia and Emilia Romagna. The Southern region consist out of Toscana, Umbria, Sardegna, Marche, Puglia, Campania, Sicilia, Abruzzo, Molize, Basilicata and Calabria.

13
4 Data and Methodology
4.1 Data and data manipulation The data used in this research is primarily Italian scanner data coming from Symphony IRI Group.
The database used consists of 384 observations on monthly fresh and ESL milk sales at
supermarkets, hypermarkets and superettes of 16 different regions in Italy2. The data span from
the 1st of January 2011 to the 30th of December 2012 and contain information about sales in
volume, sales in value, percentage of sales in promotion, number of items per store as well as
the average price per liter. This information is available per manufacturer, brand and region for
both NBs and PLs of fresh and ESL milk.
Although information is available on the different brands from 15 manufacturers, this research
will only take into account the aggregate NBs and PLs sales data in volume, value, units, price per
liter and percentage of sales in promotion for all different regions. It is possible to identify 384
observations for fresh and ESL milk separately.
The PLs market share of both fresh and ESL milk has been calculated from the total sales in
volume per region dividing PLs sales by total sales of a particular period and region (PLs share =
PLs sales/total sales). The price differentials between PLs and NBs of both fresh and ESL milk
have been calculated subtracting the PLs milk price off the NBs milk price for each particular
period and region. The average volume per unit was obtained dividing the sales in units through
sales in volume. The Italian Raw Milk price used in this research came from the European Milk
Market Observatory and is based up on the raw milk price paid to milk producers containing real
fat and proteins.
4.2 Model Specification To analyze the effect of PLs market share on NB prices and price differentials between PLs and
NBs both a descriptive analysis and an econometric analysis will be used. The former takes into
account averages, scatter plots and other graphs representing milk prices and PLs market shares.
The discussion below will focus on the econometric analysis.
The econometric model assumes that the price charged for milk by a retailer is dependent upon
various factors including: (1) PLs market share, (2) the average volume per unit, (3) the
percentage of sales in promotion, and (4) the price of raw milk per region (Bonanno & Lopez,
2005). Taking into account regional and time effects and drawing from Bonanno & Lopez (2005),
equation 1 determines the price charged per unit of milk:
𝑃ij = α0 + β0𝑆ℎ𝑃𝐿ij + υ0𝑆ℎ𝑃𝐿ij2
+ μ0𝑉𝑢𝑁ij + τ0𝑉𝑢𝑃ij + ρ
0𝑃𝑟𝑜𝑁ij + σ0𝑃𝑟𝑜𝑃ij +
δ0𝑅𝑀j + 𝑃𝑟𝑑ij (α1 + β1𝑆ℎ𝑃𝐿ij + υ1𝑆ℎ𝑃𝐿ij2 + μ
1𝑉𝑢𝑁ij + τ1𝑉𝑢𝑃ij + ρ
1𝑃𝑟𝑜𝑁ij +
σ1𝑃𝑟𝑜𝑃ij + δ1𝑅𝑀j) + εij (1)
2 SymphonyIRI groups data from Piedmont and Aosta Valley, Abruzzo and Molise, and Basilicata and Calabria
resulting in 16 IRI regions instead of 19 Italian regions.

14
Where Pij is the price charged in the i th region in the j th time period. Prdij is a dummy variable
equal to one for NB milk (zero otherwise). The other variables used in the econometric model
are described in Table 2. The α, β, υ, μ, τ, ρ, σ and δ represent parameters to be estimated. This
model is applicable to both fresh milk and ESL milk. A similar analysis has been performed by
Sckokai & Soregaroli (2008) and Bonanno & Lopez (2005).
Table 2 | Description of the variables used in the econometric analysis.
The PL price charged per unit of milk at a given point in time is Pij = α0 + β0𝑆ℎ𝑃𝐿ij +
υ0𝑆ℎ𝑃𝐿ij2
+ μ0𝑉𝑢𝑁ij + τ0𝑉𝑢𝑃ij + ρ
0𝑃𝑟𝑜𝑁ij + σ0𝑃𝑟𝑜𝑃ij + δ0𝑅𝑀j. The NB price charged
per unit of milk is retrieved whenever the dummy variable equals one resulting in the following
measure:
𝑃ij = (α0 + α1) + (β0 + β1)𝑆ℎ𝑃𝐿ij + (υ0 + υ1)𝑆ℎ𝑃𝐿ij2 + (μ
0+ μ
1)𝑉𝑢𝑁ij + (τ0 +
τ1)𝑉𝑢𝑃ij + (ρ0
+ ρ1
)𝑃𝑟𝑜𝑁ij + (σ0 + σ1)𝑃𝑟𝑜𝑃ij + (δ0 + δ1)𝑅𝑀j.
The price differential between NBs and PLs can be described as ∆𝑃𝑟𝑑 = 𝑃𝐿𝑝 − 𝑁𝐵𝑝 which is
equal to α1 + β1𝑆ℎ𝑃𝐿ij + υ1𝑆ℎ𝑃𝐿ij2 + μ
1𝑉𝑢𝑁ij + τ1𝑉𝑢𝑃ij + ρ
1𝑃𝑟𝑜𝑁ij + σ1𝑃𝑟𝑜𝑃ij +
δ1𝑅𝑀j.
Variable Description Mean St. Deviation
Fresh ESL Fresh ESL
P Price charged per unit of milk N.A N.A N.A N.A
PLp PLs price charged per unit of milk 1.07 1.02 0.07 0.08
NBp NBs price charged per unit of milk 1.44 1.45 0.08 0.15
ShPL PLs market share based up on total sales in
volume (PLs sales/total sales)
15.50 32.22 9.12 18.78
ShPL2 Quadratic PLs market share based up on total
sales in volume (PLs sales/total sales)
323.30 1390.20 323.96 1177.68
ProN % NBs sales under (price) promotion as part of
the total sales in volume ((total promotion –
private promotion) / total NB sales in volume)
2.69 5.24 2.91 6.56
ProP % PLs sales under (price) promotion as part of
the total sales in volume
17.07 20.82 12.06 13.67
PrD Price differential between NBs and PLs (NB-PL) N.A N.A N.A N.A
VuP Average Volume per PLs unit based up on the
total units per total volume (volume/units)
1.00 0.96 0.01 0.03
VuN Average Volume per NBs unit based up on the
total units per total volume (volume/units)
0.94 0.94 0.35 0.04
RM Raw Milk Price for Italy 37.71 1.26
15
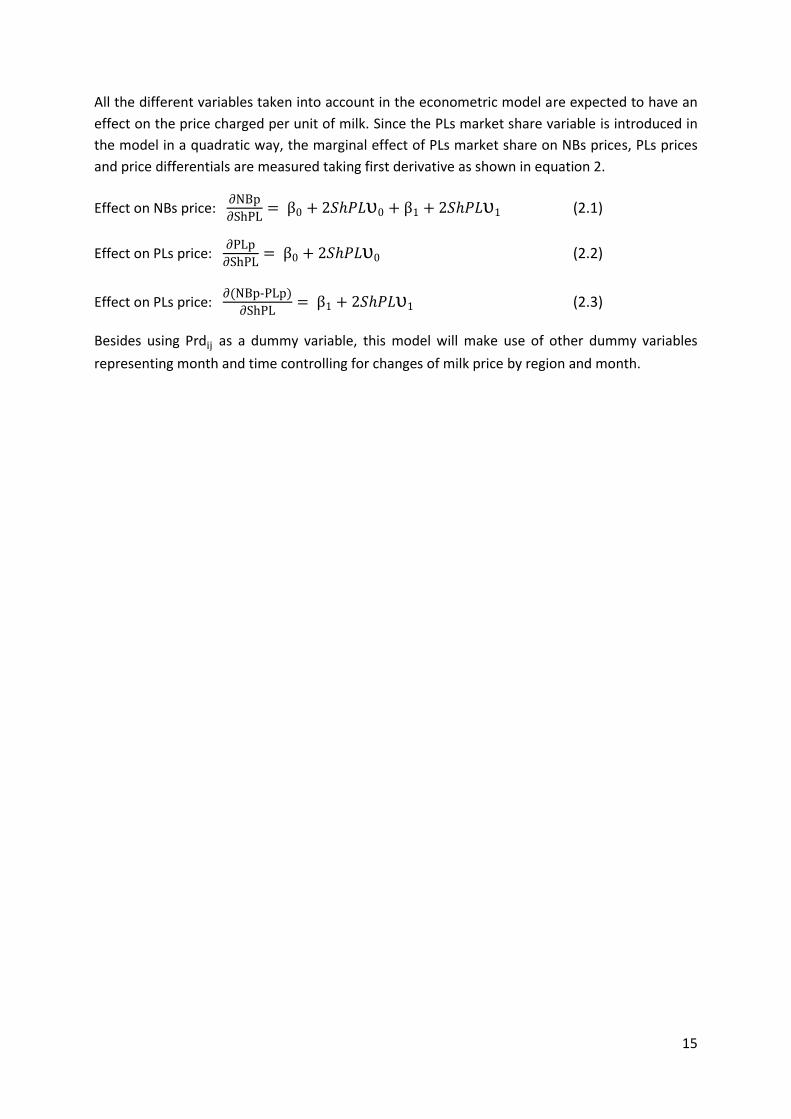
All the different variables taken into account in the econometric model are expected to have an
effect on the price charged per unit of milk. Since the PLs market share variable is introduced in
the model in a quadratic way, the marginal effect of PLs market share on NBs prices, PLs prices
and price differentials are measured taking first derivative as shown in equation 2.
Effect on NBs price: ∂NBp
∂ShPL= β0 + 2𝑆ℎ𝑃𝐿υ0 + β1 + 2𝑆ℎ𝑃𝐿υ1 (2.1)
Effect on PLs price: ∂PLp
∂ShPL= β0 + 2𝑆ℎ𝑃𝐿υ0 (2.2)
Effect on PLs price: ∂(NBp-PLp)
∂ShPL= β1 + 2𝑆ℎ𝑃𝐿υ1 (2.3)
Besides using Prdij as a dummy variable, this model will make use of other dummy variables
representing month and time controlling for changes of milk price by region and month.

16
5 Empirical results
5.1 Descriptive analysis This preliminary analysis will take into account simple averages, scatter plots and other graphs to
understand the trends and developments of the Italian market shares and milk prices.
5.1.1 Milk prices Italy is, in comparison to other EU countries, a relative large consumer of milk products as it
consumes around 250kg per capita (FAO, 2011). Milk products are a low-risk purchase and
therefore consumers are less brand-loyal and more price-sensitive regarding their milk
purchases (Nielsen, 2014). During the last 15 years the retail price for fresh milk has changed
from 113 to 149 euro per 100 litres in 2015 (CLAL, 2015). The monthly scanner data shows that
both milk prices of NBs and PLs have increased in the period 2011 - 2012 for both fresh and ESL
milk. PLs prices have been growing much faster in comparison to NBs prices as shown in Figure
4.
Figure 4 shows that differences exist regarding the milk prices of PLs, NBs, fresh and ESL milk.
Firstly, the price differential of fresh milk between NBs and PLs have decreased to a price
difference of 0.34 eurocents in December 2012, from 0.42 eurocents in January 2011. The price
differentials of ESL milk have changed from 0.48 eurocents in January 2011 to 0.46 eurocents in
December 2012. The changes in 2011 and 2012 show that the price differentials between NBs
and PLs in the fresh milk market became smaller in comparison to the ESL milk market.
0.8
0.9
1
1.1
1.2
1.3
1.4
1.5
1.6
Pri
ce (
€/L
itre
)
Milk prices (€/Litre) PLs and NBs
Price PLs Fresh Price NBs FreshPrice PLs ESL Price NBs ESL
Figure 4 | Milk prices in Volume (€/Litre) PLs and NBs Source: Author’s calculations on Symphony IRI Data (2011)

17
Secondly, PLs milk prices for both fresh and ESL milk have increased faster than the NBs milk
prices between 2011 and 2012. The PLs price of fresh milk increased by 11 eurocents while the
PLs price of ESL milk has increased by 8 eurocents. The NBs price has remained more constant
between 2011 and 2012 since it increased by only 3 eurocents while the NBs price of ESL milk
has increased with 6 eurocents.
The price differentials of NBs and PLs have increased first, and then became smaller between
2011 and 2012 for both fresh milk and ESL milk. With help of their bargaining power retailers are
able to make use of a ‘differential pricing strategy’ where the same products are sold against
different prices. NBs facing competition from PLs have either the option to maintain its price and
lose market share or drop its price and lose margin (Tellis, 1986). For both fresh and ESL milk,
NBs manufacturers have chosen to maintain (increase) their prices. In this case, it is expected
that NBs will lose market share to PLs. The impact on market share will be explained in section
5.1.2.
Comparing the changes in ESL milk prices and price differentials with that of fresh milk shows
differences between both markets. ESL milk represents a newer segment characterized by rapid
growth, high levels of investments and changing prices (Spence, 1979). Although the PLs price of
ESL milk have been increasing between 2011 and 2012, the price have been slightly fluctuating in
comparison to a more stable PLs price of fresh milk. In a mature market, pricing strategies
dependent upon other factors such as increased competition, price sensitivity, substitutes and a
reduction of firms (Parrish, Cassill & Oxenham, 2006). Since milk consumers are less brand-loyal
and highly price sensitive, manufacturers of fresh milk are cautious in changing the prices of
fresh milk (Nielsen, 2014). When NBs or PLs change the prices of fresh milk, consumers are likely
to buy substitutes or change towards another brand.

18
14
15
16
17
18
19
20
% PL Share Sales in Volume Fresh Milk
31
32
33
34
35
36
37
% PL Share Sales in Volume ESL milk
Figure 5 | PL share sales in Volume of Fresh Milk and ESL milk Source: Author’s calculations on Symphony IRI Data (2011)
5.1.2 Market shares According to the latest report of IRI (2014), Italian PLs market share have been increasing over
the last couple of years until 2014. Figure 5 shows that these findings are only applicable for ESL
milk between 2011 and 2012 and not for fresh milk. The analysis for the Italian scanner data at
our disposal, shows that the PLs market share of fresh milk has been decreasing in 2011 and
2012 while PLs market share of ESL milk has been slightly increasing. Comparing the market
shares of both fresh and ESL milk shows that ESL milk has a remarkable higher market share than
fresh milk.
Since NBs manufacturers have chosen to maintain (increase) NBs prices of fresh milk as shown in
Figure 4, it is expected that the market share of PLs increases. Figure 5 shows that this theory is
only applicable for ESL milk due to a decrease in PLs market share of fresh milk. Since the fresh
milk market, as a mature market, is characterized by high levels of competition, price sensitivity,
substitutes, a reduction of firms and a great variety of products, PLs market share are likely to be
decreasing according to Hoch & Banerji (1993) (Parrish, Cassill & Oxenham, 2006). Since the PLs
market share of ESL milk is increasing, NBs market share will be decreasing which is in line with
the theory of Spence (1979).
From Figure 5 we can see that PLs market share of fresh or ESL milk have large falls in July and
August, which could be explained by a seasonal variation in demand due to the start of the
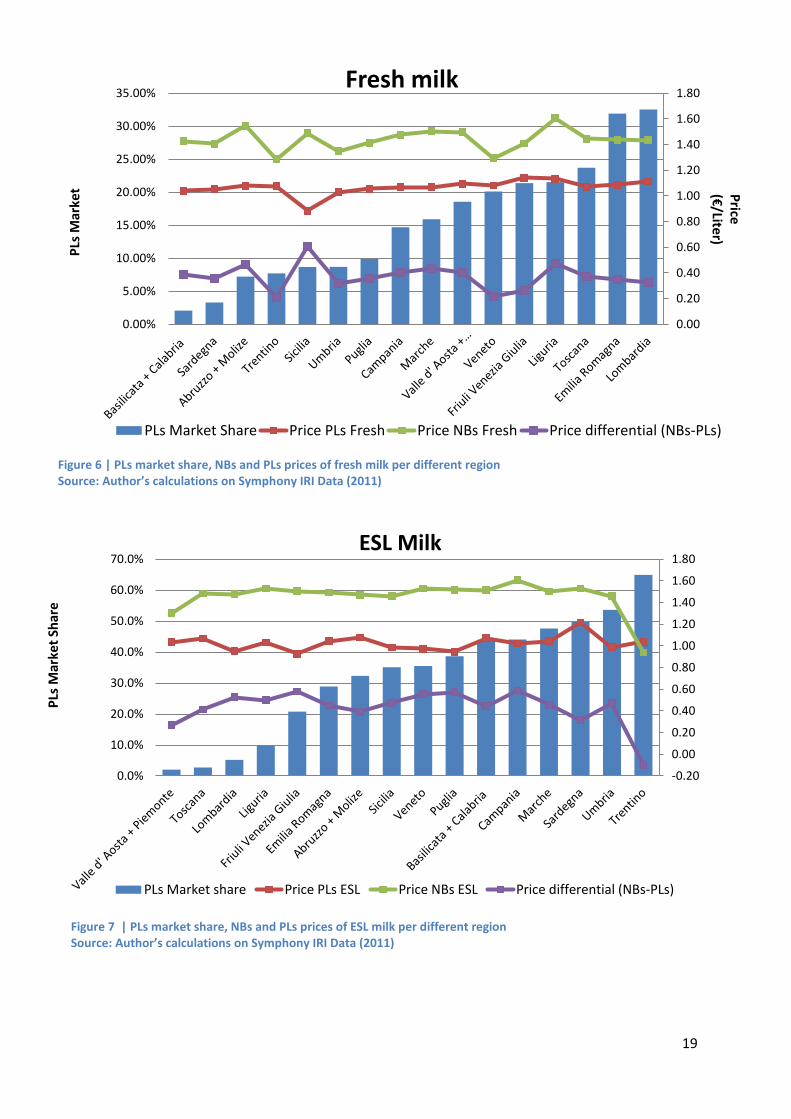
school year in September. Figure 6 and 7 show milk prices and PLs market share by region. The
data related to these figures can be found in Appendix 8.1. The NBs and PLs prices and PLs
market shares used in these figures are the averages taken per different region.
19
0.00
0.20
0.40
0.60
0.80
1.00
1.20
1.40
1.60
1.80
0.00%
5.00%
10.00%
15.00%
20.00%
25.00%
30.00%
35.00%Fresh milk
PLs Market Share Price PLs Fresh Price NBs Fresh Price differential (NBs-PLs)
PLs
Mar
ket P
rice (€
/Liter)
-0.20
0.00
0.20
0.40
0.60
0.80
1.00
1.20
1.40
1.60
1.80
0.0%
10.0%
20.0%
30.0%
40.0%
50.0%
60.0%
70.0%ESL Milk
PLs Market share Price PLs ESL Price NBs ESL Price differential (NBs-PLs)
Figure 6 | PLs market share, NBs and PLs prices of fresh milk per different region Source: Author’s calculations on Symphony IRI Data (2011)
Figure 7 | PLs market share, NBs and PLs prices of ESL milk per different region Source: Author’s calculations on Symphony IRI Data (2011)
Price
(€/Liter)
PLs
Mar
ket
Shar
e
20
0.1
0.2
0.3
0.4
0.5
0.6
0.7
0.8
0.4
0.6
0.8
1
1.2
1.4
1.6
1.8
0.00 0.05 0.10 0.15 0.20 0.25 0.30 0.35 0.40
Pri
ce
PL Market Share
Observed PL shares and Milk prices for Fresh milk
Private Label National Brand Price differential Fresh
Price
diffe
ren
tial Analysing Figure 6 and Figure 7 suggest that milk prices of NBs are in general always higher than
PLs, except for one region (Trentino) which holds a high value of PLs market share for ESL milk.
The market shares of PLs differ per region while PLs prices remain constant around 1.00 euro for
both fresh and ESL milk regardless a change in PLs market share. NBs and PLs prices seem not to
be highly affected by a fluctuating PLs market share since both prices remained relatively
constant while market shares differ per region. The actual PLs market shares, NBs and PLs prices
can be found in Appendix 8.1 where the market shares and prices are based up on total averages
per volume.
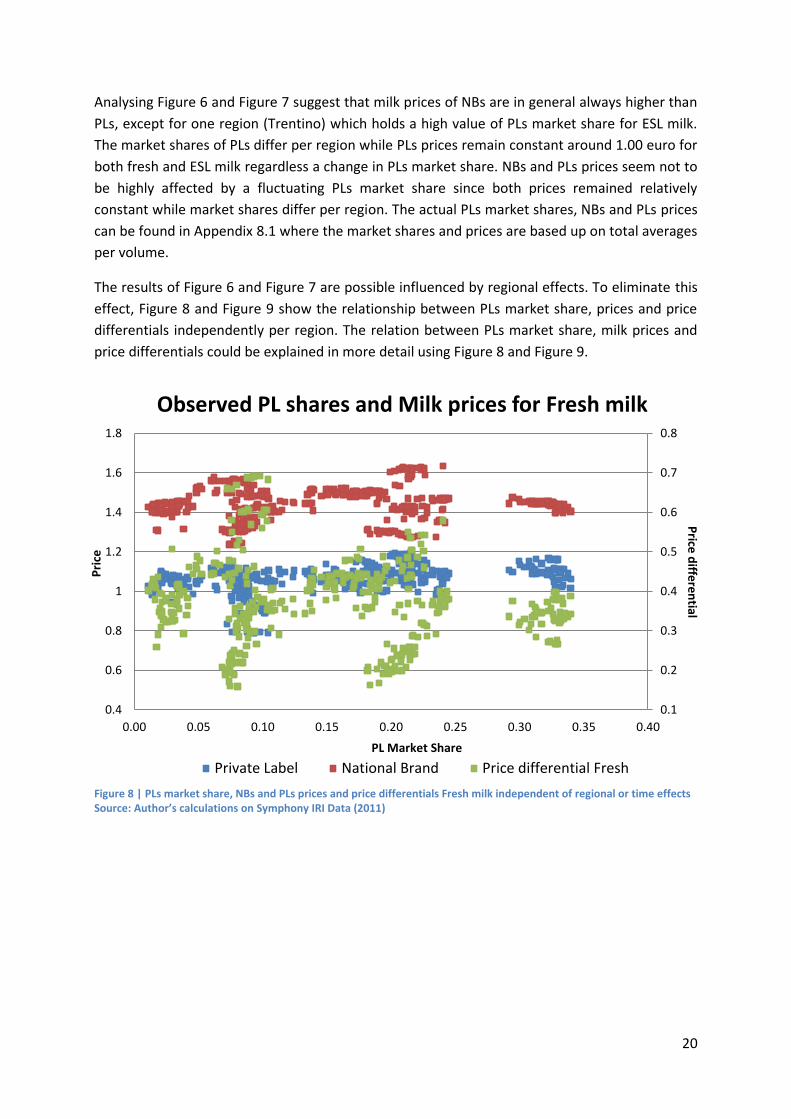
The results of Figure 6 and Figure 7 are possible influenced by regional effects. To eliminate this
effect, Figure 8 and Figure 9 show the relationship between PLs market share, prices and price
differentials independently per region. The relation between PLs market share, milk prices and
price differentials could be explained in more detail using Figure 8 and Figure 9.
Figure 8 | PLs market share, NBs and PLs prices and price differentials Fresh milk independent of regional or time effects Source: Author’s calculations on Symphony IRI Data (2011)
21
-0.3
-0.2
-0.1
0
0.1
0.2
0.3
0.4
0.5
0.6
0.7
0.8
0
0.2
0.4
0.6
0.8
1
1.2
1.4
1.6
1.8
0.00 0.10 0.20 0.30 0.40 0.50 0.60 0.70 0.80
Pri
ce
PL Market Share
Observed PL shares and Milk prices for ESL milk
Private Label National Brand Price differential Fresh
Price
diffe
ren
tial
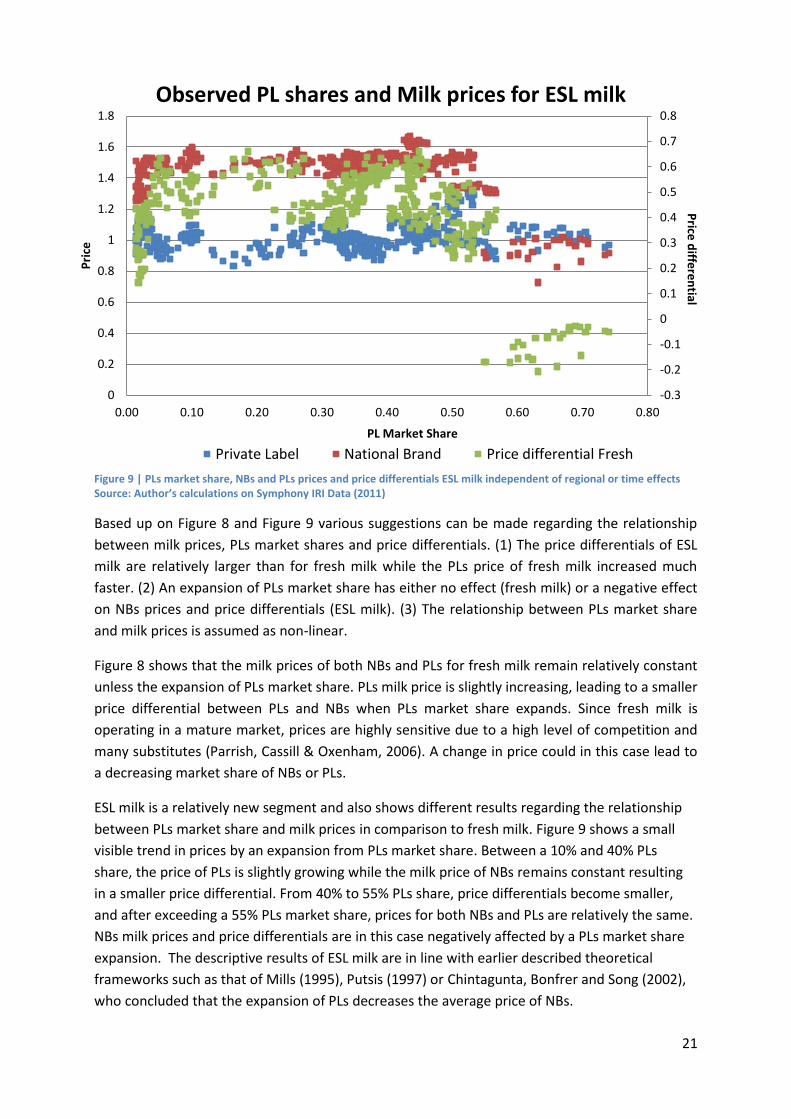
Figure 9 | PLs market share, NBs and PLs prices and price differentials ESL milk independent of regional or time effects Source: Author’s calculations on Symphony IRI Data (2011)
Based up on Figure 8 and Figure 9 various suggestions can be made regarding the relationship
between milk prices, PLs market shares and price differentials. (1) The price differentials of ESL
milk are relatively larger than for fresh milk while the PLs price of fresh milk increased much
faster. (2) An expansion of PLs market share has either no effect (fresh milk) or a negative effect
on NBs prices and price differentials (ESL milk). (3) The relationship between PLs market share
and milk prices is assumed as non-linear.
Figure 8 shows that the milk prices of both NBs and PLs for fresh milk remain relatively constant
unless the expansion of PLs market share. PLs milk price is slightly increasing, leading to a smaller
price differential between PLs and NBs when PLs market share expands. Since fresh milk is
operating in a mature market, prices are highly sensitive due to a high level of competition and
many substitutes (Parrish, Cassill & Oxenham, 2006). A change in price could in this case lead to
a decreasing market share of NBs or PLs.
ESL milk is a relatively new segment and also shows different results regarding the relationship
between PLs market share and milk prices in comparison to fresh milk. Figure 9 shows a small
visible trend in prices by an expansion from PLs market share. Between a 10% and 40% PLs
share, the price of PLs is slightly growing while the milk price of NBs remains constant resulting
in a smaller price differential. From 40% to 55% PLs share, price differentials become smaller,
and after exceeding a 55% PLs market share, prices for both NBs and PLs are relatively the same.
NBs milk prices and price differentials are in this case negatively affected by a PLs market share
expansion. The descriptive results of ESL milk are in line with earlier described theoretical
frameworks such as that of Mills (1995), Putsis (1997) or Chintagunta, Bonfrer and Song (2002),
who concluded that the expansion of PLs decreases the average price of NBs.
22
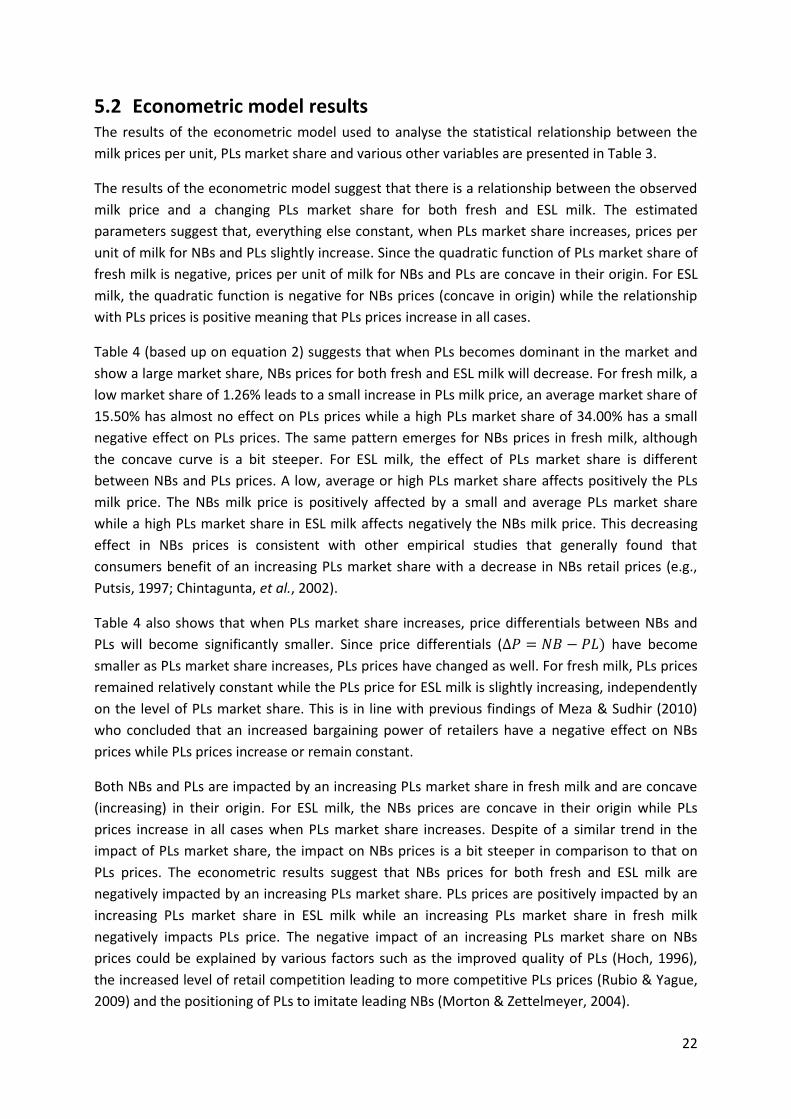
5.2 Econometric model results The results of the econometric model used to analyse the statistical relationship between the
milk prices per unit, PLs market share and various other variables are presented in Table 3.
The results of the econometric model suggest that there is a relationship between the observed
milk price and a changing PLs market share for both fresh and ESL milk. The estimated
parameters suggest that, everything else constant, when PLs market share increases, prices per
unit of milk for NBs and PLs slightly increase. Since the quadratic function of PLs market share of
fresh milk is negative, prices per unit of milk for NBs and PLs are concave in their origin. For ESL
milk, the quadratic function is negative for NBs prices (concave in origin) while the relationship
with PLs prices is positive meaning that PLs prices increase in all cases.
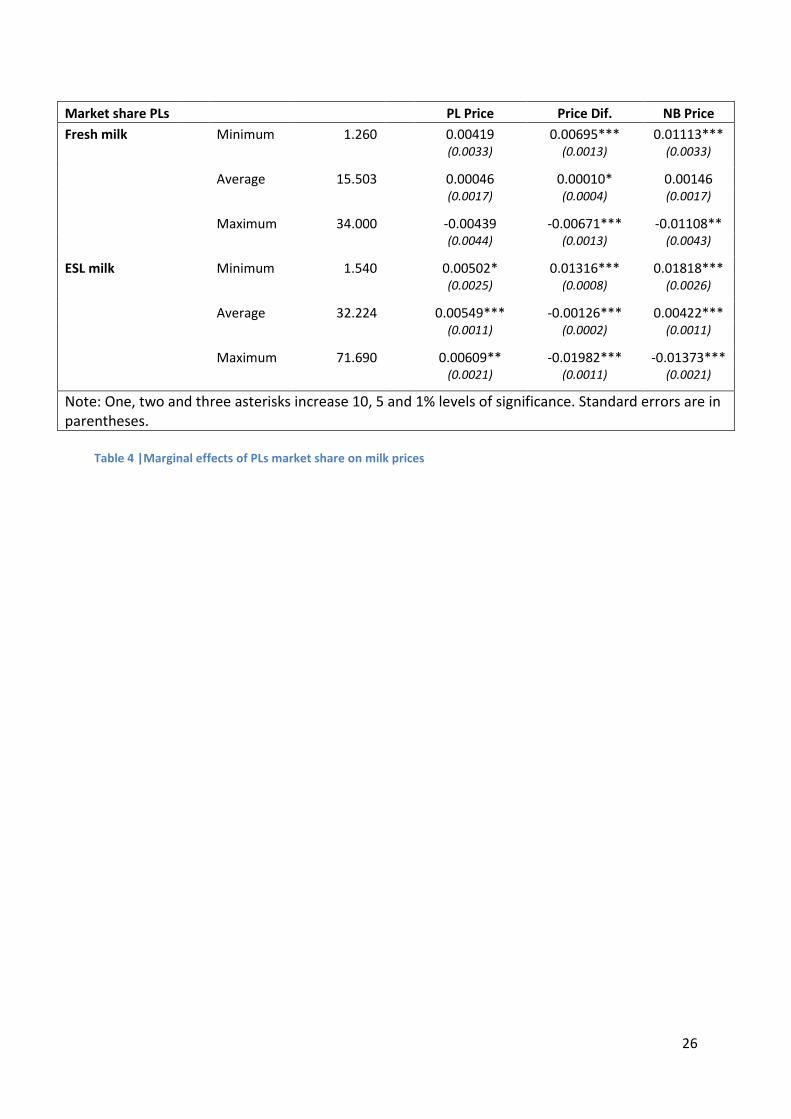
Table 4 (based up on equation 2) suggests that when PLs becomes dominant in the market and
show a large market share, NBs prices for both fresh and ESL milk will decrease. For fresh milk, a
low market share of 1.26% leads to a small increase in PLs milk price, an average market share of
15.50% has almost no effect on PLs prices while a high PLs market share of 34.00% has a small
negative effect on PLs prices. The same pattern emerges for NBs prices in fresh milk, although
the concave curve is a bit steeper. For ESL milk, the effect of PLs market share is different
between NBs and PLs prices. A low, average or high PLs market share affects positively the PLs
milk price. The NBs milk price is positively affected by a small and average PLs market share
while a high PLs market share in ESL milk affects negatively the NBs milk price. This decreasing
effect in NBs prices is consistent with other empirical studies that generally found that
consumers benefit of an increasing PLs market share with a decrease in NBs retail prices (e.g.,
Putsis, 1997; Chintagunta, et al., 2002).
Table 4 also shows that when PLs market share increases, price differentials between NBs and
PLs will become significantly smaller. Since price differentials (∆𝑃 = 𝑁𝐵 − 𝑃𝐿) have become
smaller as PLs market share increases, PLs prices have changed as well. For fresh milk, PLs prices
remained relatively constant while the PLs price for ESL milk is slightly increasing, independently
on the level of PLs market share. This is in line with previous findings of Meza & Sudhir (2010)
who concluded that an increased bargaining power of retailers have a negative effect on NBs
prices while PLs prices increase or remain constant.
Both NBs and PLs are impacted by an increasing PLs market share in fresh milk and are concave
(increasing) in their origin. For ESL milk, the NBs prices are concave in their origin while PLs
prices increase in all cases when PLs market share increases. Despite of a similar trend in the
impact of PLs market share, the impact on NBs prices is a bit steeper in comparison to that on
PLs prices. The econometric results suggest that NBs prices for both fresh and ESL milk are
negatively impacted by an increasing PLs market share. PLs prices are positively impacted by an
increasing PLs market share in ESL milk while an increasing PLs market share in fresh milk
negatively impacts PLs price. The negative impact of an increasing PLs market share on NBs
prices could be explained by various factors such as the improved quality of PLs (Hoch, 1996),
the increased level of retail competition leading to more competitive PLs prices (Rubio & Yague,
2009) and the positioning of PLs to imitate leading NBs (Morton & Zettelmeyer, 2004).
23
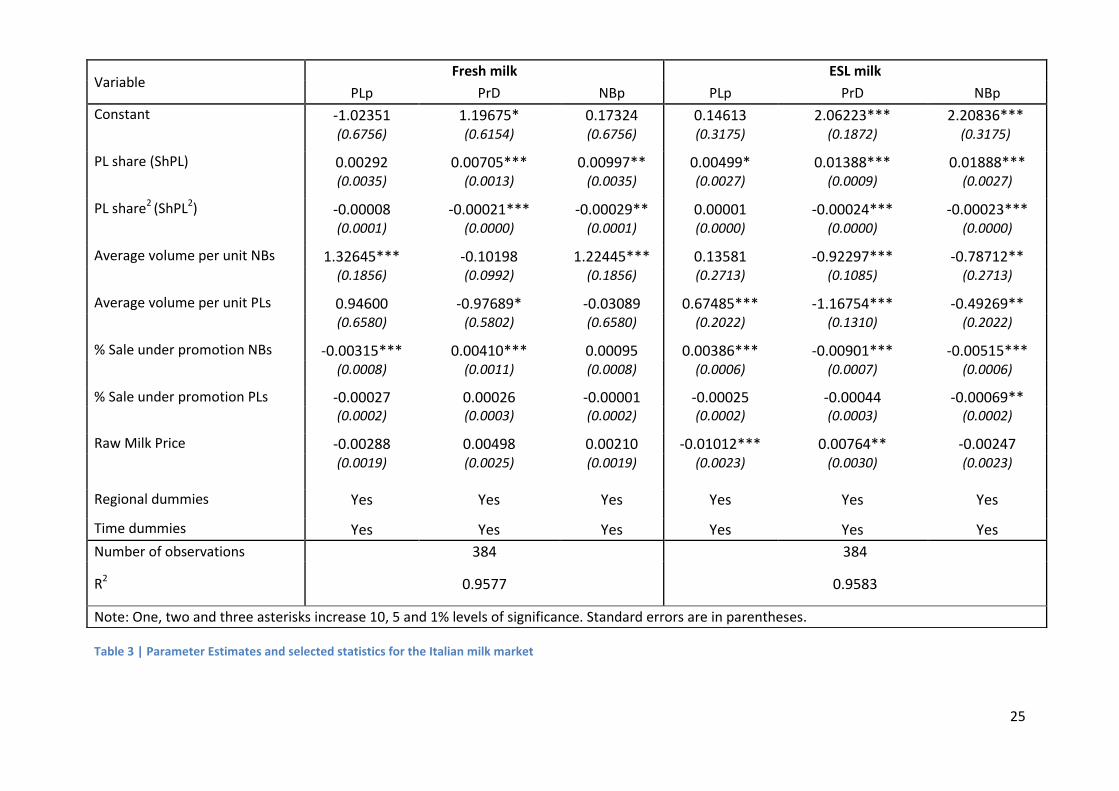
5.2.1 Average volume per unit The average volume per unit for both NBs and PLs has been included into the model to assess
how NBs or PLs milk prices is affected by an increasing volume. Empirical evidence shows that
larger package sizes are having lower unit costs than medium-size packages or small packages
(Wansink, 1996). With having lower unit costs for larger volumes, it is expected that when the
volume per package increases, the price of volume per unit will decrease. The results of Table 3
show that this hypothesis is validated for ESL milk when the average volume per unit of NBs
increases. For both fresh and ESL milk, the average volume per unit of PLs shows opposite results
regarding this hypothesis meaning that when PLs volume increases, PLs prices increase as well
while NBs prices decrease.
Based up on the hypothesis used in this research, various reasons could possible explain this
surprising result. (1) PLs price per unit of milk tend to be consistent with the volume offered
since the PLs price increases when the volume per unit of either NBs or PLs increases as well. (2)
In reaction to an increasing PLs price, NBs prices seem to decrease when PLs increases the
average volume per unit. This could be related to a ‘price reduction’ strategy of NBs (Hoch, 2002)
where NBs are able to attract new consumers based up on a high quality product and a price
reduction. (3) Since NBs prices decrease more than PLs prices in all cases, another possible
explanation could be that NBs are able to reduce production costs by packaging and selling
larger volumes. All these possible explanations are assumptions and need to be confirmed by
further research.
5.2.2 Sales under promotion The percentage of sales under promotion has been included in the model to assess how
promotional activities affect either the PLs or NBs price. In this case, it is expected that when PLs
or NBs put products into promotion, prices of milk per unit will decrease for the product under
promotion. This hypothesis is only accepted for promotional activities of NBs in ESL milk where
PLs prices significantly increase while NBs prices slightly decrease. The PLs price for fresh milk is
decreasing under the promotional activities of NBs while NBs prices are slightly increasing
although the coefficient of NBs price is not significant. This surprising result of a decreasing PLs
price on NBs promotional activities could be related to previous findings of Hoch (2002), who
found that PLs make use of the price shielding method where PLs price reductions are
introduced to compensate for NBs promotional activities. The promotional activities of PLs show
that both PLs and NBs are slightly negatively affected for fresh and ESL milk. Since NBs decrease
their prices as well when PLs are under promotion, NBs tend to remain price competitive and
follow the price reductions of PLs although none of the coefficients is significant.
5.2.3 Raw milk price As the raw milk price increases, it is expected that both NBs and PLs prices will increase since
raw milk is an input of milk. Table 3 shows that when the raw milk price increases, all milk prices
per unit are impacted negatively except for the NBs price in fresh milk. The impact of the raw
milk price is not significant in most cases although the negative impact on PLs prices and price
differentials in ESL milk is statistically significant. This lack of statistical significance in fresh milk
24
is in line with previous findings of Bonanno and Lopez (2005) who found that the price of raw
milk does not have a significant impact on the milk prices or price differentials in US
supermarkets.
5.2.4 Month and Region variables The econometric model also included regional and monthly dummy variables to account for
variations in average prices over space and time. The monthly dummy variables show the
average differences in price compared to the baseline price in December, which have been
excluded from this model. The estimated coefficients for these dummy variables can be found in
Appendix 2. The results show that the milk prices per unit of fresh milk are on average higher in
July, August, September and November compared to the price of December. For ESL milk, the
milk price per unit is on average higher in August and September in comparison to December.
These results show that the milk price per unit for both fresh and ESL milk is on average higher in
the third quarter compared to the price of December. The on average higher prices in the third
quarter are in line with the seasonality and growth of PLs market share around August and
September as shown in Figure 5.
For the regional dummy variables, different regions have been excluded from the model. The
price of Trentino has been excluded for ESL milk, while the price of Basilicata & Calabria will be
the baseline for fresh milk. The coefficients of the regional dummies in the ESL milk market are
all positive and significant. Compared to milk price of Trentino, the ESL milk price is on average
the highest in Basilicata & Calabria, Sicilia and Campania. This is an interesting result considering
that all three regions are located in Southern Italy where consumption is relatively lower in
comparison to the North (Trentino). Since most retailers are located in the North, it is expected
that the level of price competition is lower due to the lower level of retail concentration (Rubio
& Yague, 2009). The significant coefficients of the regional dummies in fresh milk are either
lower or higher in comparison to the price of Basillicata & Calabria. The fresh milk price is on
average lower in Veneto and Umbria compared to Basilicata & Calabria while the average milk
price is higher in Abruzzo & Molize, Campania and Liguria. Other regions are not significant in
relation to the price of Basillicata & Calabria.
25
Table 3 | Parameter Estimates and selected statistics for the Italian milk market
Variable Fresh milk ESL milk
PLp PrD NBp PLp PrD NBp
Constant -1.02351 1.19675* 0.17324 0.14613 2.06223*** 2.20836*** (0.6756) (0.6154) (0.6756) (0.3175) (0.1872) (0.3175)
PL share (ShPL) 0.00292 0.00705*** 0.00997** 0.00499* 0.01388*** 0.01888*** (0.0035) (0.0013) (0.0035) (0.0027) (0.0009) (0.0027)
PL share2 (ShPL2) -0.00008 -0.00021*** -0.00029** 0.00001 -0.00024*** -0.00023*** (0.0001) (0.0000) (0.0001) (0.0000) (0.0000) (0.0000)
Average volume per unit NBs 1.32645*** -0.10198 1.22445*** 0.13581 -0.92297*** -0.78712** (0.1856) (0.0992) (0.1856) (0.2713) (0.1085) (0.2713)
Average volume per unit PLs 0.94600 -0.97689* -0.03089 0.67485*** -1.16754*** -0.49269** (0.6580) (0.5802) (0.6580) (0.2022) (0.1310) (0.2022)
% Sale under promotion NBs -0.00315*** 0.00410*** 0.00095 0.00386*** -0.00901*** -0.00515*** (0.0008) (0.0011) (0.0008) (0.0006) (0.0007) (0.0006)
% Sale under promotion PLs -0.00027 0.00026 -0.00001 -0.00025 -0.00044 -0.00069** (0.0002) (0.0003) (0.0002) (0.0002) (0.0003) (0.0002)
Raw Milk Price -0.00288 0.00498 0.00210 -0.01012*** 0.00764** -0.00247 (0.0019) (0.0025) (0.0019) (0.0023) (0.0030) (0.0023)
Regional dummies Yes Yes Yes Yes Yes Yes
Time dummies Yes Yes Yes Yes Yes Yes
Number of observations 384 384
R2 0.9577 0.9583
Note: One, two and three asterisks increase 10, 5 and 1% levels of significance. Standard errors are in parentheses.
26
Table 4 |Marginal effects of PLs market share on milk prices
Market share PLs
PL Price Price Dif. NB Price
Fresh milk
Minimum 1.260
0.00419 0.00695*** 0.01113***
(0.0033) (0.0013) (0.0033)
Average 15.503
0.00046 0.00010* 0.00146
(0.0017) (0.0004) (0.0017)
Maximum 34.000
-0.00439 -0.00671*** -0.01108**
(0.0044) (0.0013) (0.0043)
ESL milk
Minimum 1.540
0.00502* 0.01316*** 0.01818***
(0.0025) (0.0008) (0.0026)
Average 32.224
0.00549*** -0.00126*** 0.00422***
(0.0011) (0.0002) (0.0011)
Maximum 71.690
0.00609** -0.01982*** -0.01373***
(0.0021) (0.0011) (0.0021)
Note: One, two and three asterisks increase 10, 5 and 1% levels of significance. Standard errors are in parentheses.

27
6 Conclusions and Recommendations
6.1 Conclusions This research has analysed the effect of the expansion of PLs market share on PLs and NBs prices
in the Italian milk market. The impact of an increasing PLs market share on the milk prices of NBs
and PLs is measured using 384 IRI scanner data observations for fresh and ESL milk for the period
January 2011 - December 2012, by means of descriptive and econometric analyses and is based
upon the PLs market shares of 16 different Italian regions.
In order to get an understanding of the price competition between NBs and PLs in the Italian
milk market, the price competition between NBs and PLs and the developments within the
Italian milk market were described. PLs products are expected to hold a 30% market share in the
total global grocery sales in 2020 (Lamey et al., 2007). This growing success of PLs has been a
serious challenge for NBs impacting their market shares and prices to remain competitive
(Dawes & Nenycz-Thiel, 2013). Despite of that PLs are increasing worldwide, the development of
PLs in Italy is relatively low over the last few years. After 5 years of significant growth in all
categories, market share of PLs has stopped growing in Italy in 2014 due to the fact that
consumers have become more price sensitive and NBs have increased their promotional
activities (IRI, 2014). Despite of milk products being a low-risk purchase, it is assumed that the
growth of PLs in the Italian milk market has been constant over the last few years as well
although no relevant data of 2014 was available.
Based on the results of the descriptive and econometric analyses, we find that NBs prices
increase when PLs market share is relatively low or close to the sample average. When PLs
market share increases above average, NBs prices decrease in both fresh and ESL milk. The
negative impact on NBs prices could be attributed to various factors, including an improved
quality of PLs (Hoch, 1996), an increased level of retail concentration (Rubio & Yague, 2009) and
the positioning of PLs regarding NBs (Morton & Zettelmeyer, 2004).
These factors can also explain the impact of an increasing PLs market share on price differentials
between NBs and PLs. The econometric model shows that PLs prices remain relatively constant,
resulting in smaller price differentials between NBs and PLs when PLs market share increases.
Retailers make use of their bargaining power to obtain lower PLs wholesale prices while NBs
prices are not affected (Meza & Sudhir, 2010). This leads to an increase in PLs market share,
where NBs prices decrease, PLs prices remain constant or increase and price differentials
become smaller. With an increase in PLs market share, the price competition between NBs and
PLs increases and Italian milk consumers will benefit from lower milk prices.
28
6.2 Recommendations The results of this research can be useful for different stakeholders in the Italian milk market and
in particular the retailer and NBs manufacturer.
The econometric results can be useful for the retailer in various ways. Firstly, it could be useful
for retailers to see that an increasing PLs market share has a negative impact on NBs prices with
price differentials becoming smaller as well. Since NBs prices decrease and price differentials are
expected to become smaller, PLs are likely to lose market share since their advantage of being a
‘lower-priced’ product becomes less significant. Based on these results, retailers should
implement or adapt PLs pricing strategies in order to react to changes in NBs prices and to
remain price competitive. Secondly, the econometric results show that the promotional activities
of NBs lead to an increasing PLs price for ESL milk. In order to resolve this increase of PLs prices,
retailers could make use of the price shielding method of Hoch (2002). When NBs are under
promotion, retailers could introduce PLs promotional activities to remain competitive in price.
Thirdly, retailers should be aware of the fact that when the average volume per unit increases,
PLs prices increase much faster compared to NBs prices. In this case, it would be more difficult
for PLs to remain competitive in price. Production efficiency and lower wholesale costs are
possible options for PLs to reduce prices with the average volume per unit becoming bigger.
This research also contains various useful results for NBs manufacturers. Firstly, the descriptive
analysis showed that various factors have contributed to the success of PLs. Since retailers could
not influence the prices, marketing strategies, product qualities and brand images of NBs (Hoch,
1996), NBs manufacturers should focus on the improvement of these factors. With a higher
product quality, a stronger brand image and the investment of marketing activities, NBs
manufacturers could differentiate themselves from PLs. Secondly, NBs manufacturers could
increase the average volume per unit which will negatively impact the PLs price compared to the
NBs price. By producing larger volumes in combination with a high level of production efficiency,
NBs can remain competitive regarding PLs. Thirdly, NBs manufacturers could in particular focus
on the production and promotion of ESL milk in order to gain competitive advantage regarding
PLs. The impact of both an increase in promotional activities and the average volume per unit
will in most cases decrease NBs prices while PLs prices either increase or decrease relatively
slower. With larger packaged volumes under promotion in ESL milk, NBs manufacturers are likely
able to improve their competitive advantage and their market share.
29
6.3 Limitations and future research This research could be improved in various ways to resolve its shortcomings. First, the
relationship between PLs and NBs could be explained in more detail by using a bigger database
containing more years of data. The database used in this research gave a clear overview of the
development of PLs regarding NBs in between 2011 and 2012, but having a longer time span of
data could allow to monitor more changes over time in the evolution of PLs.
Second, further research has to explain the other independent variables, such as average volume
per unit, promotional activities and the raw milk price in more detail. Within this research, the
focus was specifically on the impact of an increasing PLs market share on NBs prices and price
differentials while the other variables had an impact on the milk price per unit as well. The
impact of the average volume per unit, promotional activities and raw milk price showed
surprising results in some cases regarding the hypotheses. Further research has to conform the
hypotheses used in this research.
Third, further research could focus on a few particular brands to get a better understanding of
the relationship between the dependent and independent variables. The independent variables
within this research were based up on aggregate data per product, region and month. With help
of a case study, which includes a small, medium and large brand, the specific impact of PLs
market share, promotional activities, average volume per unit and raw milk price on NBs or PLs
prices could be measured in more detail.
Fourth, the effect of PLs market share on the milk prices per unit was measured by considering
the different Italian regions. In a follow-up study with more detailed data, the analysis could also
take into account the price competition between PLs and NBs at different types of retail outlets,
such as supermarkets, hypermarkets and superrettes. Based up on this information,
manufacturers could possibly adapt their promotional activities and their pricing strategies to
counteract the expansion of PLs in different channels.

30
7 References Astarita, Tommaso (2005). Between Salt Water and Holy Water: A History of Southern Italy. New
York: W. W. Norton & Company. ISBN 0-393-05864-6
Biasetti, D. (2013). Italian Food Retail and Distribution Sector Report. USDA Foreign Agriculture
Service, pg 5-6.
Bonanno, A., & Lopez, R. (2005). Private label expansion and milk prices. Berkeley Electronic
Press, 2(3) , pg 2-4.
Bunte, F. H. J., Van Galen, M. A., de Winter, M. A., Dobson, P., Bergès-Sennou, F., Monier-Dilhan,
S., ... & Szajkowska, A. (2011). The impact of private labels on the competitiveness of the
European food supply chain (p. 201). European Union.
Chakraborty, S. (2013). Private-Label Brands – A literature Review. SIT Journal of Management,
2278-9111, pg 75-88.
Chintagunta, P. K., Bonfrer, A., & Song, I. (2002). Investigating the effects of store-brand
introduction on retailer demand and pricing behavior. Management Science, 48(10), 1242-1267.
Dawes, J., & Nenycz-Thiel, M. (2013). Analyzing the intensity of private label competition across
retailers. Journal of Business Research, 66(1), 60-66.
European Commission (2014). Analysis of the EU dairy sector. Agriculture and Rural
Development. Used on 18th of March 2015, from: http://ec.europa.eu/agriculture/russian-
import-ban/pdf/dairy-production_en.pdf
FAO Statistics Division (2011). Milk consumption – Excluding Butter (Total) (kg/capita/yr). Used
on 8th of April 2015, from:
http://faostat.fao.org/site/610/DesktopDefault.aspx?PageID=610#ancor
Gabrielsen, T. S., & Sørgard, L. (2000). Private labels, price rivalry, and public policy. Department
of Economics, UCSB.
Gabrielsen, T. S., Steen, F., & Sorgard, L. (2001). Private Label Entry as a Competitive Force. An
analysis of price responses in the Norwegian food sector, www. uib. no/people/sectg/PL-
papersub. pdf [01.04. 2005].
Goolsbee, A., Levitt, S., & Syverson, C. (2012). Microeconomics. Worth Publishers. Used from,
http://www.macmillanhighered.com/Catalog/static/worth/goolsbeepreview/images/Goolsbee1
e_Ch10.pdf, pg 396 – 400.
Hoch, S. J., & Banerji, S. (1993). When do private labels succeed. Sloan Management Review, 34.
Hoch, S. J. (1996). How should national brands think about private labels. Sloan Management
Review. 37 (Winter), 89-102. Used on 4th of June 2015, from:
http://sloanreview.mit.edu/article/how-should-national-brands-think-about-private-labels/

31
Hoch, S. J. (2002). Why Private Labels Show Long-Term Market Share Evolution (Doctoral
dissertation, School of Management, Cornell University).
Hollingsworth, A. (2004). Increasing retail concentration: Evidence from the UK food retail
sector. British Food Journal, 106(8), 629-638.
CLAL (2015). Italy: retail milk prices in comparison. CLAL. Used on 28th of April 2015, from:
http://www.clal.it/clal20/en/index.php?section=latte_milano
INEA (2014). Italian Agriculture in figures 2013. Istituto Nazionale Di Economia Agraria. Used on
25th of March 2015, from:
http://dspace.inea.it/bitstream/johan/843/1/Italian_agriculture_figures_2013.pdf
IRI (2014). Private label in Western Economies: Closing the price gap, losing share. IRI. Used on
11th of May 2015, from:
http://www.iriworldwide.eu/Portals/0/articlepdfs/PrivateLabel2014/Private-
Label_report_Dec2014_nolinks.pdf
ISTAT (2013). Household consumption expenditure 2013 Italy. ISTAT. Used on 2nd of April 2015,
from: http://www.istat.it/en/files/2014/07/Households-consumption-expenditure-
2013.pdf?title=Household+consumptions+-+8+Jul+2014+-+Full+text.pdf
ISTAT (2015). Resident population and population change. ISTAT. Used on 17th of June 2015,
from: http://www.istat.it/en/archive/162261
Johansson, U., & Burt, S. (2004). The buying of private brands and manufacturer brands in
grocery retailing: a comparative study of buying processes in the UK, Sweden and Italy. Journal
of Marketing Management, 20(7-8), 799-824.
Jongeneel, R., Burrell, A., & Kavallari, A. (2011). Evaluation of CAP measures applied to the dairy
sector. The Hague: LEI Wageningen UR (University & Research Centre).
Lamey, L., Deleersnyder, B., Dekimpe, M. G., & Steenkamp, J. B. E. (2007). How business cycles
contribute to private-label success: Evidence from the United States and Europe. Journal of
Marketing, 71(1), 1-15.
Lamey, L., Deleersnyder, B., Dekimpe, M., & Steenkamp, J. B. (2008). How to mitigate private-
label success in recessions? A cross-category investigation. Research Report Faculty of Business
and Economics (KULeuven); OR 0802.
Kolstad, J., & Rysstad, G. (2006). Extended shelf life milk—advances in technology. International journal of dairy technology, 59(2), 85-96. Marquer, P. (2013). Portrait of the EU milk production sector. EUROSTAT, 2314-9647.
Meza, S., & Sudhir, K. (2010). Do private labels increase retailer bargaining power?. Quantitative
Marketing and Economics, 8(3), 333-363.
32
Mills, D. E. (1995). Why retailers sell private labels. Journal of Economics & Management
Strategy, 4(3), 509-528.
Morton, F. S., & Zettelmeyer, F. (2004). The strategic positioning of store brands in retailer–
manufacturer negotiations. Review of industrial organization, 24(2), 161-194.
Nielsen (2014). The state of private label around the world: where it’s growing, where it’s not,
and what the future holds. Nielsen. Used on 2nd of June 2015, from:
http://www.nielsen.com/content/dam/nielsenglobal/kr/docs/global-
report/2014/Nielsen%20Global%20Private%20Label%20Report%20November%202014.pdf
Parrish, E. D., Cassill, N. L., & Oxenham, W. (2006). Niche market strategy for a mature
marketplace. Marketing Intelligence & Planning, 24(7), 694-707.
Putsis Jr, W. P. (1997). An empirical study of the effect of brand proliferation on private label–
national brand pricing behavior. Review of industrial Organization, 12(3), 355-371.
Rosa, F., & Vasciaveo, M. (2013). Imperfect Competition in the Italian Dairy Chain: Consequences
for the Price Transmission and Welfare Distribution. Proceedings in Food System Dynamics, 275-
298.
Rubio, N. and Yague, M.J. (2009), “The determinants of store brand market share: a temporal and cross-national analysis”, International Journal of Market Research, Vol. 5 No. 14, pp. 501-19. Sckokai, P., & Soregaroli, C. (2008). Impact of private label development across retail formats:
Evidences from the Italian dairy market. Review of Agricultural and Environmental Studies, 87(2),
27-47.
Sethi, R., Smith, D. C., & Park, C. W. (2001). Cross-functional product development teams,
creativity, and the innovativeness of new consumer products. Journal of Marketing Research,
38(1), 73-85.
Spence, A. M. (1979). Investment strategy and growth in a new market. The Bell Journal of
Economics, 1-19.
Steenkamp, J. B. E., & Dekimpe, M. G. (1997). The increasing power of store brands: building loyalty and market share. Long range planning, 30(6), 917-930. Symphony IRI (2011). Scanner Data Dairy Market Italy. Symphony IRI Group
Tellis, G. J. (1986). Beyond the many faces of price: an integration of pricing strategies. The
Journal of Marketing, 146-160.
Wansink, B. (1996). Can package size accelerate usage volume?. The Journal of Marketing, 1-14.
pg 2-6.
Ward, M. B., Shimshack, J. P., Perloff, J. M., & Harris, J. M. (2002). Effects of the private-label
invasion in food industries. American Journal of Agricultural Economics, 84(4), 961-973.
33
8 Appendix
8.1 Regional shares, prices and price differentials
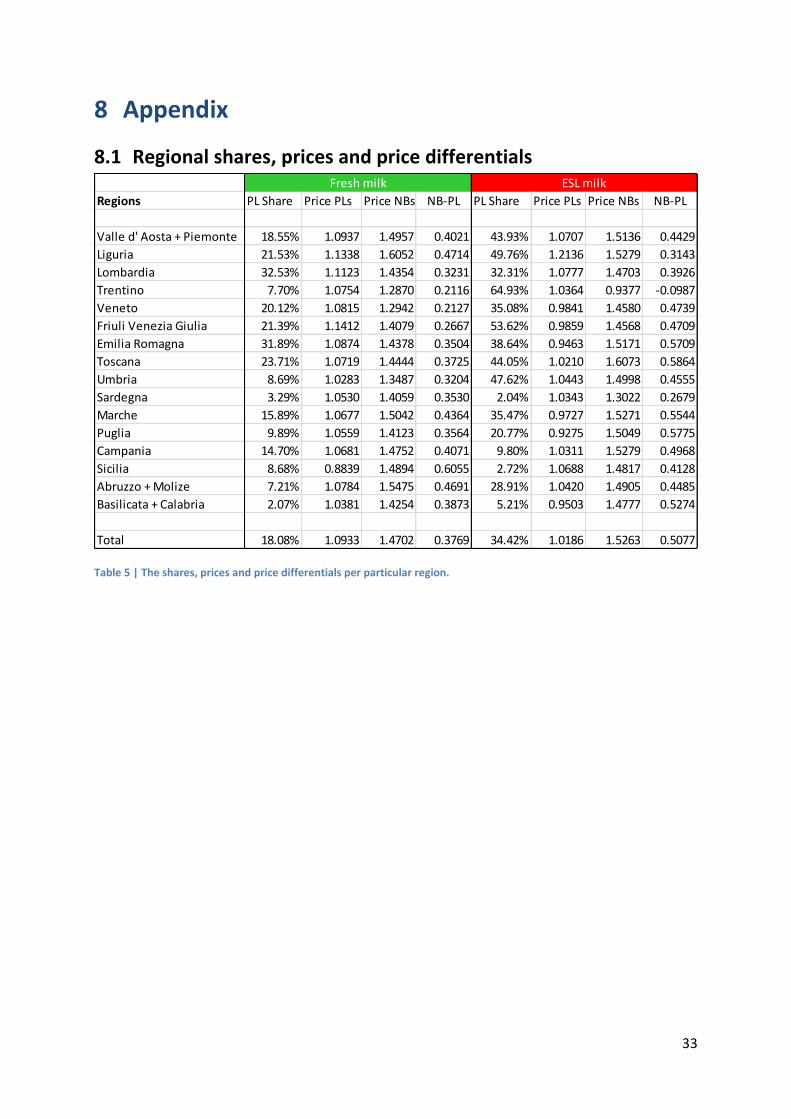
Table 5 | The shares, prices and price differentials per particular region.
Regions PL Share Price PLs Price NBs NB-PL PL Share Price PLs Price NBs NB-PL
Valle d' Aosta + Piemonte 18.55% 1.0937 1.4957 0.4021 43.93% 1.0707 1.5136 0.4429
Liguria 21.53% 1.1338 1.6052 0.4714 49.76% 1.2136 1.5279 0.3143
Lombardia 32.53% 1.1123 1.4354 0.3231 32.31% 1.0777 1.4703 0.3926
Trentino 7.70% 1.0754 1.2870 0.2116 64.93% 1.0364 0.9377 -0.0987
Veneto 20.12% 1.0815 1.2942 0.2127 35.08% 0.9841 1.4580 0.4739
Friuli Venezia Giulia 21.39% 1.1412 1.4079 0.2667 53.62% 0.9859 1.4568 0.4709
Emilia Romagna 31.89% 1.0874 1.4378 0.3504 38.64% 0.9463 1.5171 0.5709
Toscana 23.71% 1.0719 1.4444 0.3725 44.05% 1.0210 1.6073 0.5864
Umbria 8.69% 1.0283 1.3487 0.3204 47.62% 1.0443 1.4998 0.4555
Sardegna 3.29% 1.0530 1.4059 0.3530 2.04% 1.0343 1.3022 0.2679
Marche 15.89% 1.0677 1.5042 0.4364 35.47% 0.9727 1.5271 0.5544
Puglia 9.89% 1.0559 1.4123 0.3564 20.77% 0.9275 1.5049 0.5775
Campania 14.70% 1.0681 1.4752 0.4071 9.80% 1.0311 1.5279 0.4968
Sicilia 8.68% 0.8839 1.4894 0.6055 2.72% 1.0688 1.4817 0.4128
Abruzzo + Molize 7.21% 1.0784 1.5475 0.4691 28.91% 1.0420 1.4905 0.4485
Basilicata + Calabria 2.07% 1.0381 1.4254 0.3873 5.21% 0.9503 1.4777 0.5274
Total 18.08% 1.0933 1.4702 0.3769 34.42% 1.0186 1.5263 0.5077
Fresh milk ESL milk

34
8.2 Regional and time period dummy variables
8.2.1 Fresh milk Table 6 shows the econometric results of the time periodic dummy variables for fresh milk.
Price fresh milk Coefficient St. Error T P>t [95% Conf. Interval]
January -.0223892 .0077158 -2.90 0.004 -.0375371 -.0072413
February -.0251109 .0077283 -3.25 0.001 -.0402834 -.0099384
March -.0229896 .0076755 -3.00 0.003 -.0380585 -.0079207
April -.0156271 .0080228 -1.95 0.052 -.0313778 .0001236
May -.0121014 .0081394 -1.49 0.138 -.028081 .0038783
June -.002167 .0083259 -0.26 0.795 -.0185128 .0141788
July .0071433 .0080543 0.89 0.375 -.0086691 .0229558
August .0125966 .0081729 1.54 0.124 -.0034487 .0286418
September .0083394 .0079943 1.04 0.297 -.0073553 .024034
October .0029707 .0079035 0.38 0.707 -.0125458 .0184873
November -.0003957 .0076363 -0.05 0.959 -.0153877 .0145962
December 0 (omitted) Table 6 | Econometric results of periodic dummy variables for fresh milk.
Table 7 shows the econometric results of the regional dummy variables for fresh milk.
Price fresh milk Coefficient St. Error T P>t [95% Conf. Interval]
Abruzzo + Molize .085135 .0186525 4.56 0.000 .0485158 .1217543
Basilicate + Calabria 0 (omitted)
Campania .1088235 .0338778 3.21 0.001 .0423133 .1753336
Emilia Romagna -.0027411 .0514346 -0.05 0.958 -.1037194 .0982372
Friuli Venezia Giulia .0060943 .0367268 0.17 0.868 -.0660091 .0781977
Liguria .1893289 .0399971 4.73 0.000 .110805 .2678528
Lombardia .1020733 .0547589 1.86 0.063 -.0054315 .2095781
Marche .0064475 .0314543 0.20 0.838 -.0553047 .0681997
Puglia -.0145598 .0235 -0.62 0.536 -.0606958 .0315763
Sardegna .0214502 .0146437 1.46 0.143 -.0072989 .0501992
Sicilia .0478368 .0224874 2.13 0.034 .0036886 .091985
Toscana .0033179 .0385216 0.09 0.931 -.0723092 .0789449
Trentino -.0521358 .0205512 -2.54 0.011 -.0924827 -.0117889
Umbria -.2106276 .0186087 -11.32 0.000 -.2471609 -.1740943
Valle d’ Aosta + Piemonte .0216415 .0330974 0.65 0.513 -.0433365 .0866195
Veneto -.1319649 .0334622 -3.94 0.000 -.1976591 -.0662707 Table 7 | Econometric results of regional dummy variables for fresh milk.
35
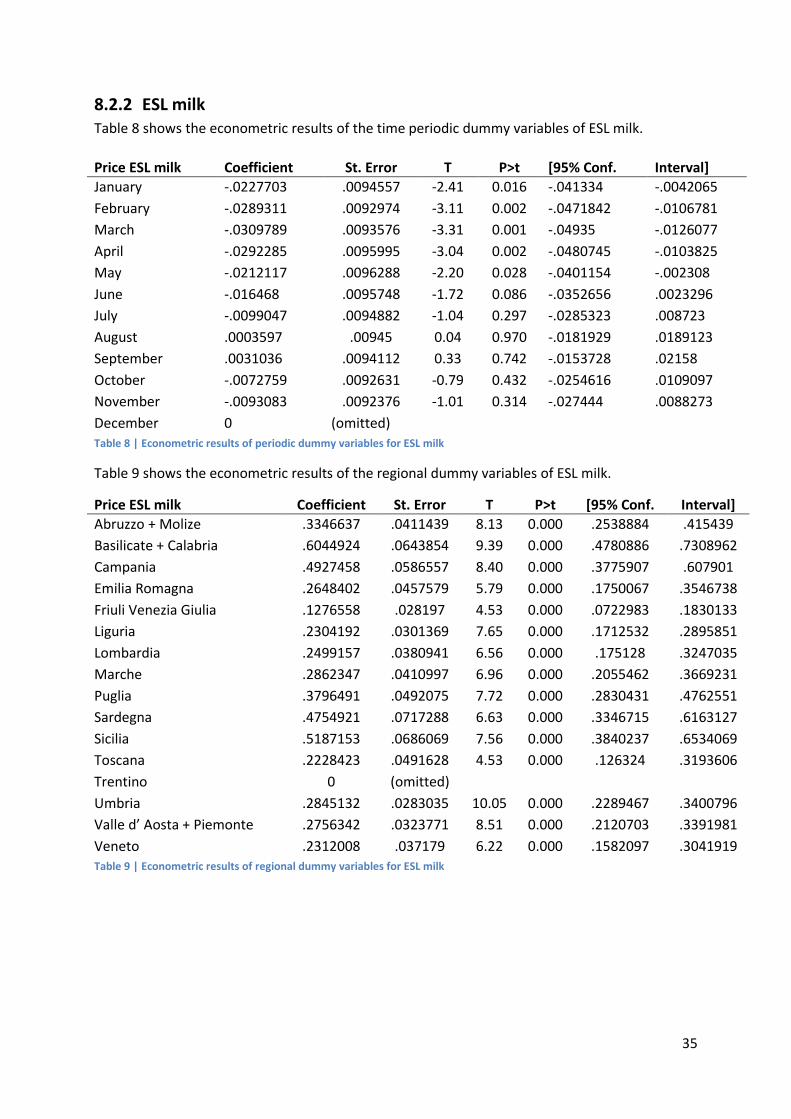
8.2.2 ESL milk Table 8 shows the econometric results of the time periodic dummy variables of ESL milk.
Table 8 | Econometric results of periodic dummy variables for ESL milk
Table 9 shows the econometric results of the regional dummy variables of ESL milk.
Table 9 | Econometric results of regional dummy variables for ESL milk
Price ESL milk Coefficient St. Error T P>t [95% Conf. Interval]
January -.0227703 .0094557 -2.41 0.016 -.041334 -.0042065
February -.0289311 .0092974 -3.11 0.002 -.0471842 -.0106781
March -.0309789 .0093576 -3.31 0.001 -.04935 -.0126077
April -.0292285 .0095995 -3.04 0.002 -.0480745 -.0103825
May -.0212117 .0096288 -2.20 0.028 -.0401154 -.002308
June -.016468 .0095748 -1.72 0.086 -.0352656 .0023296
July -.0099047 .0094882 -1.04 0.297 -.0285323 .008723
August .0003597 .00945 0.04 0.970 -.0181929 .0189123
September .0031036 .0094112 0.33 0.742 -.0153728 .02158
October -.0072759 .0092631 -0.79 0.432 -.0254616 .0109097
November -.0093083 .0092376 -1.01 0.314 -.027444 .0088273
December 0 (omitted)
Price ESL milk Coefficient St. Error T P>t [95% Conf. Interval]
Abruzzo + Molize .3346637 .0411439 8.13 0.000 .2538884 .415439
Basilicate + Calabria .6044924 .0643854 9.39 0.000 .4780886 .7308962
Campania .4927458 .0586557 8.40 0.000 .3775907 .607901
Emilia Romagna .2648402 .0457579 5.79 0.000 .1750067 .3546738
Friuli Venezia Giulia .1276558 .028197 4.53 0.000 .0722983 .1830133
Liguria .2304192 .0301369 7.65 0.000 .1712532 .2895851
Lombardia .2499157 .0380941 6.56 0.000 .175128 .3247035
Marche .2862347 .0410997 6.96 0.000 .2055462 .3669231
Puglia .3796491 .0492075 7.72 0.000 .2830431 .4762551
Sardegna .4754921 .0717288 6.63 0.000 .3346715 .6163127
Sicilia .5187153 .0686069 7.56 0.000 .3840237 .6534069
Toscana .2228423 .0491628 4.53 0.000 .126324 .3193606
Trentino 0 (omitted)
Umbria .2845132 .0283035 10.05 0.000 .2289467 .3400796
Valle d’ Aosta + Piemonte .2756342 .0323771 8.51 0.000 .2120703 .3391981
Veneto .2312008 .037179 6.22 0.000 .1582097 .3041919

36
8.3 Results STATA econometric model Table 10 shows the results of the variables used in the econometric model for Fresh milk. The
variables related to NB_ are the results of the dummy variables (price differentials).
Price Fresh milk Coefficient St. Err T P>t [95% Conf. Interval]
shplf .0029164 .0034576 0.84 0.399 -.0038717 .0097046
shplf2 -.0000799 .0001026 -0.78 0.437 -.0002814 .0001216
pronf -.003152 .0008394 -3.76 0.000 -.0048 -.0015041
propf -.0002718 .0002234 -1.22 0.224 -.0007104 .0001667
vunf 1.326447 .1856392 7.15 0.000 .9619932 1.690901
vupf .9459979 .6580398 1.44 0.151 -.3458901 2.237886
mp -.0028782 .0019294 -1.49 0.136 -.006666 .0009097
nbdum 1.19675 .6154068 1.94 0.052 -.0114398 2.404939
NB_pls .007049 .0013455 5.24 0.000 .0044075 .0096906
NB_pls2 -.0002081 .0000374 -5.57 0.000 -.0002815 -.0001348
NB_promNB .0040994 .0011008 3.72 0.000 .0019383 .0062606
NB_promPL .0002622 .0002764 0.95 0.343 -.0002805 .0008049
NB_volNB -.1019981 .0992086 -1.03 0.304 -.2967681 .0927718
NB_volPL -.9768905 .5801827 -1.68 0.093 -2.115927 .1621456
NB_mp .0049775 .002469 2.02 0.044 .0001302 .0098247 Table 10 | Results of variables used in econometric model (fresh milk)
Table 11 shows the results of the variables used in the econometric model for Fresh milk. The
variables related to NB_ are the results of the dummy variables (price differentials).
Table 11 | Results of variables used in econometric model (ESL milk)
Price ESL milk Coefficient St. Error T P>t [95% Conf. Interval]
shple .0049934 .0026601 1.88 0.061 -.000229 .0102158
shple2 7.66e-06 .0000299 0.26 0.798 -.000051 .0000663
prone .0038582 .0005568 6.93 0.000 .0027651 .0049513
prope -.000246 .0002241 -1.10 0.273 -.0006859 .000194
vune .135814 .271284 0.50 0.617 -.3967809 .6684088
vupe .6748498 .2022365 3.34 0.001 .2778117 1.071888
mp -.0101222 .0022931 -4.41 0.000 -.0146241 -.0056203
nbdum 2.062234 .1872109 11.02 0.000 1.694695 2.429773
NB_plse .0138841 .0008504 16.33 0.000 .0122145 .0155537
NB_plse2 -.0002351 .0000133 -17.69 0.000 -.0002611 -.000209
NB_promeNB -.0090109 .0006878 -13.10 0.000 -.0103613 -.0076605
NB_promePL -.0004412 .0002759 -1.60 0.110 -.0009828 .0001005
NB_voleNB -.9229717 .1084663 -8.51 0.000 -1.135917 -.7100266
NB_volePL -1.167539 .1309903 -8.91 0.000 -1.424704 -.9103742
NB_mpe .0076475 .0030007 2.55 0.011 .0017564 .0135386