Embed Size (px)
Citation preview
Price Prediction and�alities Responsible for Becoming aSuperhost: An Airbnb Case Study
Digvijay KaramchandaniDepartment of CSE, UCSD
PID: [email protected]
Chandana LakshminarayanaDepartment of CSE, UCSD
PID: [email protected]
Kriti AggarwalDepartment of CSE, UCSD
PID: [email protected]
Saksham SharmaDepartment of CSE, UCSD
PID: [email protected]
ABSTRACTIn this project, we consider the problem of predicting prices forAirbnb rentals from various features available from the BostonAirbnb open dataset. We also consider the problem of �nding outthe factors which are responsible for becoming a superhost onAirbnb. �e project involves �nding out the appropriate featuresfor each of the above mentioned tasks. Once the features are ex-tracted, they are trained using machine learning techniques such asLinear regression, Random Forest regression and Gradient Boostingregression for price prediction. For superhost prediction task, theextracted features are trained using SVM classi�er and DecisionTree classi�er. For the price prediction task, Gradient Boostingregression preformed the best, yielding a test mean absolute error(MAE) of 0.27509908. Decision Tree classi�er performed the bestfor the superhost prediction task, yielding a test MAE of 0.09413.
KEYWORDSLinear regression, Random Forest regression and Gradient Boostingregression, SVM classi�er, Decision Tree classi�er, mean absoluteerror
1 INTRODUCTIONNow a days, many people use online websites to list or rent short-term lodging including vacation rentals, apartment rentals, home-stays, hostel beds, or hotel rooms. Airbnb is one such site whichdoes not own any lodging, but is merely a broker and receives per-centage service fees (commissions) from both the guests and hostsin conjunction with every booking. It has over 3 million lodginglistings in 65,000 cities and 191 countries, and the cost of lodging isset by the host[2]. But, the problem is for a new user who wants torent short-term lodging but might not know the appropriate priceto ask for. Also, he might not know about the qualities he shouldpossess in order to become a superhost on Airbnb.
�e price of a rental depends on many features such as numberof bedrooms & bathrooms, neighborhood, room type, latitude &longitude, reviews per month etc. So, our goal is to determine therelevant features by performing the exploratory analysis on thedataset. A�er extracting the relevant features, we plan to trainthem using �ve di�erent machine learning techniques which areas follows:
(1) Linear regression
(2) Ridge regression(3) Lasso regression(4) Random Forest regression(5) Gradient Boosting regression
Comparison of the di�erent models and reasoning about them isprovided by subsequent sections.
Airbnb also provides a “Superhost” badge to its users on the basisof few benchmarks. Some of the benchmarks are as follows:
(1) High response rate: Superhosts respond to guests quicklyand maintain a 90% response rate or higher.
(2) Commitment: Superhosts honor con�rmed reservations-they rarely cancel.
(3) 5 star reviews: Superhosts provide listings that inspireenthusiastic reviews. At least 80% of their reviews need tobe 5 stars.
(4) Experience: Superhosts complete at least 10 trips in theirlistings in a year.
Apart from the above mentioned benchmarks, we plan to exploreother characteristics that can help a user to become a superhost.Once, the relevant features are extracted, we will train them usingtwo machine learning techniques: (1) SVM classi�er (2) DecisionTree classi�er. Further details about the superhost prediction taskare given in subsequent sections.
2 LITERATURE REVIEW�edataset which we are using for our predictive tasks is the BostonAIRBNB Open Data[1]. �e dataset is a part of Inside Airbnb andthe original source can be found at [4]. �e data visualization ofthe Airbnb Boston listings is shown in �gure 1.
Figure 1: Airbnb Boston listings data visualization
2.1 Inspiration behind the dataset(1) Can you describe the vibe of each Boston neighborhood
using listing descriptions?(2) What are the busiest times of the year to visit Boston? By
how much do prices spike?(3) Is there a general upward trend of both new Airbnb listings
and total Airbnb visitors to visit Boston?
2.2 Previous Work�e previous work done on this dataset were based on the belowproblem statements:
(1) Modeling price prediction(2) E�ect of holiday seasons on pricing and price spikes(3) Sentiment analysis and collocation of reviews
For the �rst predictive task of modeling price predictions, thekaggle site has an activity for the same task[5] where the userperformed linear regression on important features such as neigh-borhood, and room related features such as number of bedrooms,bathrooms, etc. We used this as the baseline for our predictive task.
We studied on what models work best for similar predictive tasksand found that if one takes several predictions and aggregates them,then the resulting aggregate forecast in many cases will outperformthe individual forecasts. Bagging, boosting and stacking are allbased exactly on this idea. If the aim is purely prediction, thenin most cases this is the best one can do. �e drawback of thismethod is that it is a black-box approach that returns the result butdoes not help one to understand and interpret it. It is also morecomputationally intensive than any other method since one has tobuild multiple predictors to come up with a �nal prediction [6],[7].
We decided to apply ensemble techniques like gradient boostingand random forests for our task as the literature suggests thesemethods to be state-of-the-art. We also need to engineer and extractthe features which are most relevant for price prediction.
For the second task of �nding characteristics of a super host, wefound limited literature. We decided to extract the characteristicsby two approaches. �e �rst approach was to �nd aspect of reviewtext related to highly and lowly rated reviews. For this we foundLatent Dirichlet allocation and word clouds to be commonly usedmethods [8].
�e second approach was to classify super host and non superhost on various a�ributes, to �nd di�erentiating features whichare signi�cant. From past literature on similar tasks, we found thatbinary classi�ers like SVM and decision trees along with properfeature engineering was to work well with our case [9].
3 DATASETIn this section we study the dataset and perform analysis on it.
3.1 Basic Statistics and PropertiesWe used Boston Airbnb Open Dataset[1] for our case study. �isdataset provides the following information:
(1) Listings: A csv �le which has listings across various prop-erties in Boston. (3,585 listings)
(2) Calendar: A csv �le which has details on booking date andprice for each listing. (1,048,575 bookings)
(3) Review: A csv �le which has review provided for a partic-ular listing id by a particular reviewer. (68,275 reviews)
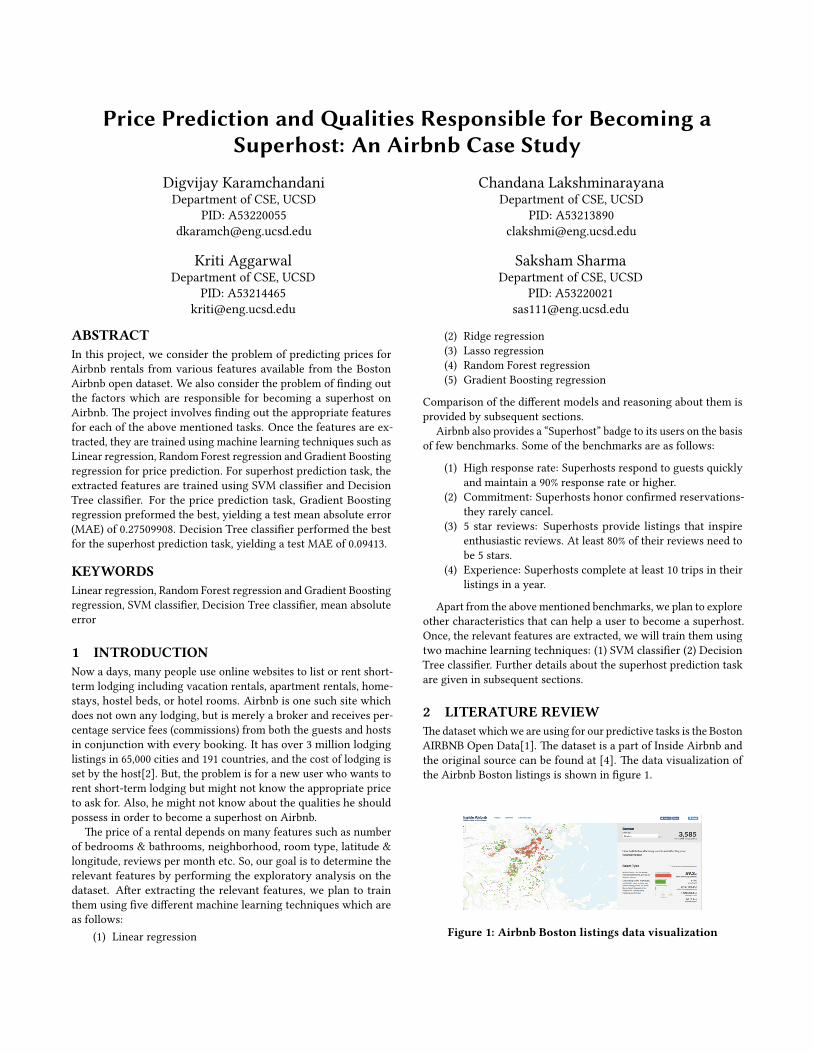
We used all the above mentioned datasets for our project. �e basicschema of the datasets is shown in �gure 3
Figure 2: Schema of datasets.
3.2 Exploratory Data AnalysisTo develop a deeper insight into how prices correlate with respectto di�erent features such as room con�gurations (number of bed-rooms, room type), day of the year, neighborhood etc. we carriedout extensive exploratory analysis on our data. Few snapshots andinteresting �ndings are given in brief in following sub sections.
�ere were a total of 3586 listings in the Airbnb Boston data.A�er cleaning the data(removing null rows, incomplete data, etc.)we were le� with only 2725 listings. Out of these hosts, only 16.8%of the hosts were super hosts. Hence, the dataset was unbalancedwith respect to the type of the host. To further �nd how super hostsdi�er from normal hosts, we plo�ed the a�ributes with number ofsuper and normal hosts. We found that there were several factorsthat had a very high correlation with the host being a super host viza viz cleanliness score, number of reviews, rating score, acceptancerate of the host, response rate of the user, rating of the host location,whether the host has been veri�ed or not.
3.2.1 Price versus neighborhood. �e price that the customers pay for a property is proportional tothe neighborhood. To �nd this correlation in our dataset, we plo�edprices (y axis) versus the neighborhoods sorted with respect to price(x axis) as shown in �gure 4.�emost expensive neighborhood turnsout to be Miami beach followed by Downtown. And the cheapestneighborhoods are South Boston and Chelsea. Figure 4 capturesan interesting relationship between prices and how neighborhooda�ects it.
Figure 4: Prices versus neighborhood
2
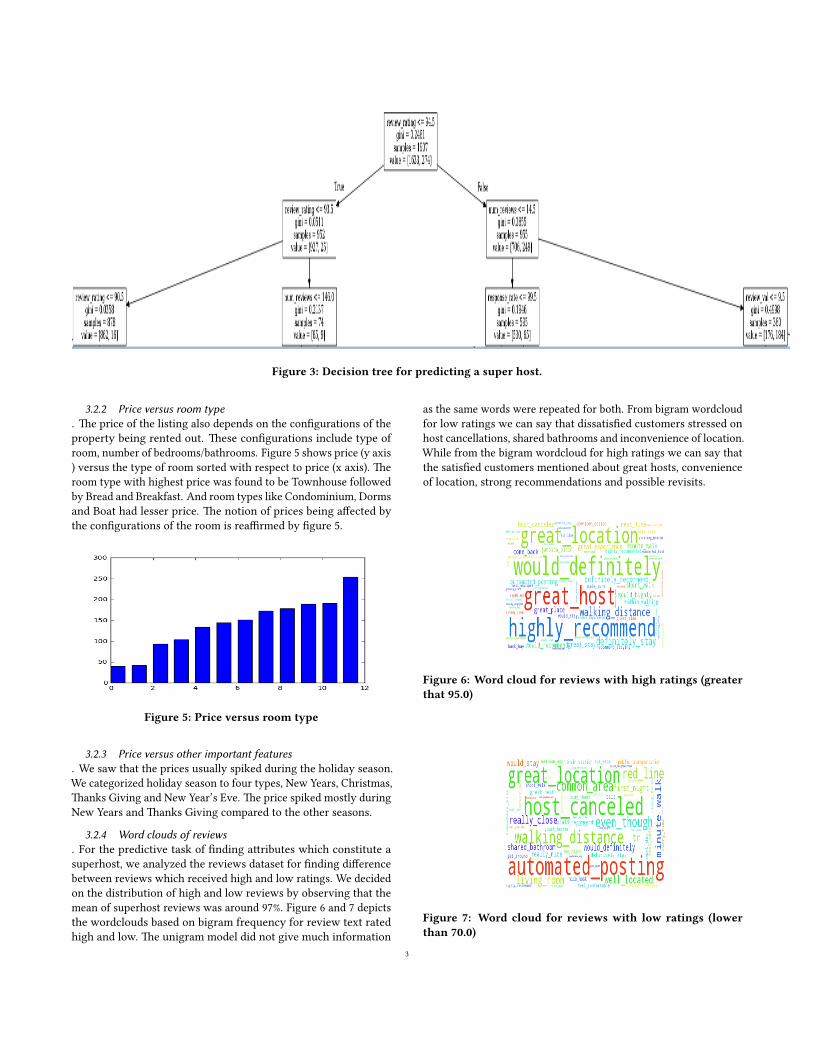
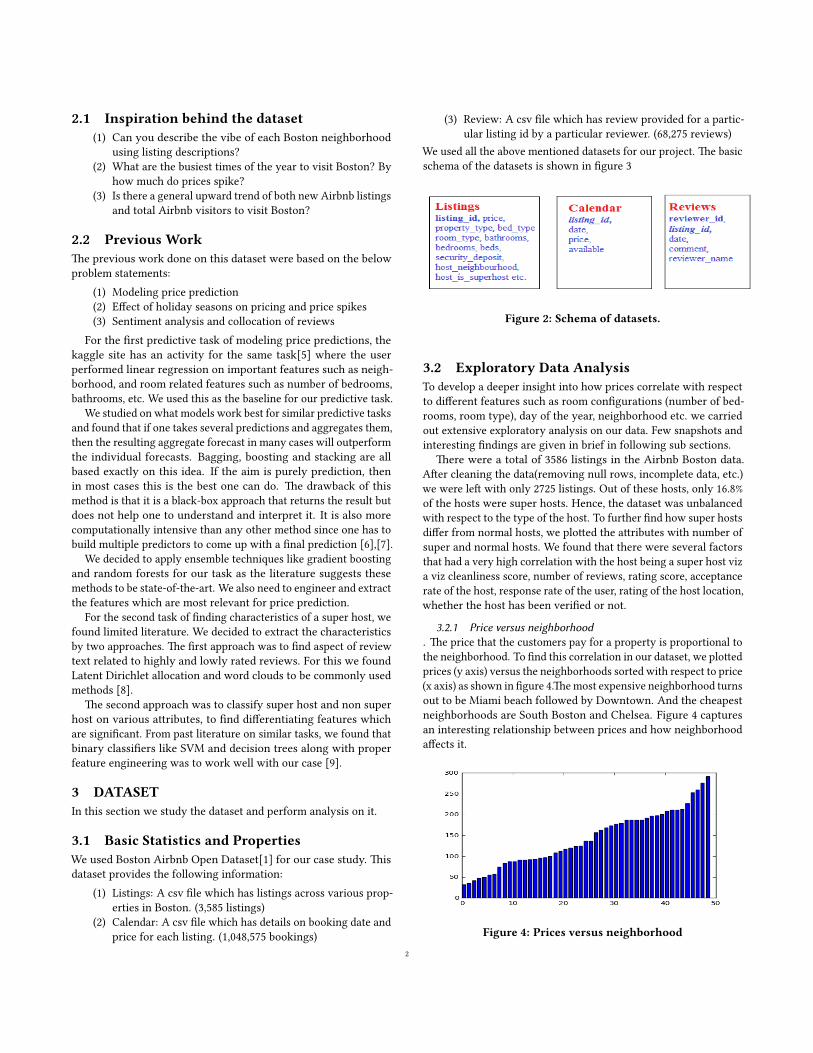
Figure 3: Decision tree for predicting a super host.
3.2.2 Price versus room type. �e price of the listing also depends on the con�gurations of theproperty being rented out. �ese con�gurations include type ofroom, number of bedrooms/bathrooms. Figure 5 shows price (y axis) versus the type of room sorted with respect to price (x axis). �eroom type with highest price was found to be Townhouse followedby Bread and Breakfast. And room types like Condominium, Dormsand Boat had lesser price. �e notion of prices being a�ected bythe con�gurations of the room is rea�rmed by �gure 5.
Figure 5: Price versus room type
3.2.3 Price versus other important features. We saw that the prices usually spiked during the holiday season.We categorized holiday season to four types, New Years, Christmas,�anks Giving and New Year’s Eve. �e price spiked mostly duringNew Years and �anks Giving compared to the other seasons.
3.2.4 Word clouds of reviews. For the predictive task of �nding a�ributes which constitute asuperhost, we analyzed the reviews dataset for �nding di�erencebetween reviews which received high and low ratings. We decidedon the distribution of high and low reviews by observing that themean of superhost reviews was around 97%. Figure 6 and 7 depictsthe wordclouds based on bigram frequency for review text ratedhigh and low. �e unigram model did not give much information
as the same words were repeated for both. From bigram wordcloudfor low ratings we can say that dissatis�ed customers stressed onhost cancellations, shared bathrooms and inconvenience of location.While from the bigram wordcloud for high ratings we can say thatthe satis�ed customers mentioned about great hosts, convenienceof location, strong recommendations and possible revisits.
Figure 6: Word cloud for reviews with high ratings (greaterthat 95.0)
Figure 7: Word cloud for reviews with low ratings (lowerthan 70.0)
3
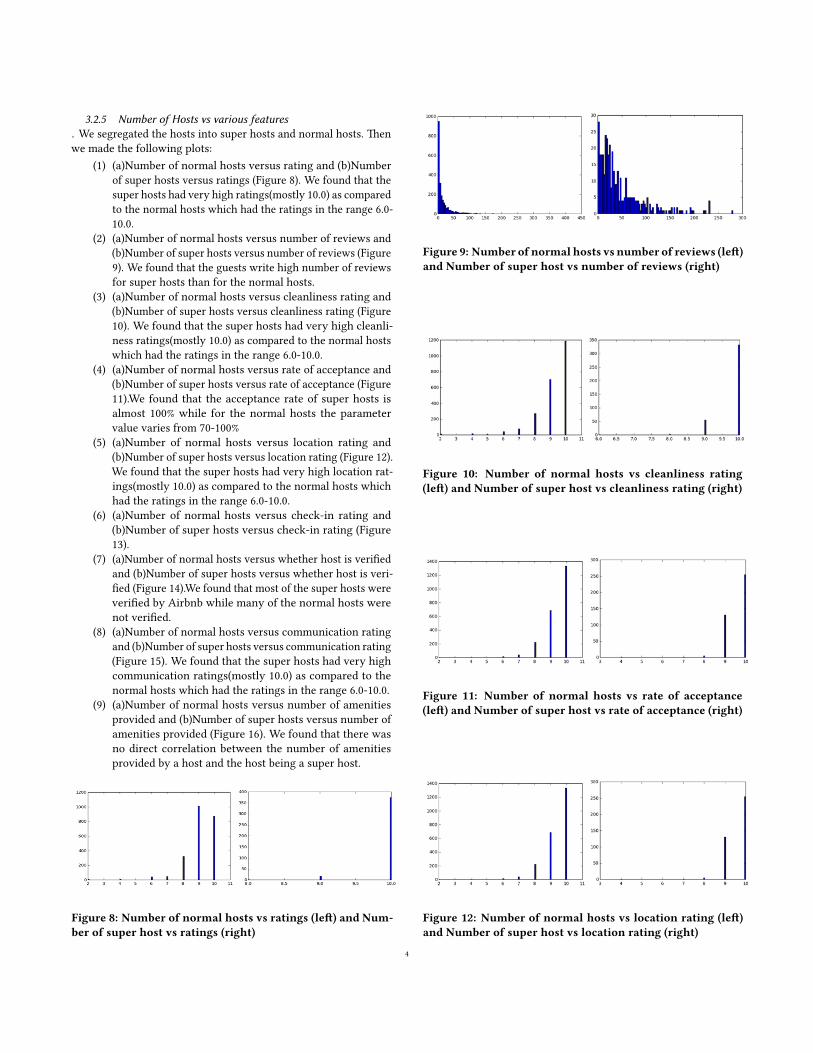
3.2.5 Number of Hosts vs various features. We segregated the hosts into super hosts and normal hosts. �enwe made the following plots:
(1) (a)Number of normal hosts versus rating and (b)Numberof super hosts versus ratings (Figure 8). We found that thesuper hosts had very high ratings(mostly 10.0) as comparedto the normal hosts which had the ratings in the range 6.0-10.0.
(2) (a)Number of normal hosts versus number of reviews and(b)Number of super hosts versus number of reviews (Figure9). We found that the guests write high number of reviewsfor super hosts than for the normal hosts.
(3) (a)Number of normal hosts versus cleanliness rating and(b)Number of super hosts versus cleanliness rating (Figure10). We found that the super hosts had very high cleanli-ness ratings(mostly 10.0) as compared to the normal hostswhich had the ratings in the range 6.0-10.0.
(4) (a)Number of normal hosts versus rate of acceptance and(b)Number of super hosts versus rate of acceptance (Figure11).We found that the acceptance rate of super hosts isalmost 100% while for the normal hosts the parametervalue varies from 70-100%
(5) (a)Number of normal hosts versus location rating and(b)Number of super hosts versus location rating (Figure 12).We found that the super hosts had very high location rat-ings(mostly 10.0) as compared to the normal hosts whichhad the ratings in the range 6.0-10.0.
(6) (a)Number of normal hosts versus check-in rating and(b)Number of super hosts versus check-in rating (Figure13).
(7) (a)Number of normal hosts versus whether host is veri�edand (b)Number of super hosts versus whether host is veri-�ed (Figure 14).We found that most of the super hosts wereveri�ed by Airbnb while many of the normal hosts werenot veri�ed.
(8) (a)Number of normal hosts versus communication ratingand (b)Number of super hosts versus communication rating(Figure 15). We found that the super hosts had very highcommunication ratings(mostly 10.0) as compared to thenormal hosts which had the ratings in the range 6.0-10.0.
(9) (a)Number of normal hosts versus number of amenitiesprovided and (b)Number of super hosts versus number ofamenities provided (Figure 16). We found that there wasno direct correlation between the number of amenitiesprovided by a host and the host being a super host.
Figure 8: Number of normal hosts vs ratings (le�) and Num-ber of super host vs ratings (right)
Figure 9: Number of normal hosts vs number of reviews (le�)and Number of super host vs number of reviews (right)
Figure 10: Number of normal hosts vs cleanliness rating(le�) and Number of super host vs cleanliness rating (right)
Figure 11: Number of normal hosts vs rate of acceptance(le�) and Number of super host vs rate of acceptance (right)
Figure 12: Number of normal hosts vs location rating (le�)and Number of super host vs location rating (right)
4
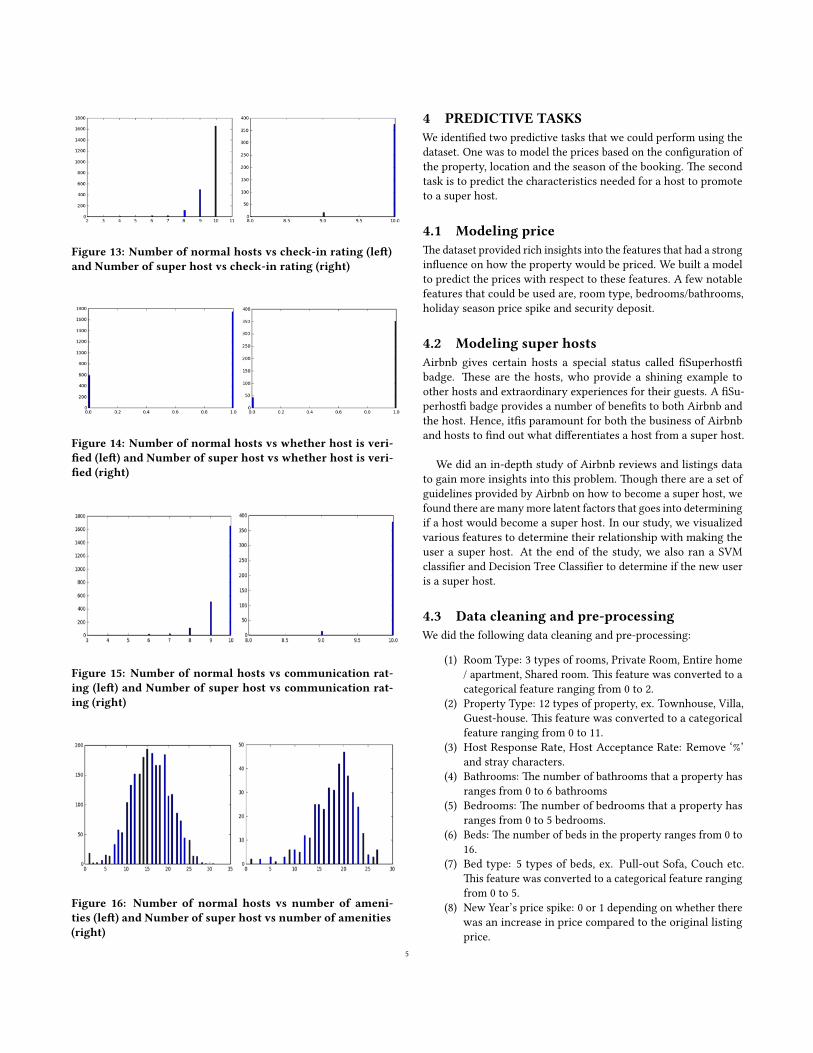
Figure 13: Number of normal hosts vs check-in rating (le�)and Number of super host vs check-in rating (right)
Figure 14: Number of normal hosts vs whether host is veri-�ed (le�) and Number of super host vs whether host is veri-�ed (right)
Figure 15: Number of normal hosts vs communication rat-ing (le�) and Number of super host vs communication rat-ing (right)
Figure 16: Number of normal hosts vs number of ameni-ties (le�) and Number of super host vs number of amenities(right)
4 PREDICTIVE TASKSWe identi�ed two predictive tasks that we could perform using thedataset. One was to model the prices based on the con�guration ofthe property, location and the season of the booking. �e secondtask is to predict the characteristics needed for a host to promoteto a super host.
4.1 Modeling price�e dataset provided rich insights into the features that had a strongin�uence on how the property would be priced. We built a modelto predict the prices with respect to these features. A few notablefeatures that could be used are, room type, bedrooms/bathrooms,holiday season price spike and security deposit.
4.2 Modeling super hostsAirbnb gives certain hosts a special status called �Superhost�badge. �ese are the hosts, who provide a shining example toother hosts and extraordinary experiences for their guests. A �Su-perhost� badge provides a number of bene�ts to both Airbnb andthe host. Hence, it�s paramount for both the business of Airbnband hosts to �nd out what di�erentiates a host from a super host.
We did an in-depth study of Airbnb reviews and listings datato gain more insights into this problem. �ough there are a set ofguidelines provided by Airbnb on how to become a super host, wefound there are manymore latent factors that goes into determiningif a host would become a super host. In our study, we visualizedvarious features to determine their relationship with making theuser a super host. At the end of the study, we also ran a SVMclassi�er and Decision Tree Classi�er to determine if the new useris a super host.
4.3 Data cleaning and pre-processingWe did the following data cleaning and pre-processing:
(1) Room Type: 3 types of rooms, Private Room, Entire home/ apartment, Shared room. �is feature was converted to acategorical feature ranging from 0 to 2.
(2) Property Type: 12 types of property, ex. Townhouse, Villa,Guest-house. �is feature was converted to a categoricalfeature ranging from 0 to 11.
(3) Host Response Rate, Host Acceptance Rate: Remove ‘%’and stray characters.
(4) Bathrooms: �e number of bathrooms that a property hasranges from 0 to 6 bathrooms
(5) Bedrooms: �e number of bedrooms that a property hasranges from 0 to 5 bedrooms.
(6) Beds: �e number of beds in the property ranges from 0 to16.
(7) Bed type: 5 types of beds, ex. Pull-out Sofa, Couch etc.�is feature was converted to a categorical feature rangingfrom 0 to 5.
(8) New Year’s price spike: 0 or 1 depending on whether therewas an increase in price compared to the original listingprice.
5
(9) �anksgiving price spike: 0 or 1 depending on whetherthere was an increase in price compared to the originallisting price.
(10) Christmas price spike: 0 or 1 depending on whether therewas an increase in price compared to the original listingprice.
(11) New Year’s Eve: 0 or 1 depending on whether there wasan increase in price compared to the original listing price.
(12) Price, Security deposit, Cleaning Fee: Removed Null andillegal values Strip ‘$’ and remove ‘,’, and rstrip ‘.’ at theend
(13) Host neighborhood: �ere were 50 neighborhoods like“Miami Beach”, “Financial District” etc which were con-verted to a categorical feature ranging from 0 to 49.
4.4 Relevant Features4.4.1 Relevant features for modeling prices
. From the exploratory analysis of the dataset, we found that thefeatures related to neighborhood, room con�gurations and holidayseason a�ected the prices the most. �e features are as listed below:
(1) Property type: 12 types of property, ex. Townhouse, Villa,Guesthouse. �is feature was converted to a categoricalfeature ranging from 0 to 11.
(2) Room type: 3 types of rooms, Private Room, Entire home /apartment, Shared room. �is feature was converted to acategorical feature ranging from 0 to 2.
(3) Bathrooms: �e number of bathrooms that a property hasranges from 0 to 6 bathrooms.
(4) Bedrooms: �e number of bathrooms that a property hasranges from 0 to 5 bedrooms.
(5) Beds: �e number of beds in the property ranges from 0 to16.
(6) Bed type: 5 types of beds, ex. Pull-out Sofa, Couch etc.�is feature was converted to a categorical feature rangingfrom 0 to 5.
(7) New Year’s price spike: 0 or 1 depending on whether therewas an increase in price compared to the original listingprice.
(8) �anksgiving price spike: 0 or 1 depending on whetherthere was an increase in price compared to the originallisting price.
(9) Christmas price spike: 0 or 1 depending on whether therewas an increase in price compared to the original listingprice.
(10) New Year’s Eve: 0 or 1 depending on whether there wasan increase in price compared to the original listing price.
(11) Security deposit: amount of money paid as deposit.(12) Host neighborhood: neighborhood of the property. �ere
were 50 neighborhoods like “Miami Beach”, “Financial Dis-trict” etc which were converted to a categorical featureranging from 0 to 49.
4.4.2 Modeling super host. For predicting whether a user can be a super host, we exploredvarious features and found the followings as important:
(1) number of reviews: Number of reviews wri�en by theguests for a host.
(2) acceptance rate: �e rate of acceptance of the host. Itranges between 0-100.
(3) response rate: It captures the responsiveness of the host.�e value of this parameter ranges between 0-100.
(4) rating score cleanliness: �e cleanliness rating of the host.(0-10)
(5) rating score location: It captures how good/convenient isthe location of the host.(0-10)
(6) rating score communication: It captures how responsivethe host is.(0-10)
(7) rating score value: It captures the overall rating of thehost.(0-10)
(8) rating score checkin: How convenient is it for the guestfor the host to checkin.
(9) is host veri�ed: Is the host veri�ed by Airbnb.(0 or 1)
5 MODELSHere are our experiments with di�erent models for both our pre-dictive tasks.
5.1 Modeling prices(1) Linear Regression: �e model built on linear regression
was used as baseline. We encountered over-��ing withthis model as there were few entries in the dataset whichcould possibly be skewed.
(2) Ridge Regression: We needed to improve on the previousmodel as there was over-��ing. We used Ridge Regressionwhich has L2 regularization in it.
(3) Lasso Regression: In cases where relevant informationis smeared over large parts of the spectrum asking theregularization to drop variates will low co-e�cient is not aparticularly sensible approach. Two parameters which arevery well correlated maybe dropped by Lasso Regression.
(4) Random Forest: Random forests are an ensemble learn-ing method for regression, that operate by constructinga multiple decision trees at training time and outpu�ingthe mean prediction of the individual trees as the �nal pre-diction. Random decision forests prevents decision trees’over-��ing by optimizing the tuning parameters that gov-erns the number of features that are randomly chosen togrow each tree.
(5) Gradient Boosting: Gradient Boosting is an ensemble tech-nique in which weak predictors are combined in buildinga be�er model. �ese weak predictors learn from the mis-classi�cations from the previous steps and be�er in thenext steps by boosting the importance of incorrectly pre-dicted data points. �e aggregate forecast got from eachof the weak learners will be much be�er than each of thelearners alone.
5.2 Modeling super hostWe used two di�erent models to predict if the new user is a superhost or not.
5.2.1 SVM classifier. SVM model is a representation of the examples as points in space,mapped so that the examples of the separate categories are divided
6
by a clear gap that is as wide as possible. New examples are thenmapped into that same space and predicted to belong to a categorybased on which side of the gap they fall.[10]
5.2.2 Decision Tree Classifier. Decision tree learning uses a decision tree as a predictive modelwhichmaps observations about an item (represented in the branches)to conclusions about the item’s target value (represented in theleaves). It is one of the predictive modeling approaches used instatistics, data mining and machine learning. Tree models wherethe target variable can take a �nite set of values are called classi�-cation trees; in these tree structures, leaves represent class labelsand branches represent conjunctions of features that lead to thoseclass labels[3].A decision tree is a simple representation for classifying examples.In the task of classifying super hosts, there is a single target featurewhich is whether the host is a super host or not. Each internal nodein a decision tree is labeled with an input feature. Each leaf of thetree is labeled with a class.
6 RESULTS6.1 Modeling pricesAs a �rst step towards building the models, we built the modelsbased on Linear Regression, Ridge Regression, Lasso Regression,Random forest and Gradient Boosting. �ese models were initiallybuilt without cross-validation.
Mean Absolute Error (MAE) was used as a metric to comparethe models. As there could be properties with very high or verylow price (outliers), Mean Squared Error (MSE) on our predictionswould penalize error rate much more whereas MAE would not.
As shown in the Table 1, Linear Regression and Ridge Regres-sion gave comparable errors. �e Ridge regression was done withdi�erent regularization parameter and the best value of the param-eter was 1. As the errors of the two models are comparable, theregularization added in Ridge did not impact the model a lot interms of error rate.
Lasso Regression performed the worst on our model as shownin the Table 1. �is model would have dropped many features thatcould add value to the model as the L1 norm used in Lasso dropsthe features with lesser signi�cance. Although some features maynot be as signi�cant as the others, they added value to the modeland it is not suitable to drop them o� and hence Lasso Regressionwasn�t useful.
�e ensemble techniques like Random Forest and Gradient Boost-ing performed well and were comparable in performance as shownin Table 1. As seen from the literature review, these methods whichare state-of-the-art performed well on our predictive task as well.
As a next step, we introduced 10 fold cross-validation whilebuilding the models. �e comparison between the models beforeand a�er cross-validation are shown in the . �e accuracy of eachof the models improved a�er cross-validation than before. �e bestvalue of regularization parameter for Ridge Regression was 1 andit produced an accuracy of 0.585. �e Random Forest Regressionwith 80% of the features as maximum features in each tree, depthof the tree as 10 and number of samples per leaf as 2, the accuracya�er cross-validation improved by more than 4%.
As seen from Table 2, Gradient boosting with 80% of the featuresas maximum features in each tree, depth of the tree as 5 and learningrate as 0.1, the accuracy a�er cross-validation improved by 2%.Model based on Gradient Boosting performed be�er than any othermodel with an accuracy of 72.21%
Table 1: Training and test error whilemodeling price predic-tion
Model Training error Test errorLinear Regression 0.3046 0.3173Ridge Regression 0.3047 0.3174Lasso Regression 0.5039 0.5074
Random Forest Regressor 0.1394 0.2760Gradient Boosting Regressor 0.2379 0.2751
Table 2: Accuracy while modeling price prediction withcross validation
Model Before validation A�er ValidationRidge Regression 0.5853 0.5867
Random Forest Regressor 0.6538 0.69145Gradient Boosting Regressor 0.7018 0.7221
6.2 Modeling super host�e problem of modeling a super host is rather challenging. �emajor challenge being that there are not many distinguishing pa-rameters between the super hosts and the normal hosts. To dealwith this challenge, we performed exploratory analysis and foundthe various features that were distributed di�erently between thetwo type of hosts. We also encountered the problem of imbalanceddataset as the number of super hosts was just 16% of the total hosts.
To deal with the problem of imbalanced dataset we �rst experi-mented with using SVM classi�er. We used di�erent penalties forthe negative and positive cases so that the decision boundary is notbiased towards minority samples.
We were able to get 2̃0% error for both training and test set usingSVM classi�er. �ough precision and recall are be�er measureof accuracy for unbalanced dataset. Hence, we calculated bothprecision and recall. We found that the SVM model gave very highrecall for both the super host and normal hosts, While the precisionfor the super host class was just 4̃1% where as for the normal hostit was 9̃7%.
To improve on our precision, we experimented with decisiontrees which are not only e�ective for classi�cation tasks but alsorequire very low tuning of parameters for their working. We wereable to reach a precision of 7̃1% using decision trees classi�er witha max depth of 5 for the decision tree.
With regard to the features that were helpful in predictingwhethera host is a super host or not. We found that there a number offeatures that come into play in determining the badge of a host.Airbnb lists a couple of a�ributes that are paramount for becominga super host. �rough our analysis we validated these a�ributes
7
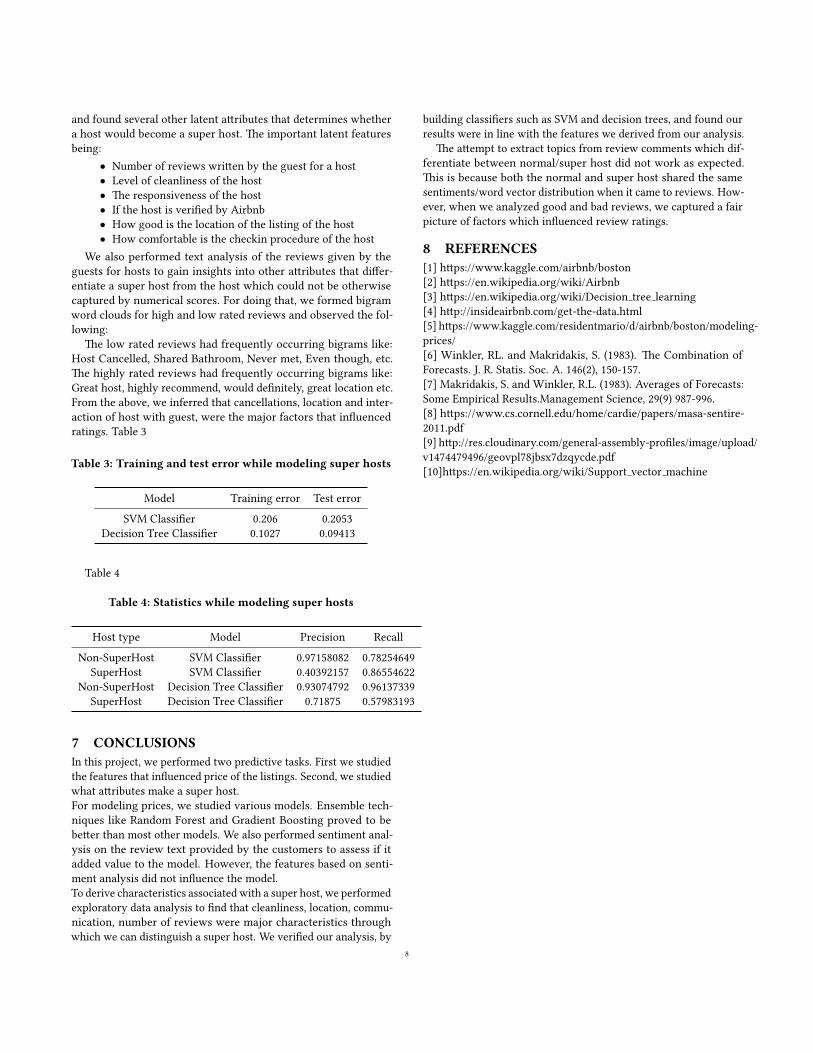
and found several other latent a�ributes that determines whethera host would become a super host. �e important latent featuresbeing:
• Number of reviews wri�en by the guest for a host• Level of cleanliness of the host• �e responsiveness of the host• If the host is veri�ed by Airbnb• How good is the location of the listing of the host• How comfortable is the checkin procedure of the host
We also performed text analysis of the reviews given by theguests for hosts to gain insights into other a�ributes that di�er-entiate a super host from the host which could not be otherwisecaptured by numerical scores. For doing that, we formed bigramword clouds for high and low rated reviews and observed the fol-lowing:
�e low rated reviews had frequently occurring bigrams like:Host Cancelled, Shared Bathroom, Never met, Even though, etc.�e highly rated reviews had frequently occurring bigrams like:Great host, highly recommend, would de�nitely, great location etc.From the above, we inferred that cancellations, location and inter-action of host with guest, were the major factors that in�uencedratings. Table 3
Table 3: Training and test error while modeling super hosts
Model Training error Test errorSVM Classi�er 0.206 0.2053
Decision Tree Classi�er 0.1027 0.09413
Table 4
Table 4: Statistics while modeling super hosts
Host type Model Precision RecallNon-SuperHost SVM Classi�er 0.97158082 0.78254649
SuperHost SVM Classi�er 0.40392157 0.86554622Non-SuperHost Decision Tree Classi�er 0.93074792 0.96137339
SuperHost Decision Tree Classi�er 0.71875 0.57983193
7 CONCLUSIONSIn this project, we performed two predictive tasks. First we studiedthe features that in�uenced price of the listings. Second, we studiedwhat a�ributes make a super host.For modeling prices, we studied various models. Ensemble tech-niques like Random Forest and Gradient Boosting proved to bebe�er than most other models. We also performed sentiment anal-ysis on the review text provided by the customers to assess if itadded value to the model. However, the features based on senti-ment analysis did not in�uence the model.To derive characteristics associated with a super host, we performedexploratory data analysis to �nd that cleanliness, location, commu-nication, number of reviews were major characteristics throughwhich we can distinguish a super host. We veri�ed our analysis, by
building classi�ers such as SVM and decision trees, and found ourresults were in line with the features we derived from our analysis.
�e a�empt to extract topics from review comments which dif-ferentiate between normal/super host did not work as expected.�is is because both the normal and super host shared the samesentiments/word vector distribution when it came to reviews. How-ever, when we analyzed good and bad reviews, we captured a fairpicture of factors which in�uenced review ratings.
8 REFERENCES[1] h�ps://www.kaggle.com/airbnb/boston[2] h�ps://en.wikipedia.org/wiki/Airbnb[3] h�ps://en.wikipedia.org/wiki/Decision tree learning[4] h�p://insideairbnb.com/get-the-data.html[5] h�ps://www.kaggle.com/residentmario/d/airbnb/boston/modeling-prices/[6] Winkler, RL. and Makridakis, S. (1983). �e Combination ofForecasts. J. R. Statis. Soc. A. 146(2), 150-157.[7] Makridakis, S. and Winkler, R.L. (1983). Averages of Forecasts:Some Empirical Results.Management Science, 29(9) 987-996.[8] h�ps://www.cs.cornell.edu/home/cardie/papers/masa-sentire-2011.pdf[9] h�p://res.cloudinary.com/general-assembly-pro�les/image/upload/v1474479496/geovpl78jbsx7dzqycde.pdf[10]h�ps://en.wikipedia.org/wiki/Support vector machine
8