Embed Size (px)
Citation preview
ARNOLD B. LARSON*
PRICE PREDICTION ON THE EGG FUTURES MARKET
ABSTRACT
Many studies of price behavior in commodity futures markets center on determination of the long-term net profits of some class of trader. In most cases the trader whose profits are studied is the long speculator, since in what might be called the traditional view, the principal function of the futures market is to accommodate the stock-carrying short hedger. The profits of the long speculators have been interpreted in at least one theory to be a payment by the hedger to the speculator for the service of bearing risk.
As the theory of hedging has been refined, it has proved necessary to modify the details of the basic method of study and to reinterpret the results. But the basic device of attempting to measure the long-term profits of a class of trader persists. This method of analysis is beset with many difficulties, most of which have been only partially resolved. Only traders with large positions are classified in the reports as hedgers or speculators. Some misclassification occurs. The exact timing of purchases and sales is not known, so profits cannot be measured accurately. Much of the apparent net profits which accrue to a class of trader, after suitable assumptions are made to deal with the above difficulties, can be traced to a few episodes of large price movement or to persistent long-run general price inBation, neither of which corresponds nicely to the alleged source of profit.
Perhaps the greatest difficulty with the basic method outlined above, at least so it seems to me, is the imputation of a deliberate motive to the ex post realized profit. How can a long speculator insist on, say, a 5 per cent level of profit? He seems to be pictured as saying "I do not know within a dollar what the price will be, but I insist on making a nickel on my trade (on the average)." He seems to come equipped with the proverbial micrometer on the end of a broomstick, and the broomstick's inaccuracy is supposed to be eliminated by averaging over many measurements. The method appears to beg the question of the ability of speculators to predict price, since no average level of profit is interpreted as bad prediction-rather, different levels of profit are interpreted as showing differing levels of avidness to speculate, or different levels of risk-aversion, and prediction is, on the average, exact .
.. Associate Professor, Department of Agricultural Economics, College of Tropical Agriculture, University of Hawaii.
so ARNOLD B. LARSON
This paper is directed in part toward the question of the ability of speculators to predict prices in the egg futures market at the Chicago Mercantile Exchange. The relationship between cash and futures prices of eggs is examined for the eleven-year period ending in 1966, during which almost all of the movement in cash egg prices can be attributed to a 12-month seasonal and a 30-month cyclical pattern. We argue that the cycle, at least for the early part of the period, was exceptionally free of random components and persisted long enough so that cash egg prices were highly predictable. Is there any indication that traders on the egg futures market were able to predict the cycle in cash egg prices?
The paper takes two approaches to the question. First, the gross pattern of movement of egg futures prices in relation to cash egg prices is presented. It does not show that speculators have a remarkable degree of ability to predict egg prices. Indeed, the ranges in September egg futures prices are of the same order of magnitude as the 30-month cash egg price cycle, which was presumably the only price variation being predicted (except for the highly predictable seasonal price movements).
The second approach to the question of whether speculators were able to predict the cycle in cash egg prices is to look for a sympathetic cycle in the futures prices. Such a sympathetic cycle in futures prices would indicate that speculators had taken a passive, nonpredictive, posture. Spectral estimates for futures prices showed no 30-month cycle and only a trace of the 12-month seasonal price pattern. Perhaps one can conclude that there is at least an attempt at predicting the cyclical fl uctuations.
The paper also considers the reasons for the marked decline in the use of the egg futures market in recent years. The cause seems to be the reduced need for short hedging of seasonal inventories, owing to more uniform production at all times of the year.
INTRODUCTION
The performance of a futures market, in terms of its contribution to more orderly production and marketing of the commodity being traded, can be judged by how well it predicts prices. The prediction can be used by producers to guide the level of production and it can be used by merchants to guide inventory management. The use of the price forecast might or might not involve overt use of the futures market for hedging, but the forecast is strengthened and improved when it is concurred in by hedgers, as many studies have shown. (See, for example, 4 and 8.)
A number of surveys of traders in commodity futures, conducted by the Commodity Exchange Authority, indicate that there is relatively little use made of futures markets by producers. Perhaps they do not understand the operation of the futures markets, or they may feel isolated from the markets because of differences in time and point of delivery in futures compared to their own product. Or they may simply prefer to speculate in the cash market. Failure of producers to use the markets does not mean that they are not influenced by the prices quoted on them, however. Even if producers ignore futures prices, their suppliers and credit agencies may take them into account. Furthermore, the use
EGG FUTURES PRICE PREDICTIONS 51
of futures markets for hedging inventories can have an important effect on cash prices, especially in the short run, and presumably producers are aware of cash prices.
In short, futures markets provide price guides for producers, even though there may be no conscious effort on the part of the futures market to provide this service and little explicit use of the service of the futures market per se by producers. The estrangement or lack of rapport between producers and futures traders does not imply that the guides are not used, and futures markets can be credited with performing a useful service, however incidentally, provided only that the price prediction be sufficiently accurate.
In this paper, I wish to examine the behavior of shell egg futures prices on the Chicago Mercantile Exchange in recent years to see if these prices have contributed to prediction of cash egg prices and hence to more orderly production and marketing of eggs. Cogent and potentially valid arguments can be advanced for either good or bad behavior of futures prices, and the truth rests on the facts as they relate to each market and each period of time. Generalization of conclusions reached in one study to other markets is somewhat hazardous and will not be attempted here.
The shell egg futures market was chosen for study partly because of its interest as a futures market. It has appeared to be a highly speculative market, in the sense that volume of trading has often been high relative to open contracts. The commodity is relatively perishable, an attribute sometimes held to be inimical to effective futures trading. It has been a large market, at times ranking as high as third in value of trading, but has recently experienced a sharp drop in use. The decline has been attributed to the contract specification of refrigerator eggs, which, it has been claimed, no longer serves the needs of the industry (2). Instances have been noted in which contract specifications have led to disuse of a futures market (9), but we need to consider more carefully whether this is a case in point. The controlling factor in the choice of the shell egg futures market, however, was the opportunity it seemed to afford for an especially clear test of the ability of futures traders to predict prices.
The basic difficulty in testing accuracy of price prediction is that one must ordinarily rely on the eventual price, say that of a futures contract in the delivery month, as the right price, that is, as the price which should have been predicted. In fact, the actual price may have been affected by a number of unpredictable factors, and failure of the market to predict the resultant price changes should not redound to the discredit of the market. The cash egg market has exhibited cyclical fluctuations of sufficient persistence and regularity so they should have been recognized and acted upon by speculators. Moreover, the cycle and seasonal variation account for most of the variation that has occurred in recent years. By examining the pattern of futures prices in relation to cash prices we should be able to determine to what extent the cyclical element of price change was being predicted. Admittedly, at some points the analysis is somewhat subjective. After testing for price prediction we will consider whether the present shell egg contract seems well designed to communicate such predictive ability as exists from the futures market speculators to the producers of the cash commodity.
52 ARNOLD B. LARSON
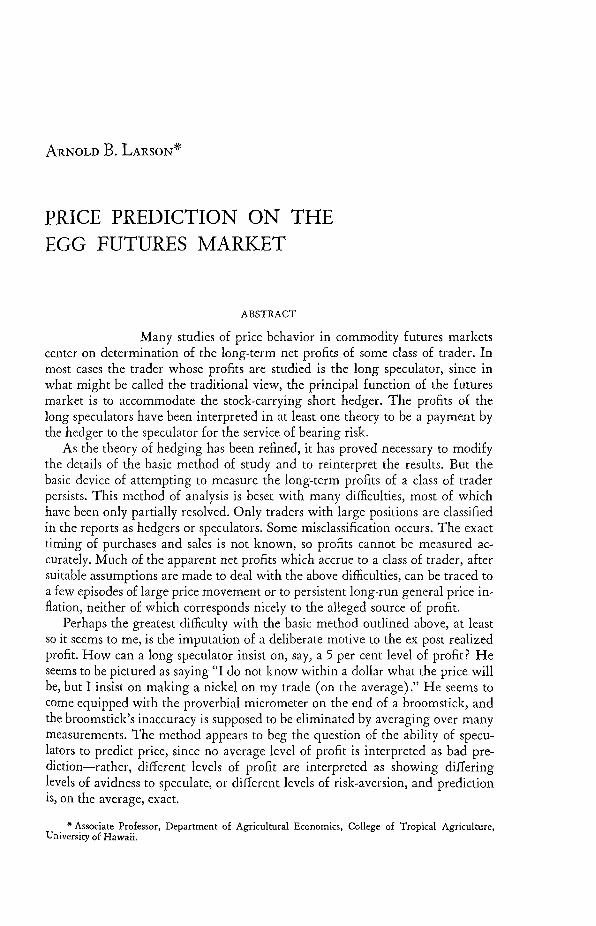
CHART I.-AVERAGE U. S. FARM PRICE OF EGGS AND LAYERS ON FARMS,
AS DEVIATIONS FROM TRENDS, 1955-65""
~ +s a.. ~ z O~~r-~--------~-------T~~~--~~~~~----~~~~ I- w ZN wO 00 -S
-S
1960
I 11+5 0: '" -A •• -"""' (\ PRI.£; A A /'.... rL 0 ~ z ~VQc=J ~-=-v "no" J ~ ~
V +5 ~g
1961 1962 1963 1964 1965 I
+5 Z CIJ 00:
o::::iW ...J>-« ~...J
-5
* Basic data are monthly U. S. average farm prices of eggs, and first of the month number of layers on farms. Straight-line trends were fitted for individual months, thus removing both long-term trend and seasonal variation.
THE EGG PRICE AND PRODUCTION CYCLE
The United States average farm price of eggs and the number of layers on farms in the nation are shown in Chart 1, as deviations from linear trends.1 In both instances, the trends were fitted for individual months, so both long-term trend and seasonal have been removed. There is a cycle in price, and an opposed one in production, of about 30 months duration. The period is four times the length of time (7 or 8 months) required to produce a laying pullet from a fertile egg, so the cycle appears to be another in the widely occurring class of agricultural production cycles which I have called harmonic motion (5). It should be noted, however, that the cycle was quite damped in 1961-63 and has only recently begun to reemerge.
The basic features of the cycle mechanism are: (1) producers base their price expectations on current price, and seem to expect current price to persist through the period for which they make plans; (2) producers expand or contract production by a percentage factor that depends on the current rate of profitability of production; and (3) there is a fixed production lag that delays realization of
1 Basic statistical data for all the charts are from Chicago Mercantile Exchange, Year Book 1965-1966, and earlier issues.
EGG FUTURES PRICE PREDICTIONS
CHART 2.-SMOOTHED SPECTRAL ESTIMATES AND AUTOCORRELOGRAM FOR
U. S. FARM PRICE OF EGGS, 1955-65«<
SPECTRAL ESTIMATES 3
12 MONTH CYCLE
2
30 MONTH CYCLE
o 20 30 40 50 60 FREQUENCY
30 12 6 PERIOD 3 2 +1.0
AUTOCORRELOGRAM +.5
Or--T--~~~----+---~~7----+-----7~~---r---
-.5
o 10 20 30 LAG
40 50 60
53
• Computations by the author using the method given by Blackman and Tukey (2) adapted for use on the IBM 7040 computer at the Statistical and Computing Center of the University of Hawaii.
changes in level of production so that when the changes manifest themselves they are no longer appropriate.
Under certain assumptions regarding parameter values, the mechanism leads to persistent sinusoidal oscillations in price and production. A similar mechanism has been used by outlook economists in the U.S. Department of Agriculture to predict short-run changes in egg prices and production, but the fluctuations appear to be viewed as episodic adjustments to dislocation in the industry, rather than as a persistent cycle. (See, for example, 10.)
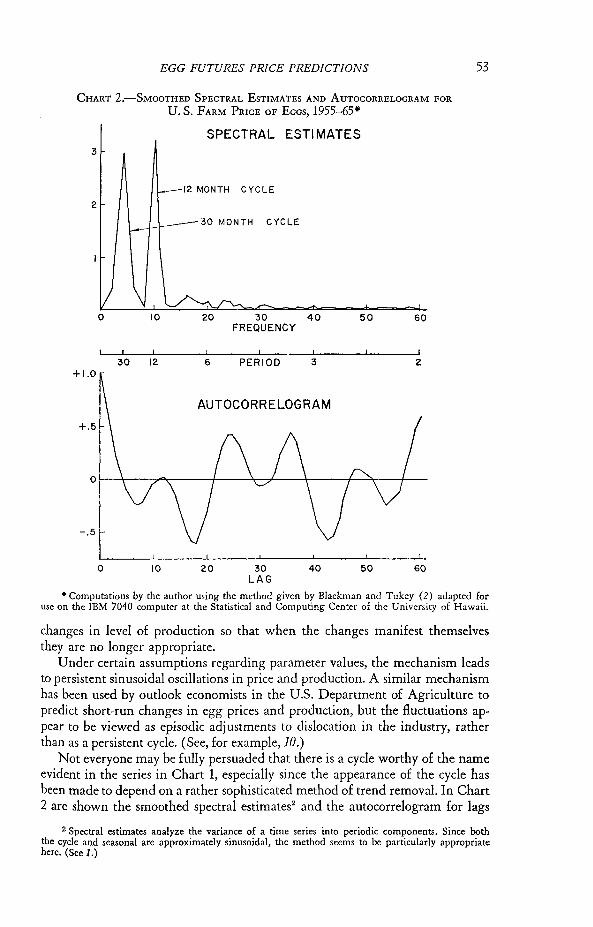
Not everyone may be fully persuaded that there is a cycle worthy of the name evident in the series in Chart 1, especially since the appearance of the cycle has been made to depend on a rather sophisticated method of trend removal. In Chart 2 are shown the smoothed spectral estimates2 and the autocorrelogram for lags
2 Spectral estimates analyze the variance of a time series into periodic components. Since both the cycle and seasonal are approximately sinusoidal, the method seems to be particularly appropriate here. (See 1.)
54 ARNOLD B. LARSON
up to 60 months for unadjusted data for U. S. farm prices of eggs for 1955-65. The peak in spectral density at frequency of 4, which corresponds to a period of 30 months, lends considerable support to the hypothesis of a cycle of that length, as does the appearance of the autocorrelogram, which shows a 12-month seasonal superimposed on a 30-month cycle. The equality of the two peaks of spectral density indicates that the cycle contributes about as much to variance of prices as does the seasonal.
We have established the existence of the price cycle and note in passing that speculators would ignore its existence at their peril. That is, if there is a close relationship between cash prices of eggs at Chicago and the U. S. average farm price, and if futures prices are tied closely to cash prices, then futures prices must either predict the cycle in cash prices or they must exhibit a sympathetic cyclical movement. The alternative, which is extremely unlikely but which cannot be dismissed on logical grounds, that futures prices are so unrelated to cash prices that the cycle can safely be ignored, must be given some attention in the evaluation of price behavior that follows.
THE BEHAVIOR OF EGG FUTURES PRICES
For the purpose of testing whether egg futures speculators were able to predict cyclical price movements, it seems best to emphasize the September shell egg future. Trading begins almost a full year before the final delivery date, ample time for producers to respond to the price quotation if they choose to do so. The September future is often the most heavily traded, and has a large level of open contracts during the period of stocks accumulation. The other contracts, October, November, December, and January of the following year, are occasionally more heavily traded, and often show greater price fluctuation, and no doubt deserves study as well, but they are probably of greater interest in the question of inventory management than they are in that of price prediction.
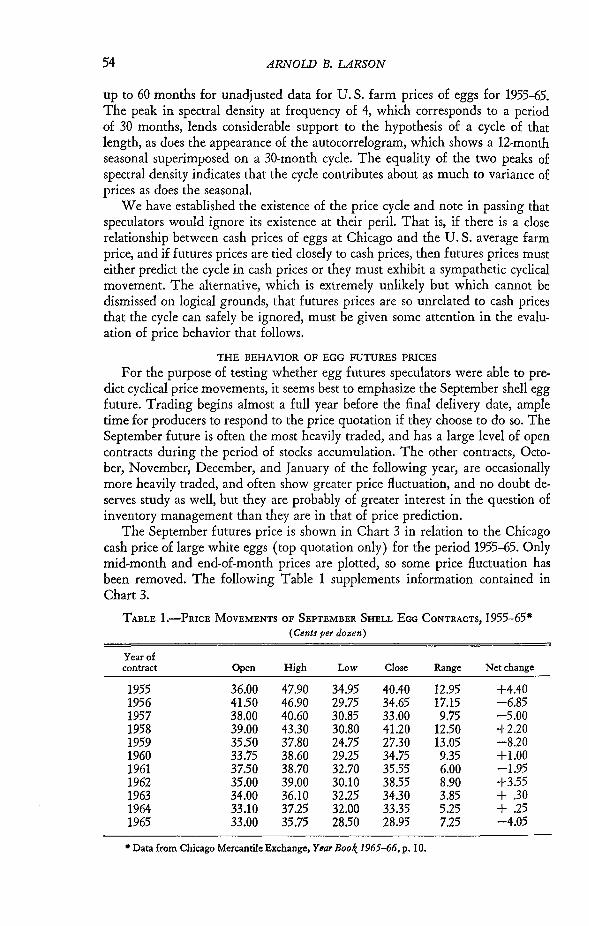
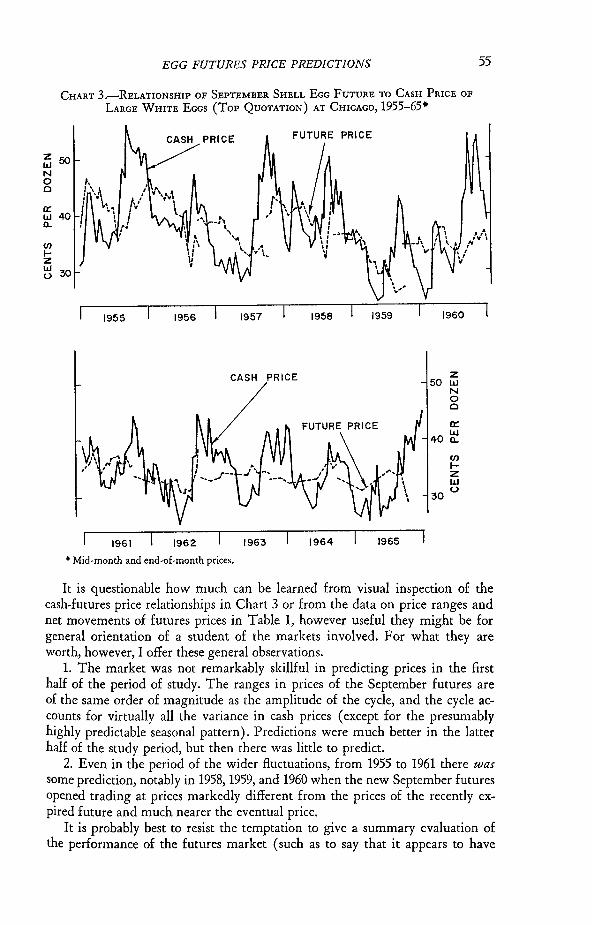
The September futures price is shown in Chart 3 in relation to the Chicago cash price of large white eggs (top quotation only) for the period 1955-65. Only mid-month and end-of-month prices are plotted, so some price fluctuation has been removed. The following Table 1 supplements information contained in Chart 3.
TABLE I.-PRICE MOVEMENTS OF SEPTEMBER SHELL EGG CONTRACTS, 1955-65· ( Cents per dozen)
Year of contract Open High Low Close Range Net change
1955 36.00 47.90 34.95 40.40 12.95 +4.40 1956 41.50 46.90 29.75 34.65 17.15 -6.85 1957 38.00 40.60 30.85 33.00 9.75 -5.00 1958 39.00 43.30 30.80 41.20 12.50 +2.20 1959 35.50 37.80 24.75 27.30 13.05 -8.20 1960 33.75 38.60 29.25 34.75 9.35 +1.00 1961 37.50 38.70 32.70 35.55 6.00 -1.95 1962 35.00 39.00 30.10 38.55 8.90 +3.55 1963 34.00 36.10 32.25 34.30 3.85 + .30 1964 33.10 37.25 32.00 33.35 5.25 + .25 1965 33.00 35.75 28.50 28.95 7.25 -4.05
• Data from Chicago Mercantile Exchange, Year Book 1965-66, p. 10.
EGG FUTURES PRICE PREDICTIONS
CHART 3.-RELATIONSHIP OF SEPTEMBER SHELL EGG FUTURE TO CASH PRICE OF
LARGE WHITE EGGS (Top QUOTATION) AT CHICAGO, 1955-65·
~50 N o o
a: w 40 a..
1955
1961
1956 1957
CASH PRICE
1962 1963
• Mid-month and end-of-month prices.
PRICE
1958 1959
1964 1965
1960
z 50 w
N o o
(/) IZ w
30 (,)
55
It is questionable how much can be learned from visual inspection of the cash-futures price relationships in Chart 3 or from the data on price ranges and net movements of futures prices in Table 1, however useful they might be for general orientation of a student of the markets involved. For what they are worth, however, I offer these general observations.
1. The market was not remarkably skillful in predicting prices in the first half of the period of study. The ranges in prices of the September futures are of the same order of magnitude as the amplitude of the cycle, and the cycle accounts for virtually all the variance in cash prices (except for the presumably highly predictable seasonal pattern). Predictions were much better in the latter half of the study period, but then there was little to predict.
2. Even in the period of the wider fluctuations, from 1955 to 1961 there was some prediction, notably in 1958, 1959, and 1960 when the new September futures opened trading at prices markedly different from the prices of the recently expired future and much nearer the eventual price.
It is probably best to resist the temptation to give a summary evaluation of the performance of the futures market (such as to say that it appears to have
56 ARNOLD B. LARSON
had a stabilizing influence or that it has been too conservative in its predictions) because such assessments generally owe much to hindsight. An apparently erratic price movement may embody a great deal of restraint. It was precisely to avoid such unfair assessment that the egg market was chosen for study. An objective test of the predictive ability of the futures market is available, because we can see if the futures prices exhibit cyclical oscillations in sympathy with the cycle in cash egg prices, and this would show lack of prediction.
A number of statistical tests of randomness are available for use in testing the behavior of the egg futures prices, all of which are better adapted to a continuous series of prices than to disjointed segments such as the separate September futures price series. A continuous series was constructed by splicing December futures prices into the gaps between successive September futures, and adding a constant term to each price to compensate for differences in price levels of successive futures.
The resulting series of daily futures prices showed a distinct downward drift, which was more pronounced in the first half of the period studied. Prices in the spliced series declined from about 38 cents to about 10 cents, a much greater decline than that shown by the cash egg prices, indicating a bias in the futures prices which we will attempt to account for in the next section.
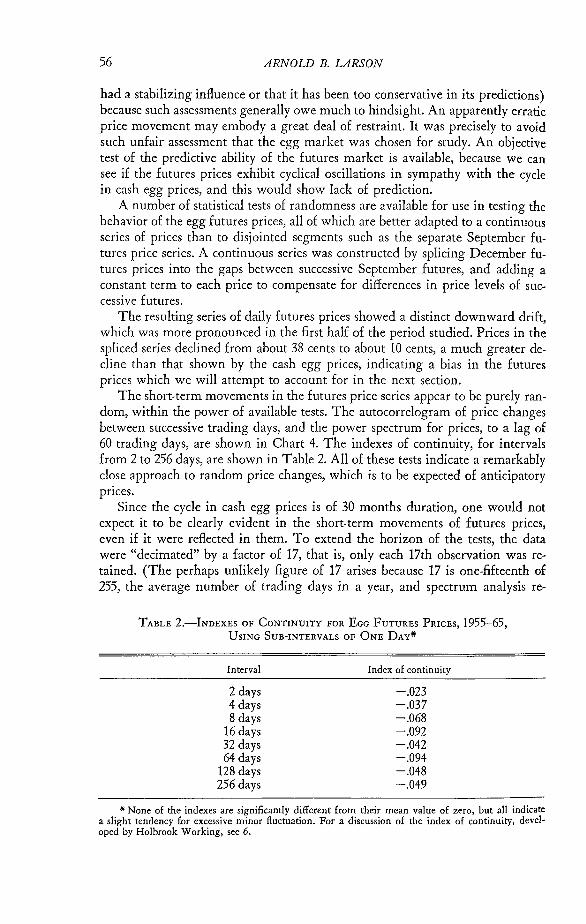
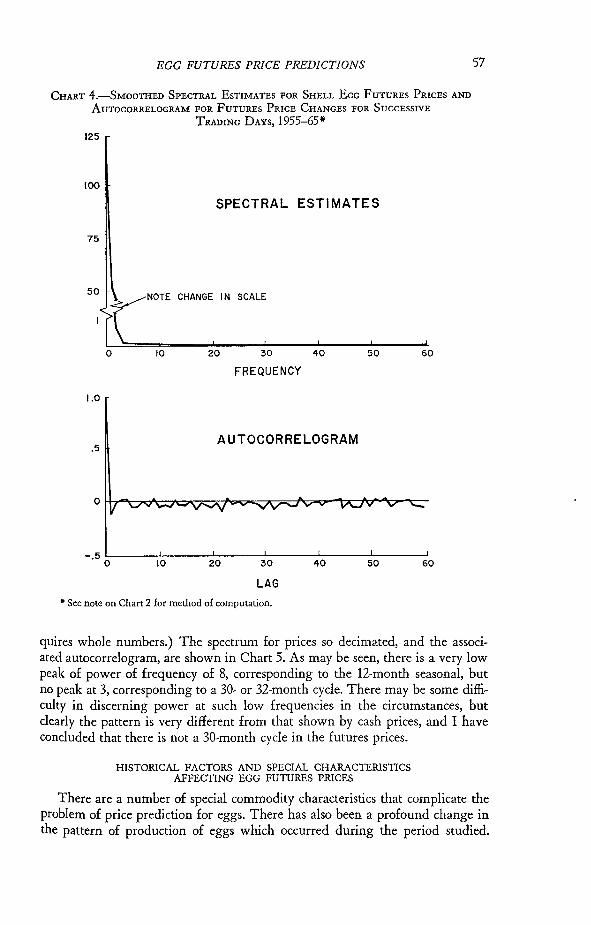
The short-term movements in the futures price series appear to be purely random, within the power of available tests. The autocorrelogram of price changes between successive trading days, and the power spectrum for prices, to a lag of 60 trading days, are shown in Chart 4. The indexes of continuity, for intervals from 2 to 256 days, are shown in Table 2. All of these tests indicate a remarkably close approach to random price changes, which is to be expected of anticipatory prices.
Since the cycle in cash egg prices is of 30 months duration, one would not expect it to be clearly evident in the short-term movements of futures prices, even if it were reflected in them. To extend the horizon of the tests, the data were "decimated" by a factor of 17, that is, only each 17th observation was retained. (The perhaps unlikely figure of 17 arises because 17 is one-fifteenth of 255, the average number of trading days in a year, and spectrum analysis re-
TABLE 2.-INDEXES OF CONTINUITY FOR EGG FUTURES PRICES, 1955-65, USING SUB-INTERVALS OF ONE DAY'*'
Interval
2 days 4 days 8 days
16 days 32 days 64 days
128 days 256 days
Index of continuity
-.023 -.037 -.068 -.092 -.042 -.094 -.048 -.049
• None of the indexes are significantly different from their mean value of zero, but all indicate a slight tendency for excessive minor fluctuation. For a discussion of the index of continuity, developed by Holbrook Working, see 6.
EGG FUTURES PRICE PREDICTIONS
CHART 4.-SMOOTHED SPECTRAL ESTIMATES FOR SHELL EGG FUTURES PRICES AND
AUTOCORRELOGRAM FOR FUTURES PRICE CHANGES FOR SUCCESSIVE
TRADING DAYS, 1955-65* 125
100
SPECTRAL ESTIMATES
75
50 NOTE CHANGE IN SCALE
o 10 20 30 40 50 60
FREQUENCY
1.0
AUTOCORRELOGRAM .5
-.5 L-____ ~ ______ ~ ____ ~ ______ ~ ______ ~ ____ ~
o 10 20 30 40 50 60
LAG • See note on Chart 2 for method of computation.
57
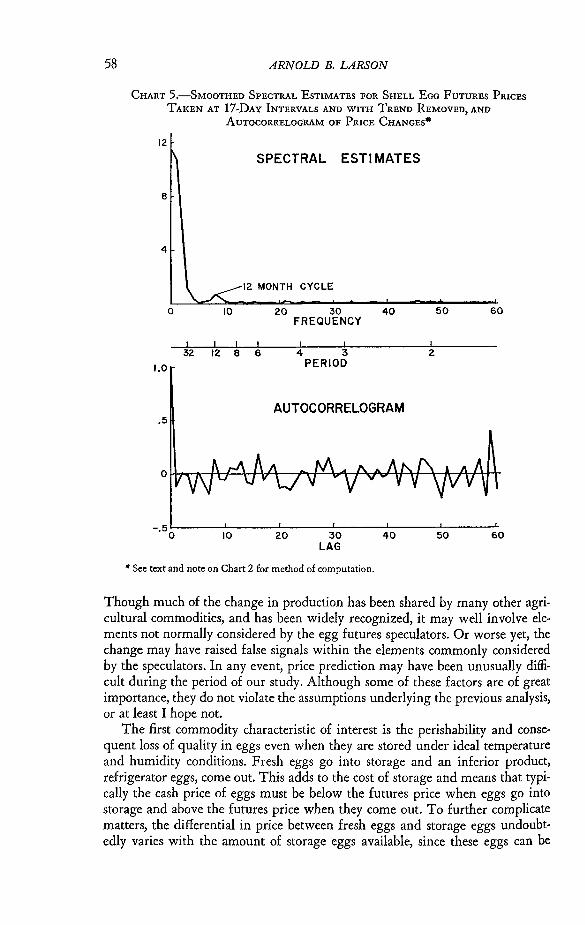
quires whole numbers.) The spectrum for prices so decimated, and the associated autocorrelogram, are shown in Chart 5. As may be seen, there is a very low peak of power of frequency of 8, corresponding to the 12-month seasonal, but no peak at 3, corresponding to a 30- or 32-month cycle. There may be some difficulty in discerning power at such low frequencies in the circumstances, but clearly the pattern is very different from that shown by cash prices, and I have concluded that there is not a 30-month cycle in the futures prices.
HISTORICAL FACTORS AND SPECIAL CHARACTERISTICS AFFECTING EGG FUTURES PRICES
There are a number of special commodity characteristics that complicate the problem of price prediction for eggs. There has also been a profound change in the pattern of production of eggs which occurred during the period studied.
58 ARNOLD B. LARSON
CHART 5.-SMOOTHED SPECTRAL ESTIMATES FOR SHELL EGG FUTURES PRICES
TAKEN AT 17-DAY INTERVALS AND WITH TREND REMOVED, AND
AUTOCORRELOGRAM OF PRICE CHANGES·
12
e
4
1.0
.5
SPECTRAL ESTI MATES
12 MONTH CYCLE
I I I I 32 12 8 6
10
20 30 40 . FREQUENCY
I I
4 3 PERIOD
AUTOCORRELOGRAM
20 30 LAG
40
• See text and note on Chart 2 for method of computation.
50 60
2
50 60
Though much of the change in production has been shared by many other agricultural commodities, and has been widely recognized, it may well involve elements not normally considered by the egg futures speculators. Or worse yet, the change may have raised false signals within the elements commonly considered by the speculators. In any event, price prediction may have been unusually difficult during the period of our study. Although some of these factors are of great importance, they do not violate the assumptions underlying the previous analysis, or at least I hope not.
The first commodity characteristic of interest is the perishability and consequent loss of quality in eggs even when they are stored under ideal temperature and humidity conditions. Fresh eggs go into storage and an inferior product, refrigerator eggs, come out. This adds to the cost of storage and means that typically the cash price of eggs must be below the futures price when eggs go into storage and above the futures price when they come out. To further complicate matters, the differential in price between fresh eggs and storage eggs undoubtedly varies with the amount of storage eggs available, since these eggs can be
EGG FUTURES PRICE PREDICTIONS 59
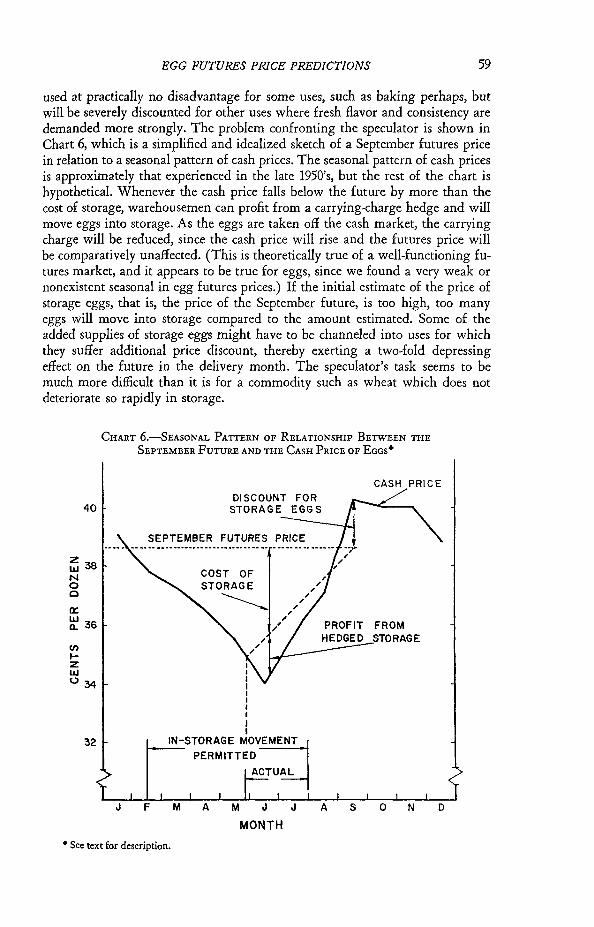
used at practically no disadvantage for some uses, such as baking perhaps, but will be severely discounted for other uses where fresh flavor and consistency are demanded more strongly. The problem confronting the speculator is shown in Chart 6, which is a simplified and idealized sketch of a September futures price in relation to a seasonal pattern of cash prices. The seasonal pattern of cash prices is approximately that experienced in the late 1950's, but the rest of the chart is hypothetical. Whenever the cash price falls below the future by more than the cost of storage, warehousemen can profit from a carrying-charge hedge and will move eggs into storage. As the eggs are taken off the cash market, the carrying charge will be reduced, since the cash price will rise and the futures price will be comparatively unaffected. (This is theoretically true of a well-functioning futures market, and it appears to be true for eggs, since we found a very weak or nonexistent seasonal in egg futures prices.) If the initial estimate of the price of storage eggs, that is, the price of the September future, is too high, too many eggs will move into storage compared to the amount estimated. Some of the added supplies of storage eggs might have to be channeled into uses for which they suffer additional price discount, thereby exerting a two-fold depressing effect on the future in the delivery month. The speculator's task seems to be much more difficult than it is for a commodity such as wheat which does not deteriorate so rapidly in storage.
40
~ 38 N o o a:: ~ 36
C/)
I-Z w °34
32
CHART 6.-SEASONAL PATTERN OF RELATIONSHIP BETWEEN THE
SEPTEMBER FUTURE AND THE CASH PRICE OF EGGS·
CASH PRICE
SEPTEMBER
F A M J J A S o MONTH
• See text for description.
60 ARNOLD B. LARSON
Some of the errors in price prediction evident in the cash and September futures price series in Chart 3 can probably be traced to the above factor. An expiring future sometimes exhibits an unusual relationship to current cash prices because an exceptionally attractive, or poor, quality of the commodity is being delivered or would have to be delivered in fulfillment of the futures contract. Occasionally the delivery location is especially desirable. A given cash price series may be less representative of the delivery grade of the commodity at some times than at others. I have not taken special care to obtain the cash price series most comparable to the delivery grade of eggs, being content to use a readily available series that seems to meet the physical description of the futures contract grade and type of eggs. Even acknowledging the possible lack of comparability, there are very wide differences in the premium of cash price over the September futures price, which must be ascribed to differences in supplies of storage eggs. Usually, as in 1955, 1957, 1959, and 1960, large discounts for futures under the cash price occurred in years of declining futures, when the futures price started out high, in most cases predicting a high cash price in the coming fall, and then declined because too many cold storage eggs were being accumulated.
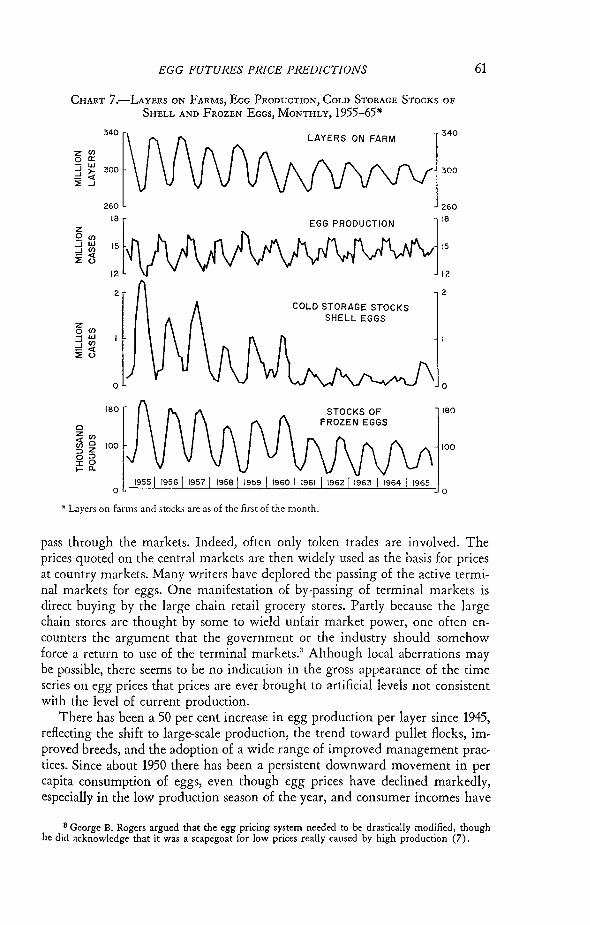
A number of changes have occurred in the pattern of production of eggs that together have greatly diminished the seasonal fluctuation in production and prices of eggs, and have profoundly affected the marketing, storage, pricing, and futures trading of eggs. First of all, there has been concentration of production onto the farms of large-scale producers. As an indication of this, in 1954 10 per cent of eggs were produced by backyard flocks, whereas by 1964 the amount was too small to be reported by the U. S. Department of Agriculture. Methods of production currently in favor, such as the all-pullet flock, tend to facilitate more uniform production on the commercial farms. There has been a remarkable shift in production into southern and southwestern states, with more uniform climate and length of daylight hours throughout the year. In 1956, the South Atlantic and South Central states combined produced 22 per cent of the eggs in the U. S., whereas in 1964 they were producing almost 35 per cent. California's production went from about 7.5 per cent in 1956 to over 12 per cent in 1964. Although the changes noted have been going on for many years and will continue into the future, the period of the present study encompassed much of the period of rapid change. Series on layers on farms, production, and storage stocks of shell and frozen eggs are shown in Chart 7. All of these series show the reduced seasonal pattern originating in the pattern of layers on farms.
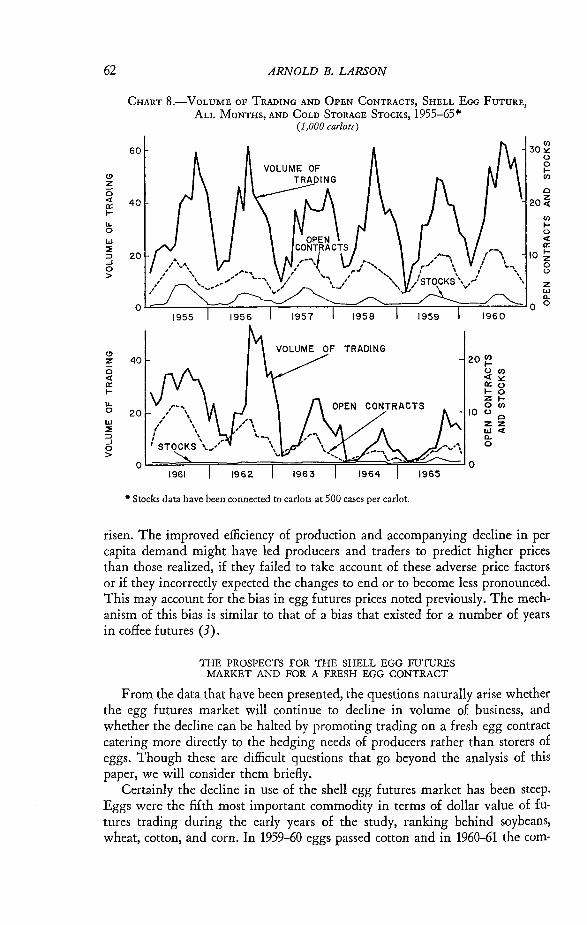
Futures trading in eggs, as in most commodities, occurs in connection with inventory management. As seasonal inventories declined, the volume of trading and open interest declined with them. The relationships between these three series are shown in Chart 8. We want to consider whether the reduction in seasonal inventories necessarily will lead to further decline in the use of the egg futures market, perhaps to the point of extinction, but first we will touch briefly on a few other changes and special attributes of the egg marketing system that may have affected the behavior of prices.
The pricing of eggs is a highly sophisticated procedure, and differs from that of most commodities. Briefly, prices are established in central markets in key cities such as Chicago and N ew York where very low volume of eggs actually
EGG FUTURES PRICE PREDICTIONS
CHART 7.-LAYERS ON FARMS, EGG PRODUCTION, COLD STORAGE STOCKS OF
SHELL AND FROZEN EGGS, MONTHLY, 1955-65*
Z O(J) -w ....J(J) ::!« :;:u
340
260
18
12
2
o
180
o z(J)
;;; ~ 100 :::>:::> 00 Fe..
o
LAYERS ON FARM
EGG PRODUCTION
COLD STORAGE STOCKS SHELL EGGS
STOCKS OF FROZEN EGGS
19551 19561 19571 1958 1 1959 1 1960 1 1961 1 196211963 1 1964 1 1965
* Layers on farms and stocks arc as of the first of the month.
340
300
260
2
o
180
100
o
61
pass through the markets. Indeed, often only token trades are involved. The prices quoted on the central markets are then widely used as the basis for prices at country markets. Many writers have deplored the passing of the active terminal markets for eggs. One manifestation of by-passing of terminal markets is direct buying by the large chain retail grocery stores. Partly because the large chain stores are thought by some to wield unfair market power, one often encounters the argument that the government or the industry should somehow force a return to use of the terminal markets.3 Although local aberrations may be possible, there seems to be no indication in the gross appearance of the time series on egg prices that prices are ever brought to artificial levels not consistent with the level of current production.
There has been a 50 per cent increase in egg production per layer since 1945, reflecting the shift to large-scale production, the trend toward pullet flocks, improved breeds, and the adoption of a wide range of improved management practices. Since about 1950 there has been a persistent downward movement in per capita consumption of eggs, even though egg prices have declined markedly, especially in the low production season of the year, and consumer incomes have
8 George B. Rogers argued that the egg pricing system needed to be drastically modified, though he did acknowledge that it was a scapegoat for low prices really caused by high production (7).
62
(!)
z o <! a: l-LL o W :,; ::> .J o >
(!)
z c <! a: l-
LL o W :,; ::> .J o >
ARNOLD B. LARSON
CHART 8.-VOLUME OF TRADING AND OPEN CONTRACTS, SHELL EGG FUTURE,
ALL MONTHS, AND COLD STORAGE STOCKS, 1955-6541< (1,000 cal-lots)
60
40
20
V)
30 l<: o o lV)
a 20~
V)
Io <! a:
10 ~ o o
z W Q..
Ol=~--~==::::::.--~:::::...--....::r=~--'-"::::=:=r=~---.-..::::r==~--.-..::::::..IOO
TRADING 40
20
1961
• Stocks data have been connected to carlots at 500 cases per carlot.
20 ~ o en «::.::: a:(.) 1-0 ZIOen
10 (.) a zz W<! n. o
risen. The improved efficiency of production and accompanying decline in per capita demand might have led producers and traders to predict higher prices than those realized, if they failed to take account of these adverse price factors or if they incorrectly expected the changes to end or to become less pronounced. This may account for the bias in egg futures prices noted previously. The mechanism of this bias is similar to that of a bias that existed for a number of years in coffee futures (3).
THE PROSPECTS FOR THE SHELL EGG FUTURES MARKET AND FOR A FRESH EGG CONTRACT
From the data that have been presented, the questions naturally arise whether the egg futures market will continue to decline in volume of business, and whether the decline can be halted by promoting trading on a fresh egg contract catering more directly to the hedging needs of producers rather than storers of eggs. Though these are difficult questions that go beyond the analysis of this paper, we will consider them briefly.
Certainly the decline in use of the shell egg futures market has been steep. Eggs were the fifth most important commodity in terms of dollar value of futures trading during the early years of the study, ranking behind soybeans, wheat, cotton, and corn. In 1959-60 eggs passed cotton and in 1960-61 the com-
EGG FUTURES PRICE PREDICTIONS 63
modity reached its highest rank, third, by surpassing corn in value of trading. At this time frozen eggs were reaching the peak of their brief career as a rank~ ing futures commodity. In 1961-62 corn resumed third rank, and in 1962-63 soy~ bean oil and soybean meal passed eggs, even if the value of egg trading is com~ puted as the sum of shell and frozen egg values, reducing eggs to sixth rank.
The rank is somewhat misleading, perhaps, since there is marked concentra~ tion of trading in the leading commodities. Nonetheless, the egg futures market has been very big. It may be noted, however, that the market still is big, being roughly comparable to the futures markets for oats, rye, and potatoes. The pre~ ent volume of business can probably sustain the market. Further leveling out of the seasonal pattern of egg production, and further reduction in cold storage stocks of eggs, might reduce the level of futures trading even further, of course.
The more interesting question, perhaps, is whether a fresh, that is, nonrefrigerated, egg contract would revitalize the market and make it more useful for hedgers (2, p. 3). The hedgers contemplated here are egg producers. Is this a promising alternative?
The first point to be made is that this new class of hedgers, the producers, would probably have to be drawn into the market. While they may have avoided the present shell egg futures market because of wide variation in the price differential between cash and futures in the delivery month, experience with many other markets of long standing suggests that producers will not be highly attracted to the fresh egg contract even if it converges nicely to the cash price. On the other hand, recently instituted live cattle and hogs contracts, which share some attributes of the proposed fresh egg contract, have met with favorable response.
We have emphasized that the price discovery function of the futures market appears to be incidental to speculation instituted in response to hedging. There is probably no conscious effort in any market to maintain a futures market price quotation simply for its usefulness as a price guide for producers. Also, speculators need price movement, which affords the opportunity for profit, if they are to retain an interest in a futures market. The butter futures market, which was once an active market, has been inoperative in recent years, probably largely because there has been so little movement in butter prices. Brief episodes of price uncertainty during the period of inactivity have not been enough to cause trading to be reinstated. Evidently, here as elsewhere, success breeds success, and a futures market has to be a going concern in order to attract business.
The price risk facing egg producers does not seem to be great enough either to attract them into the futures market as hedgers on a fresh egg contract or to attract speculators to take over the price risk. At least it seems very unlikely that the market would be returned to its previous high levels of activity in this way.'
CONCLUSIONS
Although the egg futures market has sometimes been stigmatized as too speculative, it emerges from this study as essentially a hedging market. Trading is built around the hedging of seasonal inventories of refrigerator eggs. Because of this focus, the market is best at predicting seasonal price movements. It succeeds
4 Since this was written, trading in fresh egg futures has been inaugurated by the Chicago Mercantile Exchange, but it is still too early to say what success this contract will meet.
64 ARNOLD B. LARSON
to some extent in predicting cyclical price changes, but appears to miss most of the trend movement, such as the slight downward drift in recent years.
The market has experienced a decline in business in recent years for two reasons: the level of inventories has declined, and price variability has lessened. It is ironic, in view of some criticism of futures markets, that far from creating its own price variability, this market has tended to languish when inherent price variation has been lacking.
CITATIONS
1 R. B. Blackman and J. W. Tukey, The Measurement of Power Spectra (New York,1958).
2 R. P. Bentz, "The Futures Contract and Its Use in the Egg Industry." Paper presented at North Central States Poultry Workshop, Purdue University, Lafayette, Indiana, September 28-30, 1965, mimeo.
3 R. W. Gray, "The Characteristic Bias in Some Thin Futures Markets," Food Research Institute Studies, November 1960.
4 ---, "The Importance of Hedging in Futures Trading; and the Effectiveness of Futures Trading for Hedging," Futures Trading Seminar, Vo!' I (Madison, Wisconsin, 1960).
5 A. B. Larson, "The Hog Cycle as Harmonic Motion," Journal of Farm Economics, May 1964.
6 ---, "Measurement of a Random Process in Futures Prices," Food Research Institute Studies, November 1960.
7 G. B. Rogers, "The Egg Pricing Problem" (U. S. Dept. of Agr., Agricultural Marketing Service, Washington, D.C., 1961), mimeo.
8 Holbrook Working, "Speculation on Hedging Markets," Food Research Institute Studies, May 1960.
9 ---, "Whose Markets? Evidence on Some Aspects of Futures Trading," Journal of Marketing, July 1954.
10 U. S. Dept. of Agr., Economic Research Service, Poultry and Egg Situation, 1966 Outlook Issue, November 1965.
![Futures Volume 3 Issue 3 1971 [Doi 10.1016%2F0016-3287%2871%2990023-1] I.F. Clarke -- The Pattern of Prediction- Forecasting- Facts and Fallibilities](https://img.pdfslide.net/doc/110x75/577cc5c91a28aba7119d379d/futures-volume-3-issue-3-1971-doi-1010162f0016-328728712990023-1-if.jpg)


![Futures Volume 4 issue 4 1972 [doi 10.1016%2F0016-3287%2872%2990055-9] I.F. Clarke -- 5. Prelude to prediction- Andreae, Kepler, Campanella.pdf](https://img.pdfslide.net/doc/110x75/577cc5c91a28aba7119d3741/futures-volume-4-issue-4-1972-doi-1010162f0016-328728722990055-9-if.jpg)