Embed Size (px)
Citation preview
PRICE RISK MANAGEMENT AS A MARGIN DRIVER FOR THE PULP AND PAPER BUSINESS
16th Day of Slovene Paper Industry21st November,, 2012
• Introduction to Nordea Bank
• Why Price Risk Management?
• Pulp market outlook
2
PRICE RISK MANAGEMENT AS A MARGIN DRIVER
FOR THE PULP AND PAPER BUSINESS
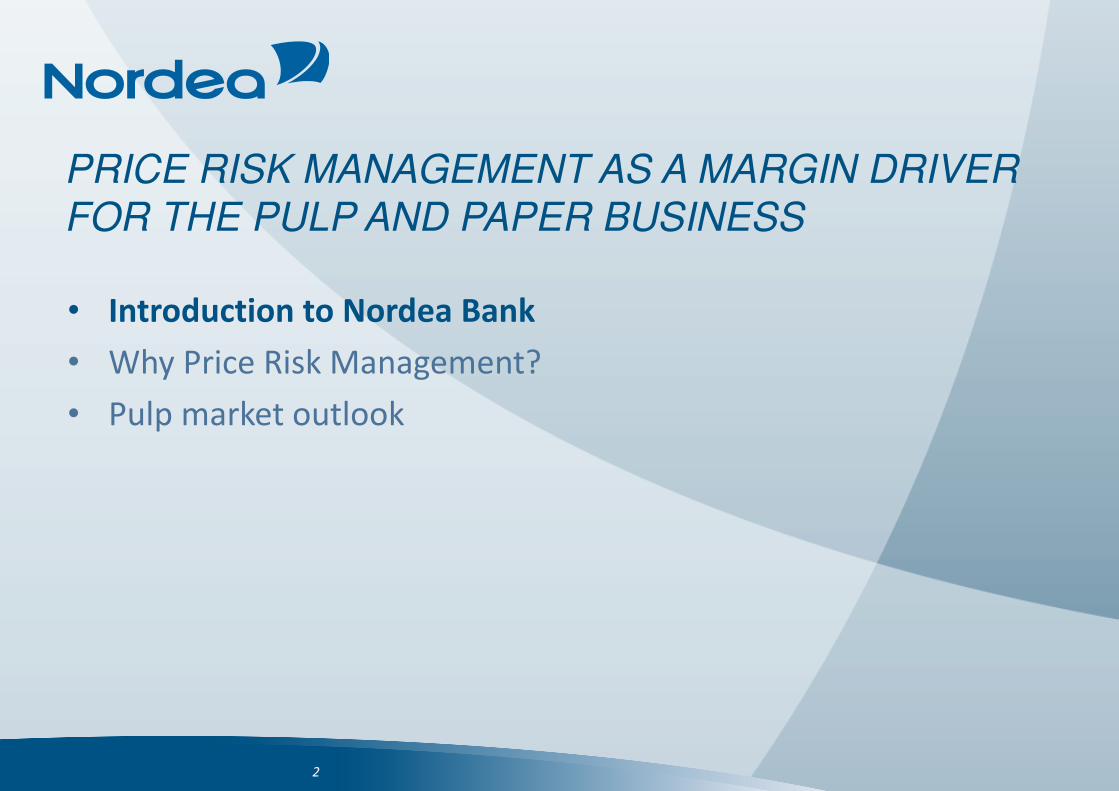
Nordea Bank- The largest financial services group in the Nordic
& Baltic region
3
•
� 11 million customers- 9 home markets- Approx. 10.5 million personal customers- 500,000 corporate customers, incl. Nordic Top 500
�Distribution power- More than 1,000 locations in total
- 6.6 million Netbank customers
� Financial strength- EUR 9,3bn in income (2011)- EUR 709bn of assets- EUR 27bn in equity capital- AA credit rating
- Core Tier 1 capital ratio of 11.8%
�EUR ~28bn in market cap- One of the largest Nordic corporations- A top-10 European retail bank
Nordea’s home markets
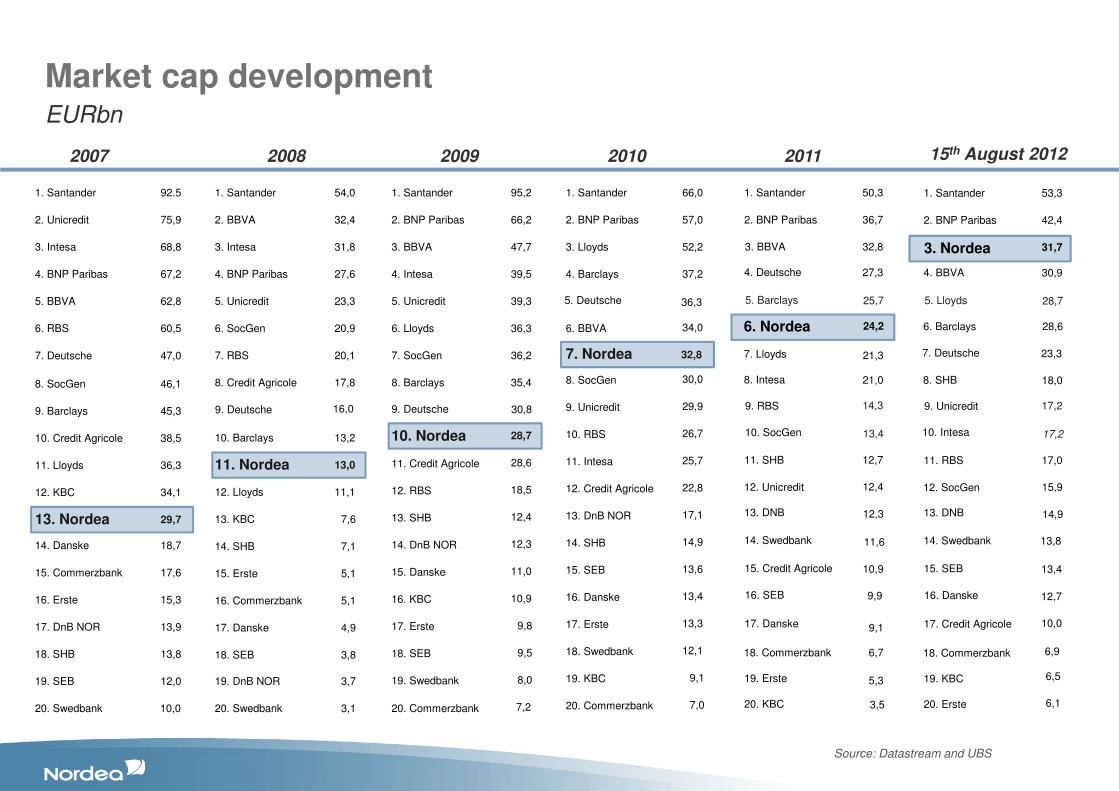
Market cap development
Source: Datastream and UBS
EURbn
1. Santander
2. Unicredit
3. Intesa
4. BNP Paribas
5. BBVA
6. RBS
8. SocGen
9. Barclays
10. Credit Agricole
11. Lloyds
12. KBC
13. Nordea
14. Danske
16. Erste
18. SHB
20. Swedbank
19. SEB
15. Commerzbank
17. DnB NOR
92.5
75,9
68,8
67,2
62,8
60,5
46,1
45,3
38,5
36,3
34,1
29,7
18,7
15,3
13,8
10,0
12,0
17,6
13,9
1. Santander
2. BBVA
3. Intesa
4. BNP Paribas
5. Unicredit
6. SocGen
7. RBS
8. Credit Agricole
10. Barclays
11. Nordea
12. Lloyds
13. KBC
14. SHB
15. Erste
17. Danske
20. Swedbank
19. DnB NOR
16. Commerzbank
18. SEB
54,0
32,4
31,8
27,6
23,3
20,9
20,1
17,8
13,2
13,0
11,1
7,6
7,1
5,1
4,9
3,1
3,7
5,1
3,8
1. Santander
2. BNP Paribas
3. BBVA
4. Intesa
5. Unicredit
6. Lloyds
7. SocGen
8. Barclays
10. Nordea
11. Credit Agricole
12. RBS
13. SHB
14. DnB NOR
15. Danske
17. Erste
19. Swedbank
20. Commerzbank
16. KBC
18. SEB
95,2
66,2
47,7
39,5
39,3
36,3
36,2
35,4
28,7
28,6
18,5
12,4
12,3
11,0
9,8
8,0
7,2
10,9
9,5
1. Santander
2. BNP Paribas
3. Lloyds
4. Barclays
6. BBVA
7. Nordea
8. SocGen
9. Unicredit
10. RBS
11. Intesa
12. Credit Agricole
13. DnB NOR
14. SHB
15. SEB
17. Erste
19. KBC
20. Commerzbank
16. Danske
18. Swedbank
66,0
57,0
52,2
37,2
34,0
32,8
30,0
29,9
26,7
25,7
22,8
17,1
14,9
13,6
13,3
9,1
7,0
13,4
12,1
1. Santander
2. BNP Paribas
3. BBVA
4. Deutsche
5. Barclays
7. Lloyds
6. Nordea
9. RBS
8. Intesa
11. SHB
10. SocGen
13. DNB
12. Unicredit
14. Swedbank
18. Commerzbank
16. SEB
20. KBC
15. Credit Agricole
17. Danske
19. Erste
50,3
36,7
32,8
24,2
25,7
27,3
21,3
13,4
14,3
12,7
21,0
12,3
12,4
11,6
6,7
5,3
3,5
9,9
9,1
10,9
5. Deutsche 36,3
9. Deutsche 30,89. Deutsche 16,0
7. Deutsche 47,0
2007 2008 2009 2010 2011
1. Santander
2. BNP Paribas
3. Nordea
4. BBVA
5. Lloyds
6. Barclays
7. Deutsche
9. Unicredit
8. SHB
11. RBS
10. Intesa
13. DNB
12. SocGen
14. Swedbank
18. Commerzbank
16. Danske
20. Erste
15. SEB
17. Credit Agricole
19. KBC
53,3
42,4
31,7
28,6
28,7
30,9
23,3
17,2
17,2
17,0
18,0
14,9
15,9
13,8
6,9
6,5
6,1
12,7
10,0
13,4
15th August 2012
Nordea’s position in the pulp and paper market
• Nordea is a large lender to the pulp & paper industry.
• One of the best platforms in the industry for success
• Nordea has a Pulp & Paper Expansion strategy to actively seek business
globally
• Most experienced team in the industry
• Global customer base leads to superior deal flows compared to other financial
players
• Nordea (Merita-Nordbanken) has been involved in the P&P derivatives market
since 1997, (i.e the start of pulp & paper derivatives market).
• The biggest financial participant in the world.
• Nordea is acting as a market-maker in the p&p derivatives market.
• Nordea has a risk mandate -> to take own risk positions.
5

• Introduction to Nordea Bank
• Why Price Risk Management?
• Pulp market outlook
6
PRICE RISK MANAGEMENT AS A MARGIN DRIVER
FOR THE PULP AND PAPER BUSINESS
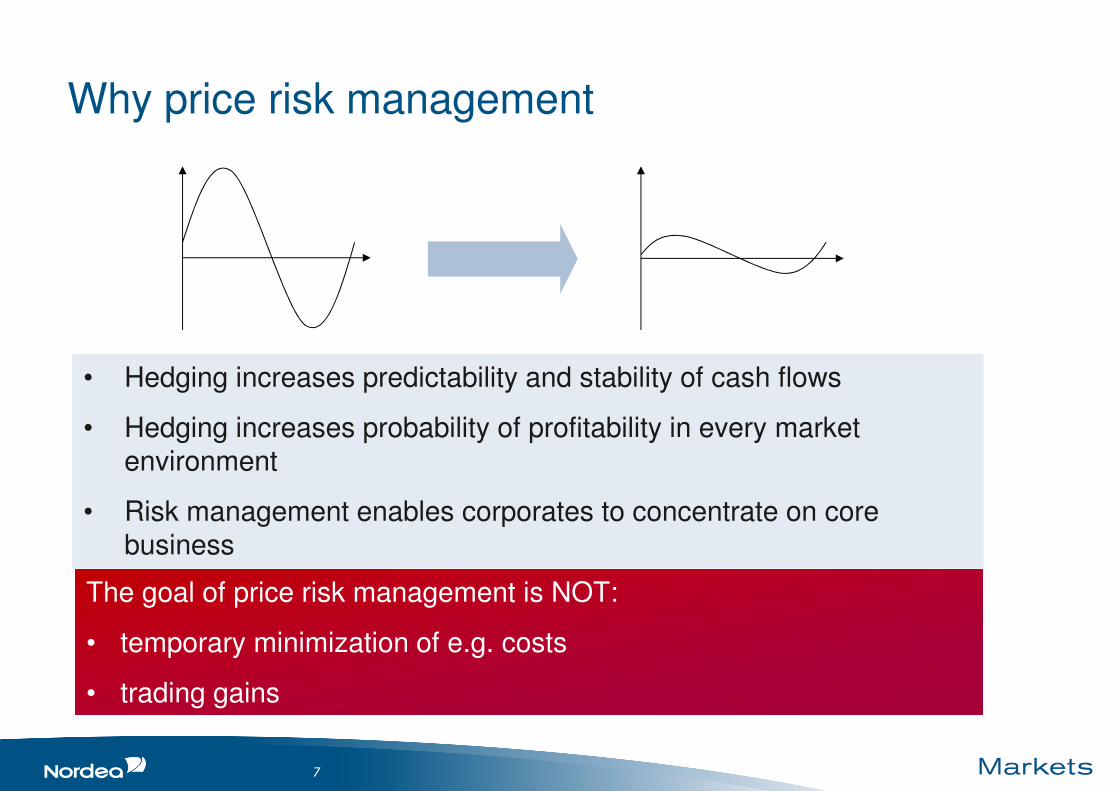
Why price risk management
7
• Hedging increases predictability and stability of cash flows
• Hedging increases probability of profitability in every market environment
• Risk management enables corporates to concentrate on corebusiness
• Hedging increases predictability and stability of cash flows
• Hedging increases probability of profitability in every market environment
• Risk management enables corporates to concentrate on corebusiness
The goal of price risk management is NOT:
• temporary minimization of e.g. costs
• trading gains
The goal of price risk management is NOT:
• temporary minimization of e.g. costs
• trading gains
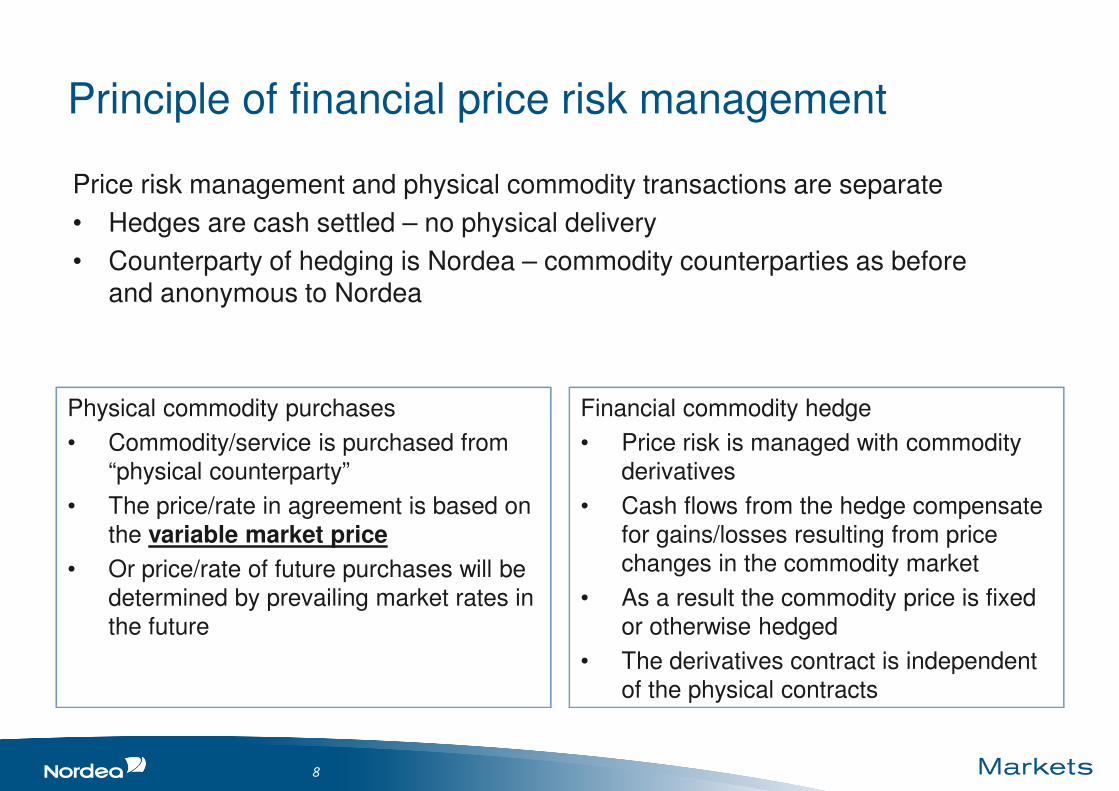
Principle of financial price risk management
Physical commodity purchases
• Commodity/service is purchased from “physical counterparty”
• The price/rate in agreement is based on the variable market price
• Or price/rate of future purchases will be determined by prevailing market rates in the future
Financial commodity hedge
• Price risk is managed with commodity derivatives
• Cash flows from the hedge compensate for gains/losses resulting from price changes in the commodity market
• As a result the commodity price is fixed or otherwise hedged
• The derivatives contract is independent of the physical contracts
8
Price risk management and physical commodity transactions are separate
• Hedges are cash settled – no physical delivery
• Counterparty of hedging is Nordea – commodity counterparties as before and anonymous to Nordea
9
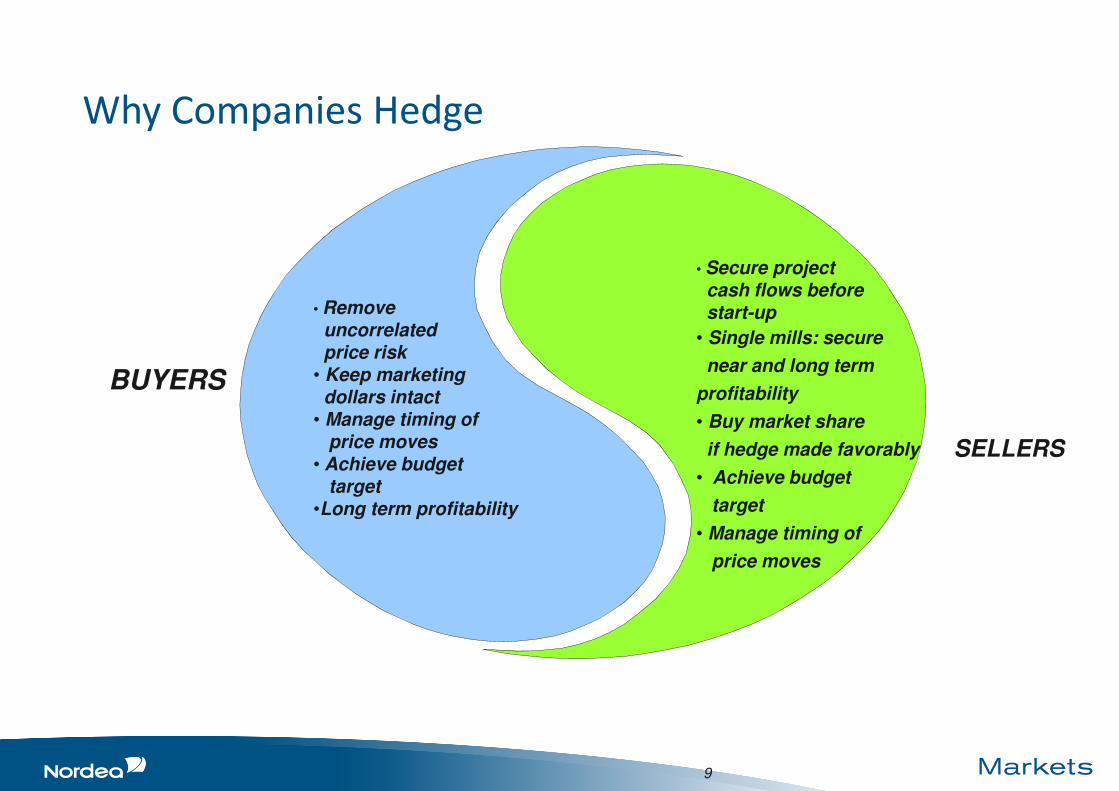
Why Companies Hedge
SELLERS
BUYERS
• Remove uncorrelated price risk
• Keep marketing dollars intact
• Manage timing of price moves
• Achieve budget target
•Long term profitability
• Secure projectcash flows before start-up
• Single mills: secure
near and long term
profitability
• Buy market share
if hedge made favorably
• Achieve budget
target
• Manage timing of
price moves
10
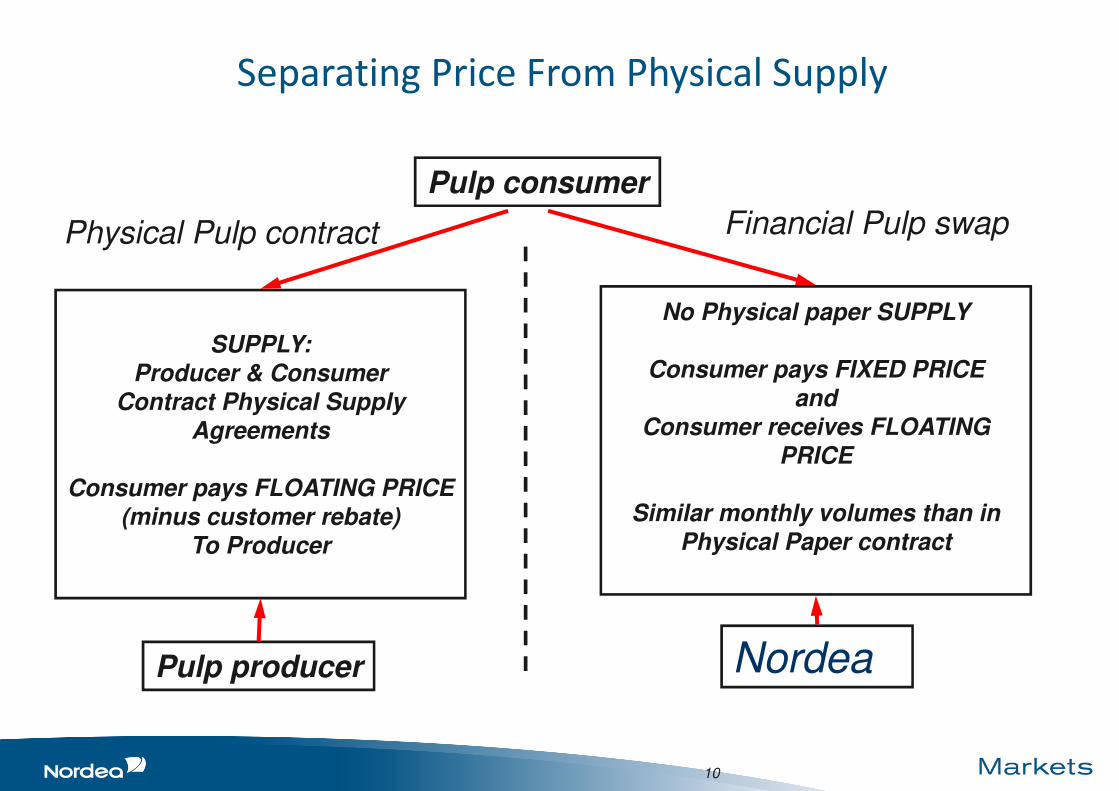
Separating Price From Physical Supply
Pulp consumer
Pulp producer
SUPPLY:
Producer & Consumer
Contract Physical Supply Agreements
Consumer pays FLOATING PRICE
(minus customer rebate)To Producer
No Physical paper SUPPLY
Consumer pays FIXED PRICE
and
Consumer receives FLOATING PRICE
Similar monthly volumes than in Physical Paper contract
Nordea
Physical Pulp contract Financial Pulp swap
11
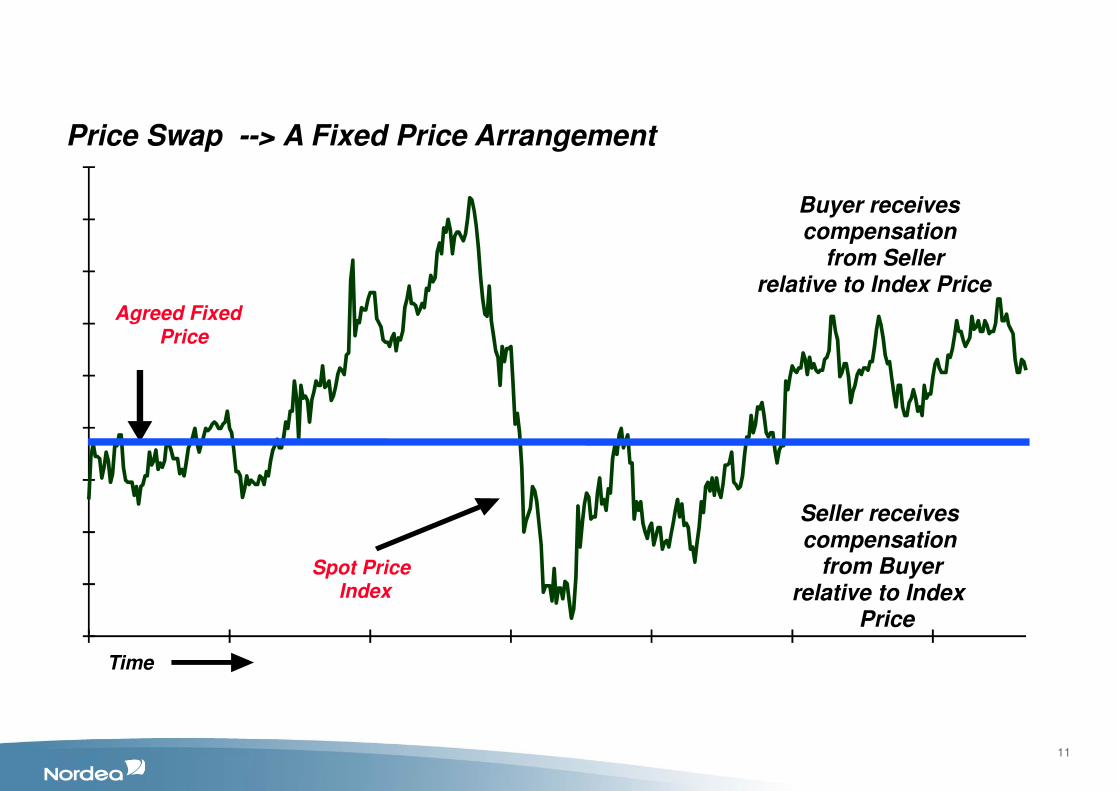
Spot PriceIndex
Agreed FixedPrice
Buyer receivescompensation
from Sellerrelative to Index Price
Seller receivescompensation
from Buyerrelative to Index
Price
Price Swap --> A Fixed Price Arrangement
Time
• Introduction to Nordea Bank
• Why Price Risk Management?
• Pulp market outlook
12
PRICE RISK MANAGEMENT AS A MARGIN DRIVER
FOR THE PULP AND PAPER BUSINESS
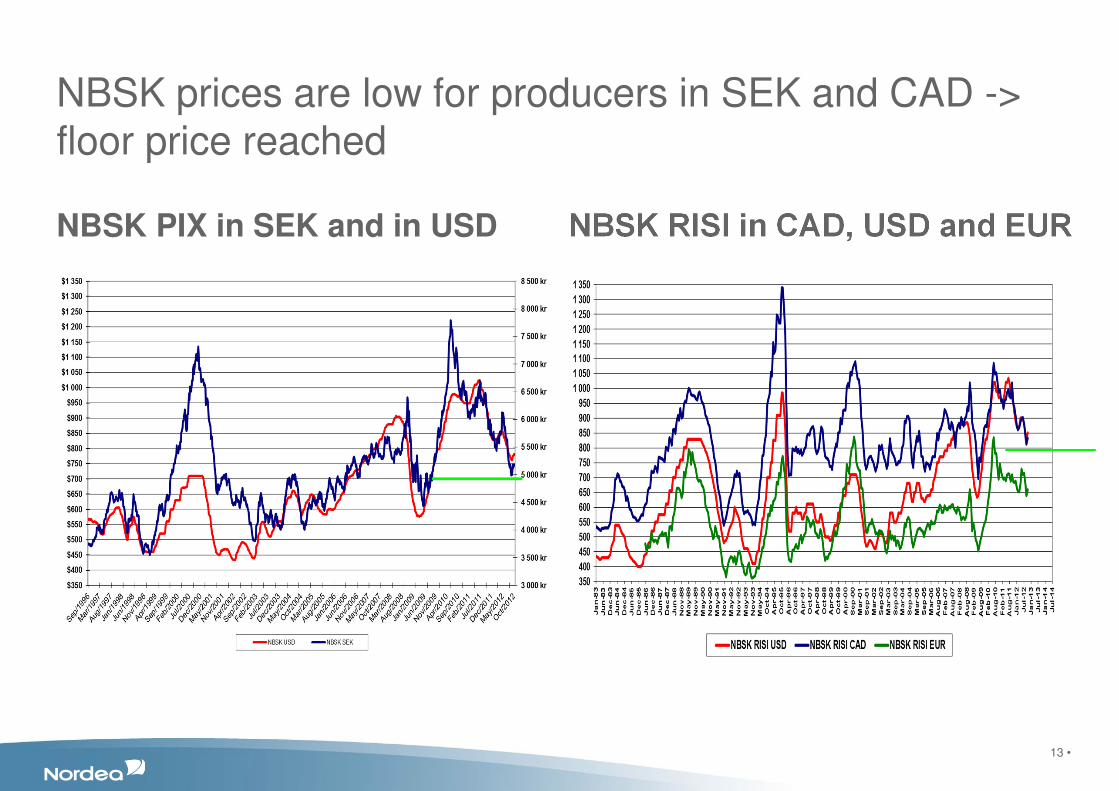
NBSK prices are low for producers in SEK and CAD -> floor price reached
NBSK PIX in SEK and in USD NBSK RISI in CAD, USD and EUR
13 •
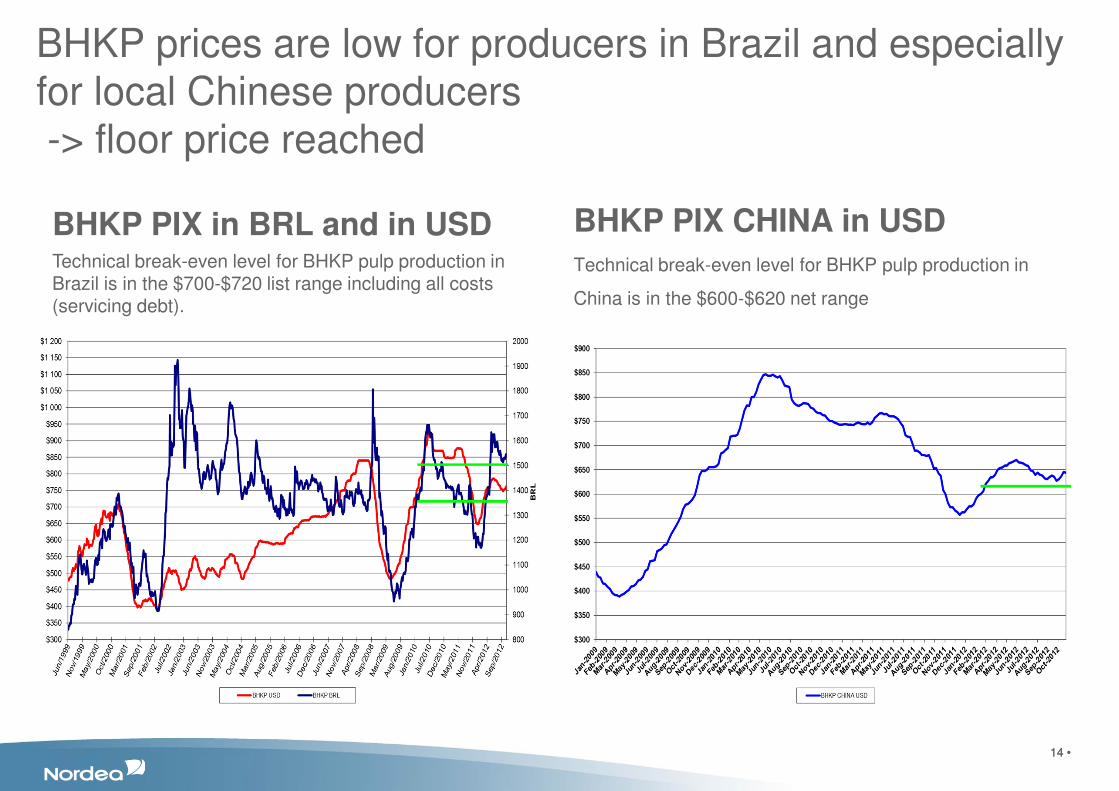
BHKP prices are low for producers in Brazil and especially for local Chinese producers-> floor price reached
14 • 14 •
BHKP PIX in BRL and in USDTechnical break-even level for BHKP pulp production in Brazil is in the $700-$720 list range including all costs (servicing debt).
BHKP PIX CHINA in USD
Technical break-even level for BHKP pulp production in
China is in the $600-$620 net range
15 •
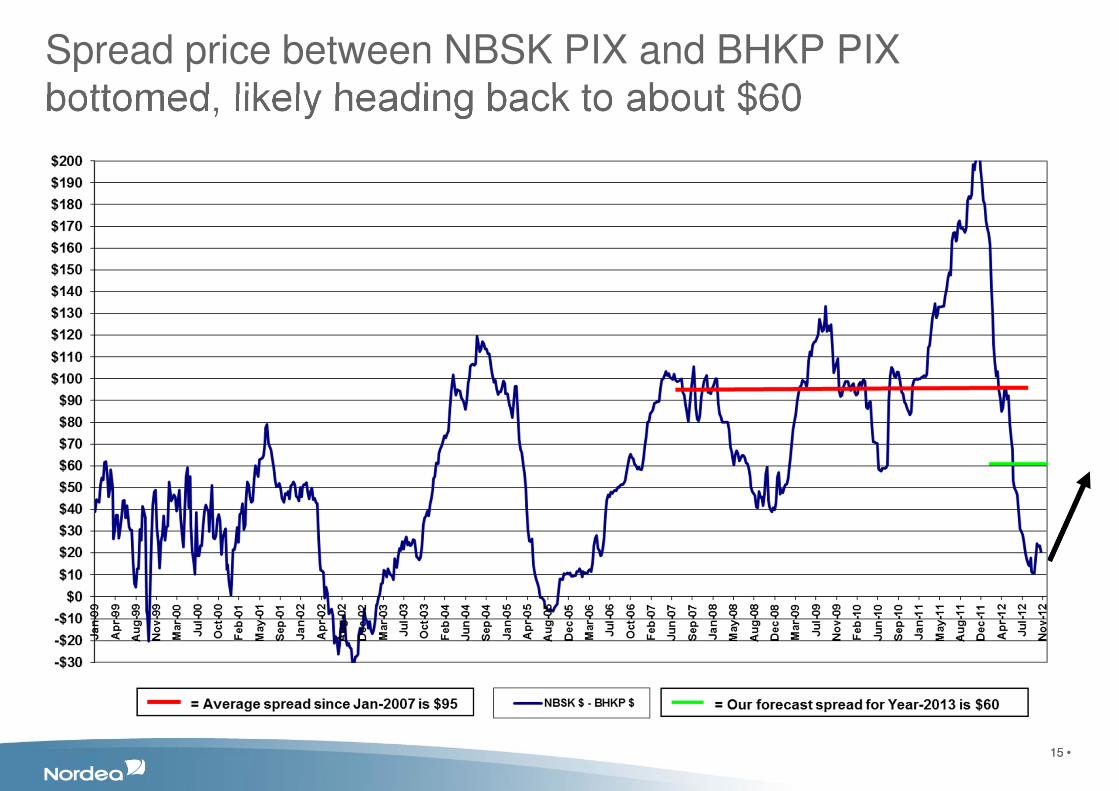
Spread price between NBSK PIX and BHKP PIX bottomed, likely heading back to about $60
15 •
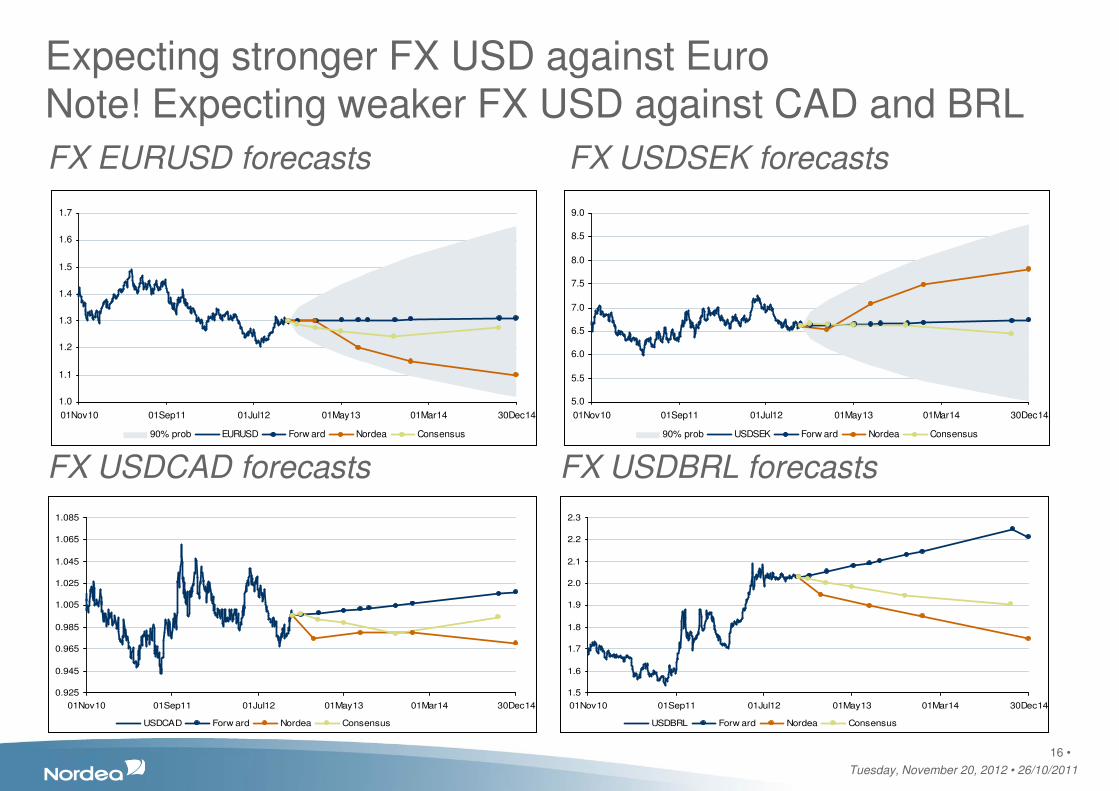
Expecting stronger FX USD against EuroNote! Expecting weaker FX USD against CAD and BRL
FX EURUSD forecasts FX USDSEK forecasts
Tuesday, November 20, 2012 • 26/10/2011
16 •
1.0
1.1
1.2
1.3
1.4
1.5
1.6
1.7
01Nov10 01Sep11 01Jul12 01May13 01Mar14 30Dec14
90% prob EURUSD Forw ard Nordea Consensus
5.0
5.5
6.0
6.5
7.0
7.5
8.0
8.5
9.0
01Nov10 01Sep11 01Jul12 01May13 01Mar14 30Dec14
90% prob USDSEK Forw ard Nordea Consensus
FX USDCAD forecasts
0.925
0.945
0.965
0.985
1.005
1.025
1.045
1.065
1.085
01Nov10 01Sep11 01Jul12 01May13 01Mar14 30Dec14
USDCAD Forw ard Nordea Consensus
FX USDBRL forecasts
1.5
1.6
1.7
1.8
1.9
2.0
2.1
2.2
2.3
01Nov10 01Sep11 01Jul12 01May13 01Mar14 30Dec14
USDBRL Forw ard Nordea Consensus
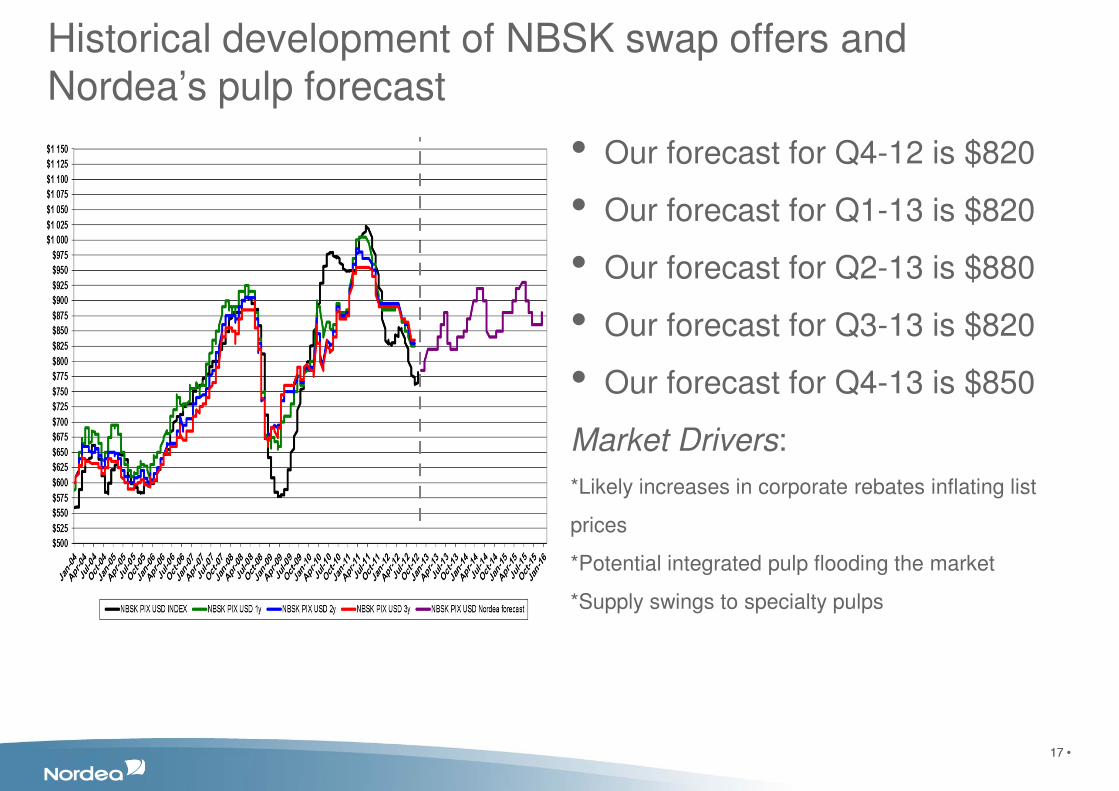
Historical development of NBSK swap offers andNordea’s pulp forecast
• Our forecast for Q4-12 is $820
• Our forecast for Q1-13 is $820
• Our forecast for Q2-13 is $880
• Our forecast for Q3-13 is $820
• Our forecast for Q4-13 is $850
Market Drivers:
*Likely increases in corporate rebates inflating list
prices
*Potential integrated pulp flooding the market
*Supply swings to specialty pulps
17 • 17 •
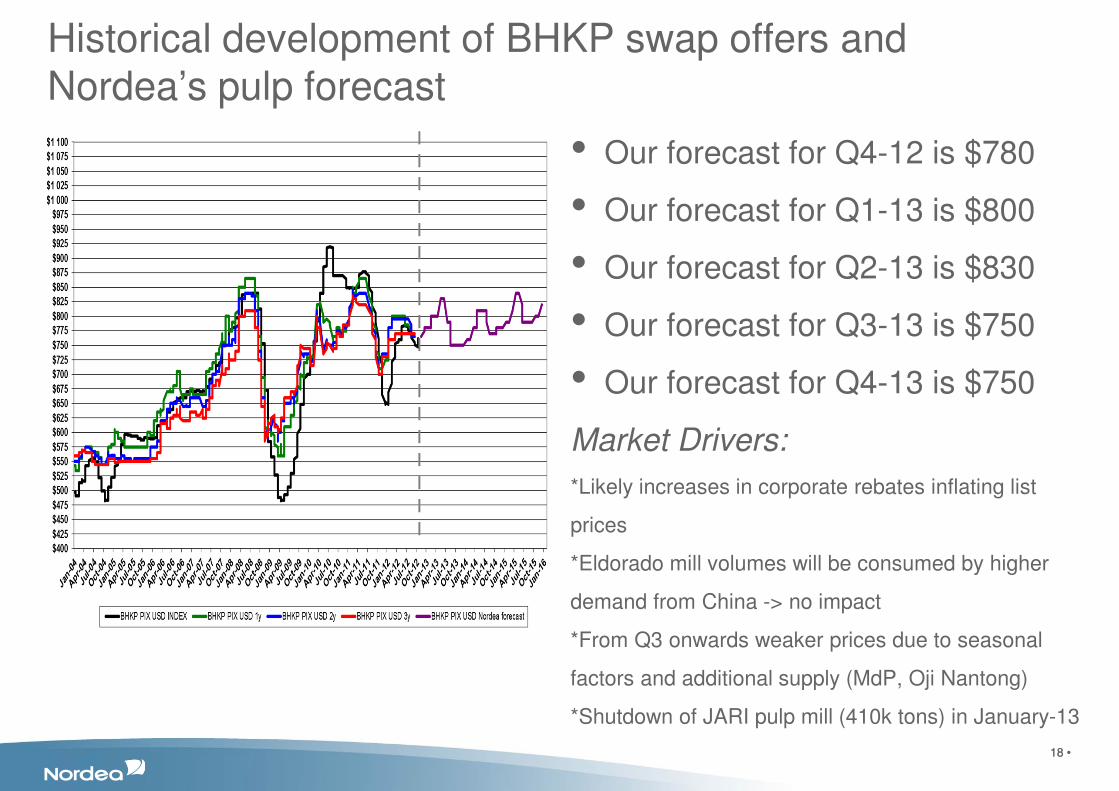
Historical development of BHKP swap offers andNordea’s pulp forecast
• Our forecast for Q4-12 is $780
• Our forecast for Q1-13 is $800
• Our forecast for Q2-13 is $830
• Our forecast for Q3-13 is $750
• Our forecast for Q4-13 is $750
Market Drivers:
*Likely increases in corporate rebates inflating list
prices
*Eldorado mill volumes will be consumed by higher
demand from China -> no impact
*From Q3 onwards weaker prices due to seasonal
factors and additional supply (MdP, Oji Nantong)
*Shutdown of JARI pulp mill (410k tons) in January-13
18 • 18 •
Key drivers for pulp prices in coming years:
• Discount inflation - How large will they be and how much can be compensated onto list prices?
• Economic inflation – Central Banks to expand their inflation targets to tackle sovereign debts?
• Cost inflation – Wood, labour, chemicals, energy, water, logistics, capital, taxation, insurance etc.
• Global Growth - Sustainable Asian - & other Emerging market growth? Declining growth in mature
economies?
• How will the FX USD perform in the next few years? Currency wars?
• What fate will certain P & W papers have in the mature markets – the same as newsprint?
• How many small domestic high cost pulp mill closures in China?
• How many of the new paper mills in China will be up and running according to scheduled start
up?
• New pulp mills impact on the supply / demand balance?
• How much realistic integrated capacity, can turn into single line pulp mills in N. America &
Europe?
19 •
Disclaimer
Nordea Markets is the name of the Markets departments of Nordea Bank Norge ASA, Nordea Bank AB (publ), Nordea Bank Finland Plc and Nordea Bank Danmark A/S.
The information provided herein is intended for background information only and for the sole use of the intended recipient. The views and other information provided herein are the current views of Nordea Markets as of the date of this document and are subject to change without notice. This notice is not an exhaustive description of the described product or the risks related to it, and it should not be relied on as such, nor is it a
substitute for the judgement of the recipient.
The information provided herein is not intended to constitute and does not constitute investment advice nor is the information intended as an offer or solicitation for the purchase or sale of any financial instrument. The information contained herein has no regard to the specific investment
objectives, the financial situation or particular needs of any particular recipient. Relevant and specific professional advice should always be obtained before making any investment or credit decision. It is important to note that past performance is not indicative of future results.
Nordea Markets is not and does not purport to be an adviser as to legal, taxation, accounting or regulatory matters in any jurisdiction.
This document may not be reproduced, distributed or published for any purpose without the prior written consent from Nordea Markets.