Embed Size (px)
Citation preview

Copyright © 2017 The New York Independent System Operator
Pricing Carbon into NYISO’s Wholesale
Energy Market
Study Overview and Summary of Findings
NYISO and DPS Conference
Sam Newell
Roger Lueken
Tony Lee
S e p tember 6 , 2 0 1 7
P RE S ENTED T O
P RE PARED BY

| brattle.com 1
Agenda for Today’s Presentation
▀ Study Purpose and Context
▀ Estimated Impacts of Carbon Pricing
− Emissions
− Economic Efficiency
− Customer Costs
▀ Market Design Issues to Resolve

| brattle.com 2
Study Purpose
NYISO commissioned The Brattle Group to explore whether and how New York State environmental policies could be pursued through the existing wholesale market structure.
▀ The study’s purpose is two-fold: − Assess market design options for carbon pricing
− Estimate how carbon pricing would affect market outcomes
▀ DPS and NYSERDA provided comments on methodology and accuracy of presentation
▀ This is the first step in a process involving NYISO, DPS, and stakeholders

| brattle.com 3
New York has Goals, Mandates, and Mechanisms to Substantially Reduce CO2 Emissions
State Energy Plan
▀ Reduce economy-wide greenhouse gas emissions 40% by 2030 and 80% by 2050, relative to 1990 levels
▀ 50% of electricity from renewables by 2030
Clean Energy Standard
▀ Renewable Energy Credits (RECs)
▀ Zero-Emission Credits (ZECs)
Numerous other policies
▀ Participation in the Regional Greenhouse Gas Initiative (RGGI)
▀ Reforming the Energy Vision
▀ Energy efficiency standards
▀ Governor’s proposal to eliminate coal-fired generation by 2020

| brattle.com 4
Carbon Pricing Could Harmonize NYISO Markets and State Policies
NYISO wholesale markets provide electricity reliably and cost effectively
However, markets are not aligned with state decarbonization goals
Carbon pricing could internalize environmental costs and foster competition to meet energy and environmental goals cost effectively:
▀ Shift commitment and dispatch within the existing fleet
▀ Tilt investment in renewable resources toward those that displace the most carbon
▀ Push any investment in fossil generation toward the lowest-emitting technologies
▀ Reward storage and demand response that reduce emissions
▀ Incentivize energy efficiency and conservation
▀ Spur other innovations

| brattle.com 5
Approaches to Implementing Carbon Price
Tighter RGGI caps
New York cap-and-trade
Carbon tax
Carbon charge (approach analyzed in this study)
▀ The Public Service Commission (NYPSC) sets the price
▀ NYISO adds a charge to resources’ costs
▀ Collected charges returned to customers

| brattle.com 6
Analysis Overview
How would a carbon charge affect carbon emissions, economic efficiency, and customer costs?
Analytical approach:
▀ 2025 snapshot
▀ Compare case with $40/ton carbon charge to case with CES and RGGI alone
▀ Spreadsheet model
Two analysis components:
▀ Static Analysis: Capture the direct effect of a carbon charge, assuming no change in operations or investment (affects energy prices, returned carbon charges, REC, ZEC, and TCC prices)
▀ Dynamic Analysis: Capture adjustments to operations and investment in response to the carbon charge
Extensive uncertainty analysis to test alternative assumptions

| brattle.com 7
Environmental and Economic Efficiency Gains
We evaluate four ways a carbon charge could reduce emissions
▀ Tilting investment in renewable resources toward those that displace the most carbon
▀ Pushing any new investment in traditional generation toward the lowest-emitting technologies
▀ Rewarding storage and demand response that reduce emissions
▀ Incentivizing energy efficiency and conservation
Note: we do not account for
▀ Dispatch switching in the existing fleet
▀ Innovative or idiosyncratic opportunities
Incremental Abatement Induced by $40/ton Carbon Charge
Tilting Renewable Investment
Supporting Investment in CCs
Incorporating Storage and DR
Incentivizing EE and Conservation

| brattle.com 8
Environmental and Economic Efficiency Gains
We estimate a carbon charge could plausibly reduce annual CO2 emissions by 2.6 million tons
These reductions could replace costlier measures to achieve the same CO2 reductions
For example, these reductions could avoid 6.3 TWh of REC purchases, reducing total annual economic costs by $120 million

| brattle.com 9
Impact on Customer Costs
How much of the economic gains are enjoyed by consumers vs. clean energy producers?
Do higher energy prices cause a wealth transfer from consumer to producers?
We estimate customer costs would not rise materially
▀ On net, average customer costs change between −$1.5/MWh to +$4.6/MWh around a central value of +$1.7/MWh
▀ This amounts to a −1% to +2% change in total customer electric bills
▀ Impacts could vary by zone, but the differences can largely be mitigated by targeted allocation of carbon revenues
| brattle.com 10
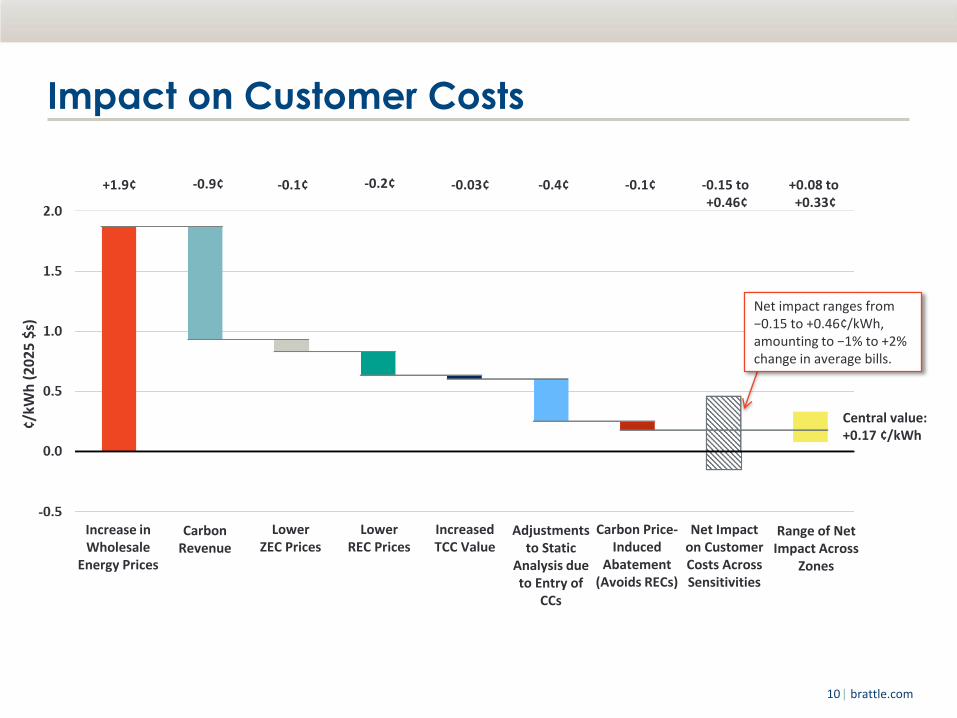
Impact on Customer Costs
+1.9¢ -0.9¢ -0.1¢ -0.2¢ -0.4¢ -0.1¢ -0.03¢
¢/kW
h (
20
25
$s)
-0.15 to +0.46¢
+0.08 to +0.33¢
Net impact ranges from −0.15 to +0.46¢/kWh, amounting to −1% to +2% change in average bills.
Central value: +0.17 ¢/kWh
Net Impact on Customer Costs Across Sensitivities
Range of Net Impact Across
Zones
Increase in Wholesale
Energy Prices
Carbon Revenue
Lower ZEC Prices
Lower REC Prices
Increased TCC Value
Carbon Price- Induced
Abatement (Avoids RECs)
Adjustments to Static
Analysis due to Entry of
CCs

| brattle.com 11
Effect of Major Sources of Uncertainty
Impact of $40/ton Carbon Charge on Customer Costs (¢/kWh)
Bottled Upstate Renewables Affects all components.
Net Additions from CC Entry Affects ZECs savings, savings from CC entry.
Peaker Displacement by CCs Affects savings from CC entry
Gas Prices Affects ZEC savings.
Base ZEC Price Affects ZEC savings.
REC Price Affects savings on avoided RECs.
Carbon Price-Induced Abatement Affects savings on avoided RECs.
Differentiated Border Charges Affects carbon revenues.
Marginal Emission Rates Affects all components.
5 TWh of Tier 2 RECs Affects REC savings.
2015 Prices ($3.8/MMBtu)
25% higher ($6.72/MMBtu)
$17.5/MWh (today's value)
$0/MWh
1,060 MW 0 MW with persistent low capacity prices
Twice as much abatement
Half as much abatement
REC price set by offshore wind ($41/MWh)
REC price at zero
0 HQ, 0.16 ON, 0.45 NE, 0.67 PJM
710 MW (33% discount, $105/kW-yr capacity price)
$5.4/MMBtu
Base: 0.47 tons/MWh
$5.7/MWh
$19/MWh
2.6 MMtons
Base Value
15% lower
Base: 0.47 ton/MWh
Additional 5 TWh of Tier 2 Renewables receive RECs
80% Lower Upstate MERs and MHR
Base: 17 TWh of Tier 1 renewables receive RECs
50% 100% displacement 0% displacement

| brattle.com 12
Establishing the Appropriate Carbon Price
What should the price be, and how should it change over time?
NYPSC could set price trajectory in various ways, based on:
▀ The adopted Social Cost of Carbon (SCC), as assumed in our study
▀ The level needed to achieve New York’s decarbonization goals

| brattle.com 13
Returning Charges to Customers
NYPSC, DPS, NYISO and stakeholders will need to design a mechanism to return charges from NYISO to customers
Several design questions:
▀ How revenues flow from NYISO to LSEs, then from LSEs to customers
▀ Allocation of revenues across customers in different LSEs
▀ Whether revenues are distributed in volumetric or fixed rebates

| brattle.com 14
Preventing Leakage with Border Adjustments
What is leakage?
▀ Import leakage
▀ Export leakage
Charging imports and crediting exports can prevent leakage
▀ Simple approach to eliminate the charge from traders’ perspectives
▀ More granular approaches, accounting for neighbors’ emission rates and carbon prices

| brattle.com 15
Interactions with Other NY Policies and Processes
Distributed energy resources and REV
Renewable Energy Credits
Interactions with RGGI
Effect on decarbonization efforts in other sectors
Other NYISO processes
▀ Capacity market
▀ Transmission planning
▀ Flexibility incentives

| brattle.com 16
Conclusions
Straightforward and economically efficient way to harmonize state goals with markets
Would improve the economic efficiency of meeting the state’s energy and environmental goals
Customer costs would not rise materially, although more economic gains would flow to producers than consumers
Several market design areas for further discussion

| brattle.com 17
Appendix

| brattle.com 18
2025 Major Inputs and Assumptions
Reasonable assumptions were made, mostly based on public sources (DPS, EIA, NYISO).
Supply and Demand
▀ Load: Falls from 162 TWh in 2015 to 157 TWh.
▀ Generation: Fossil generation falls to 59 TWh, a 9% decrease from 2015.
− Net imports, hydro, and other generation are unchanged from 2015, at 19, 26 , and 3 TWh.
− Nuclear generation falls 16 TWh (to 28 TWh) due to Indian Point’s planned retirement. This is more than offset by 18 TWh of new renewable generation (on top of about 5 TWh existing).
− Remaining coal retires and 1,750 MW of planned CCs (CPV Valley and Cricket Valley) enter the market.
Wholesale Prices
▀ Energy Prices: We adjust 2015 prices for higher natural gas prices and RGGI prices.
− The fuel component of offers rises by 84% due to higher upstate gas prices ($5.4/MMBtu in 2025).
− RGGI prices rise from $6/ton in 2015 to $17.4/ton.
− NYCA-wide load-weighted average LBMP rises from $38.4/MWh to $72.2/MWh.
▀ Capacity Prices: Adopt DPS’s forecast: NYCA rises from $35/kW-yr in 2015 to $105/kW-yr by 2025.
▀ These increases reduce base ZEC prices, which limits price relief accompanying a carbon charge.
Carbon Emissions
▀ Internal emissions fall 14% to 29 million tons due to less (and more efficient) fossil generation.

| brattle.com 19
Customer Cost Analysis Details
Increase in Wholesale Energy Prices
▀ A CO2 charge increases energy prices.
▀ Adder = MER x $40/ton carbon charge.
▀ Across zones, wholesale energy prices increase by $17 - $20/MWh, with larger increases Downstate, where marginal emission rates are higher.
Zonal Variation in Wholesale Energy Price Increase Due to $40/ton Carbon Charge
Source: Marginal emission rates determined using 5-minute marginal fuel data provided by NYISO
Zone
Load-Weighted
Average MER
(tons/MWh)
Increase in
Wholesale
Energy Prices
($/MWh)
A 0.43 $17.4
B 0.44 $17.5
C 0.43 $17.2
D 0.42 $16.7
E 0.43 $17.3
F 0.48 $19.2
G 0.48 $19.3
H 0.48 $19.3
I 0.48 $19.2
J 0.48 $19.4
K 0.50 $20.1
NYCA 0.47 $18.8

| brattle.com 20
Customer Cost Analysis Details
Refund of Carbon Revenues to Customers
▀ NYISO collects carbon charges from all internal fossil generation and imports (less credits for exports reducing external emissions), at each resource’s emissions rate × the carbon price.
▀ We assume all collected charges are refunded to customers to offset the increase in energy prices.
▀ We evaluate two approaches to allocating refunds:
− By load ratio share: All zones receive the same carbon refund per MWh of load.
− Targeted by zone to minimize zonal variation in the carbon charge’s net impact on customer costs.
▀ Load ratio share allocation results in a $2.6/MWh range in net impacts in customer costs across zones
− Largest impacts on Zone F, due to increase in wholesale prices similar to that of Downstate zones, and proportionately fewer capacity savings from CC entry (outside of the G-J locality).
▀ Targeted allocation can eliminate the zonal variation, with all zones experiencing a $1.7/MWh impact on customer costs
Returned Carbon Charges Load Ratio Share
Source & Notes: Carbon revenues from Brattle analysis. Zonal loads forecast from 2016 Goldbook.
Zone
Carbon
Revenue
Refunds
Estimated
Change in
Customer
Costs
($/MWh) ($/MWh)
A $9.4 $1.5
B $9.4 $1.6
C $9.4 $1.4
D $9.4 $0.8
E $9.4 $1.4
F $9.4 $3.3
G $9.4 $0.8
H $9.4 $0.9
I $9.4 $0.8
J $9.4 $2.2
K $9.4 $1.4
NYCA $9.4 $1.7

| brattle.com 21
Customer Cost Analysis Details
Lower ZEC and REC Prices
▀ Assume that a $1 higher energy price (w/carbon charge) can reduce ZEC and REC prices by $1 (but not below $0).
▀ This value to customers is equal across zones on a $/MWh basis, as ZEC and REC requirements apply to load uniformly.
Capacity Payment
Energy Payment
ZEC Price*
2025 Payments to Upstate Nuclear 2025 Payments to Tier 1 Renewables (Wind)
* At $5.7/MWh, 2025 ZEC prices are lower than 2015 prices of $17/MWh due to rising gas prices and capacity prices, even though the SCC (in the ZEC formula) is rising.
Pay
men
ts t
o U
pst
ate
Nu
clea
r ($
/MW
h)
Pay
men
ts t
o T
ier
1 W
ind
($
/MW
h)
2025 Effective Benchmark for ZECs
Capacity Payment
Energy Payment
REC Price
2025 Onshore Wind LCOE
$34 $19

| brattle.com 22
Customer Cost Analysis Details
Increased TCC Value
▀ A carbon charge may increase congestion costs by increasing price spreads across constraints.
▀ This represents a benefit to customers who have rights to TCC auction revenues.
▀ We approximate increase congestion costs across Central East (between zones E & F).
− Central East accounted for 50% of all NYISO congestion in 2015.
− Increased congestion revenue = 0.05 ton/MWh spread across CE × $40/ton × 2,500 MW × 8760 hours = $44m/yr.
− We conservatively do not count increased TCC value on any other constraints.
▀ We assume this effect is equal across zones on a $/MWh basis, i.e. $44m/yr divided by 157 TWh NYCA load = $0.3/MWh.

| brattle.com 23
Customer Cost Analysis Details
Energy Revenue Flow Schematic
Δ Energy Price
w/Carbon Charge
Average NYISO Load
Supply Curve Showing only the carbon component of costs
Carbon Charges Returned to Customers
$19/MWh
ZECs
RECs
Net Increase In Customer Costs is only 30% of ΔP x Q before accounting for additional 23% savings from dynamic effects
Quantity (MWh) 17,900 MWh
Net revenues to existing clean energy
Net Increase in Customer Costs Before Accounting For Dynamic Effects
Imports assessed carbon adder
Net revenues to efficient fossil

| brattle.com 24
Customer Cost Analysis Details
Dynamic Adjustments to Static Analysis due to the Entry of CCs
▀ A carbon charge rewards the relative efficiency of CCs. Enhanced net energy revenue attracts CC entry until energy and capacity prices fall and re-equilibrate, such that new CCs earn no more than CONE overall .
− Lower capacity prices because CCs can submit offers at a lower Net CONE. As CCs enter and capacity prices decline, peaking capacity may exit or decide not to enter. We assume that half a MW peaking capacity is displaced for each MW of CC entry.
− Lower energy prices because CC entry shifts supply stack outwards. We estimate energy price reduction based on previous study result that adding 720 MW CC in Zone G would reduce energy prices by ~1%, all else equal.
▀ Assumption: discount the amount of CC entry and resulting price effects by 1/3 since CCs could be uneconomic in a future with prolonged surplus and/or hesitation to build fossil plants in a market aiming for 80% decarbonization by 2050.
▀ Impacts on static analysis: re-equilibrated lower prices benefit customers but slightly reduce REC price savings associated with a carbon charge . ZEC prices unaffected, remaining zero after adjustments.
▀ This effect varies across zones depending on the static increase in energy revenues to a CC in a zone, the amount of CC entry affecting capacity and energy prices, and the load factor (for translating $/kW-yr to $/MWh).

| brattle.com 25
Customer Cost Analysis Details
Carbon-Price-Induced Abatement
▀ A carbon charge will induce low-cost abatement that the CES alone would miss.
▀ We estimate the quantity of carbon price-induced abatement across four factors, which in total reduce CO₂ emissions by 2.6 million tons, by:
− Tilting Renewable Energy Investment (0.8 million tons): A carbon charge rewards renewables that offset more carbon and thus may tilt investment toward better-sited and better types of renewables for reducing carbon. We estimate how shifting 2,000 MW of wind could increase emission reductions.
− Supporting Investment in CCs (0.5 million tons): A carbon price could attract investment from relatively low-emitting combined cycle units, offsetting generation from higher heat rate plants. We estimate 700 MW of new combined cycle generation would be attracted.
− Incorporating Storage and DR (0.1 million tons): Carbon pricing accentuates price signals for storage and demand response to displace high-emitting fossil generation by arbitraging between hours with high and low emission rates. We estimate the abatement impact assuming 500 MW of storage capacity in Zone J.
− Incentivizing Energy Efficiency and Conservation (1.2 million tons): A carbon charge may encourage large commercial and industrial customers (1/3 of load) to pursue increased energy efficiency and conservation if it raises their per-kWh rates. We estimate that a $40/ton carbon charges could raise their energy rates by 16%, leading to a 2.5 TWh reduction in load (5% of large C&I load). We assume carbon charges and capacity savings are refunded through non-volumetric rates.
▀ This can either achieve lower overall emissions (an 9% reduction from 2025 emissions under CES alone) or save money by reducing the need for other, more costly carbon reduction actions to meet fixed goals (which we value using the price of RECs as a proxy).
▀ We assume this effect is equal across zones on a $/MWh basis.

| brattle.com 26
NYCA
Average Zone A Zone B Zone C Zone D Zone E Zone F Zone G Zone H Zone I Zone J Zone K
STATIC ANALYSIS
I. Increase in Wholesale Energy Prices 18.8 17.4 17.5 17.2 16.7 17.3 19.2 19.3 19.3 19.2 19.4 20.1
II. CO2 Revenue - (A) Allocate by Load Share -9.4 -9.4 -9.4 -9.4 -9.4 -9.4 -9.4 -9.4 -9.4 -9.4 -9.4 -9.4
II. CO2 Revenue - (B) Allocate to Equalize Zonal Impact -9.4 -9.2 -9.3 -9.0 -8.5 -9.1 -11.0 -8.5 -8.5 -8.5 -9.9 -9.1
III. Lower ZEC Prices -1.0 -1.0 -1.0 -1.0 -1.0 -1.0 -1.0 -1.0 -1.0 -1.0 -1.0 -1.0
IV. Lower REC Prices -2.0 -2.0 -2.0 -2.0 -2.0 -2.0 -2.0 -2.0 -2.0 -2.0 -2.0 -2.0
V. Increased TCC Value -0.3 -0.3 -0.3 -0.3 -0.3 -0.3 -0.3 -0.3 -0.3 -0.3 -0.3 -0.3
Subtotal (A) 6.0 4.7 4.8 4.5 4.0 4.6 6.5 6.6 6.6 6.5 6.7 7.4
Subtotal (B) 6.0 4.9 4.9 4.9 4.9 4.9 4.9 7.5 7.5 7.5 6.2 7.7
DYNAMIC ANALYSIS
VI. Adjustments to Static Analysis due to Entry of CCs -3.5 -2.4 -2.4 -2.4 -2.4 -2.4 -2.4 -5.0 -5.0 -5.0 -3.7 -5.2
VII. Carbon Price-Induced Abatement -0.8 -0.8 -0.8 -0.8 -0.8 -0.8 -0.8 -0.8 -0.8 -0.8 -0.8 -0.8
Total Net Change in Customer Costs (A) 1.7 1.5 1.6 1.4 0.8 1.4 3.3 0.8 0.9 0.8 2.2 1.4
Total Net Change in Customer Costs (B) 1.7 1.7 1.7 1.7 1.7 1.7 1.7 1.7 1.7 1.7 1.7 1.7
Customer Cost Analysis Details
Net Impacts on Customer Costs Across Zones
Average NYCA net customer cost impact is +$1.7/MWh (0.9% change in bills).
▀ Zonal cost impacts range from +$0.8 to +$3.3/MWh (0.4% to 1.7% change in bills) when carbon revenues allocated by load share.
▀ Zonal variations can be eliminated by targeted allocation of carbon revenues.
Customer Cost Impact of $40/ton Carbon Charge By Zone and By Component ($/MWh)
No change across zones (allocated on load-share)
Varies due to zonal differences in MERs
Varies due to zonal differences in load factor and CC energy revenues

| brattle.com 27
Upstate Renewable Additions
Upstate Average and Marginal Fuel Mix
Upstate generation is already mostly clean on average, but not necessarily on the margin.
▀ While fossil only accounts for 12% of Upstate generation on average, fossil is the marginal fuel type for Upstate zones in 54% of intervals (often from Downstate fossil plants).
▀ While hydro is zero-emitting, output can be traded off against fossil generation within an interval, while also storing more or less to displace more or less fossil in other hours. When marginal, hydro may set energy prices based on at its opportunity costs, which may include the effect of the carbon charge on competing fossil plants.
2016 Upstate Average Fuel Mix Fossil generation varies from 0% - 34% (12% on average) of hourly
average fuel mix.
2016 Upstate Average vs. Marginal Fuel Mix Fossil makes up 12% of average Upstate generation, but is the
marginal fuel Upstate in 54% of intervals.
Nuclear
Hydro
Fossil
Wind & Other Renewables Wind & Other Renewables, 2%
Source: 5-minute generation mix data by zone, provided by NYISO. Source: 2017 Power Trends and 5-minute marginal fuel data provided by NYISO.
Marginal Fuel Mix Average Fuel Mix Wind & Other Renewables, 8%

| brattle.com 28
Upstate Renewable Additions
Upstate Wind vs. Downstate Wind Additions and Transmission
▀ At current Upstate MER (0.41 tons/MWh), Upstate wind is a more cost effective way to reduce CO2 emissions than Downstate offshore wind.
▀ As the Upstate MER falls, Upstate wind will become less cost effective.
− Analysis suggests Downstate offshore wind ($150/MWh LCOE) is more cost effective than Upstate wind if the Upstate MER falls below 0.36 (wind on the margin ~17% of hours).
− Even with very high offshore wind LCOE of $250/MWh it is more cost effective than Upstate wind if Upstate MER falls below 0.19 (wind on the margin 45% of hours).
▀ Similarly, adding new transmission becomes increasingly cost effective as Upstate MERs and LBMPs fall; we estimate that new transmission is cost-effective when Upstate MERs fall below 0.35 tons/MWh.
Notes: For Upstate Onshore Wind, we assume constant capacity revenues, and energy revenues decrease proportional to MER. For offshore wind, we assume in the case with decreasing downstate MERs that the MERs decrease at half the rate of upstate MERs.
Relative Cost of Reducing Emissions with Upstate and Downstate Wind
Upstate Wind ($95/MWh LCOE)
0.36
2015 Upstate MER
0.25
0.19
80% Lower MER Case
Offshore Wind $150/MWh LCOE (per DPS Cost Study)
Offshore Wind $200/MWh LCOE (High Estimate)
Offshore Wind $250/MWh LCOE (Very High Estimate)

| brattle.com 29
Presenter Information
SAM NEWELL Principal │ The Brattle Group, Boston, MA
+1.617.864.7900
Dr. Samuel Newell, a Principal of The Brattle Group, is an economist and engineer with experience in electricity wholesale markets, the transmission system, and RTO/ISO rules. He supports clients throughout the U.S. in regulatory, litigation, and business strategy matters involving wholesale market design, generation asset valuation, transmission development, integrated resource planning, demand response programs, and contract disputes. He has provided testimony before the FERC, state regulatory commissions, and the American Arbitration Association. Dr. Newell earned a Ph.D. in Technology Management and Policy from MIT, and a M.S. in Materials Science and Engineering from Stanford University. Prior to joining Brattle, Dr. Newell was Director of the Transmission Service at Cambridge Energy Research Associates.
The views expressed in this presentation are strictly those of the presenter(s) and do not necessarily state or reflect the views of The Brattle Group.

| brattle.com 30
About The Brattle Group
The Brattle Group provides consulting and expert testimony in economics, finance, and regulation to corporations, law firms, and governmental agencies worldwide.
We combine in-depth industry experience and rigorous analyses to help clients answer complex economic and financial questions in litigation and regulation, develop strategies for changing markets, and make critical business decisions.
Our services to the electric power industry include:
▀ Climate Change Policy and Planning
▀ Cost of Capital
▀ Demand Forecasting Methodology
▀ Demand Response and Energy Efficiency
▀ Electricity Market Modeling
▀ Energy Asset Valuation
▀ Energy Contract Litigation
▀ Environmental Compliance
▀ Fuel and Power Procurement
▀ Incentive Regulation
▀ Rate Design and Cost Allocation
▀ Regulatory Strategy and Litigation Support
▀ Renewables
▀ Resource Planning
▀ Retail Access and Restructuring
▀ Risk Management
▀ Market-Based Rates
▀ Market Design and Competitive Analysis
▀ Mergers and Acquisitions
▀ Transmission

| brattle.com 31
Offices
BOSTON NEW YORK SAN FRANCISCO
WASHINGTON, DC TORONTO LONDON
MADRID ROME SYDNEY