Embed Size (px)
Citation preview

1
Pricing Practices in Indonesia’s Electricity Power Services
Yose Rizal Damuri Head of the Department of Economics, Centre for Strategic and International Studies (CSIS) - This Policy Research Paper was prepared for the Indonesia Services Dialogue under the USAID-SEADI project.
Introduction
Indonesian electric power sector has been struggling to meet the increasing demand of
electric power. With an average economic annual growth of 6% and growing population,
Indonesia has been experiencing power crisis for around a decade. During the first decade of
the new millennium, the demand was estimated to grow around 6.5% per year1 , while the
industry only managed to increase its capacity by less than 6% annually. As a result, electric
power coverage and utilization is still very low compare to other countries as Figure 1
described.
Figure 1. Indonesia’s Electrification Ratio and per-capita Consumption 2011
Source: StatistikPLN 2011, compiled by the author
1 Muchlis, M. and Adhi Darma Permana (2006), “Proyeksi Kebutuhan Listrik PLN di Indonesia
Tahun 2003 s.d. 2020”, in Lubis, A.B. and Martin Djamin (Eds), Pengembangan Sistem
Kelistrikan Nasional Dalam Menunjang Pembangunan Nasional Jangka Panjang. Pusat
Pengkajian Dan Penerapan Teknologi Konversi Dan Konservasi Energi, BPPT, Jakarta.
The national coverage of electricity power services is 70%; the western part of the archipelago
electrification ratio of higher than 70%, but the eastern part has electrification ratio below 40%. The
average consumption is around 655 kWh for the country, but some provinces consume less than 300
kWh, particularly in the eastern part of the archipelago. While the condition has improved, the
demand will remain high with a new projection of 10.1% growth per annum for the period of
2008-20272. This situation is likely to put Indonesia’s economic development in jeopardy.
There are three areas of problem that need to be addressed by adopting more market-
friendly regulations in Indonesia’s electricity sector. The first is the current industrial structure
and arrangement that is supportive to the development of infrastructure and delivery of quality
electricity service. The second is the absence of effective regulatory arrangement and legal
framework. The third problem relates to the financing of operation. The current tariff structure
neglects cost-recovery and economic principles. This policy has lead to severe fiscal problems
and lack of incentive to adopt new and efficient technologies, along with low participation from
the private sector.
This paper focuses on the third problem; namely the tariff structure that is not
economically sustainable. Before examining the cost and tariff structure, an overview of
Indonesia’s electricity industry is briefly explored to provide background on the industry’s
situation. It is followed by a discussion on the current regulatory framework of the industry.
The cost structure of Indonesia’s electricity services is examined together with price-setting
practice and government subsidy. The paper is concluded with a discussion on pricing policy
options.
Current Industry Structure
The activities within the electricity industry are categorized into three: generation of
power, transmission of power and distribution and sale. These activities are different yet
related. The former Law Number 15 Year 1985 on Electricity regulated that the electricity
supply in Indonesia was conducted by the state through Perusahaan Listrik Negara (PLN), the
state-owned electricity utility. Private sector was given the opportunity operate power plan for
the intention of selling it to PLN. The new 2009 Law preserves such arrangement, although
2 Kementerian Energi dan Sumber Daya Manusia, Rencana Umum Ketenagalistrikan Nasional
2012-2031.
3
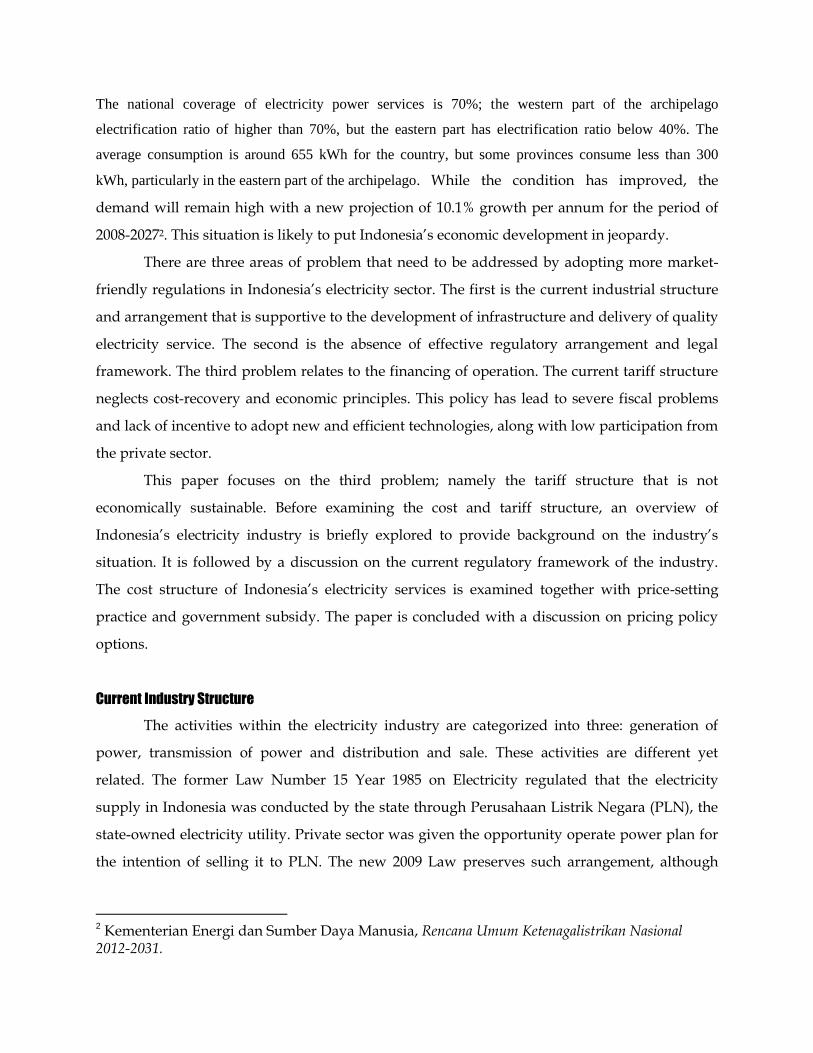
provide bigger opportunity to private sector. Figure 2 shows the structure of Indonesia’s electric
power services.
The electrical power generation sub-sector has been partially liberalized since early
1990s when the government invited private investors to participate in the power sector by
operating large-scale independent power producers (IPPs). However, those IPPs are only
allowed to sell their services to PLN based on specific power purchase agreement (PPA)
specifying the amount and agreed selling prices of the services for certain period. The contract
is normally awarded through competitive bidding, or whenever possible through direct
appointment. In addition, there are also smaller power plants operating for limited areas or for
self-purpose known as private power utilities (PPU). Around 78% of national installed capacity
belongs to PLN, while 16% of the capacity is controlled by the IPPs.
Figure 2. Structure of Indonesia’s Electric Power Services
Currently, there are 28 IPPs are in operation supplying electric power to PLN under
long term contracts of 20 - 30 years. The biggest private power is supplied by Paiton project I
and II under management of PT Paiton Energy and PT Jawa Power. Those coal-based power
plants maintain total capacity of 2450 MW, more than 45% of IPP’s capacities, while supplying
5% of 2011 total power output. In the future it is expected that IPPs would play important role
in meeting the country’s ever increasing electricity demand. There are 16 other plants with more
Private Power Utilities
than 4000 MW capacity to start operation within one or two years.3 However, past experiences
show that many private projects face various major problems especially in investment financing
and purchasing agreement, which may postpone and even cancel the future operation.
Transmission, distribution and selling activities are controlled solely by PLN except for
small networks servicing limited areas. The 1985 law did not permit private sector participation
in distributing and selling the energy. Under this law, PLN was the sole owner of national
transmission and distribution assets, and the only entity in charge of using the facilities. Except
for several small closed private electric networks normally operates in industrial areas, PLN is
virtually the sole supplier of electricity by producing or buying power, transmitting,
distributing and selling the services to consumers.
Private sectors that had intention to sell their produced power were required to develop
and build their own closed off-grid networks. Those companies hold a special license that
allows each company to generate electricity and only sell the services to limited number of
consumers. Most of them are industrial estate and building managements, hospitals, schools
and others. Some cooperatives and local government agencies also operate in the areas
uncovered by PLN’s services.
Recent Development in Regulatory Framework
In September 2002, the Government of Indonesia enacted Law No. 20 on Electricity
replacing the old law No. 15/1985. The new law is intended to introduce reform to the
electricity industry from previously monopolistic structure into a limited competitive market
within a five-year time frame. Three main activities (generation, transformation and
distribution), that were previously integrated under the control of PLN, were unbundled,
allowing for private investors’ participation in each activity. The government expected better
financing for the development of power services. Unfortunately in December 2004, Indonesia’s
constitutional court annulled the two year-old electricity law on the ground that it violates the
constitution by giving up control of the electricity service market to the private sector4.
Automatically, the old 1985 law was again in effect, canceling all reform attempts set in the
already annulled law.
3 Perusahaan Listrik Negara, Laporan Tahunan 2012
4 Purra, M.,“Institutional and Regulatory Reform in the Indonesian Electricity Sector : Opportunity or Risk
to FDI?”, Lee Kuan Yew School of Public Policy Working Paper Series WP SPP10-13. 2010

5
An important recent change on the regulatory framework was the passing of Law No.
30/2009, which is intended to complement other recent policies and actions in improving the
industry condition, and help the government in achieving its social and environmental goals.
The new law can be seen to be an improvement from the previous 1985 law, although carries
less reform and liberalization spirits than the annulled the 2001 law. In essence, electric power
services are still controlled by the government; however, the supply may be conducted by either
the central or regional governments through PLN, or regionally owned utilities. The largest
change in the new electricity law is that it promotes more actively participation by private
sectors (IPPs) including in retail selling of the power.
Table 1 summarizes several important aspects of the new law with regard to the
industry reform attempts. The law stipulates that private investors are now able to sell directly
to the end user as long as it operates in the area not being served by PLN. It also give more
power to the regional authorities in awarding licenses for private electricity projects or to set-up
large scale local government companies to provide electricity services.
Table 1. Key Points of Law No. 30/2009
Actors Conditions and responsibilities PLN Market conditions
- “First right of refusal”: PLN has the first right in for electricity supply in Indonesia - Not unbundled - Monopolist in the existing transmission and distribution grid, Systems operator - No longer monopolist in generation: Corporate bodies, cooperatives and self-supporting communities are for the first time allowed to participate in the supply of electrical power to end-users Responsibilities - “Obligation to serve”: Appointed by law to serve areas where no private interest has been shown - Obliged to purchase electricity generated from smaller than 10 MW renewable power plants
Regional Authorities
Market conditions - Private companies may sell electricity directly to the regional government through PPAs, or cooperate with local government for small-scale projects Responsibilities - Increased autonomy regarding electricity supply - May provide licenses for projects that do not involve PLN or grid-connected IPPs
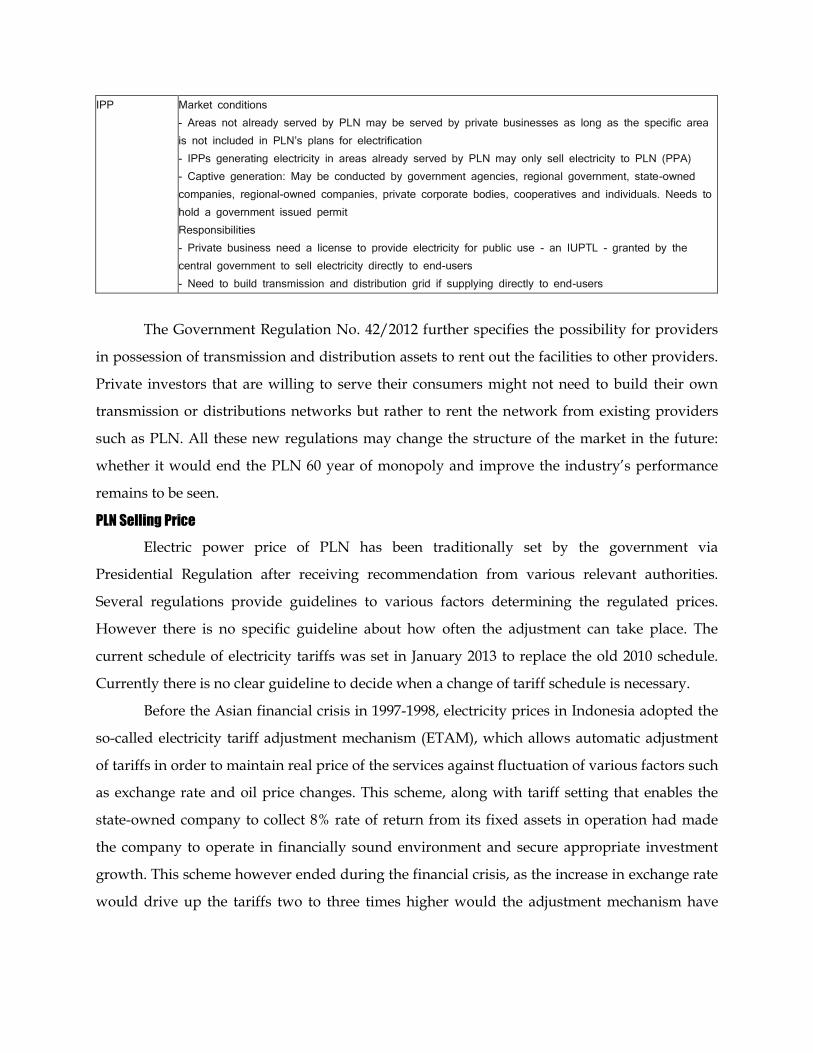
IPP Market conditions - Areas not already served by PLN may be served by private businesses as long as the specific area is not included in PLN’s plans for electrification - IPPs generating electricity in areas already served by PLN may only sell electricity to PLN (PPA) - Captive generation: May be conducted by government agencies, regional government, state-owned companies, regional-owned companies, private corporate bodies, cooperatives and individuals. Needs to hold a government issued permit Responsibilities - Private business need a license to provide electricity for public use - an IUPTL - granted by the central government to sell electricity directly to end-users - Need to build transmission and distribution grid if supplying directly to end-users
The Government Regulation No. 42/2012 further specifies the possibility for providers
in possession of transmission and distribution assets to rent out the facilities to other providers.
Private investors that are willing to serve their consumers might not need to build their own
transmission or distributions networks but rather to rent the network from existing providers
such as PLN. All these new regulations may change the structure of the market in the future:
whether it would end the PLN 60 year of monopoly and improve the industry’s performance
remains to be seen.
PLN Selling Price
Electric power price of PLN has been traditionally set by the government via
Presidential Regulation after receiving recommendation from various relevant authorities.
Several regulations provide guidelines to various factors determining the regulated prices.
However there is no specific guideline about how often the adjustment can take place. The
current schedule of electricity tariffs was set in January 2013 to replace the old 2010 schedule.
Currently there is no clear guideline to decide when a change of tariff schedule is necessary.
Before the Asian financial crisis in 1997-1998, electricity prices in Indonesia adopted the
so-called electricity tariff adjustment mechanism (ETAM), which allows automatic adjustment
of tariffs in order to maintain real price of the services against fluctuation of various factors such
as exchange rate and oil price changes. This scheme, along with tariff setting that enables the
state-owned company to collect 8% rate of return from its fixed assets in operation had made
the company to operate in financially sound environment and secure appropriate investment
growth. This scheme however ended during the financial crisis, as the increase in exchange rate
would drive up the tariffs two to three times higher would the adjustment mechanism have
7
taken place. As a result of huge exchange rate depreciation, the average price in US$ fell down
significantly from around US$ 7 cent to only US$ 2 cent.
Instead of applying automatic adjustment mechanism, the government sets the price
that PLN can charge to the consumers and provide subsidy to cover the cost-revenue gap.
Without having the ability to increase the selling price, PLN’s revenue is no longer able to cover
generation and distribution costs, which increases substantially during the crisis. The situation
is exacerbated by the fact that PLN was, and still is, the only buyer of private power plants
production. Virtually all purchasing agreements were defined in long terms contracts where the
purchasing price was set in US$, creating huge burden to the cost of production of PLN.
While the economy was recovery throughout the year 2000, the government made some
attempts to increase the price back to the pre-crisis level. Several price increases have been
made but relatively negligible to cover the increasing costs. The PLN’s selling price hike have
always been responded by resistance from wider public, thus discourage the government to
increase price even further. Moreover, the government also needs to consult the parliament
before can get through with the plan of having price increase. From 2003 to 2010 there was no
price adjustment for PLN’s electricity power due to political pressure and public resistance. In
2012, the government also had a plan to increase the price, but could not get approval from the
parliament. Only after the 2010 price increase that the average price has reached the pre-crisis
level, thanks also to exchange rate appreciation.
There are four main characteristics of current PLN selling prices. First, the classification
of tariff rate based solely on consumer characteristics. There are six main price categories in
tariff schedule of the company: (i) residential, (ii) business, (iii) industrial, (iv) social activities,
(v) government and (vi) street-light purpose. The groups are further classified based on
maximum power installed for the customers. Second, each group pays different basic charge
and utilization charge. The basic charge is higher for costumers with higher power installed in
their premises, while power utilization is priced progressively according to monthly usage.
Third, residential customers tend to pay, on average, lower than other groups, especially
residential with lower installed power. The reason for this is because low power customers are
more likely to come from poorer households.
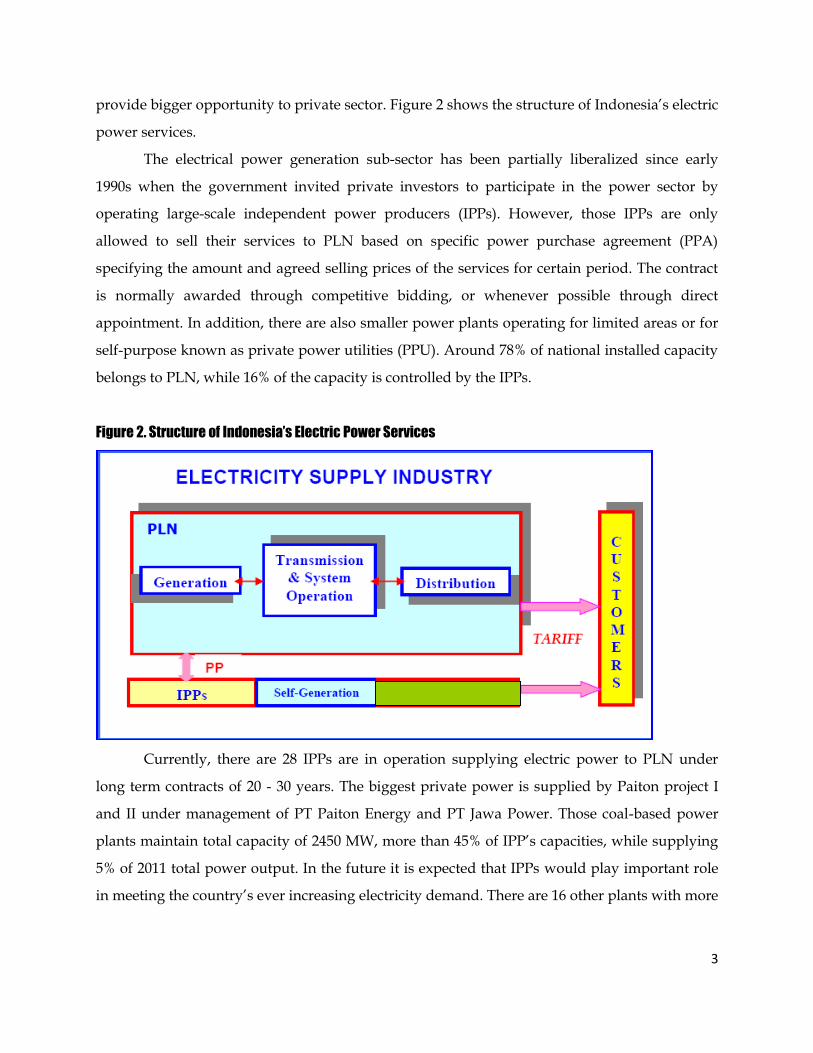
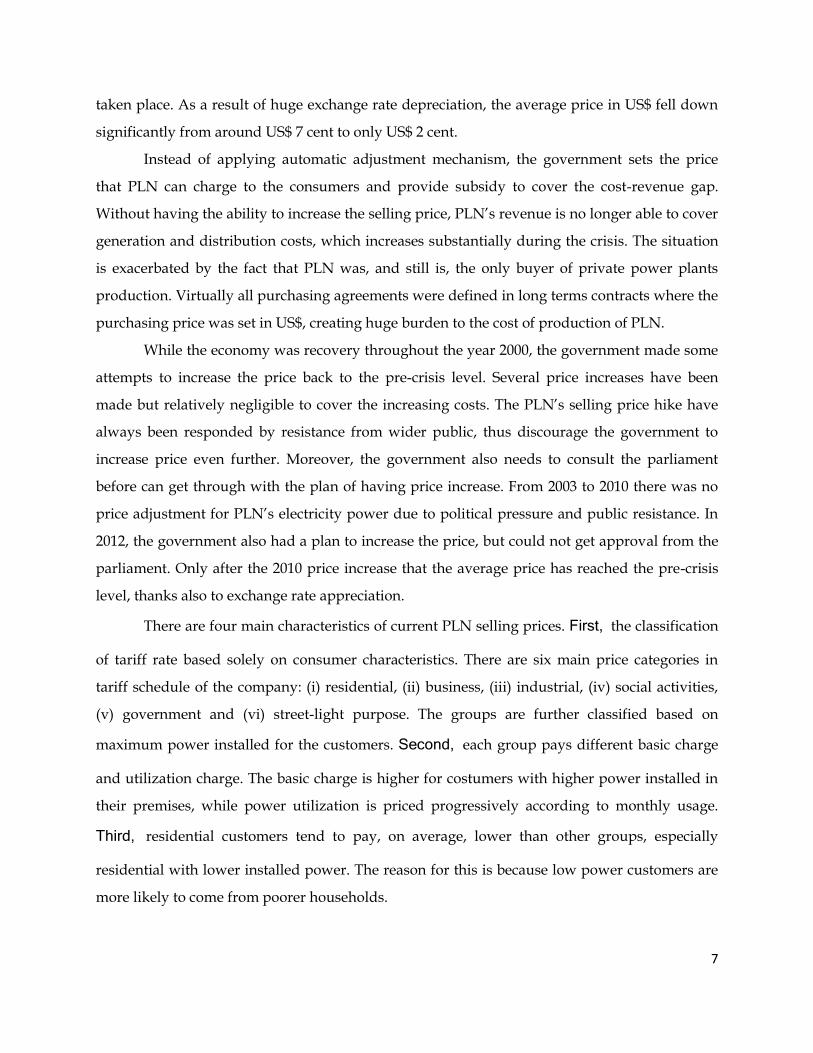
Fourth, there is no other characteristic used in determining electricity service pricing.
The tariff schedule does not take account differences in daily and weekly load demand between
the peak and off-peak time although as illustrated in Figure 3, the difference between those is
very significant. This has put additional burden on PLN’s power facilities, uniform price during
peak and off-peak time does not provide incentives to the consumers in order to use electric
power more efficiently. Neither has it taken into account geographical differences nor the
availability of power supply in different regions. The schedule applies throughout Indonesia,
except for the region of Batam.
Figure 3. Average Daily Load Curve – Java Bali System 2010
Source: Statistik PLN Penyaluran dan Pusat Pengatur Beban Jawa Bali 2010
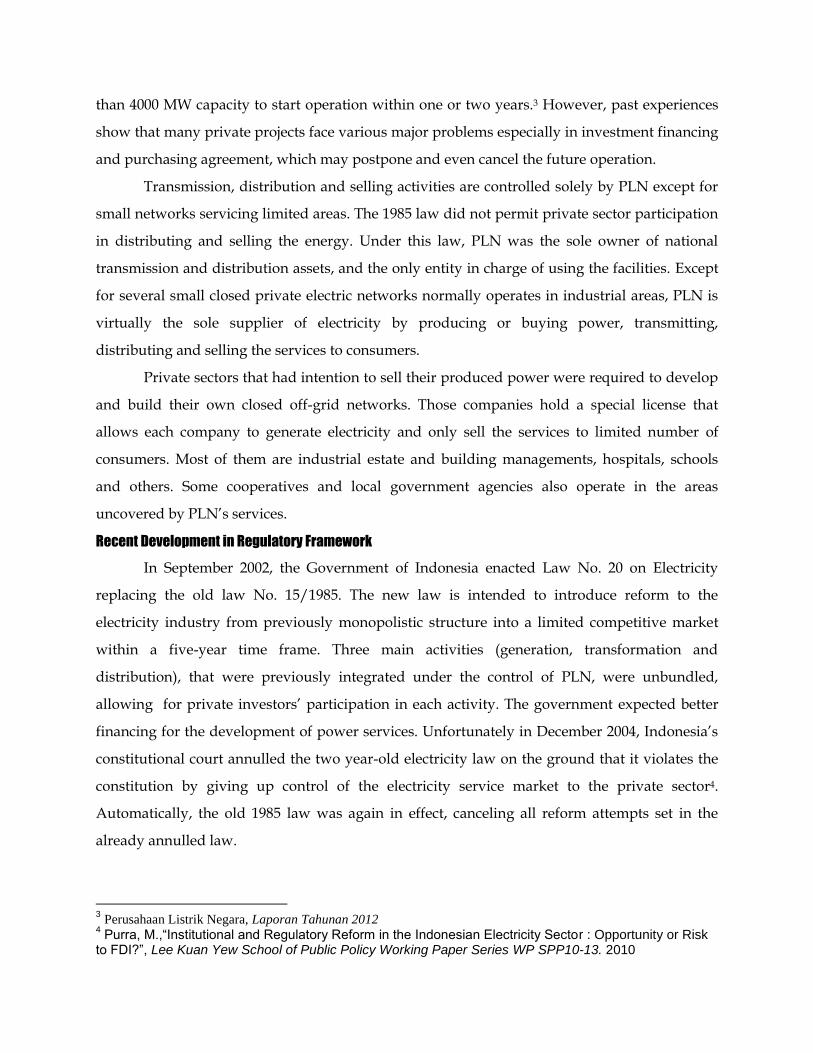
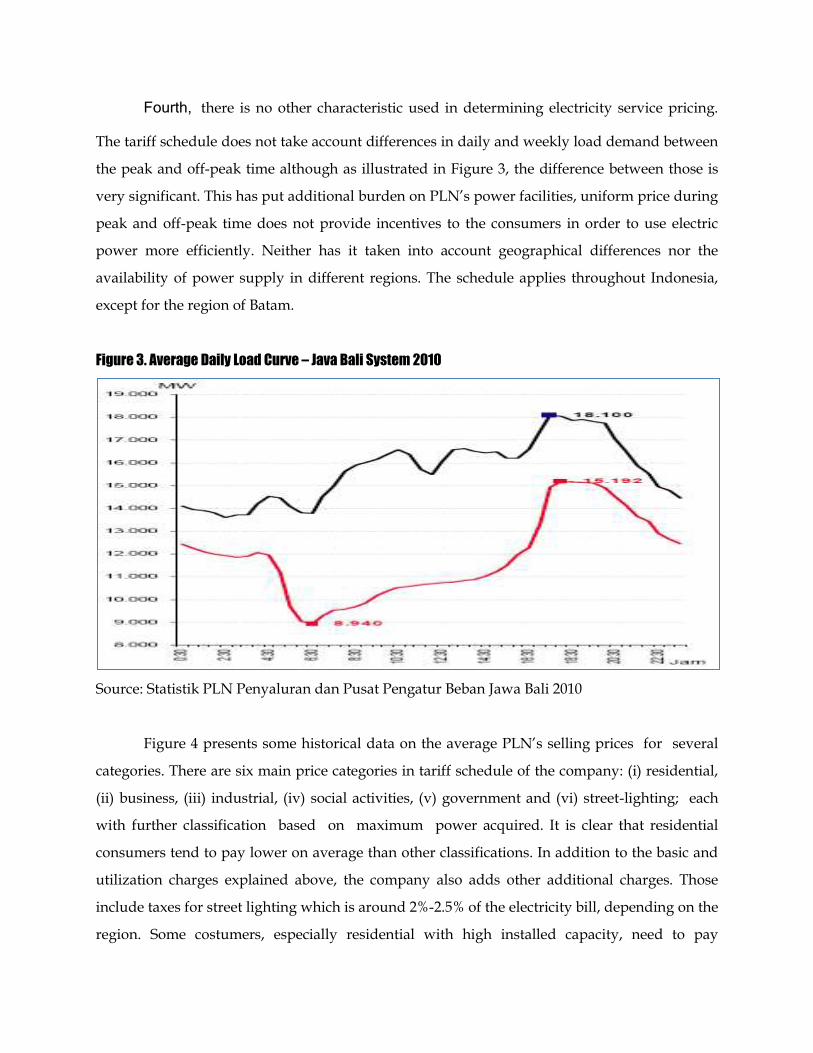
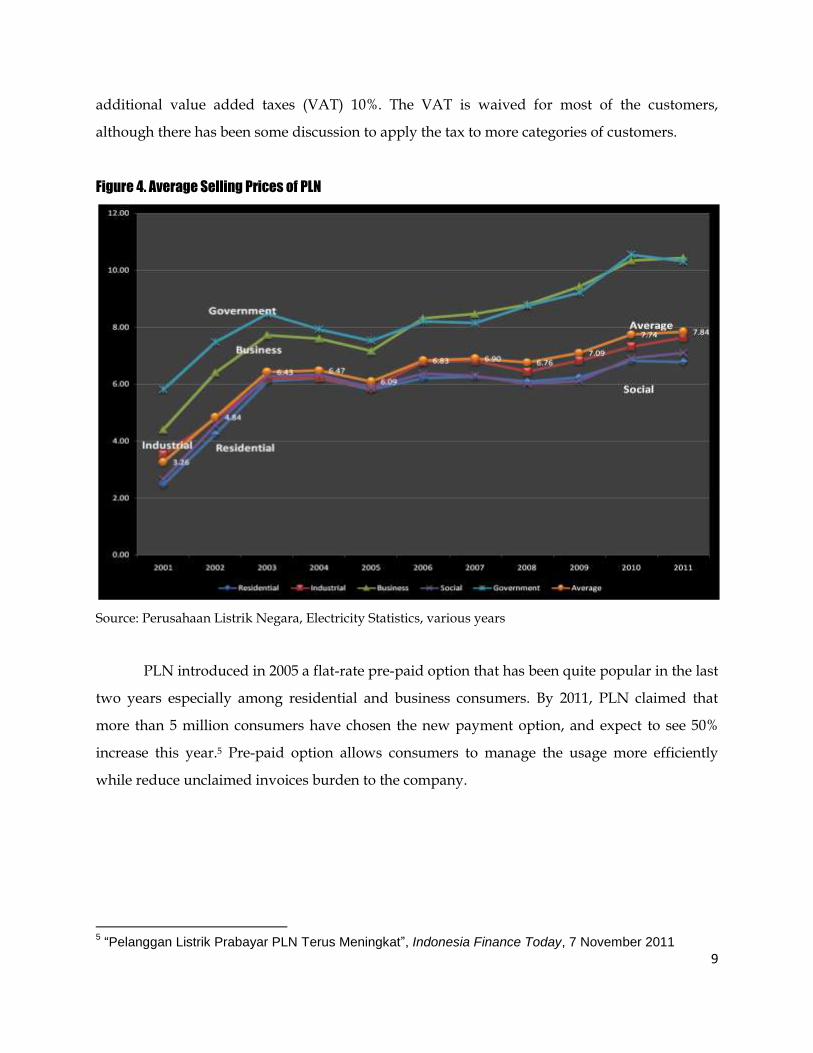
Figure 4 presents some historical data on the average PLN’s selling prices for several
categories. There are six main price categories in tariff schedule of the company: (i) residential,
(ii) business, (iii) industrial, (iv) social activities, (v) government and (vi) street-lighting; each
with further classification based on maximum power acquired. It is clear that residential
consumers tend to pay lower on average than other classifications. In addition to the basic and
utilization charges explained above, the company also adds other additional charges. Those
include taxes for street lighting which is around 2%-2.5% of the electricity bill, depending on the
region. Some costumers, especially residential with high installed capacity, need to pay
9
additional value added taxes (VAT) 10%. The VAT is waived for most of the customers,
although there has been some discussion to apply the tax to more categories of customers.
Figure 4. Average Selling Prices of PLN
Source: Perusahaan Listrik Negara, Electricity Statistics, various years
PLN introduced in 2005 a flat-rate pre-paid option that has been quite popular in the last
two years especially among residential and business consumers. By 2011, PLN claimed that
more than 5 million consumers have chosen the new payment option, and expect to see 50%
increase this year.5 Pre-paid option allows consumers to manage the usage more efficiently
while reduce unclaimed invoices burden to the company.
5 “Pelanggan Listrik Prabayar PLN Terus Meningkat”, Indonesia Finance Today, 7 November 2011
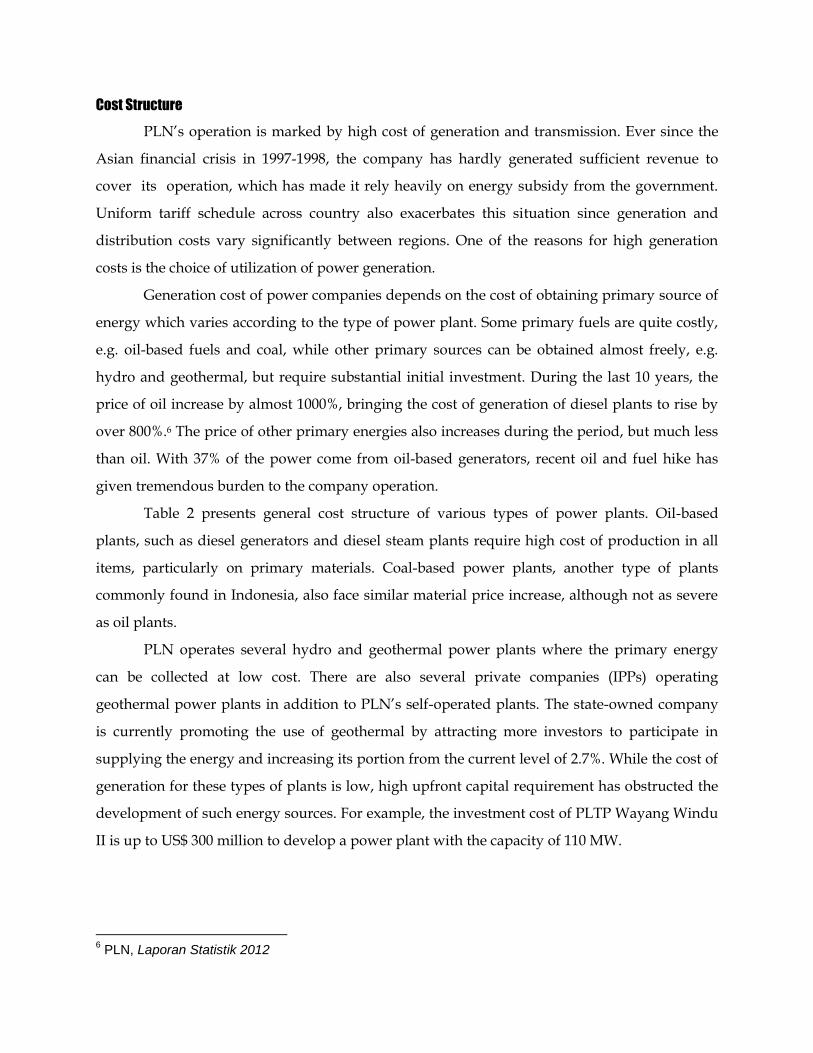
Cost Structure
PLN’s operation is marked by high cost of generation and transmission. Ever since the
Asian financial crisis in 1997-1998, the company has hardly generated sufficient revenue to
cover its operation, which has made it rely heavily on energy subsidy from the government.
Uniform tariff schedule across country also exacerbates this situation since generation and
distribution costs vary significantly between regions. One of the reasons for high generation
costs is the choice of utilization of power generation.
Generation cost of power companies depends on the cost of obtaining primary source of
energy which varies according to the type of power plant. Some primary fuels are quite costly,
e.g. oil-based fuels and coal, while other primary sources can be obtained almost freely, e.g.
hydro and geothermal, but require substantial initial investment. During the last 10 years, the
price of oil increase by almost 1000%, bringing the cost of generation of diesel plants to rise by
over 800%.6 The price of other primary energies also increases during the period, but much less
than oil. With 37% of the power come from oil-based generators, recent oil and fuel hike has
given tremendous burden to the company operation.
Table 2 presents general cost structure of various types of power plants. Oil-based
plants, such as diesel generators and diesel steam plants require high cost of production in all
items, particularly on primary materials. Coal-based power plants, another type of plants
commonly found in Indonesia, also face similar material price increase, although not as severe
as oil plants.
PLN operates several hydro and geothermal power plants where the primary energy
can be collected at low cost. There are also several private companies (IPPs) operating
geothermal power plants in addition to PLN’s self-operated plants. The state-owned company
is currently promoting the use of geothermal by attracting more investors to participate in
supplying the energy and increasing its portion from the current level of 2.7%. While the cost of
generation for these types of plants is low, high upfront capital requirement has obstructed the
development of such energy sources. For example, the investment cost of PLTP Wayang Windu
II is up to US$ 300 million to develop a power plant with the capacity of 110 MW.
6 PLN, Laporan Statistik 2012

11
Table 2. PLN Cost Structure by Type of Power Plants (US$ Cents)
Source: Perusahaan Listrik Negara, Electricity Statistics, 2011
The cost of obtaining energy in a geothermal power plant is relatively low. Currently,
the government does not have specific charge for the energy acquired by geothermal power
plants. According to the regulation, those companies, however, need to pay 34% of its net
revenue as an all-inclusive tax, i.e. including income taxes, but in order to promote the
development of the energy, the government currently agreed to undertake the withholding
income tax of the companies operating geothermal plants, based on a certain quota set every
year. In 2012 the government sets aside Rp 815 billion (around US$ 85 million) to pay the
withholding income tax of those companies.
Except for hydro power and geothermal, Indonesia has not been up to renewable source
of energy, e.g. solar and wind. Hydro power plants, which requires lesser inputs and low
generation costs, only accounts for 9% of energy production although the installed capacity of
this type of plant is much higher than 13.5%. Relatively low utilization of hydro plants is due to
various difficulties ranging from natural conditions to distribution problem.
Different cost of operation can also be observed across different regions (Figure 5). The
difference between low cost region and higher ones is very substantial reaching up to three
times. As mentioned earlier, selling price is set identical for all regions resulting to similar
average prices around US 6 cents.
On the other hand, costs of generation in each region vary to a high degree. In many
areas of Java and Sumatra, the costs can be maintained at less than US$ 12 cent per KWh, while
in eastern part of the country, the costs of generation and distribution can be as high as US$ 45
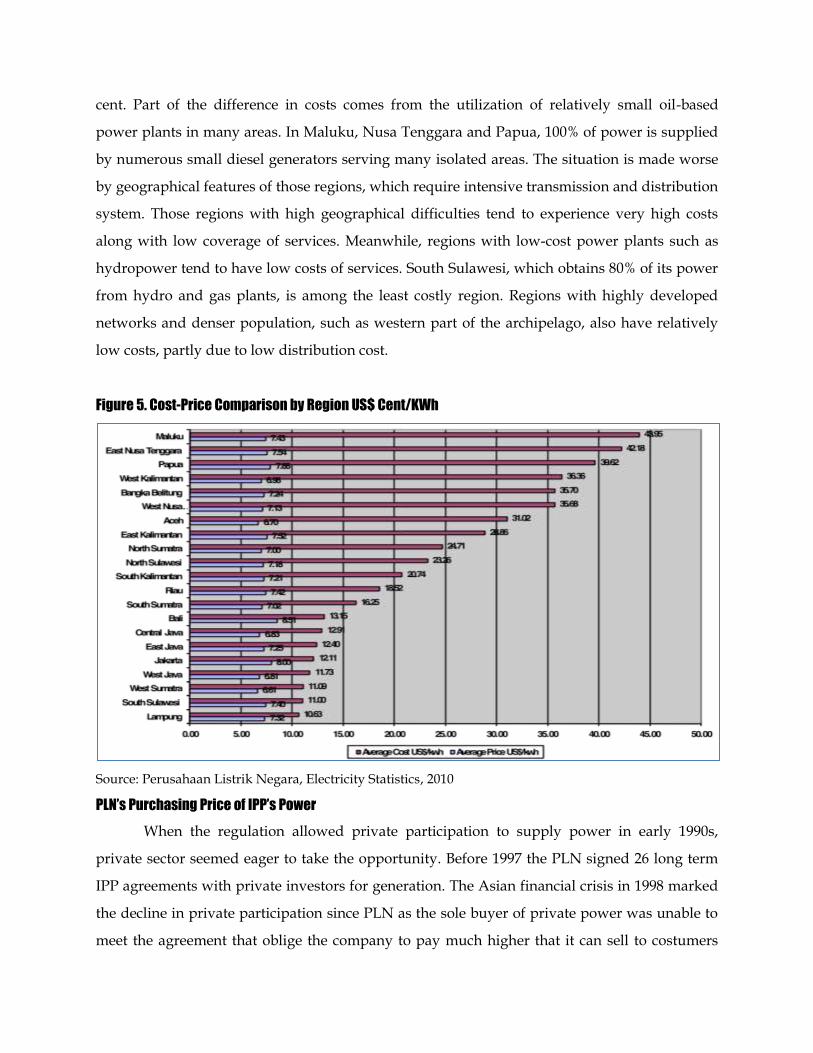
cent. Part of the difference in costs comes from the utilization of relatively small oil-based
power plants in many areas. In Maluku, Nusa Tenggara and Papua, 100% of power is supplied
by numerous small diesel generators serving many isolated areas. The situation is made worse
by geographical features of those regions, which require intensive transmission and distribution
system. Those regions with high geographical difficulties tend to experience very high costs
along with low coverage of services. Meanwhile, regions with low-cost power plants such as
hydropower tend to have low costs of services. South Sulawesi, which obtains 80% of its power
from hydro and gas plants, is among the least costly region. Regions with highly developed
networks and denser population, such as western part of the archipelago, also have relatively
low costs, partly due to low distribution cost.
Figure 5. Cost-Price Comparison by Region US$ Cent/KWh
Source: Perusahaan Listrik Negara, Electricity Statistics, 2010
PLN’s Purchasing Price of IPP’s Power
When the regulation allowed private participation to supply power in early 1990s,
private sector seemed eager to take the opportunity. Before 1997 the PLN signed 26 long term
IPP agreements with private investors for generation. The Asian financial crisis in 1998 marked
the decline in private participation since PLN as the sole buyer of private power was unable to
meet the agreement that oblige the company to pay much higher that it can sell to costumers

13
due to currency mismatch problem. Private sector operation was back on track in 2005 after
renegotiation took place and PLN was ready to solve the debt problem.
PLN purchasing price of IPP’s power is specified in a contract between the state-owned
company and private investors. The purchasing arrangement begins with the competitive
bidding process, although in limited cases direct appointment may be permitted. The bidding
process is initiated in accordance to the PLN plan and roadmap for additional power. The
tender evaluates certain criteria including technical parameters, the proposed price and
construction schedule. The proposed price from IPP is normally the most important
determinant to select preferred bidder although both parties normally have a chance to
negotiate the final price.
While the purchasing price of PLN for the electric power of IPP varies according to the
type of primary sources of fuel, location, and initial capital outlays, in average the price is above
the state-owned company’s final selling price to the costumers. The two biggest power
suppliers to the PLN, Paiton Energi (23.1%) and Jawa Power (20%) receive average price of
around US$8.3 cent/kwh in 2011, while PLN average selling price is no more than US7.8
cent/kwh. However, the purchasing prices remain to be unattractive to private investors
considering that the investment require big initial outlay.
In order to attract private participation, the government has set several incentives
including setting purchasing prices that are considered high enough to cover IPP’s operation. In
2011, the government decided to change the pricing policy from maximum price that PLN can
offer to private power plants to feed-in-tariff scheme, especially for electric power from
renewable energy.
A feed-in tariff (FIT) sets a guaranteed purchasing price for renewable electricity
generated by IPPs. The FIT is set by the government at the start of the project with an assurance
that PLN will take all the electricity produced by the power plant in question. This price
certainty reduces the risk associated with recovering investment and operational costs. A
guarantee of this kind is particularly important in Indonesia, where the PLN’s domination of
transmission and distribution makes the electricity market a monopsony. Table 3 provides
information on FIT for electric power from various renewable energy.
Table 3. Feed-in Tariff for Renewable Energy
Energy Feed-in Tariff Conditions
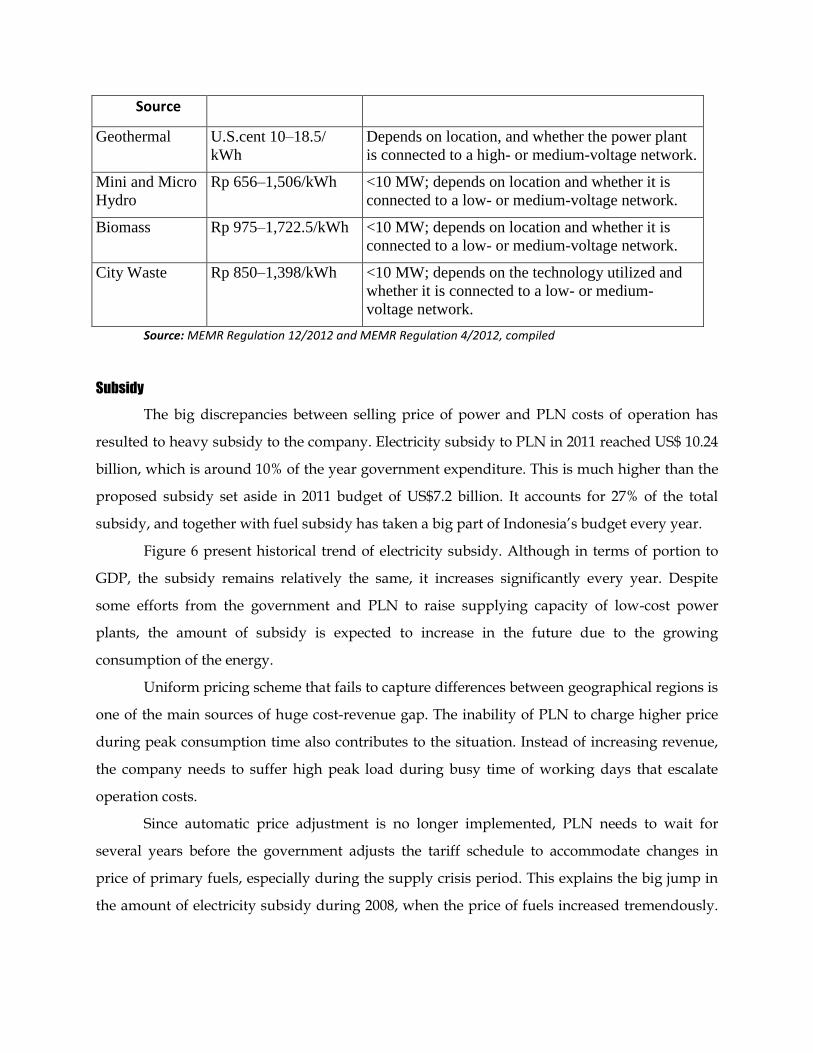
Source
Geothermal U.S.cent 10–18.5/
kWh
Depends on location, and whether the power plant
is connected to a high- or medium-voltage network.
Mini and Micro
Hydro
Rp 656–1,506/kWh <10 MW; depends on location and whether it is
connected to a low- or medium-voltage network.
Biomass Rp 975–1,722.5/kWh <10 MW; depends on location and whether it is
connected to a low- or medium-voltage network.
City Waste Rp 850–1,398/kWh <10 MW; depends on the technology utilized and
whether it is connected to a low- or medium-
voltage network.
Source: MEMR Regulation 12/2012 and MEMR Regulation 4/2012, compiled
Subsidy
The big discrepancies between selling price of power and PLN costs of operation has
resulted to heavy subsidy to the company. Electricity subsidy to PLN in 2011 reached US$ 10.24
billion, which is around 10% of the year government expenditure. This is much higher than the
proposed subsidy set aside in 2011 budget of US$7.2 billion. It accounts for 27% of the total
subsidy, and together with fuel subsidy has taken a big part of Indonesia’s budget every year.
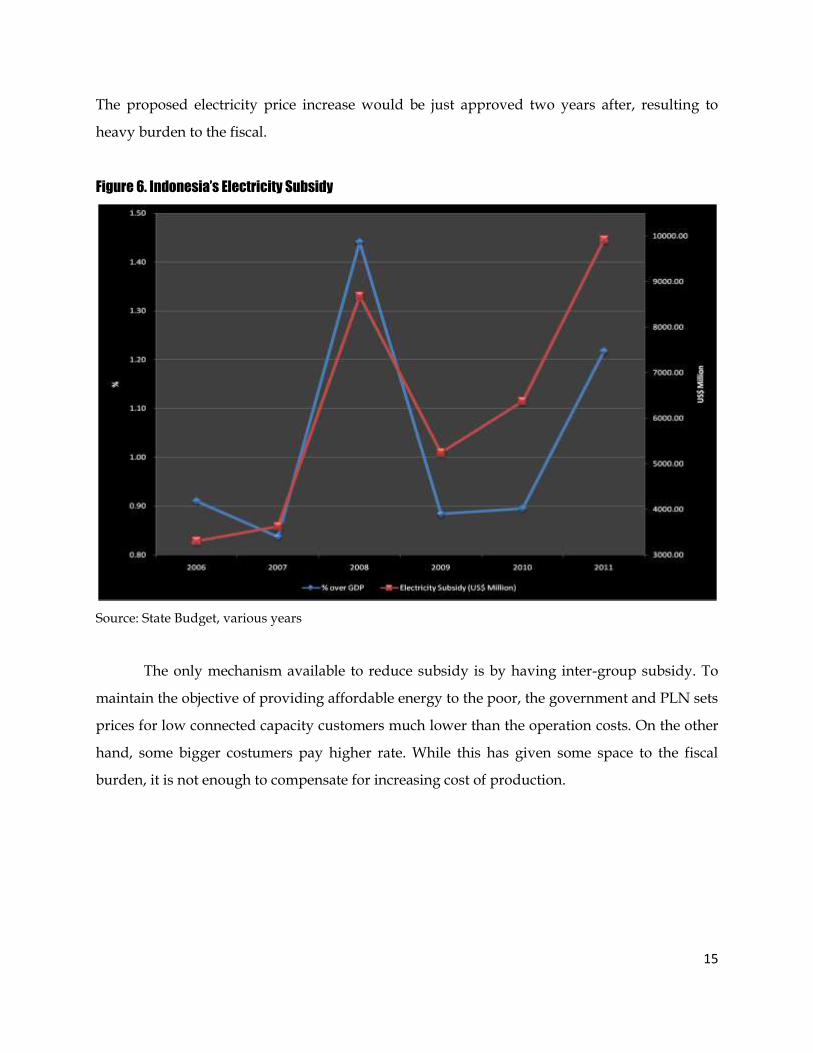
Figure 6 present historical trend of electricity subsidy. Although in terms of portion to
GDP, the subsidy remains relatively the same, it increases significantly every year. Despite
some efforts from the government and PLN to raise supplying capacity of low-cost power
plants, the amount of subsidy is expected to increase in the future due to the growing
consumption of the energy.
Uniform pricing scheme that fails to capture differences between geographical regions is
one of the main sources of huge cost-revenue gap. The inability of PLN to charge higher price
during peak consumption time also contributes to the situation. Instead of increasing revenue,
the company needs to suffer high peak load during busy time of working days that escalate
operation costs.
Since automatic price adjustment is no longer implemented, PLN needs to wait for
several years before the government adjusts the tariff schedule to accommodate changes in
price of primary fuels, especially during the supply crisis period. This explains the big jump in
the amount of electricity subsidy during 2008, when the price of fuels increased tremendously.
15
The proposed electricity price increase would be just approved two years after, resulting to
heavy burden to the fiscal.
Figure 6. Indonesia’s Electricity Subsidy
Source: State Budget, various years
The only mechanism available to reduce subsidy is by having inter-group subsidy. To
maintain the objective of providing affordable energy to the poor, the government and PLN sets
prices for low connected capacity customers much lower than the operation costs. On the other
hand, some bigger costumers pay higher rate. While this has given some space to the fiscal
burden, it is not enough to compensate for increasing cost of production.
Conclusion and Policy Recommendation
Part of Indonesian electricity problems come from pricing practice that neglects cost-
recovery principle and sustainability of operation. Electricity tariff structure fails to generate
sufficient revenue to cover PLN’s operational costs, not to mention for expansion and new
investments. High cost in generating power is due to the selection of primary sources of power
that depends heavily on diesel fuel. The move toward cheaper natural gases and coals as
sources of power is not rapid enough to cater for growing demand, partly due to lack of
investment financing. This has forced PLN to obtain power from costly diesel generators. As a
result subsidy for electricity has been increasing over the time.
In addition to the shift towards cheaper sources of power, PLN and the government
need to change their tariff structure to represent the cost of operation. There are three
considerations that the government needs to pay attention in restructuring electricity tariff.
First, the government needs to reintroduce automatic tariff adjustment that ensures financial
stability of PLN. One way to have it is to decompose tariffs into two components: base tariff and
adjustment component. Base electricity tariffs can be determined by the government for a
specific period of time and should be adjusted accordingly. The second component should take
into account economic shocks, e.g. exchange rate fluctuation, fuel price shock, and
unanticipated demand. The adjustment component can be evaluated several times a year, say
each quarter, to reflect cost situation appropriately.
Second, tariff structure should incorporate the difference between peak and off-peak
time to discourage inefficient use of electricity power especially during high demand period.
While it may not be politically feasible to apply different tariffs for different regions, it may be
done through additional charges based on geographical characteristics. Another thing that can
be incorporated into tariff structure is additional charges for the use of renewable energy, which
is normally more costly than traditional primary sources. It can be conducted based on
voluntary basis for certain costumer groups.
Third, currently, most of the subsidy falls into residential consumption of electric
power. While this policy allows greater access for electricity to poor household, it does not
support efficiency among residential consumers, especially since the utilization by this type of

17
customers mostly for non-productive use. It is then necessary to limit subsidy only to specific
few groups. It can be identified following the installed power of each household; this is the
existing policy under current tariff schedule. It can then be expanded to more specific targeting,
by including several characteristics of the households, e.g. income or assets.
It should be noted that tariff restructuring only solves part of the problems in electricity
services sector. Other problems of electricity industry come from the fact that PLN remain the
only company having authority to sell the services. This has put unfavorable situation for
private power plant supplying electric power as they have no other option to sell their
production, leading to lack of investment not only in power generation, but also in transmission
and distribution infrastructure. Putting emphasize to promote unbundling policy currently
described in the current Law of Electricity should help to create more conducive environment
for the development of the sector.