Embed Size (px)
Citation preview
Chemical Physics 58 (1981) 371-383 North-Holland Publishing Company
(PRIGIN OF hI EMISSION IN LASER STUDIES OF THt!3 CROSSED BEA&% REACTION In + I2
Charles T. RETIXER, Ludger W&iE,* and Richard N. ZARE Department of Chemistry, Stanford Unitxwity, Stanford, CA 94305, USA
Received 12 January 1981
When a beam of In is cross tired at a beam of I2 and the intersection is irradiated by various cw laser sources, In1 emission is observed. The origin of this emission is shown to be laser-induced fluorescence (LIF) from the ground state indium monoiodide product of the reaction In+Iz~InI+I, rather than Iaser-induced chemiluminescence (LIC) ttdough the excitation of the 12 reagent in the reaction In+If A InI* + I. An upper bound on the cross section for the later process is estimated to be =2..5 X lo-l6 cm’. ‘Ike LIF excitation spectrum reveals a strong inversion in the In1 vibrational population distribution, with the fraction of the total excess ener,qy of reaction in vibration exceeding 0.5. Preliminary results for the Tl i 12 reaction system show the same LIF mechanism for the TlI emission.
1. Introdo~on
A previous study reported that intense metal monoiodide emission is obtained when an indium or thalium beam-iodine gas system is illuminated with the 514.5 nm line of an argon ion laser [I]. Since these metals are expected to react rapidly with molecular iodine [;?I, there are two obvious possibilities for the production of this emission. The laser may excite an iodine molecule prior to reaction, yielding an excited product. Alternatively, the laser light may be absorbed directly by the reaction product caus- ing it to fluoresce. The former process is called laser-induced chemiluminescence (LIC) while the latter is called laser-induced fluorescence (LIF) [3,41.
The resolved emission spectrum showed broad oscillations and extended over more than 100 nm Cl], suggestive of a chemihuninescent process. Furthermore, the B-X system of I2 is indeed strongly pumped by the 514.5 nm laser
* Present address: Ecole Polytechnique F&d&ale de J_aw+ anne. D&xxrtoment de Physique, CH 1007 t;lu+anne.
SwlQerland.
light. Thus an LIC mechanism was invoked and the polarization dependence of the emission was thought to reflect the orientation dependence of the M+Iz reaction.
We report here an extension of this study, employing a variety cf cw lasers in a new crossed beam apparatus. After confirming the original experimental results, we sought to investigate the state-to-state dynamics of this reaction by preparing 1: in different vibrational- rotational levels of its B state. However, the resulting data could not be reconciled with the LIC mechanism. Rather, we have amassed overwhelming evidence in favor of an LIF ori- gin for the observed metal monoiodide emis- sion. The dependence of emission intensity on laser polarization is therefore considered to apply to the orientation of the reaction product rather than to the orientation of the reagent.
In this paper we present evidence in favor of an LIF mechanism together with new LIF spectra for the In+Iz reaction product. We also demonstrate that a similar interpretation applies to the Tl + IZ system studied previously_
0301-0104/81/0000-0000/$02.5O 0 North-Holland

372 C.T. Retfner ef a[. / Laser prcorescet:ce study of In +I2
2. Experimental 2.2. Crossed beam apparatus
2.1. General
Fig. 1 presents a schematic drawing of the experimental apparatus in which key elements are lettered for reference purposes. This system consists of two differentially-pumped oven chambers A and a scattering chamber G, each sharing a common liquid nitrogen reservoir. Pumping speeds are such 2s to allow optimum beam production only for reagents that are effciently cryopumped at liquid nitrogen temperatures ($77 IQ. The cw laser light enters and exits vi2 baffie arms which are aligned verticahy on an axis passing through the reac- tion zone N where the two reagent beams cross. Two separate lenses II collect the fluorescence which is detected without dispersion using a photomultiplier or is resolved using a 1 m monochromator K.
The scattering chamber consists of a 50 cm diameter, 50 cm deep, stainless steel cylinder, which is fitted with five 10 cm diameter ports around its circumference at 45” intervals. A rectangular liquid nitrogen reservoir occupies the lower 10 cm of the chamber, which sits above a 3000 I/s oil diffusion pump. The cylin- der is sealed at its base against 2 machined aluminum surface and its top rim against 2
2.5 cm.thick aluminum lid, using in each case a 0.3 cm thick Viton L-gasket. An ionization gauge is attached to this lid. It monitors the chamber pressure which teaches ~10~~ Pa
(10e6 Torr) in about 24 h without liquid nitrogen cooling.
The molecular beam apparat*us is designed to permit rapid reloading and interchange of beam sources. The two sources, mounted on 15 cm diameter flanges, are suspended from the
Fig. 1. Cross section of the crossed-beam apparatus: A = difierentially-pumped oven chambers; B = water-cooled tube; C = tuning fork choppers; D = high-temperature oven: E = tantalum heat shields; F= iodine oven; G = scattering chamber; H = lenses; I = light b&es; J = cooled photomultipliers; K = 1 m monochromator; L = beam axes; y = po.-t extension to &Z&X . scattered oven light; and N = reaction/excitation zone. Not shown are vertical laser baffle arms that project through the d&hed circle.
CT. Retmer et al. j Laser fhmscence study of In + I, 373
chamber iid as separate units. Each source chamber A consists of a 50 cm long, 15 cm in diameter nickel-plated copper tube (0.6 cm thick) that passes through the liquid nitrogen reservoir at its lower end and mounts vertically above a baffled 1000 l/s oil diffusion pump. Additionally, each beam source is surrounded by a 10 cm diameter water-cooled nickel-plated copper tube B attached to a supporting flange.
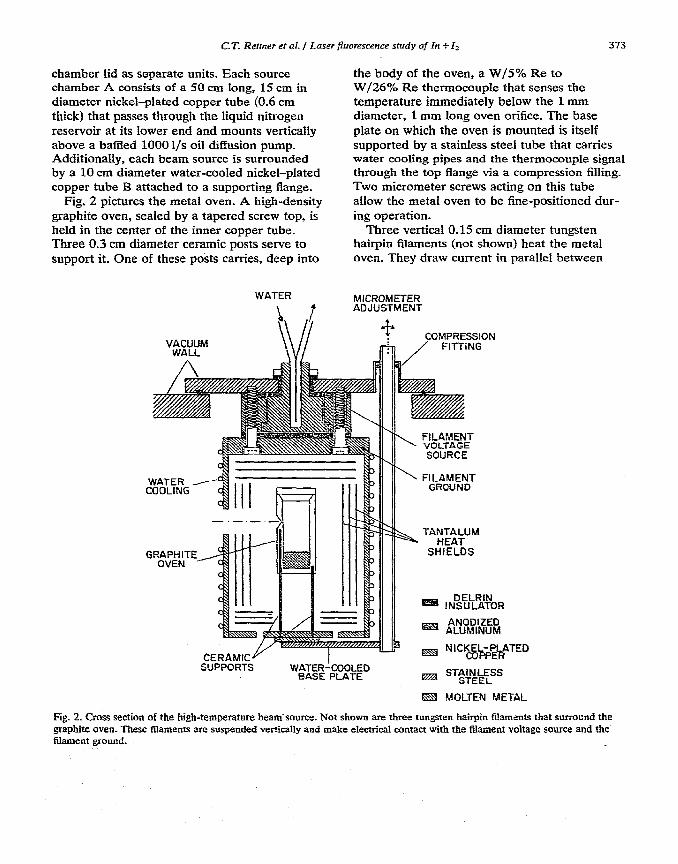
Fig. 2 pictures the metal oven. A high-density graphite oven, sealed by a tapered screw top, is held in the center of the inner copper tube. Three 0.3 cm diameter ceramic posts serve to support it. One of these posts carries, deep into
WATER
\ ?
the body of the oven, a W/5% Re to W/26% Re thermocouple that senses the temperature immediately below the 1 mm diameter, 1 mm long oven orifice. The base plate on which the oven is mounted is itself supported by a stainless steel tube that carries water cooling pipes and the thermocouple signal through the top flange via a compression filling. Two micrometer screws acting on this tube allow the metal oven to be fine-positioned dur- ing operation.
Three vertical 0.15 cm diameter tungsten hairpin filaments (not shown) heat the metal oven. They draw current in parallel between
MICROMETER ADJUSTMENT
WATER _/--- COOLING
CERAMICY SUPPORTS
I WAT!3-COOLED
BASE PLATE
* COMPRESSION
L%f%!! SOURCE
1‘ FILAMENT GROUND
TANTALUM HEAT
SHIELDS
K2Z! MOLTEN METAL
Fig. 2. Cross section of the high-temperature beam source. Not shown are three tungsten hairpin filaments that surroond the graphite oven. These Naments are suspended vertically and make electrical contact with the filament voltage source and the filament sound.
374 C.T. Rermer er aI. / Laser~uorescencr study of In + I2
two copper electrodes. Spot-welded tantalum sheets provide radiation shielding. Water cool-
ing is applied to the tar, Range, to the outside of the 10 cm diameter copper tube, and to the oven mount base plate. With clean radiation shields, this oven can attain temperatures G2200 K.
The metal beam enters the scattering cham- ber- through five sets of tantalum coIlimating slits. A tuning-fork chopper (Bulova Watch Co.) positioned before the final pair of slits modu- lates the beam at 400 Xz. The final slit assembly is 1 cm high and 0.4 cm wide. It is located 2.5 cm from the reaction zone and 6.0 cm from the oven orifice.
Endium and thalium oven te.nperatures of 1700 and 1200 K produced by 2.5 and 1.0 kW input powers, respectively, give beam intensities of about lOI atoms cm-’ s-l at the reaction zone. This depletes the oven by approximately 1 g per hour. Under these conditions a typical oven charge of 100 g would last for many runs -but the collimating slits require cleaning follow- ing each run.
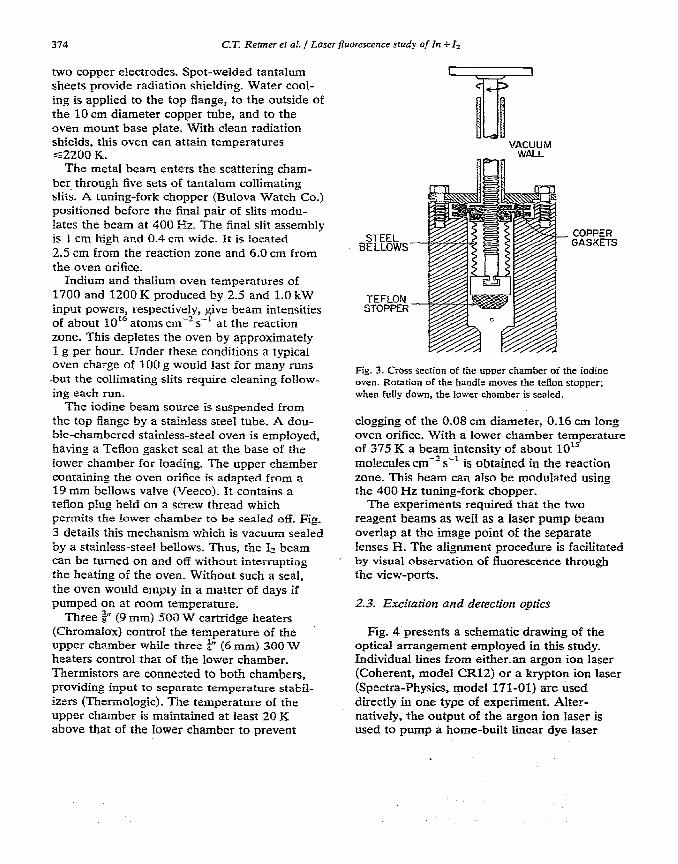
The iodine beam source is suspended from the top flange by a stainless steei tube. A dou- b!e-chambered stainless-steel oven is employed, having a Teflon gasket seal at the base of the lower chamber for Ioading. The upper chamber containing the oven orifice is adapted from a 19 mm bellows valve (Veeco). It contains a teflon plug held on a screw thread which permits the lower &amber to be seaied off. Fig_ 3 details this mechanism which is vacuum sealed by a stainless-steel bel!ows. Thus, the I3 beam can be turned on and ofi withou? interrupting the heating of the oven. Without such a seal, the oven would empty in a matter of days if pumped on at room temperature.
Three ? (9 mm) 500 W cartridge heaters (Chromafox) controi the temperature of the upper chamber whi!e three $” (6 mm) 300 W heaters control that of the lower chamber. Thermistors are connected to both chambers, providing input to separate temperature stabil- izers (Themologic). The temperature of the upper chamber is maintained ai least 20 K above that of the lower chamber to prevent
VACUUM WALL
STEEL BELLOWS
COPPER GASKETS
TEFLON STOPPER
Fip. 3. Cross section of the upper chamber of the iodine oven. Rotation @f the handle moves the teflon stopper; when fully down, the lower chamber is sealed.
clogging of the 0.08 cm diameter, 0.16 cm locg oven orifice. With a lower chamber temperature of 375 K a beam intensity of about 1015 molecules cm -‘s-’ is obtained in the reaction zone. This beam can also be modulated using the 400 Hz tuning-fork chopper.
The experiments required that the two reagent beams as well as a laser pump beam overlap at the image point of the separate lenses H. The ali,onment procedure is faciiitated by visual observation of fluorescence through the view-ports.
2.3. Excitation and detection optics
Fig. 4 presents a schematic drawing of the optical arrangement employed in this study. Individual lines from either-an argon ion laser (Coherent, model CRl2j or a krypton ion laser (Spectra-Physics, model 171-01) are used directly in one type of experiment. Alter- natively, the output of the argon ion laser is used to pump a home-built linear dye laser
375 C.T. Rethrer et d. / Laser fluorescence study of Iit +h
THERMOPILE BAFFLE ARM GAFFLE ARM da/ l/II II\1 \tk *
IX I \#I \‘I’ ’ ‘I- f+
\ REncTlON/ExCliAilON 1
POWER ZONE MONITOR f. A&%!~~
l--------l r------l Ar+ OR Kr* LASER
I I p
hr
I I & ‘_______I
POWER MONITOR II *,
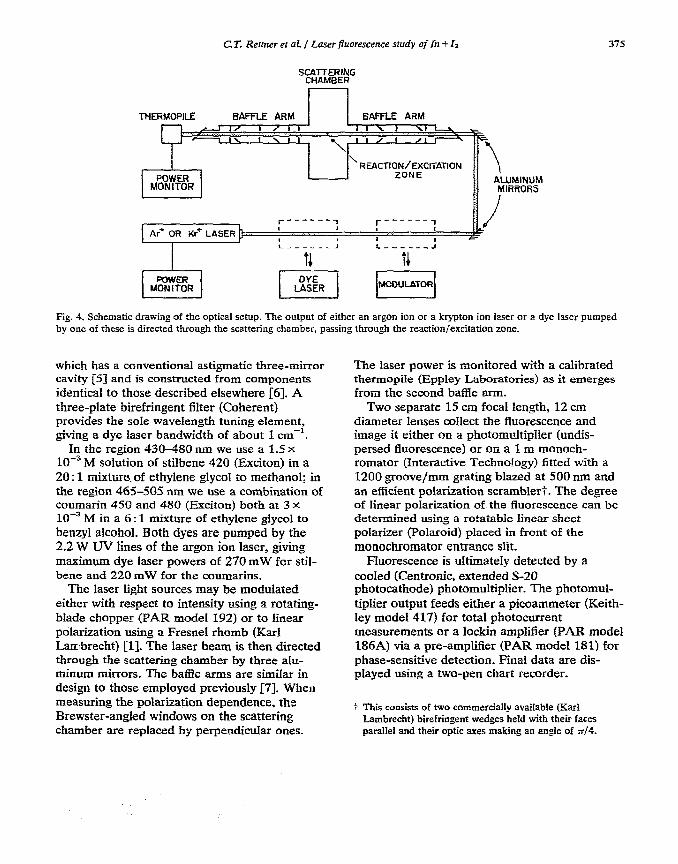
Fig. 4. Schematic drawing of the optical setup. The output of either an argon ion or a krypton ion laser or a dye laser pumped by one of these is directed through the scattering chamber, passing through the reaction/excitation zone.
which has a conventional astigmatic three-mirror
cavity [Sj and is constructed from components
identical to those described elsewhere [6]. A three-plate birefringent filter (Coherent) provides the sole wavelength tuning element, giving a dye laser bandwidth of about 1 cm-‘.
In the region 430-480 nm we use a 1.5 x 10m3 M solution of stilbene 420 (Exciton) in a 20 : 1 mixture. of ethylene glycol io methanol; in the region 465-505 nm we use a combination of coumarin 450 and 480 (Exciton) both at 3 x
10m3 M in a 6 : 1 mixture of ethylene glycol to benzyl alcohol. Both dyes are pumped by the 2.2 W UV lines of the argon ion laser, giving maximum dye laser powers of 270 mW for stil- bene and 220 mW for the coumarins.
The laser light sources may be modulated either with respect to intensity using a rotating- bIade chopper (PAR model 192) or to linear polarization using a Fresnel rhomd (Karl Lambrecht) [l]. The laser beam is then directed through the scattering chamber by three alu- minum mirrors. The batBe arms are simiIar in design to those employed previously [7]. When measuring the polarization dependence, the Brewster-angled windows on the scattering chamber are replaced by perpendicular ones.
The laser power is monitored with a calibrated thermopile (Eppley Laboratories) as it emerges from the second baffle arm.
Two separate 15 cm focal length, 12 cm diameter lenses cokct the fluorescence and image it either on a photomultiplier (undis- persed fluorescence) or on a 1 m monoch- romator (Interactive Technology) fitted with a 1200 groove/mm grating blazed at 500 run and an efficient polarization scrambler?. The degree of linear poIarization of the fluorescence can be detetined using a rotatable linear sheet polarizer (Polaroid) placed in front of the monochromator entrance slit.
Fluorescence is ultimateIy detected by a cooled (Centronic, extended S-20 photocathode) photomultiplier. The photomul- tiplier output feeds either a picoammeter (Keith- ley model 417) for total photocurrent measurements or a iockin amplifier (PAR model 186A) via a pre-amplifier (PAR model 181) for phase-sensitive detection. Final data are dis- played using a two-pen chart recorder.
+ This oonsists of two commercially avaiIable (Karl Lambrecht) birefringent wedges held with their faces parallel and their optic axes making an angie of ;r/4.
376 C.T. Remer et al. / Loser f?uorescence study of In + I,
3. ResuMs
3.2. In+Li
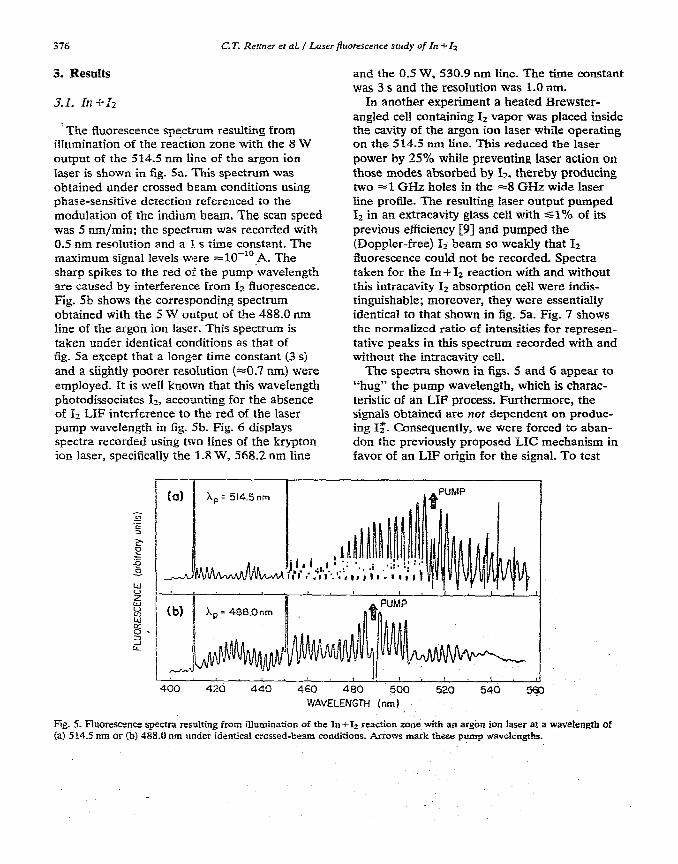
The fluorescence spectrum resulting from illumination of the reaction zone with the 8 W output of the 514.5 nm line of the argon ion laser is shown in fig. 5a. This spectrum was obtained under crossed beam conditions using phase-sensitive detection referenced to the modulation of the indium beam. The scan speed was 5 nm/min; the spectrum was recorded with 0.5 nm resolution and a 1 s time constant. The maximum signal levels were =lO-‘*_A. The sharp spikes to the red of the pump wavelength are caused by interference from Ia fluorescence. Fig. Sb shows the corresponding spectrum obtained with the 5 W output of the 488.0 run line of the argon ion laser. This spectrum is taken under identica1 conditions as that of fig. Sa except that a longer time constant (3 s) and a slightly poorer resolution (~0.7 nm) were empIoyed. it is we11 known that this wavelength photodissociates I-_, accounting for the absence of I2 LXF interference to the red of the laser pump wavelength in fig. 5b. Fig. 6 displays spectra recorded using two lines of the krypton ion laser, specifically ihe 1.8 W, 5’68.2 nm line
and the 0.5 W, 530.9 nm line. The time constant was 3 s and the resohrtion was 1.0 nm.
in another experiment a heated Brewster- angled cell containing Iz vapor was placed inside the cavity of the argon ion laser while operating on the 514.5 nm line. This reduced the laser
power by 25% while preventing laser action on those modes absorbed by 12, thereby producing two =l GHz holes in the =8 GI-Iz wide laser line profile. The resulting laser output pumped 1, in an extracavity glass cell with ~1% of its previous efliciency [9] and pumped the (Doppler-free) I, beam so weakly that 12 fluorescence could not be recorded. Spectra taken for the In+Ia reaction with and without this intracavity LZ absorption cell were indis- tinguishable; moreover, they were essentially identical to that shown in fig. Sa. Fig. 7 shows the normalized ratio of intensi&s for represen- tative peaks in this spectrum recorded with and without the intracavity cell.
The spectra shown in figs. S and 6 appear to “hug” the pump wavelength, which is charac- teristic of an LIF process. Furthermore, the signals obtained are not dependent on produc- ing I$. Consequently, we were forced to aban- don the previously proposed LIC mechanism in favor of an LIF origin for the signal. To test
/ i . I , I!
.5&I ! ! 1
400 420 440 460 480 520 540 5 WAVELENGTH (nm 1
Fig. 5. Fluorescence spectra resulting from illumination of the In+Iz reaction zone with an argon ion laser at a wavebngth of (a) 5 14.5 nm or (b) 488.0 nm under identical crossed-beam conditions. Arrows mark these pump wavelengths.
CT. Retmer et al. / Laser ffuorescence study of In + I2 377
430 450 470 490 510 530 550 570 590
WAVELENGTH (ml
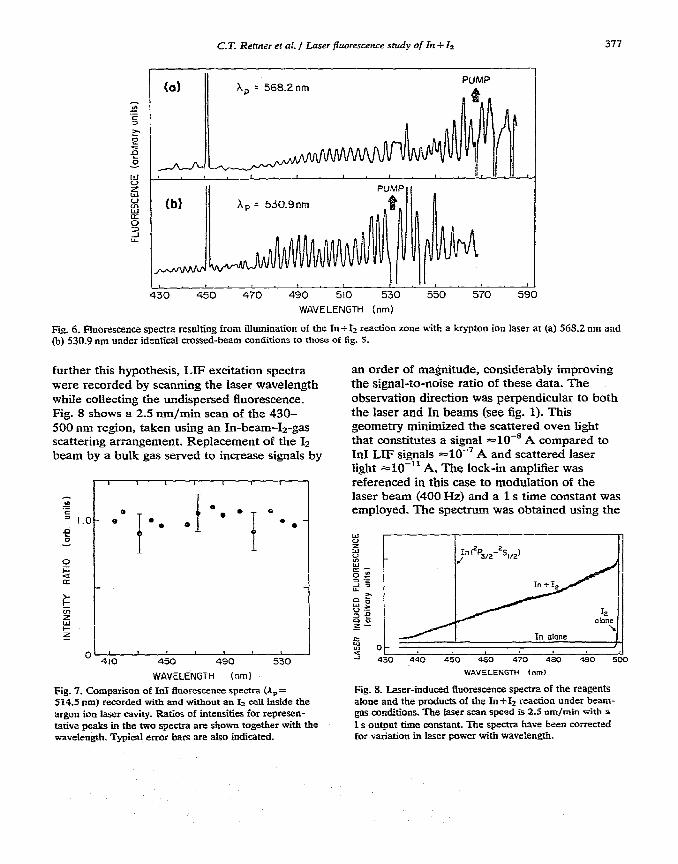
Fig. 6. Fluorescence spectra resulting from illumination of the In+12 reaction zone with a krypton ion laser at (a) 568.2 nm and (b) 530.9 nm under identical crossed-beam conditions to those of fig. 5.
further this hypothesis, LlF excitation spectra were recorded by scanning the laser wavelength while collecting the undispersed fluorescence. Fig. 8 shows a 2.5 nm/min scan of the 430- 500 nm region, taken using an In-bean&-gas scattering arrangement. Replacement of the Is beam by a bulk gas served to increase signals by
1 I I , I 1
J’ ’ 410 450 490 530
WAVELENGTH (nml
Fig. 7. Comparison of Irtl fiuorescence spectra (A, = 514.5 nm) recorded with and without an I+ cell inside the argon ion laser cavity. Ratios of intensities for represen- tazive peaks in the two spectra are shown together with the wavelength. Typical error bars are also indicated.
an order of magnitude, considerably improving the signal-to-noise ratio of these data. The observation direction was perpendicular to both the laser and In beams (see fig. 1). This geometry minimiied the scattered oven light that constitutes a signal =10-’ A compared to InI LIF signals =lO-’ A and scattered laser light ==lO-‘I A. The lock-in amplifier was referenced in this case to modulation of the laser beam (400 Hz) and a 1 s time constant was employed. The spectrum was obtained using the
r
alone \
In alone I ,
- 430 440 450 450 4iO 480 490 500
WAVELENGTH (nm)
Fig. 8. Laser-induced fluorescence spectra of the reagents alone and the products of the In+12 reaction under beam- gas conditions. The Iaser scan speed is 2.5 nm/min with a 1 s output time amstant. The spectra have been corrected for v2riatioa in laser power with waveIength.

378 C.T. Rettner et d. / Laser fluorescence study of In i-4
overlapping dye range described in section 2.3. Although the spectrum was corrected for the intensity variation of the probe laser, no a!lowance was made however for the (small) variation of the S-20 photocathode response with fluorescence wavelength as a function of excitation wavelength. By scanning a factor of ten more slowly, individual rotational band head profiles could be discerned, as shown in fig. 9. LIF intensities were found to be linear with Iz pressure up to 0.1 Pa (10e4 Torr), the maximum pressure employed.
A laser-induced fluorescence signal was observed from either reagent alone. The 12 fluorescence prevented InI excitation spectra from being recorded to the red of 500 run (see fig. 8). The fluorescence from the In beam consisted of two atomic lines at 451.1 nm (In ‘Ps,2-‘S& and at 410.2 nm (In ‘Pr,z-zS1,2) of equal intensity (see fig. 5). The contribution of this fluorescence to the total fluorescence under typical working conditions is shown in fig. 8. The intensity of the atomic In lines increased with indium oven temperature more rapidly than did the atomic indium beam flux, as monitored by tuning the laser to the 451.1 nm line. The optimum signal-to-noise level was obtained with an oven temperature of 1610 K.
We have not been able to establish unequivocally the origin of this fluorescence. At
East it was thought that an impurity, either an oven contanrinant or a low pressure gas in the scattering chamber, was responsible for the observed atomic indium fluorescence. We imagined that indium atoms reacted with the impurity to produce a species that was subsequently photodissociated by the laser to yield excited indium atoms in the *S112 state. However, the use of the highest purity indium metal available (99.999%, Apache Chemicals) and the observation that the atomic fluorescence was not related to the ambient pressure in the scattering chamber argued against this possi- bility.
The strong dependence on oven temperature may suggest a mechanism involving indimn dimers. A single photon from the laser pump light has insufficient energy to produce In (*S& photofragments from ground state Inz. Instead we postulate that the indium dimers are elec- tronically excited by the oven light [9] and that these species are then photodissociated by the laser to produce excited indium atoms. The blackbody radiation from the In oven is rather intense; we have even been able to observe weak 1, fluorescence induced by the oven light when the In beam is so directed as to miss entering the scattering chamber. We estimate that at ~1700 K the indium oven provides 210 mW of light bluer than 500 run. Since excited dimers present in the beam at a level of
C L 19 &I &1 42 I;;3
WAVELENGTH (m-n)
Fig. 9. L.aser-ir.duced fluorescence spem_un of the nascent in1 product from the beam-gas reaction Ini-12. The noise on the
spectrum is nuch less than the nructured featares which are fully reproducible. The laser wan speed is 0.25 nm/min with a 1 s output time mnstanf. No mrrection has been made for the (sma3) variation of 12ser power witb -wavelength.
C.T. Reftner et al. / Laser f7uorescence study of In +I2 379
one part in ten million would account for the effect, absorption of a small fraction of this light by the 1% or so of dimers in the beam would be sufficient.
The polarization of the In1 fluorescence was determined using a beam-gas scattering setup in
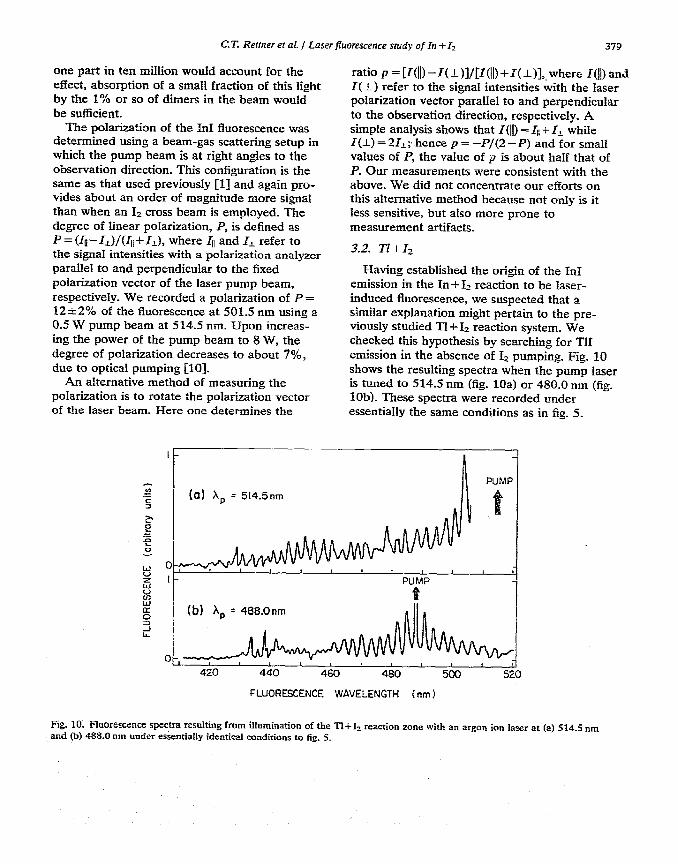
which the pump beam is at right angles to the observation direction. This configuration is the same as that used previously [I] and again pro- vides about an order of magnitude more signal than when an 12 cross beam is employed. The degree of linear polarization, P, is defined as P = (Iu-I~)/(I~I+I~), where 41 and IL refer to the signal intensities with a polarization analyzer parallel to and perpendicular to the fixed polarization vector of the laser pump beam, respectively. We recorded a polarization of P = 12jc2% of the fluorescence at 501.5 nm using a 0.3 W pump beam at 514.5 nm. Upon increas- ing the power of the pump beam to 8 W, the degree of polarization decreases to about 7%, due to optical pumping [lo].
An alternative method of measuring the polarization is to rotate the polarization vector of the laser beam. Here one determines the
ratio p = [ICI]) -I(-~)1/[1(Il) +l(_~)l,.where I(]]) and 1(l) refer to the signal intensities with the Iaser polarization vector parallel to and perpendicular to the observation direction, respectively. A simple analysis shows that I(]]) = I,+l, while I(I) = 21,; hence p = -P/(2-P) and for small values of P, the value of p is about half that of P. Our measurements were consistent with the above. We did not concentrate our efforts on this alternative method because not only is it less sensitive, but also more prone to measurement artifacts.
3.2. 2-l+&
Having established the origin of the In1 emission in the In + 1~ reaction to be laser- induced fluorescence, we suspected that a similar explanation might pertain to the pre- viously studied Tl+Iz reaction system. We checked this hypothesis by searching for TlI emission in the absence of 1, pumping. Fig. 10 shows the resulting spectra when the pump laser is tuned to 514.5 run (fig. 10a) or 480.0 nm (fig. lob). These spectra were recorded under essentially the same conditions as in fig. 5.
0 -, I
420 440 460 480 500 520
FLUORESCENCE WAVELENGTH (nm 1
Fig. 10. Fluorescence spectra resulting fmm ilhtmination of the TI+I+ reaction zone with an argon ion lair at (a) 514.5 nm and (b) 488.0 run under essentially identical conditions to fig,. 5.
380 CT. Refbter et aL f Laser fluorescence sludy of In -4-L
Again we observed in the case of 515.4 nm pumping coincidental 1, fluorescence (not shown in fig, 10a) as well as in both cases laser- induced fluorescence of TlI formed in the
ground state reaction Tl + Iz + ‘III + I. Because the spectroscopy of TU is sot as weU- developed as even that of InI, we did not pursue further the study of the Tl+Iz reaction system.
4. Discussion
We have obtained strong LIF signals, S-, from the In+12 reaction products throughout the visible, whereas pumping of the I2 reagent failed to produce detectable LIC signals, &c. Comparing In1 emission signals obtained with and without Iz pumping by the 514.5 nm laser light, we estimate the signal ratio for these two reaction mechanisms to be
(1)
In section 4.1, we derive an analytical approximation for this signal ratio in terms of the relevant reactive cross sections for these two processes; in section 4.2, we use the inequality given in eq. (1) to place an upper bound on u~c, the cross section for the LIC :eaction; and in section 4.3, we discuss the nature of the nascent In1 product formed in the In+Iz reaction.
4.1. Comparison of laser induced fluorescence and laser induced chemiluminescence reaction rates
Let us consider the reaction A+BC-,AB(u”, .P)+C in which the AB product is detected by LIF. The magnitude of SLY wil1 depend on the following processes under single-collision conditions:
reaction: _4i+BC;+ABi(V”,J”)+C+ (23)
ground state fly out: ABi(v”, 1”)-Z AB,Ju”, J”), (2b)
absorption: ABi(?J”, J”) + hV + ABi(t”, J’), (2c)
emission: AB~(~“,J’)-*AB~(u, /)+h~, (2d)
excited state fly out: ABi(U’, J’) + AB,(v’, I’). (24
In eq. (2) the subscripts i and o indicate species in and out of the reaction/ excitation zone of radius R, which is assumed to be homogeneously illuminated by the probe laser. The observation zone is taken to be smaller than or equal to this region which encompasses the former.
Assuming that in this cw experiment all species reach steady-state concentrations, then we can write
(3)
where urn(AB; vN, J”) is the (phenomenolo$cal) cross section for producing AB products in the vibration-rotation state (g”, J”) which is pumped by the laser of intensity I(V) at frequency Y and which has an absorption cross section denoted by E(AB; v). In eq. (3) v(A, SC) is the mean center- of-mass velocity of the reagknts, v&B j is the mean laboratory vklocity of the .AB product, and we have assumed step function behavior for the various spatial distributions rather than more realistic
-(e-g_, gaussian) profiles_ We also find that

C.T. Rettcer et al. / Laser fkorescence sktdy of In + I2 381
where r(AB; zl’, J’) is the radiative lifetime of the AB(u’, J’) molecule. We may then write the LIF signal as
&_u~=d[ABt(t~‘, I’)]/r(AB; D’> J’), (5)
where d is the fluorescence detection efficiency. Substitution of eqs. (3) and (4) into (5) yields the expression
d[AJ[BCJmr_&AB; u”,J”)Q(A, BC)I(V)E(AB; Y)
‘J-E = r(AB; u’, J’)[ V(AB)/R + l/r(AB; u’, J’)][ V(AB)/R +1(v)& (AB; v)]’
We consider next the rival laser-induced reaction A i BC* + AE%* + C in which the chemiluminescence of the AB* product is detected_ The magnitude of Sue will depend on the following processes under single-collision conditions:
absorption: BG(u”, J”)ihv+BC~,
reagent fiy out: BC”+BC:,
reagent emission: BC”+BC++hv,
reaction: AitBC~~ABP+Ci,
product fly out: ABF-,AB$,
product emission: BCF-+BG+hv
In a similar manner we find
[Bc;(u”, J”)Y(v)E(BC; Y)
cBc’l = e(BC*)/R + 1/2(BC*) + [A,]cr&BC*) P(A, BP)
where all symbols are defined in an analogous manner. It follows that
CAB?]= [Ai]~C~]vLIC(BCQ) V(A, BC')
v(AB*)/R+ l/&U3*)
and hence
S d[AJ[BCi(u”> J”)Js,,J~(BC*) ‘F(A, BC*)I(V)E(BC; V)
=I= = r(AB*)[ V(AIF”)/R -!- l/r(AB*)][ v(BC*)/R + l/r(BC*) + [AJoUc(BC*) v(A, BP)]-
Using eqs. (6) and (10) we obtain the signal ratio
SLF/&IC = Car.n(AB; n”, J”)/a~c(BC*)xIsc;1/~~(~“, J”)1)
x El&B; Y)/&tBc: P)( V(BCY)/R +~/~(B@)+~A~]~LI~(B~)Q(A, BC*)
B(AB)/R+I(~)~(~B; 4 >-
(6)
(74
G’b)
(74
(74
(7e)
(7f)
(8)
(9)
(10)
(11)
One expects the fly out rate to exceed the rate of reaction or the pump rate. Then eq. (11) reduces to
~LIF/%IC = CCL&=; o", ~“~/u~c(BC*)XCBBci3/CBc;(o”, J31)
x[s(AB; Y)/E(BC; y)HTQ(BC*)/R+1/7(BC*)]/[Q(AB)/R~. (12)
As expected, the SuF/Sr_m ratio depends on the ratio of the cross sections for the respective processes and the-absorption coefficients of the species that are pumped by the laser. IIn addition Sm/SUc deepends on the ratio of all BC reagents to those BC reagents in a set of quantum states pumped by the laser. Finally, &&SLrc depends on the ratio of the decay rate of BC* product (by fly

382 C-T. Retmer er al. / Laser fluorescence s:udy of In + Zl
out and by emission) to the decay rate of the AB product (by fiy out). For’strongly allowed transitions, the last factor will be much larger than unity. Consequently, LIP detection is often expected to dominate LIC detection when both processes occur.
4.2. Upper bound for the In +I$ reaction cross section
The 514.5 nm laser light pumps the P(13) and R(15) lines of the (43,O) band of the 12B ‘II( ‘Z(O:) system. For a 400 IS effusive beam of 12, we estimate that [Iz]/(cI~(O, 12)3+[12(0,16)]l_is ~250 and for ?(I;) we-take ~2.5 ws [ll]. The In1 product can absorb in the visible on both the I3 ‘III- X ‘Ez and the A 3111,- X ‘2: transitions [12, 133. Schwenz et al. [14] have estimated radiative lifetimes of the indium monohalide ‘II states to be 2.4 pi, from which we will assume z(In1; Y)/E&; Y) is on the order of unity. We further assume that Au ranges from -10 to +IO. We caIculate from avaiIabIe spectroscopic data [ll, 121 that the vibrational levels o “==43-49 of the B-X system and v”=53-55 of the A-X system may absorb the 514.5 nm laser line. By analogy with the Tl+Ia reaction [2], the total cross section for the In+&. reaction is expected to be about ==lO-‘” cm’_ We suppose that an average two of the four hundred or so accessible rotational levels absorb; hence we estimate that u&InI; v”, J”) = 10-l’ cm’.
Production of these high vibration-rotation levels of In1 accounts for approximately haif of the reaction exoergicity_of 175 k.I mol-‘. If the remaining energy is equipartitioned between translation and rotation, then V(M) is about 200 ms-‘. For our excitation/reaction zone of radius -4 x lo-’ m, v(InI)/R is =5X 10” 5-l. For an effusive beam at 400 IS, V(12) is also ~200 ms-’ so that v(InI)/ p(Ig) = 1.
Substituting eq. (1) and the above numerical values into eq. (12), we obtain the result
G~~&II*> S 2.5 x lo-l6 cm’. (13)
Assuming that the total reaction cross section for In+Iz is at least as large as for In+I,, the branching ratio for the production of chemiluminescent products is ~2.5%. We conclude that even for a laser induced chemihuninescence cross section of several square &@roms, the interference from laser induced fiuorescence masks the existence of the former process. It is interesting to note that the chemiluminescent reaction In +Ft+ InI? +F which has a reaction exothermicity comparable to,In +i? is reported El41 to have an absolute chemiluminescent cross section of z.5 x lo-” cm2.
4.3. Characterization o_.F the InI product
No attempt has been made to extract detaiIed product state distributions from the excitation spectra obtained. Too little is known presently about the spectroscopy of InI, particularly for highly excited states. Furthermore, it is apparent from fig. g-that (1) the vibrational bands of the A-X and B-X electronic systems of InI overlap severely, and (2) we have nowhere near the resomtion necessary to observe individnal rotational features. Nevertheless, it is clear that a large fraction of the total energy
’ appears at In1 vibrational energy- At thermal energies absorption maxima occur for Au =O in both the A-X and B-X band systems [12]. Assuming that this trend continues to high vibrational Ieveb, i.e., that the Au =O sequence dominates, we can conclude that an inverted vibrational population distribution of In1 is produced, .peaking at v” ~50. This implies that the average fraction of total energy going into vibration, (fEj, is greater than or equal to 0.5. The hi&level of vibrational excitation suggests a direct mechanism with early release of the excess energy of reaction. By contrast, for a reaction proceeding through a long-lived complex, one wouId expect a maximum population in v” = O_ The a&Iogous reactions pf B. and Ai with F2 are -also thought to produce vibrationaI population ipve&ons <15] as do the chemiluminescent reactions of In and Ga with P2 [14]. ,.
:

The observed degree of linear polarization of the InI fluorescence, P = 12*2%, is in good agreement with that recorced previously Cl]. However, we now believe that this polarization refers to the rotational poIarization of the product molecules for these LIF experiments [16]. Because the excitation spectrum is an overiap of the A 3&-X ‘sl and the B %l-X ‘Z,’ band systems, interpretation of this polarization measurement is not possible without a detailed identification of the
resonance fluorescence branches that contribute to the observed signal and a knowledge of their individual intensities.
Acknowledgement
This work was supported by Air Force Office of Scientific Research under AFOSR 77-3363. of Scientific Research under AFOSR 77-3363 and AFOSR 81-0053.
References
r11
w
c31 c41 PI
PI
c71
R.C. Estler and R.N. Zare, 1. Am. Chem. Sot. 100 (1978) 1323. A. Geldeon, S.A. Cd&stein and P. Davidovits, J. Chem. Phys. 55 (1971) 5171. R.N. Zare and PJ. Da&dig&, Science 185 (1974) 739. J.L. Kinney, Ann. Rev. Phys. Chem. 28 (1977) 349. R.L. KoSn, C.V. Shank, E.P. Ippen and A. D&es, opt. commun. 3 (1971) 177. C.R Webster, I_. W&e and R.N. Zare. Opt. Corn- men. 35 (1980) 435. (a) J.G. PI-U& and R.N. Zare, J. Chem. Phys. 64 (1976) 774;
(b) I_,. Stein, 3. Wanner and H. Walther, J. Chem. Phys. 72 (1980) 1128.
LS] RN. Zare, Sci. Am. 236 (1977) 86 (fig. 1). [9] D.S. Ginter, M.L. Ginter and K.K. Innes, J. Phys.
Chem. 69 (1965) 2480. [lo] R.E. DruUinger and R.N. Zare, J. Chem. Phys. 51
(1969) 5538; 59 (1973) 4225. [ll] I_ Brewer and J. Tellinghuisen; J. Chem. Phys. 56
(1972) 3929. [12] (a) M. Wehrli and E. Miescher, Heiv. Phys. Acta. 7
(1934) 298. (b) M. WehrIi. Helv. Phys. Acta 7 (1934) 611.
[13] (a) S. P. Vaidya, Ph.D. Thesis, University of Baroda (1979). (b) A.B. Darji and S.P. Vaidya, Cur. Sci. 46 (1977) 486.
1141 R-W. Schwenz, L.C. Geigerland and JM. Parson, J. Chem. Phys., submitted for publication.
1151 W.W. Rice, W.M. Eeatie, R.C. Oldenborg, S.E. Johnson and P.B. Scott, Appl. Phys. Letters 28 (1976) 444.
cl61 D.A. Case. G.M. McClelland and D.R. Herschbach, Mol. Phys. 35 (1978) 541.