Embed Size (px)
Citation preview

Primarily for direct consumption by a local population,
usually small scale and low tech
SubsistenceAgriculture
Primarily for purpose of selling
products for money, often monocultures
for economies of scale
Commercial Agriculture
Agriculture & Rural Land Use – Key Topics

Large-area farms or ranches
Low inputs of labor & low output per acre
Extensive Land Use
Small-area farms or ranches
High inputs of labor & high output per acre
Intensive Land Use
Rice paddies, southeast ChinaCattle ranch, northeast Colorado

Large amount of human work is applied
per unit of output
Labor-IntensiveAgriculture
Large amount of capital (equipment and buildings used
to produce other goods) is applied per unit of output
Capital-IntensiveAgriculture
Top picture – Labor-intensive corn raising in central Mexico.
Bottom picture – Corn exported from capital-intensive U.S. farms to the
Mexican market

Subsistence – predominantly low-income regions
Intensive subsistence – subtropical monsoon areas
Shifting cultivation – tropical forests & savannas
Nomadic herding – semiarid and arid lands
Commercial – predominantly high-income regions
Crop farming – more humid climates
Livestock ranching - drylands

Probable culture-hearths of agriculture
Invention of farming & domestication of livestock (8,000–14,000 years ago) + diffusion from several source regions = shift from hunter-gatherer to shift from hunter-gatherer to agricultural societiesagricultural societies
First Agricultural Revolution

Second Agricultural RevolutionTechnological changes (starting 1600s in Western Europe; spread by 1800s to North America)
Began with new methods: crop rotation, better horse collars
Later innovations: replace human labor with machines, supplement natural fertilizers & pesticides with chemicalBeginnings of commercialization of agriculture (production of surplus for trade); enabled widespread urbanization
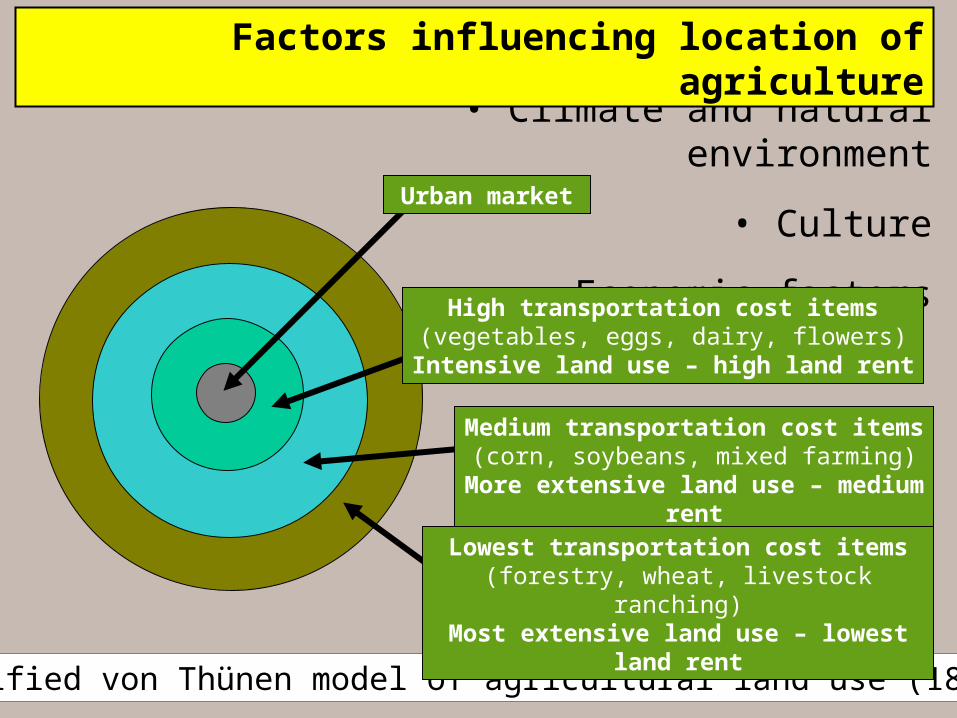
• Climate and natural environment
• Culture
• Economic factors
Simplified von Thünen model of agricultural land use (1826)
Factors influencing location of agriculture
Medium transportation cost items
(corn, soybeans, mixed farming)More extensive land use –
medium rent
Urban market
High transportation cost items(vegetables, eggs, dairy, flowers)
Intensive land use – high land rent
Lowest transportation cost items(forestry, wheat, livestock ranching)Most extensive land use – lowest
land rent

Third Agricultural Revolution GREEN REVOLUTIONSince 1960s
- hybridized grains (“Green Revolution”)- synthetic fertilizers- genetically engineered crops - vertical integration of ownership (e.g., Cargill, ConAgra,
ADM)
- globalization of productionA partial list of ConAgra’s brands
Swiss Miss Hunt’s
Van Camp’s Marie Callender’s
Wesson Hebrew National
Slim Jim Egg Beaters
Rosarita Chef Boyardee
ReddiWip Pam
Peter Pan Orville Redenbacher’s
Healthy Choice Banquet
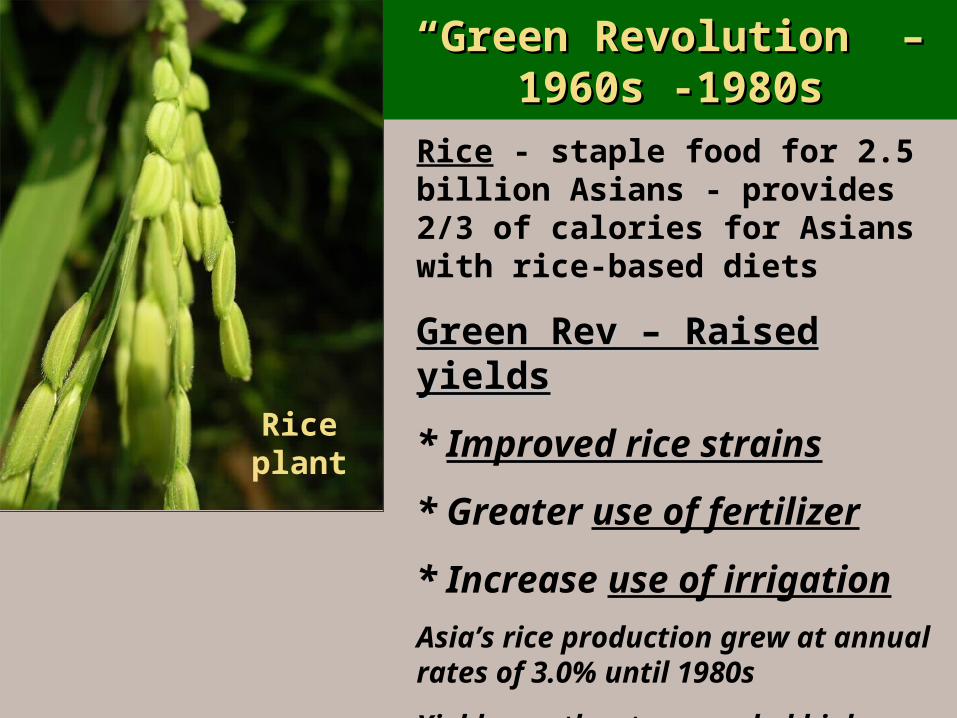
““Green Revolution” – Green Revolution” – 1960s -1980s1960s -1980s
Rice plant
Rice - staple food for 2.5 billion Asians - provides 2/3 of calories for Asians with rice-based diets
Green Rev – Raised Green Rev – Raised yieldsyields
* Improved rice strains
* Greater use of fertilizer
* Increase use of irrigation
Asia’s rice production grew at annual rates of 3.0% until 1980s
Yield growth rate exceeded high pop. growth rates of the time

““Post-Green Revolution” Post-Green Revolution” (since 1980s)(since 1980s)
Green Revolution PlussesGreen Revolution Plusses::
Countries self-sufficient in Countries self-sufficient in rice or even exporters rice or even exporters (Thai, Viet). (Thai, Viet).
Poor people benefited as Poor people benefited as yield increases caused yield increases caused real price of rice to drop.real price of rice to drop.
ProblemsProblems
Successes led to less Successes led to less concern about food concern about food security, & lesssecurity, & lessinvestment in irrigation, agric research, & rural investment in irrigation, agric research, & rural infrastructure. infrastructure.
Growth rate in rice production declined during 1985-95 Growth rate in rice production declined during 1985-95 due to drop in growth rate of rice yields.due to drop in growth rate of rice yields.
In most places, despite increasing use of fertilizers, In most places, despite increasing use of fertilizers, further increases in yields became harder to achieve & further increases in yields became harder to achieve & more costly.more costly.

Third Agricultural RevolutionBenefits
Reduced uncertainties in agriculture
Greater global exchange of ag products
Increased yields
Costs
Increased dependence on fossil fuels
Reliance on chemical inputs
Less global diversity of food products
Concentration of pollutants

Primary Secondary
TertiaryQuaternary
Sectors of the Economy
Figure 6.1 (p. 138)
Figure 6.11 (p. 150)

Background on Economic Restructuringof the U.S. and Canadian Economies
Job Competition

Figure 6.10 (p. 149)
Structural change of the economy

Least-Cost Location Theory
Cost minimization is half of profit maximization equation (along with maximizing revenues)
Cost minimization theory:- labor-cost minimization- transportation cost minimization
Cost minimization - an industrial location strategy that seeks to minimize what the firm pays to produce and distribute its products or services

Maquiladoras – foreign-owned assembly plants in Mexico (mostly textiles &
consumer electronics)
Over 11,500 maquiladoras along
border with U.S.; employ 2 million+ Mexicans
Revenues from maquiladoras, make up
85% of trade btwn Mexico and U.S.
Minimizing Labor Cost
Average work week is 60-70 hours; wages about $5.75 per
day. Women are 70% of maquiladora workforce.
Since 2000, some maquiladoras have closed as corporations move assembly-line jobs to even lower-wage
countries, mainly China.
Sources: PBS & Ingolf Vogeler

Fixed and Variable Costs Influence the Optimum Location for Economic Activity
Classical economic geography models focus
mainly on the variable cost of transportation

Determining the best location for a mfg. plant with raw materials in Minnesota, Florida, and Texas & the market in New York
(but with differing amounts of raw mat’s needed)

Weber Triangle
• Three factors:– Transport costs– Labor costs– Agglomeration
• Transport costs:– One market and two
sources:• Equal distance and
shipping costs dictates a market location
• Two weight-losing materials results in an intermediate location

Weber’s Theory of Location
• Weber’s theory results in 3 generalizations:– Using pure materials in the production process
will always dictate a market location– Weight-loss materials usage will pull the plant
closer to the sources– Intermediate location chosen most often
• No handling costs at terminal

Weber’s Theory of Location
• Labor Costs:– Location chosen always has least combined
costs• A location my have higher transport costs, but more
inexpensive labor
– Isotims: lines of equal transport cost– Isodapane: line of total transport costs (sum of
isotims)


Weber’s Theory of Location
• Agglomeration:– Weber recognized that clustering will result in a
per unit savings– Example:

Raw Material OrientedTendency for industry to locate near its
source of raw materials in order to save on transport costs
Usually occurs when raw materials lose weight in the production process (e.g., paper,
steel)
Transportation Cost Minimization

Market OrientedTendency for industry to locate near
population centers in order to save on transport costs
Occurs when product is more costly to transport than raw materials (e.g.,
beverages, glass)
Transportation Cost Minimization

Break-of-Bulk OrientedLocation between sources of raw materials and markets – for products that must be
divided and shipped from a central point of entry
Intermodal transportation – e.g., moving from rails to trucks or ships to trucks, or ports to
pipelines
Transportation Cost Minimization

Where is the best location for a steel manufacturing plant?
Recipe for steel (traditional)
Coal = 2 to 3 tons (+ energy*)
Iron ore = 1½ to 2 tons
Limestone = ¼ to ½ ton
Mix all solid ingredients. Heat at about 600º F until thoroughly melted.*
Pour molten blend into molds. Cool and serve. Makes one ton of finished steel.

The recipe for making steel has changed (new technology) How has this affected the location of
modern steel-producing areas?

Consider transport costs of a car’s components. Where’s a good place to locate
your assembly plant?

Over 50,000 U.S. auto-making jobs in these foreign-owned plants (2005)

The cost of transporting data has declined to near zero
Source: Probe Research, Inc., Telcordia (Bellcore); Progressive Policy Institute.
Low transmission costs, plus ability to digitize data, revolutionized the location choices for high-tech industry

“Post-Fordist” Production – High Tech Industry
Adapting the traditional models of economic geography
Greater flexibility of production
Less reliance on storage of inventory – seek prompt delivery of goods needed for production (“just-in-time”)
Suppliers’ location
Need to have access to fast delivery systems (= airports)
Agglomeration of management
Still occurs! High-tech innovators locate closer to airports; universities; amenities; venture capital (tends to be a “footloose” industry)
Internationalized spatial division of labor
Lower labor costs needed for production – industry locates manufacturing in lower wage areas (secondary) but tech and management stays in core area (quaternary)

Multiplier Effect
• Addition of one basic job tends to give rise to more jobs including non basic jobs– Basic Job = brings money into an urban place &
gives the city its primary function• Auto manufacturing• Coca cola plant• Aerospace industry• Movie production industry
• Adding a NON basic job does not have the same effect

Economic Base Model