Embed Size (px)
Citation preview
Primary Competition and Partisan Polarizationin the U.S. Senate1
Shigeo HiranoDepartment of Political Science
Columbia University
James M. Snyder, Jr.Departments of Political Science and Economics
Massachusetts Institute of Technology and NBER
Stephen AnsolabehereDepartment of Government
Harvard University
John Mark HansenDepartment of Political Science
University of Chicago
July, 2008
Abstract
Many observers and scholars argue that primary elections are one cause of polarization inU.S. politics. We exploit special features of the U.S. Senate, and a new data set on primaryelections, to test this hypothesis. We ¯nd little evidence that primary competition is relatedto partisan polarization in Senate roll call voting. We also ¯nd little evidence that \extreme"roll call voting records are positively correlated with primary election outcomes. On the otherhand, \extreme" roll call voting are negatively correlated with general election outcomes.
1This paper is part of a project supported by National Science Foundation Grant Number SES-0617556.The opinions, ¯ndings, and conclusions or recommendations expressed in this article do not necessarily re°ectthe views of the National Science Foundation. We thank participants at the 2008 Midwest Political ScienceAssociation Conference and David Mayhew for helpful comments and suggestions. Shigeo Hirano thanks theCenter for the Study of American Politics at Yale University for institutional and ¯nancial support.
1
1. Introduction
Party polarization in the U.S. Congress { both the Senate and the House of Representa-
tives { has risen sharply over the past three decades. The ideological division between the
parties is now at a post-war high, and a sizeable literature attempts to explain it. Perhaps
the central puzzle in this literature is the apparent disjuncture between the highly polarized
Congress and the relatively moderate public. As Fiorina et al., (2006) conclude \There is
little indication that voters are polarized now or that they are becoming more polarized"
(page 165).
Primary elections have been singled out as a chief suspect in explaining how Congress
became deeply divided when the public is not. The need to win primary elections creates a
potential motivation for Members of Congress to take extreme policy positions in order to
satisfy their party electorates (e.g., Burden 2001; Fiorina et al., 2006; Fiorina and Leven-
dusky, 2006; King, 2003). Two factors are at work. First, candidates seeking their party's
nomination take positions that satisfy their party's primary voters. Since the primary elec-
torate is assumed to have more extreme preferences than general election voters, candidates
with positions that are closer to their primary electorates are more likely to win. Second,
party activists are particularly important in primary elections, as they are more likely to
vote in primaries than other partisans and give money during primary elections.2 Theo-
retical models where candidates compete in primary and general elections but have more
polarized primary electorates formalize this idea that primary elections lead to polarization
(e.g. Aranson and Ordeshook, 1972; Coleman, 1972; Owen and Grofman, 2006).2See, e.g., Sinclair (2006, pages 29-30). Galston and Nivola (2006) speculate that this is particularly
true as districts become dominated by one party: \a profusion of one-party districts drives moderates outof Congress. In such districts, candidates have little incentive to reach out to voters across party lines.The imperative instead becomes to appeal to the base and preempt possible primary challenges from theextremes. The direct primary (or threat thereof), not the general election, becomes the de¯ning politicalevent" (Red and Blue Nation, page 25). In reviewing the various explanations for polarization, Fiorina andLevendusky (2006) write:\The structure of American electoral institutions ampli¯es the in°uence of such[committed] voters { and their impact is felt most in primary elections;" and \Our (tentative) view is thatprimaries are a more likely arena in which to ¯nd explanations of political polarization" (page 70). Fiorinaet al. (2006) point to primary election reform, such as \blanket" primaries or run-o® primaries, to helpproduce moderate candidates. They discusses the fortunes of the California Republican Party in detail. \Inless than a decade California had changed its hue from dark red to dark blue. What happened? ... Inprimary elections California Republicans nominate hard-core conservatives whose appeal is too limited todefeat even °awed Democratic candidates" (page 106).
2
An obvious problem with this explanation is that most states had adopted direct pri-
maries by the 1930s, and polarization declined from the 1940s through the 1960s and began
to rise in the 1980s. In response, scholars have argued that the impact of primaries di®ers
over time, because the parties primary electorate changed. In particular, primary electorates
sorted ideologically in the 1980s and 1990s (Fiorina et al., 2006) and primary turnout de-
clined, further increasing the pull of activists (King, 2003). Hence, although the general
electorate has not become more ideologically polarized, the primary electorates may have.
Survey evidence shows that voters do appear to be ideologically sorting into parties to a
greater degree during the period Congress became more polarized. Turnout may have fur-
ther magni¯ed this gap. Empirically it does appear primary turnout has been declining, but
whether this has a®ected the ideological composition of the primary voters is still open to
debate.
There is a clear logic behind the argument that primary electorates cause polarization,
and there is some circumstantial evidence consistent with the claim. Direct evidence of a
connection has been elusive. Gerber and Morton (1998) provide some evidence by exploiting
the connection between primary laws and the partisan composition of voters eligible to vote
in primaries. They ¯nd that Members of Congress nominated in \closed" primaries tend
to have policy positions that are farther from the preferences of their general electorate
than those nominated in \open" primaries. However, as McCarty, et al., (2006) point out,
the e®ect is relatively small. They go on to write that \the evidence for the culpability of
primaries is very thin" (page 70). Other recent empirical work has also found little connection
between polarization and primaries in the U.S. House between 1992 and 2006 (Pearson and
Lawless, 2007).
To examine the connection between primary elections and congressional polarization, we
consider two key questions. First, is the ideological gap between Republicans and Democrats
in Congress higher when the legislators face more competitive primary elections? Sections 2
and 3 examine the correlations between competition and polarization for individual members
and for Congress as a whole; the presence of such a correlation is central to the case that
primaries cause polarization.
3
Section 4 focuses on a second question: do the bene¯ts to ideological extremism in primary
elections out weigh the costs of ideological extremism in general elections? In this section,
we examine the relationship between DW Nominate scores and general election competition,
and compare this with the relationship between DW Nominate scores and primary election
competition.
Although both of these issues have been discussed in the existing literature, previous
studies have been criticized for problems of measurement and research design. This paper
addresses these concerns in three ways. First, we use a new measure of primary competition
based on primary election returns for all statewide o±ces. This is less likely to be a®ected
by the endogeneity concerns than other measures commonly used in the literature.3 Second,
we use exit poll surveys and turnout data to measure directly the degree of polarization in
primary electorates. Third, we exploit the \multi-member district" feature of the Senate to
control for certain unobserved characteristics of senators' primary and general electorates
that may a®ect polarization. The third point implies that our analysis is less likely to su®er
from omitted variable bias than many previous studies.
The bottom line: We ¯nd no evidence that primaries contribute substantially to polar-
ization in roll call voting in the U.S. Senate. Moreover, we ¯nd evidence that senators have
an incentive not to cater to extremist primary voters. Senators do gain votes in the primaries
by taking relatively extreme positions, but they do lose signi¯cant support in the general
election from such a strategy.
2. Senate Polarization and Primary Competition
Roll call voting scores have become a common method for measuring the increase in
partisan polarization in the U.S. Congress. Figure 1 plots the gap in DW-Nominate scores
between the average senator by party outside the south. The ¯gure illustrates the rise in
the partisan polarization of Senate roll call voting since the 1970s. Figure 1 also illustrates3Existing studies of primary competition and congressional roll call voting tend to use competition in
congressional primaries (e.g., Burden, 2004; Pearson and Lawless, 2007). One concern with this measure ofprimary competition is that the expected policy position of congressmen may a®ect whether the congressmenface a serious challenge in their primary.
4
that a similar pattern of partisan polarization exists in even if we focus on senators in split
delegations (i.e., delegations with one Democrat and one Republican).4
To examine whether primary competition provides an incentive for senators to take more
extreme positions, we would ideally like to compare situations with and without primaries.
We cannot do this, however, since all states now use primaries to nominate senate candidates.
Instead, we focus on the variation in the level of primary competition both across and
within states and also across elections. The logic is that senators in states with competitive
primaries have an stronger incentive to take roll call voting positions which are in line with
their primary electorates to in order avoid losing in their next primary election.
Our main focus is on whether the degree of primary competition in a state is related to the
polarization of that state's Senate delegation. The di®erences in primary competition across
states may arise due to state-speci¯c characteristics, such as ballot access laws, campaign
¯nance laws, other elections laws such as the use of pre-primary conventions, and the strength
and structure of party organizations. We would expect this variation across states to a®ect
the incentives senators have to respond to their primary electorate irrespective of whether
the senators personally face primary challengers. Furthermore this variation is unlikely to
be strongly related to individual senator's roll call voting records, which avoids some of the
problems with using primary competition in senate elections themselves.
We measure the competitiveness of the primary environment using the average level of
primary competition in previous primary elections for non-Senate statewide o±ces. We
construct our measure using a new data set of primary election outcomes for all statewide
o±ces.5 We use two di®erent methods for measuring of primary competition: (i) the average
number of incumbents contested in previous primary elections; (ii) the average number of
incumbents who win less than 60% of the vote in previous primary elections. We use a
six-year window { when predicting roll call for the congress elected in year t, we use the
primary elections from years t¡6 to t¡1.6
4We exclude the south in order to make the comparison with split delegations more meaningful. Prior to19xx there were almost no split delegations in the south.
5See Ansolabehere et al. (2006) for a description of this data set.6We checked the sensitivity of our estimates to the length of the window, and also to the choice of
which races are used { all races, incumbents-contested races only, and open seat races { in constructing the
5
We also present analyses focusing on the primary competition the senators themselves
face. One possibility is that senators' roll call voting may be most responsive to their own
primary election threats. This is the measure most commonly used in the existing literature
(e.g., Burden, 2004; Pearson and Lawless, 2007). However, as we mentioned above, the
competition congressmen face in primary elections may be related to the congressmen's own
policy positions. If more extreme politicians face less competition, then we suspect the
estimates would be biased downwards. We therefore also present results using competition
for non-Senate statewide o±ces as an instrument for Senate primary competition.
This section is divided into two parts to examine whether congressional polarization is
occurring through the adaptation of incumbent senators' roll call voting positions or through
the replacement of more moderate senators. We ¯rst examine whether changes in the dif-
ference between Democratic and Republican senators' roll call voting records within a state
is related to the competitiveness of primary elections in the senators' state. We then move
to a discussion of whether the di®erence between Democratic and Republican senators' roll
call voting positions is related to the competitiveness of primary elections when a senator is
¯rst elected.
2.1 Adaptation and Competitive Primaries
One potential explanation for the increasing polarization in Congress is that incumbent
congressmen adjust their roll call voting positions in response to changes in the competitive-
ness of primary elections. This is the adaptation argument.
We begin with two simple but highly informative scatterplots. If incumbents are changing
their behavior in response to primary competition then we would expect that incumbents
should be facing more primary challengers during the period when Congress is most polarized.
Figure 2 plots the two measures of primary competition for races with incumbents. Figure
2 also includes separate lines for primary elections for non-Senate statewide o±ces and for
the Senate. As the ¯gure shows, the degree of primary competition faced by incumbents has
primary competition measures. The substantive interpretation of the ¯ndings reported below are robust tothese changes in measurement.
6
been decreasing over time.7 These trends raise immediate doubts regarding the relationship
between primary competition and polarization of incumbents.
Figure 3 plots the gap in DW-Nominate scores between senators for the two parties
against our two measures of primary competition. We ¯rst average the DW-Nominate scores
for all the senators from the same party within a decade and then use the absolute value of
the di®erence between the average DW-Nominate score for each party. The two measures
of competition are also averaged over each decade.8 If incumbent senators' roll call voting
records are responding to competition in the primaries then we would expect to observe
a positive relationship between the average levels of primary competition and the average
gap in senators' roll call voting positions. However, the simple scatterplots in Figure 3 do
not reveal any readily observable correlation between these two measures. If anything, the
correlation appears negative.
To estimate the relationship between congressional polarization and primary competition
we run the following regression:
Git = ®i + µ1Cit + °t + ²it (1)
where Git is the gap in DW-Nominate scores between the Democratic and Republican sen-
ators in state i in congressional session t; Cit is the measure of primary competition in state
i at time t; and ®i and °t are state and Congress ¯xed e®ects, respectively.
We focus on split-party Senate delegations since in these cases we have a DW-Nominate
score for senators from each party. The gap in DW-Nominate scores for split delegations
takes into account state and year speci¯c factors. Primary competition is measured using
elections to all non-Senate statewide o±ces which include an incumbent. As noted above,
we use the proportion of races that are contested and the proportion of races in which the
winner won by less than 60% of the vote. These measures re°ect the competitiveness of
the primary election environment in each state. We also included state ¯xed e®ects in some
of the speci¯cations.9 The results show no statistical signi¯cant correlation between either7This is consistent with the patterns described in Ansolabehere, et al., (2006).8Here we use both open seat and incumbent-challenger primaries in our measure of competition. The
¯gures do not reveal any signi¯cant association when we limit the primary competition measure to eitheropen seat or incumbent-challenger elections.
9We also allowed the state ¯xed e®ect to vary by decade but this did not signi¯cantly change the results.
7
measure of primary competition and the partisan gap in DW-Nominate scores for senators
in states with split party delegations.
The middle rows of Table 1 present the results using competition for Senate elections
instead of previous statewide o±ces. In this case primary competition is either an indicator
variable for whether the senator was contested in his/her primary race, or an indicator
variable for whether the senator won his/her primary race by less than 60% of the vote.
Again we ¯nd no evidence for a statistically signi¯cant association between this variable and
the DW-Nominate gap in split-party Senate delegations.
The bottom rows of Table 1 present the results using previous primary contestation for
non-Senate statewide o±ces as an instrument for Senate contestation. This is to address the
potential e®ect incumbents' roll call voting positions may have on the degree of competition
they face in their primary election. As we might expect, the coe±cient on contestation
increases in magnitude but the standard errors also increase.10
While these results are statistically insigni¯cant, are they, perhaps, substantively signif-
icant? A one standard deviation increase in primary contestation for other statewide o±ces
is associated with a 0.01 to 0.02 increase in the gap in DW-Nominate scores of split dele-
gations depending upon the speci¯cation. This is less than 3% of the average gap in the
DW-Nominate scores of these split delegations.11 Even for close primary elections, a one
standard deviation increase in close primary competition is associated with an increased gap
in DW-Nominate scores that is less than a 5% of the average gap in DW-Nominate scores
for split delegations. Having a competitive Senate election is associated with at most a 0.07
larger gap in DW-Nominate scores. The relationship appears stronger when we use pri-
mary contestation for non-Senate statewide o±ces as an instrument for close Senate primary
competition, but the coe±cients are quite imprecisely estimated.
2.2 Replacement and Competitive Primaries
A number of scholars have noted that changes in representatives' roll call voting records10The results are not in the table but are available upon request.11Even if we add one standard error to the point estimate for primary competition the substantive re-
lationship is still quite small { i.e. less than 5% of the average gap in the DW-Nominate scores of splitdelegations.
8
are more likely to occur through replacement than through adaptation (Stone, 1980; Poole,
1997). Thus we examine whether the degree of primary competition a senator faced in
his/her ¯rst election a®ects the partisan gap in roll call voting positions with states' Sen-
ate delegations. Theriault (2006) claims that congressional polarization is due mainly to
replacements.
As above, we begin by examining a few simple scatterplots. Figure 4 plots the level of
primary competition for open seats over time. Primary competition for open seats di®ers
from the competition for incumbents in two important respects. First, the overall level of
competition is higher for open seats. Second, the level of competition has remained relatively
stable over time. The proportion of contested races has actually increased slightly over time.
While primary competition for open seats has not increased as dramatically as the gap in
senators' roll call voting scores, at least not moving in the opposite direction, as is the case
for primaries involving incumbents shown in Figure 2 above.
In Figure 5 we plot the di®erence between the DW-Nominate score for senators and the
senators they replace against the di®erence in primary competition the senators faced when
¯rst elected. The senators' DW-Nominate scores are for the Congress just after they are
¯rst elected. Again there is no obvious pattern of replacements having more extreme DW-
Nominate scores when they face more competitive primary election environments than the
senators they are replacing.
We provide another test of whether congressional polarization and primary competition
are related by estimating the following speci¯cation:
Nit = ®i + µCit + °t + ²it (2)
where Nit is DW-Nominate score of a freshman senator in state i in the ¯rst two years
following their ¯rst election at time t; Cit is again the measure of primary competition in
state i at time t; and ®i and °t are state and year ¯xed e®ects, respectively. We estimate
equation (2) separately for Democrats and Republicans.
The top rows of Table 2 present the results using previous primary election competition for
non-Senate statewide o±ces. As above, primary competition is measured by the proportion
of races contested, or the proportion of races where the winner receives less than 60% of
9
the vote. We ¯nd no evidence for a statistically signi¯cant relationship between the DW-
Nominate score of senators in their freshman term and the level of primary competition
during their ¯rst election.12 The point estimate of µ̂ is also relatively small.
In the middle rows of Table 2 we present the results using the indicator variable for
whether the senator faced a primary election threat in his/her ¯rst election. Again we
¯nd no evidence that Senate primary competition is related to the DW-Nominate scores of
freshman senators. As the bottom rows of Table 2 illustrate, this is also true even when we
use the previous primary competition for non-Senate statewide o±ce as an instrument for
Senate competition.
In addition to being statistically insigni¯cant, the estimates in Table 2 are also substantive
insigni¯cant. A one standard deviation change in primary contestation is associated with
shift in DW-Nominate scores which is less than 8% of the average score. The relationship is
even weaker for a one standard deviation change in contestation of close primary election.
3. Congressional Polarization and Electoral Polarization
A crucial component of the folk wisdom regarding the link between congressional polar-
ization and primary elections is that primary electorates are more polarized than general
electorates and perhaps even more polarized than partisans. V.O. Key (1956) wrote:
The e®ective primary constituency of the state as a whole may come to consist
predominantly of the people of certain sections of a state, of persons chie°y of
speci¯ed national origin or religious a±liation, or people especially responsive
to certain styles of political leadership or shades of ideology, or of other groups
markedly unrepresentative in one way or another of the party following.13
However, the empirical evidence that primary election voters are more extreme than gen-
eral election voters is mixed. Whether one observes a di®erence in the ideological posi-
tions of these two electorates depends in part upon the states and the elections investigated12We also ran speci¯cations allowing the state ¯xed e®ects to trend. We found similar results with this
speci¯cation; however, with the small number of observations, these models are particularly not very wellidenti¯ed.
13Key as quoted in Crotty and Jackson (1985, 86).
10
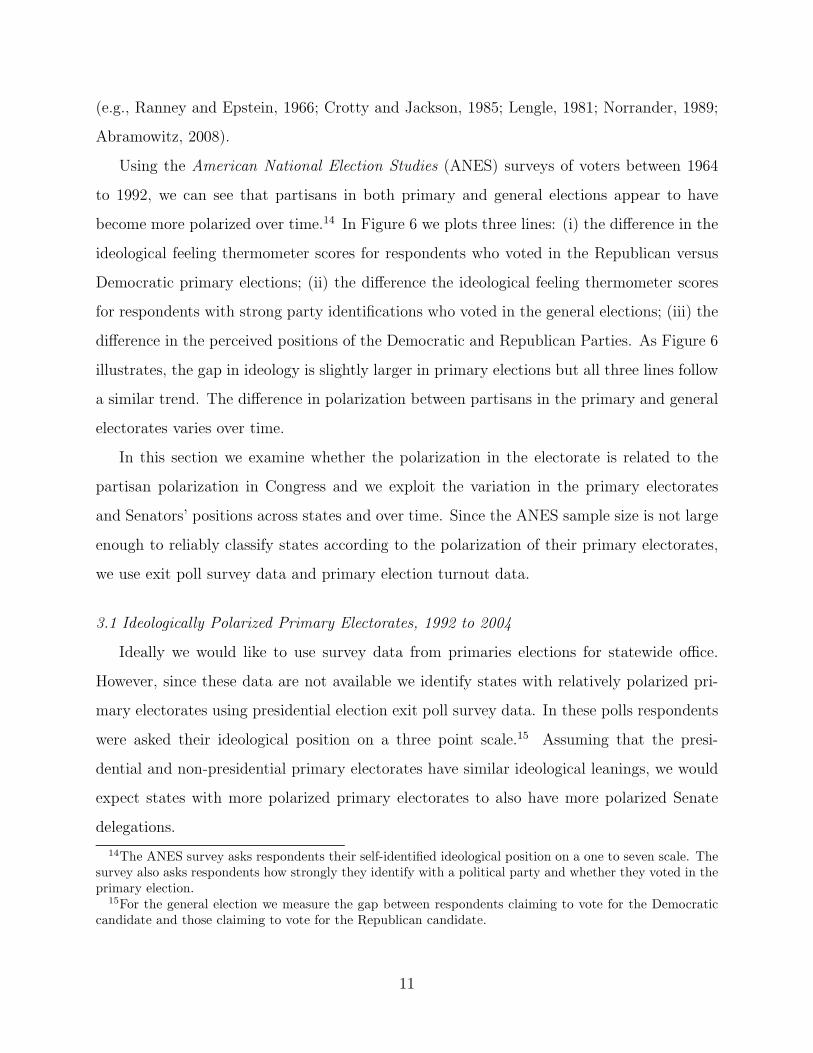
(e.g., Ranney and Epstein, 1966; Crotty and Jackson, 1985; Lengle, 1981; Norrander, 1989;
Abramowitz, 2008).
Using the American National Election Studies (ANES) surveys of voters between 1964
to 1992, we can see that partisans in both primary and general elections appear to have
become more polarized over time.14 In Figure 6 we plots three lines: (i) the di®erence in the
ideological feeling thermometer scores for respondents who voted in the Republican versus
Democratic primary elections; (ii) the di®erence the ideological feeling thermometer scores
for respondents with strong party identi¯cations who voted in the general elections; (iii) the
di®erence in the perceived positions of the Democratic and Republican Parties. As Figure 6
illustrates, the gap in ideology is slightly larger in primary elections but all three lines follow
a similar trend. The di®erence in polarization between partisans in the primary and general
electorates varies over time.
In this section we examine whether the polarization in the electorate is related to the
partisan polarization in Congress and we exploit the variation in the primary electorates
and Senators' positions across states and over time. Since the ANES sample size is not large
enough to reliably classify states according to the polarization of their primary electorates,
we use exit poll survey data and primary election turnout data.
3.1 Ideologically Polarized Primary Electorates, 1992 to 2004
Ideally we would like to use survey data from primaries elections for statewide o±ce.
However, since these data are not available we identify states with relatively polarized pri-
mary electorates using presidential election exit poll survey data. In these polls respondents
were asked their ideological position on a three point scale.15 Assuming that the presi-
dential and non-presidential primary electorates have similar ideological leanings, we would
expect states with more polarized primary electorates to also have more polarized Senate
delegations.14The ANES survey asks respondents their self-identi¯ed ideological position on a one to seven scale. The
survey also asks respondents how strongly they identify with a political party and whether they voted in theprimary election.
15For the general election we measure the gap between respondents claiming to vote for the Democraticcandidate and those claiming to vote for the Republican candidate.
11
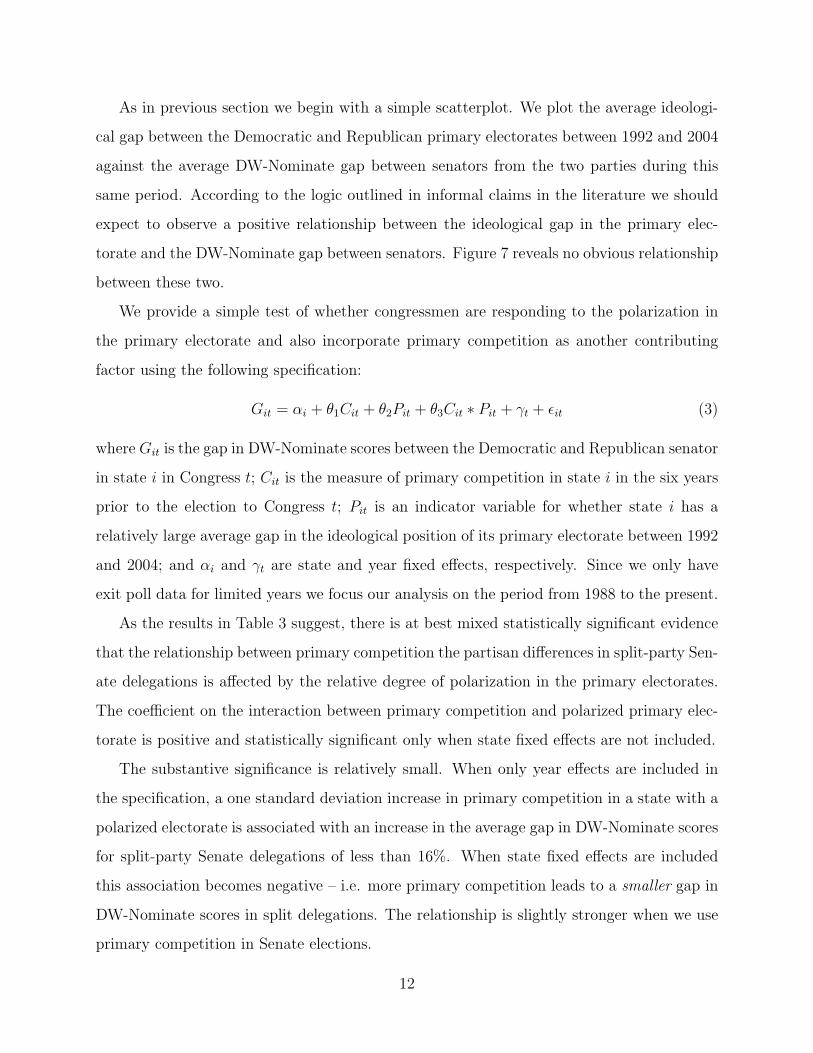
As in previous section we begin with a simple scatterplot. We plot the average ideologi-
cal gap between the Democratic and Republican primary electorates between 1992 and 2004
against the average DW-Nominate gap between senators from the two parties during this
same period. According to the logic outlined in informal claims in the literature we should
expect to observe a positive relationship between the ideological gap in the primary elec-
torate and the DW-Nominate gap between senators. Figure 7 reveals no obvious relationship
between these two.
We provide a simple test of whether congressmen are responding to the polarization in
the primary electorate and also incorporate primary competition as another contributing
factor using the following speci¯cation:
Git = ®i + µ1Cit + µ2Pit + µ3Cit ¤ Pit + °t + ²it (3)
where Git is the gap in DW-Nominate scores between the Democratic and Republican senator
in state i in Congress t; Cit is the measure of primary competition in state i in the six years
prior to the election to Congress t; Pit is an indicator variable for whether state i has a
relatively large average gap in the ideological position of its primary electorate between 1992
and 2004; and ®i and °t are state and year ¯xed e®ects, respectively. Since we only have
exit poll data for limited years we focus our analysis on the period from 1988 to the present.
As the results in Table 3 suggest, there is at best mixed statistically signi¯cant evidence
that the relationship between primary competition the partisan di®erences in split-party Sen-
ate delegations is a®ected by the relative degree of polarization in the primary electorates.
The coe±cient on the interaction between primary competition and polarized primary elec-
torate is positive and statistically signi¯cant only when state ¯xed e®ects are not included.
The substantive signi¯cance is relatively small. When only year e®ects are included in
the speci¯cation, a one standard deviation increase in primary competition in a state with a
polarized electorate is associated with an increase in the average gap in DW-Nominate scores
for split-party Senate delegations of less than 16%. When state ¯xed e®ects are included
this association becomes negative { i.e. more primary competition leads to a smaller gap in
DW-Nominate scores in split delegations. The relationship is slightly stronger when we use
primary competition in Senate elections.
12
3.2 Turnout and Polarized Primary Electorates
Another common claim in the literature is that the polarization in the primary electorate
is related to turnout in primary elections (e.g., King, 2003). When turnout declines, only
the most extreme voters are assumed to participate in the primary elections. Turnout for
primary elections for statewide o±ces does appear to have declined during the period when
Congress appears to have become more polarized. Figure 8 plots turnout for statewide
primary elections as a proportion of total population averaged by decade. We use the highest
turnout among the o±ces as a measure of turnout for that election year.16 There appears
to be a decline in average level of turnout for state primaries between the 1970s and 2000s.
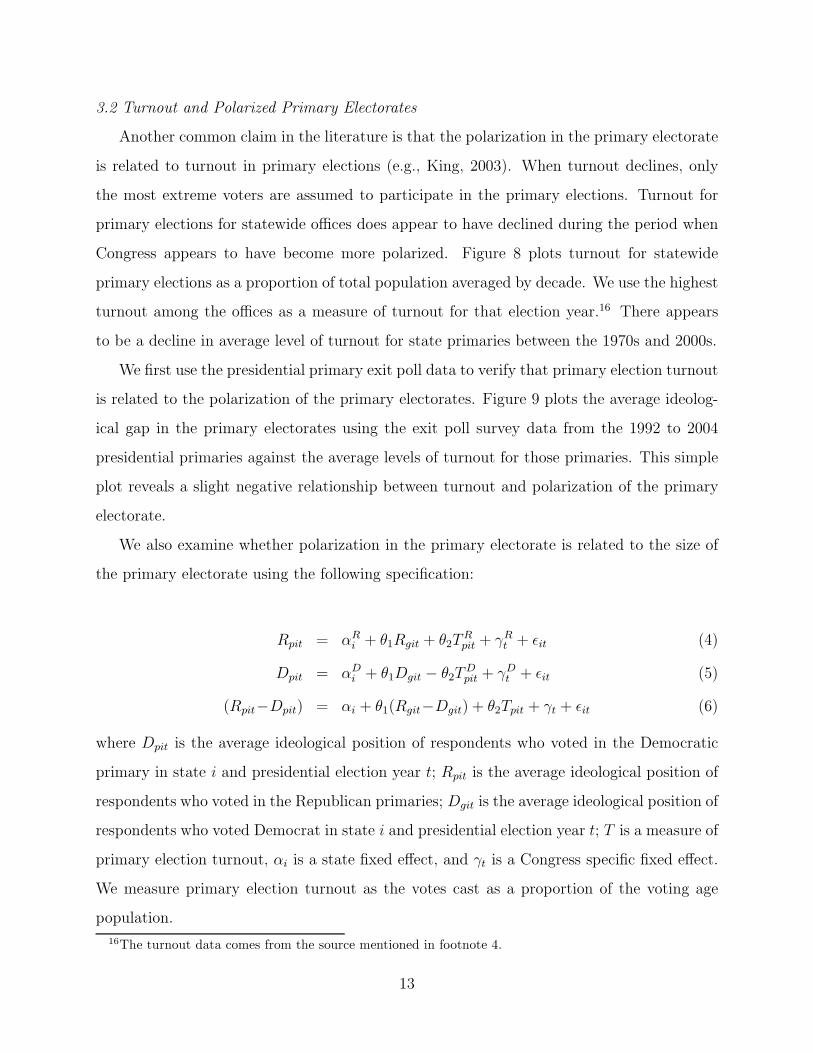
We ¯rst use the presidential primary exit poll data to verify that primary election turnout
is related to the polarization of the primary electorates. Figure 9 plots the average ideolog-
ical gap in the primary electorates using the exit poll survey data from the 1992 to 2004
presidential primaries against the average levels of turnout for those primaries. This simple
plot reveals a slight negative relationship between turnout and polarization of the primary
electorate.
We also examine whether polarization in the primary electorate is related to the size of
the primary electorate using the following speci¯cation:
Rpit = ®Ri + µ1Rgit + µ2TRpit + °Rt + ²it (4)
Dpit = ®Di + µ1Dgit ¡ µ2TDpit + °Dt + ²it (5)
(Rpit¡Dpit) = ®i + µ1(Rgit¡Dgit) + µ2Tpit + °t + ²it (6)
where Dpit is the average ideological position of respondents who voted in the Democratic
primary in state i and presidential election year t; Rpit is the average ideological position of
respondents who voted in the Republican primaries; Dgit is the average ideological position of
respondents who voted Democrat in state i and presidential election year t; T is a measure of
primary election turnout, ®i is a state ¯xed e®ect, and °t is a Congress speci¯c ¯xed e®ect.
We measure primary election turnout as the votes cast as a proportion of the voting age
population.16The turnout data comes from the source mentioned in footnote 4.
13
In Table 4 we present our estimates of µ̂. The results provide some evidence that the
turnout for primaries may be related to the ideological competition of the primary electorates.
The ideological gap between the Democratic and Republican presidential electorates tend
to be negatively correlated with overall turnout in the presidential primaries, but only sta-
tistically signi¯cant when both state and year ¯xed e®ects are included. However, when we
examine each party separately we ¯nd that states where a party has high primary turnout
also tends to have more moderate primary electorates on average.17 Although the results
are sensitive to whether certain ¯xed e®ects are included, this does provide some evidence
that the ideological composition of the primary electorate across states may be related to
the turnout levels in the states. As above, since we do not have primary election exit poll
surveys for statewide o±ce elections we assume that a similar pattern between turnout and
electoral polarization exists in elections for statewide o±ces.
We examine whether congressmen's roll-call voting behavior is related to primary election
turnout using a speci¯cation similar to equation (3):
Git = ®i + µ1Cit + µ2Tit + µ3CitTit + °t + ²it (7)
The key di®erence between this equation and equation (3) is that we substitute a variable
for turnout, Tit, for the indicator for polarized electorates. Tit is the average of the maximum
turnout for a statewide o±ce, excluding Senate, each year for the six years prior to year t.18
Table 5 presents our estimates of µ̂1, µ̂2 and µ̂3 in the above equation. µ̂1 and µ̂3 are
statistically signi¯cant. Substantively, when primary contestation is one standard deviation
more competitive, moving from one standard deviation above the average turnout to one
standard deviation below the average turnout is associated with roughly a 20% increase
above the average gap in DW-Nominate scores in split delegations. However, the describing
the relationship between turnout, primary competition and senators' roll call voting is com-
plicated by the strong correlation between turnout and primary competition. Competitive17Low ideology scores indicate more liberal positions. Thus a positive coe±cient on turnout indicates that
higher turnout is related with more conservative ideological positions.18We also include an interaction term. Although the coe±cient on the interaction term is negative and
signi¯cant as we might expect, the interpretation of this association is di±cult to interpret. Since primaryturnout and competition are highly correlated, simply including competition or turnout squared yields verysimilar results.
14
primaries also have relatively high turnout { e.g. there are no observations one standard
deviation above the average primary contestation level and below the average turnout level.
Moving from one standard deviation above average turnout and primary contestation to one
standard deviation below average turnout and primary contestation is associated with less
than a 2% increase above the average gap in DW-Nominate scores.
4. Roll Call Voting Positions and Electoral Outcomes
Despite the claims that competition in primary elections provide an electoral incentive for
representatives to take more extreme policy positions, the results in the above sections sug-
gest that there is little evidence for an observable relationship between primary competition
and polarization in Congress. This raises questions regarding whether there is much of an
electoral incentive for senators to take extreme roll call voting positions. Although there are
some empirical ¯ndings that House members with relatively extreme roll call voting scores
do better in primary elections (Brady et al., 2007), there are also ¯ndings that there are
electoral bene¯ts in the general elections from taking more moderate roll call voting posi-
tions (Ansolabehere et al., 2001; Canes-Wrone et al., 2001). Even though primary elections
do provide some electoral incentive for senators to take extreme positions, whether or not a
candidate will respond to these incentives depends also upon how their position will a®ect
the general election outcomes.
In this section we ¯rst re-examine the evidence that partisan roll call voting positions are
correlated with primary election outcomes. We then compare these results to the relationship
between roll call voting positions and general election outcomes to examine the potential costs
candidates face as a result of taking extreme positions. In the third subsection we examine
the political careers of moderate senators to determine whether they are more likely to leave
Congress by being defeated in primary election as the popular claims would suggest.
4.1 Roll Voting and Primary Election Outcomes
A common claim is that the primary electorates support candidates who take more
extreme policy positions. Brady, et al. (2007) provide some empirical evidence that the
distances between U.S. House members' roll call voting positions and their general election
15
constituency preferences are negatively correlated with primary election outcomes. Their
estimates rely on relatively weak measure of district partisanship. By focusing on the Senate
our analysis takes advantage of periods when senators from the same party represent the
same geographic constituency.
We assume that district preferences are relatively stable and use a ¯xed e®ect to capture
the variation in the preferences of primary electorates across districts. Thus, we exploit
the variation in roll call voting positions of members representing the same district. The
multi-member districts for the U.S. Senate have the advantage of potentially having states
represented by two incumbent senators from the same party with di®erent policy position.
Since the senators from the same states are essentially representing the same primary election
constituencies, we can examine whether the variation in their roll call voting positions is
correlated with their vote shares in the primary elections. Conventional wisdom is that
senators with relatively partisan roll call voting positions will have relatively high vote shares
in the primary elections.
Since many primary elections are uncontested, we ¯rst examine whether senators' roll
call voting positions are related to whether they face primary challengers. For this analysis
we use a simple linear probability model. The dependent variable is whether the senator is
challenged in the primary. The main variable of interest is the candidates' roll call voting
positions. For incumbents this is their position during the two years prior to the election.
For open seats this is the two years just following their election. To be consistent with the
above analyses we use DW-Nominate to measure roll call voting scores.19 We also include
the degree of primary contestation for all other statewide o±ces in the previous eight years
by party as well as ¯xed e®ects for states and years.
The results presented in Table 6 suggest that there is little statistically signi¯cant evi-
dence that senators' DW-Nominate scores are correlated with whether they are challenged
in primary elections. For both incumbent Democrats and Republicans the coe±cient on
the DW-Nominate score is in the expected direction, i.e. the more extreme the candidate's
position the less likely she will face a primary challenge, however the coe±cients are not19For each party a higher DW-Nominate score indicates a more extreme roll call voting position.
16

statistically signi¯cant. For open seat races the coe±cients on the DW-Nominate score is
statistically insigni¯cant and in the opposite of the expected direction, i.e., the more extreme
candidates' positions are more likely to have faced primary challengers.
The second relationship of interest is whether the roll call voting position of senators who
are challenged in a primary is related to the number of votes they receive in the primary
election. Again the conventional wisdom is that senators with relatively more extreme policy
positions should have relatively higher vote shares in the primary. We measure senators' vote
shares as the proportion of votes cast for the top two candidates.20 The main independent
variable is the senator's roll call voting position. We include state ¯xed e®ects to account
for di®erences in primary electorates across states.21
The results in Table 7 show that only the coe±cient on DW-Nominate scores for Republi-
can incumbents is in the expected direction. For incumbent Democrats, open seat Democrats
and open seat Republicans, senators with relatively extreme roll call voting positions have
relatively low vote shares in primary elections. However, none of the coe±cients in Table
7 are statistically signi¯cant. Thus, we ¯nd little evidence that senators' roll call voting
positions a®ect the electoral outcomes in the primary elections.
4.2 Roll Voting and General Election Outcomes
As the above discussion suggests, primary elections appear to provide little electoral
motivation for senators to take an extreme roll call voting position. We now turn to the
question of whether extreme roll call voting positions a®ect senators' electoral success in
general elections.
In section 4.1 we used a simple ¯xed e®ects regression and assumed that district pref-
erences were being captured by the ¯xed e®ect. We use a similar speci¯cation to test the
relationship between senators' roll call voting positions and their support in general elec-
tions. The dependent variable is the senator's vote share of the two party vote. Again the20We also did the analysis using senators' vote shares as a proportion of all votes cast and the substantive
interpretation of the results do not signi¯cantly change.21To deal with the selection issue we considered using a Heckman selection model with contestation for
all other statewide o±ces in the previous eight years but as the results in Table 6 illustrates, contestation inother statewide o±ces is only weakly related to contestation in Senate elections.
17
main independent variable of interest is the senator's roll call voting position, as measured
by their DW-Nominate score. We also include state and year ¯xed e®ects. However, in some
speci¯cations we also include measures of the state normal vote using the average vote share
of downballot o±ces for previous elections.
The results in Table 8 provide relatively strong evidence that incumbent senators with
extreme roll call voting positions have lower vote shares in the general election than moder-
ates. The increasing competitiveness of general election competition suggests that incumbent
senators who wish to retain their position have a strong incentive to take moderate positions.
The evidence is not as robust for open seat races.
4.3 What Happens to Moderates in Congress?
Finally, if taking moderate policy positions leave candidates vulnerable in primary elec-
tions, then we would expect a disproportionately large number of moderate congressmen
to leave o±ce because they lose a primary election. We de¯ne moderate senators as sen-
ators as Democrats with DW-Nominate scores of greater than -0.15 and Republicans with
DW-Nominate scores of less than 0.10.
Table 9 lists the causes for why moderate senators left o±ce. We focus on senators who
served for more than one term between the 91st to the 110th Congress. Of the 25 moderate
Democrats in the Senate during this period only 3 left o±ce due to being defeated in a
primary. Of the 25 moderate Republican only 2 left o±ce because due to being defeated
in a primary. Overall twice as many moderate senators left o±ce because they lost in the
general elections than because they lost in a primary. Of course we might suspect that these
senators may be strategically retiring before losing in the elections. Also moderate senators
who succeed in winning o±ce may be di®erent than other senators. Nonetheless, the reasons
for leaving o±ce at least suggest that primary competition does not have an obvious role in
forcing moderate incumbent senators out of o±ce.
5. Conclusions
Today, the political parties in Congress are almost completely ideologically distinct: there
are almost no Republican members of Congress considered to the left of the most conser-
18
vative Democratic member of Congress. That degree of di®erentiation re°ects a ¯fty-year
transformation of Congressional politics (e.g., McCarty, et al., 2006). Liberal Republicans
and conservative Democrats were common in the 1950s; today they are nearly extinct. Why
this division emerged has become one of the most vexing problems for American politics.
Primary elections have been viewed as one of the chief causes of the rising division
between the parties in the U.S. Congress. A plausible argument can be made that they
may contribute to increased extremism in legislative voting. Over the past three decades
voters have sorted into increasingly ideological distinct camps, with Democratic primary
voters becoming a more purely liberal group and Republican primary voters becoming a
more purely conservative group. To get elected, it seems obvious that candidates must cater
to their parties' core constituencies ¯rst and, then, run for the general election.
Compelling though that argument sounds, it lacks much empirical grounding. We ¯nd
little or no evidence of a link between primary election competition and extremism or mod-
eration on roll call votes in the U.S. Senate. In particular, variation in primary competition
and/or turnout does not appear to a®ect the roll call voting of members of the Senate in
any signi¯cant way.
19
REFERENCES
Abramowitz, Alan. 2008. \Don't Blame Primary Voters for Polarization." The Forum 5:Article 4.
Ansolabehere, Stephen, J. Mark Hansen, Shigeo Hirano, and James M. Snyder, Jr. 2006.\The Decline of Competition in U.S. Primary Elections, 1908-2004" In The Marketplaceof Democracy eds. Michael McDonald and John Samples, Brookings Institution Press.Pages 74-101.
Ansolabehere, Stephen, James M. Snyder, Jr., and Charles Stewart III. 2001. \CandidatePositioning in U.S. House Elections," American Journal of Political Science 45:136-159.
Aranson, Peter H. and Peter C. Ordeshook. 1972. \Spatial Strategies for SequentialElections." In Probability Models of Collective Decision Making, ed. Niemi, RichardG. and Herbert F. Weisberg. Columbus: Charles E. Merrill. Pages 298-331.
Burden, Barry C. 2001. \The Polarizing E®ects of Congressional Primaries." In Con-gressional Primaries in the Politics of Representation, ed. Peter F. Galderisi, MichaelLyons, and Marni Ezra. Lanham, MD: Rowman and Little¯eld.
Burden, Barry. 2004. \Candidate Positioning in US Congressional Elections." BritishJournal of Political Science 34:211-227.
Brady, David, Hahrie Han, and Jeremy C. Pope. 2007. \Primary Elections and CandidateIdeology: Out of Step with the Primary Electorate?" Legislative Studies Quarterly 32:79-105.
Canes-Wrone, Brandice, David W. Brady and John F. Cogan. 2002. \Out of Step, Outof O±ce: Electoral Accountability and House Members' Voting." American PoliticalScience Review 96: 127-140.
Coleman JS. 1972. \The positions of political parties in elections." In Probability Modelsof Collective Decision Making, eds. Niemi RG, Weisberg F. Columbus, OH: CharlesE. Merrill. Pages 332357.
Crotty, William J., and John S. Jackson, III. 1985. Presidential Primaries and Nomina-tions. Washington: Congressional Quarterly Press.
Fiorina, Morris P., Samuel J. Abrams, and Jeremy C. Pope. 2005. Culture war? The Mythof a Polarized America. New York: Pearson Longman.
Fiorina, Morris P. and Matthew S. Levendusky. 2006. \Disconnected: The Political Classversus the People." In Red and Blue Nation? Characteristics and Causes of Amer-ican Polarized Politics. ed. Pietro S. Nivola and David Brady. Washington, D.C.:Brookings Institution Press. Pages 49-71.
Galston, William A. and Pietro S. Nivola. 2006. \Delineating the Problem." In Red andBlue Nation? Characteristics and Causes of American Polarized Politics. ed. PietroS. Nivola and David Brady. Washington, D.C.: Brookings Institution Press.
20

Gerber, Elizabeth R., and Rebecca B. Morton. 1998. \Primary Election Systems andRepresentation." Journal of Law, Economics, and Organization 14: 304-324.
Grofman, Bernard and Thomas L. Brunell. 2001. \Explaining the Ideological Di®erencesBetween the Two U.S. Senators Elected from the Same State: An Institutional E®ectsModel." In Congressional Primaries and the Politics of Representation. ed. PeterF. Galderisi, Marni Ezra, and Michael Lyons. Lanham, MD: Rowman and Little¯eldPress.
Hirano, Shigeo, James M. Snyder Jr., and Michael M. Ting. 2007. \Distributive Politicswith Primaries." Unpublished Manuscript.
Key, V.O., Jr. 1956. American State Politics: An Introduction. New York: Alfred A.Knopf.
King, David. 2003. \Congress, Polarization, and Fidelity to the Median Voter." Unpub-lished Manuscript.
Lengle, James I. 1981. Representation and Presidential Primaries. Westport, CT: Green-wood.
McCarty, Nolan, Keith T. Poole and Howard Rosenthal. 2006. Polarized America: TheDance of Ideology and Unequal Riches. Cambridge, MA: MIT Press.
Norrander, Barbara. 1989. \Ideological Representativeness of Presidential Primary Vot-ers." American Journal of Political Science. 33: 570-587.
Owen, Guillermo and Bernard Grofman. 2006. \Two-Stage Electoral Competition in Two-Party Contests: Persistent Divergence of Party Positions." Social Choice and Welfare26:547-569.
Poole, Keith T. 1997. \Changing Minds? Not in Congress." Unpublished Manuscript.
Pearson, Kathryn and Jennifer L. Lawless. 2007. \Primary Competition and Partisan Po-larization in the U.S. House of Representatives, 1992-2006." Unpublished Manuscript.
Ranney, Austin and Leon D. Epstein. 1966. \The Two Electorates: Voters and Non-Votersin a Wisconsin Primary." The Journal of Politics 28: 598-616.
Ranney, Austin. 1968. \Representativeness of Primary Electorates." Midwest Journal ofPolitical Science 12: 224-238.
Sinclair, Barbara. 2006. Party Wars: Polarization and the Politics of National PolicyMaking. Norman, OK: University of Oklahoma.
Stone, Walter. 1980. \The Dynamics of Constituency: Electoral Control of the House."American Politics Quarterly 8:399424.
Theriault, Sean M. 2006. \Party Polarization in the U.S. Congress." Party Politics 12:483-503.
21
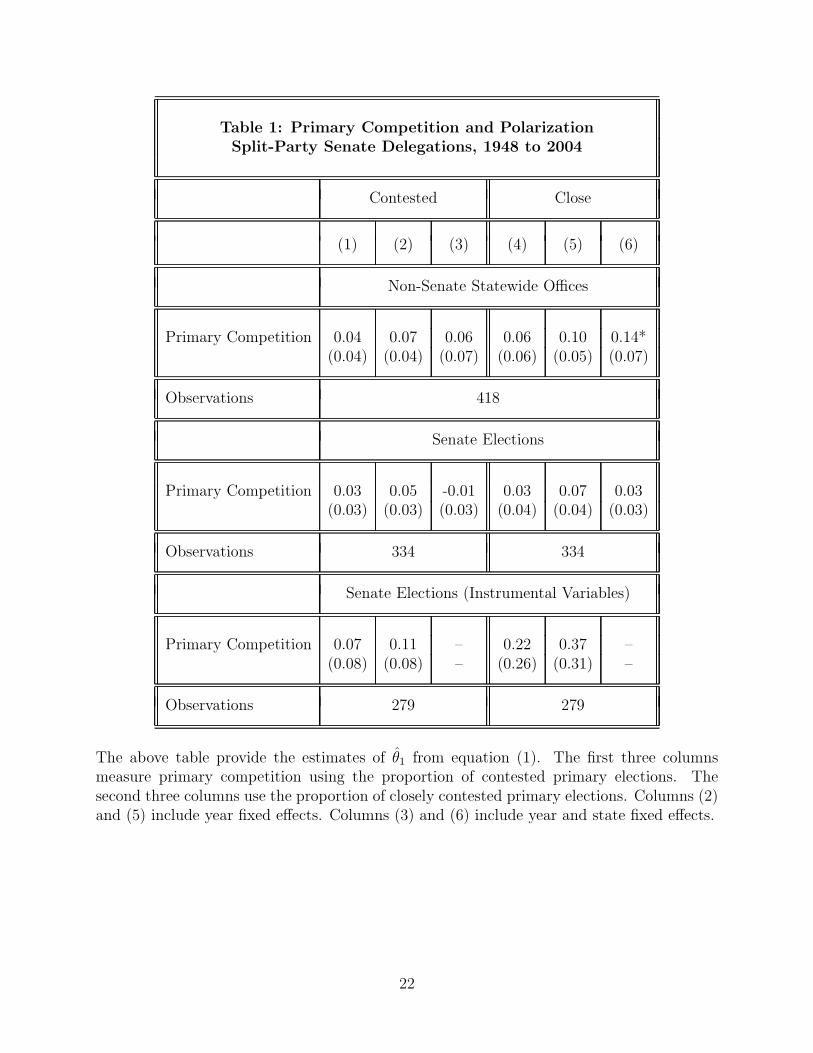
Table 1: Primary Competition and PolarizationSplit-Party Senate Delegations, 1948 to 2004
Contested Close
(1) (2) (3) (4) (5) (6)
Non-Senate Statewide O±ces
Primary Competition 0.04 0.07 0.06 0.06 0.10 0.14*(0.04) (0.04) (0.07) (0.06) (0.05) (0.07)
Observations 418
Senate Elections
Primary Competition 0.03 0.05 -0.01 0.03 0.07 0.03(0.03) (0.03) (0.03) (0.04) (0.04) (0.03)
Observations 334 334
Senate Elections (Instrumental Variables)
Primary Competition 0.07 0.11 { 0.22 0.37 {(0.08) (0.08) { (0.26) (0.31) {
Observations 279 279
The above table provide the estimates of µ̂1 from equation (1). The ¯rst three columnsmeasure primary competition using the proportion of contested primary elections. Thesecond three columns use the proportion of closely contested primary elections. Columns (2)and (5) include year ¯xed e®ects. Columns (3) and (6) include year and state ¯xed e®ects.
22
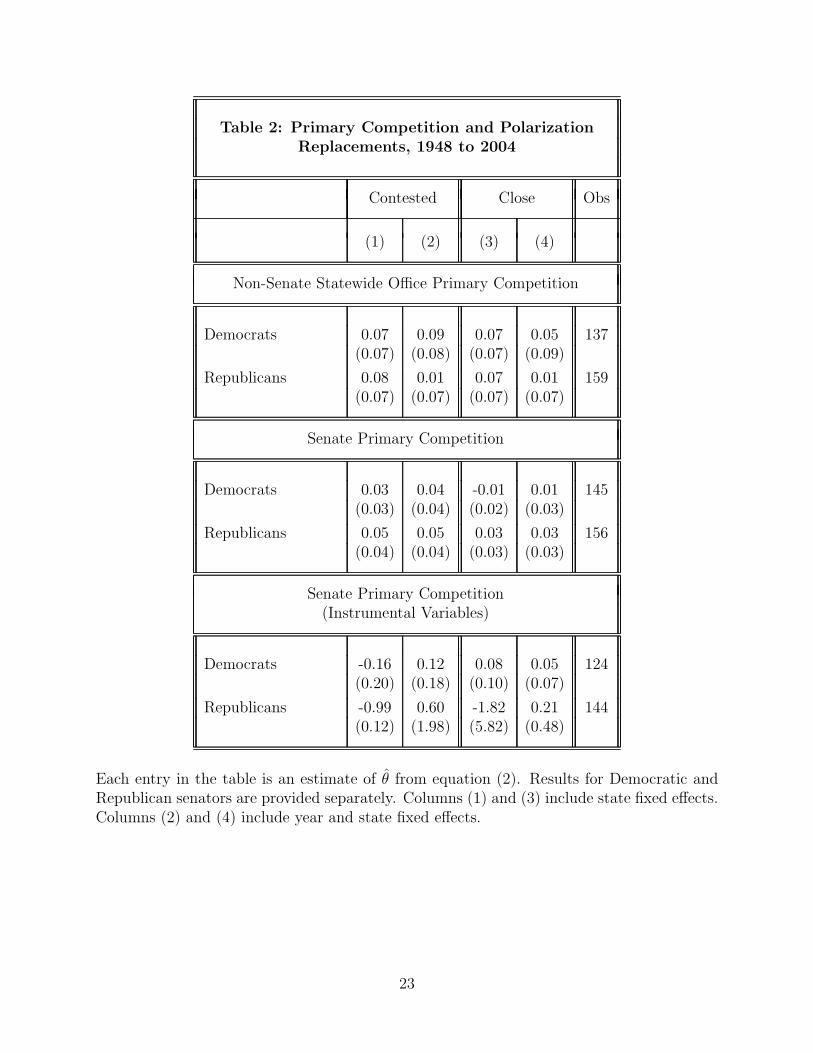
Table 2: Primary Competition and PolarizationReplacements, 1948 to 2004
Contested Close Obs
(1) (2) (3) (4)
Non-Senate Statewide O±ce Primary Competition
Democrats 0.07 0.09 0.07 0.05 137(0.07) (0.08) (0.07) (0.09)
Republicans 0.08 0.01 0.07 0.01 159(0.07) (0.07) (0.07) (0.07)
Senate Primary Competition
Democrats 0.03 0.04 -0.01 0.01 145(0.03) (0.04) (0.02) (0.03)
Republicans 0.05 0.05 0.03 0.03 156(0.04) (0.04) (0.03) (0.03)
Senate Primary Competition(Instrumental Variables)
Democrats -0.16 0.12 0.08 0.05 124(0.20) (0.18) (0.10) (0.07)
Republicans -0.99 0.60 -1.82 0.21 144(0.12) (1.98) (5.82) (0.48)
Each entry in the table is an estimate of µ̂ from equation (2). Results for Democratic andRepublican senators are provided separately. Columns (1) and (3) include state ¯xed e®ects.Columns (2) and (4) include year and state ¯xed e®ects.
23
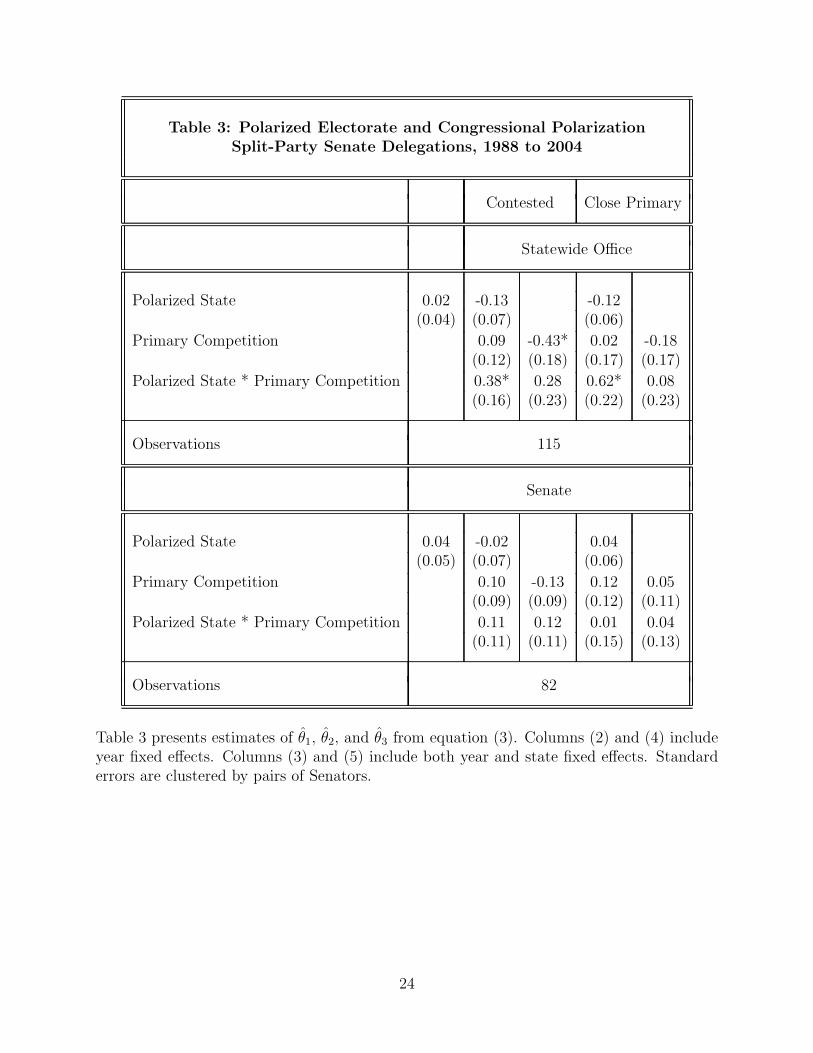
Table 3: Polarized Electorate and Congressional PolarizationSplit-Party Senate Delegations, 1988 to 2004
Contested Close Primary
Statewide O±ce
Polarized State 0.02 -0.13 -0.12(0.04) (0.07) (0.06)
Primary Competition 0.09 -0.43* 0.02 -0.18(0.12) (0.18) (0.17) (0.17)
Polarized State * Primary Competition 0.38* 0.28 0.62* 0.08(0.16) (0.23) (0.22) (0.23)
Observations 115
Senate
Polarized State 0.04 -0.02 0.04(0.05) (0.07) (0.06)
Primary Competition 0.10 -0.13 0.12 0.05(0.09) (0.09) (0.12) (0.11)
Polarized State * Primary Competition 0.11 0.12 0.01 0.04(0.11) (0.11) (0.15) (0.13)
Observations 82
Table 3 presents estimates of µ̂1, µ̂2, and µ̂3 from equation (3). Columns (2) and (4) includeyear ¯xed e®ects. Columns (3) and (5) include both year and state ¯xed e®ects. Standarderrors are clustered by pairs of Senators.
24
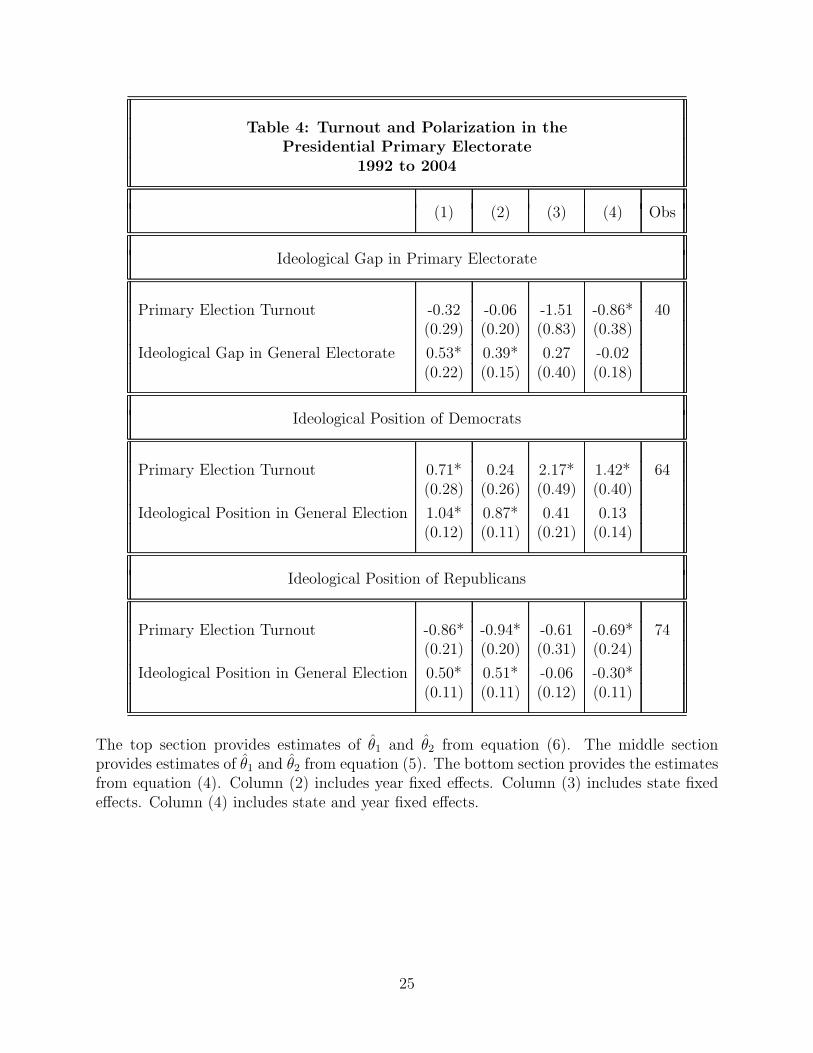
Table 4: Turnout and Polarization in thePresidential Primary Electorate
1992 to 2004
(1) (2) (3) (4) Obs
Ideological Gap in Primary Electorate
Primary Election Turnout -0.32 -0.06 -1.51 -0.86* 40(0.29) (0.20) (0.83) (0.38)
Ideological Gap in General Electorate 0.53* 0.39* 0.27 -0.02(0.22) (0.15) (0.40) (0.18)
Ideological Position of Democrats
Primary Election Turnout 0.71* 0.24 2.17* 1.42* 64(0.28) (0.26) (0.49) (0.40)
Ideological Position in General Election 1.04* 0.87* 0.41 0.13(0.12) (0.11) (0.21) (0.14)
Ideological Position of Republicans
Primary Election Turnout -0.86* -0.94* -0.61 -0.69* 74(0.21) (0.20) (0.31) (0.24)
Ideological Position in General Election 0.50* 0.51* -0.06 -0.30*(0.11) (0.11) (0.12) (0.11)
The top section provides estimates of µ̂1 and µ̂2 from equation (6). The middle sectionprovides estimates of µ̂1 and µ̂2 from equation (5). The bottom section provides the estimatesfrom equation (4). Column (2) includes year ¯xed e®ects. Column (3) includes state ¯xede®ects. Column (4) includes state and year ¯xed e®ects.
25
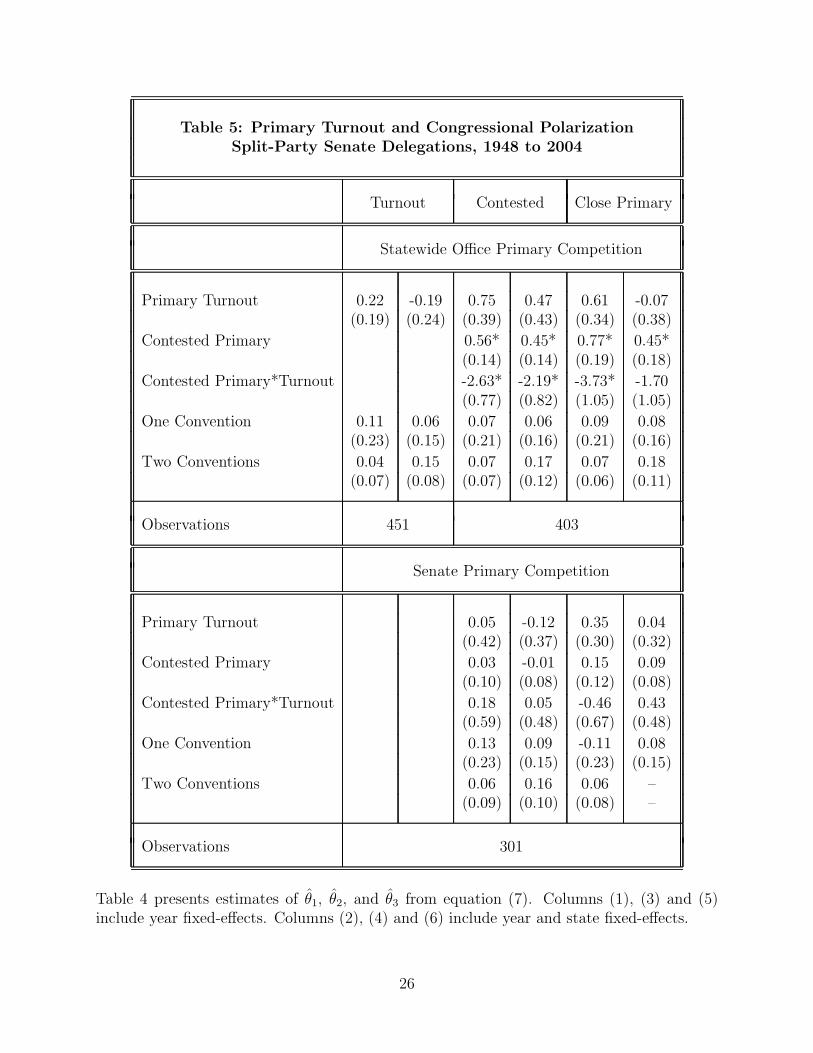
Table 5: Primary Turnout and Congressional PolarizationSplit-Party Senate Delegations, 1948 to 2004
Turnout Contested Close Primary
Statewide O±ce Primary Competition
Primary Turnout 0.22 -0.19 0.75 0.47 0.61 -0.07(0.19) (0.24) (0.39) (0.43) (0.34) (0.38)
Contested Primary 0.56* 0.45* 0.77* 0.45*(0.14) (0.14) (0.19) (0.18)
Contested Primary*Turnout -2.63* -2.19* -3.73* -1.70(0.77) (0.82) (1.05) (1.05)
One Convention 0.11 0.06 0.07 0.06 0.09 0.08(0.23) (0.15) (0.21) (0.16) (0.21) (0.16)
Two Conventions 0.04 0.15 0.07 0.17 0.07 0.18(0.07) (0.08) (0.07) (0.12) (0.06) (0.11)
Observations 451 403
Senate Primary Competition
Primary Turnout 0.05 -0.12 0.35 0.04(0.42) (0.37) (0.30) (0.32)
Contested Primary 0.03 -0.01 0.15 0.09(0.10) (0.08) (0.12) (0.08)
Contested Primary*Turnout 0.18 0.05 -0.46 0.43(0.59) (0.48) (0.67) (0.48)
One Convention 0.13 0.09 -0.11 0.08(0.23) (0.15) (0.23) (0.15)
Two Conventions 0.06 0.16 0.06 {(0.09) (0.10) (0.08) {
Observations 301
Table 4 presents estimates of µ̂1, µ̂2, and µ̂3 from equation (7). Columns (1), (3) and (5)include year ¯xed-e®ects. Columns (2), (4) and (6) include year and state ¯xed-e®ects.
26
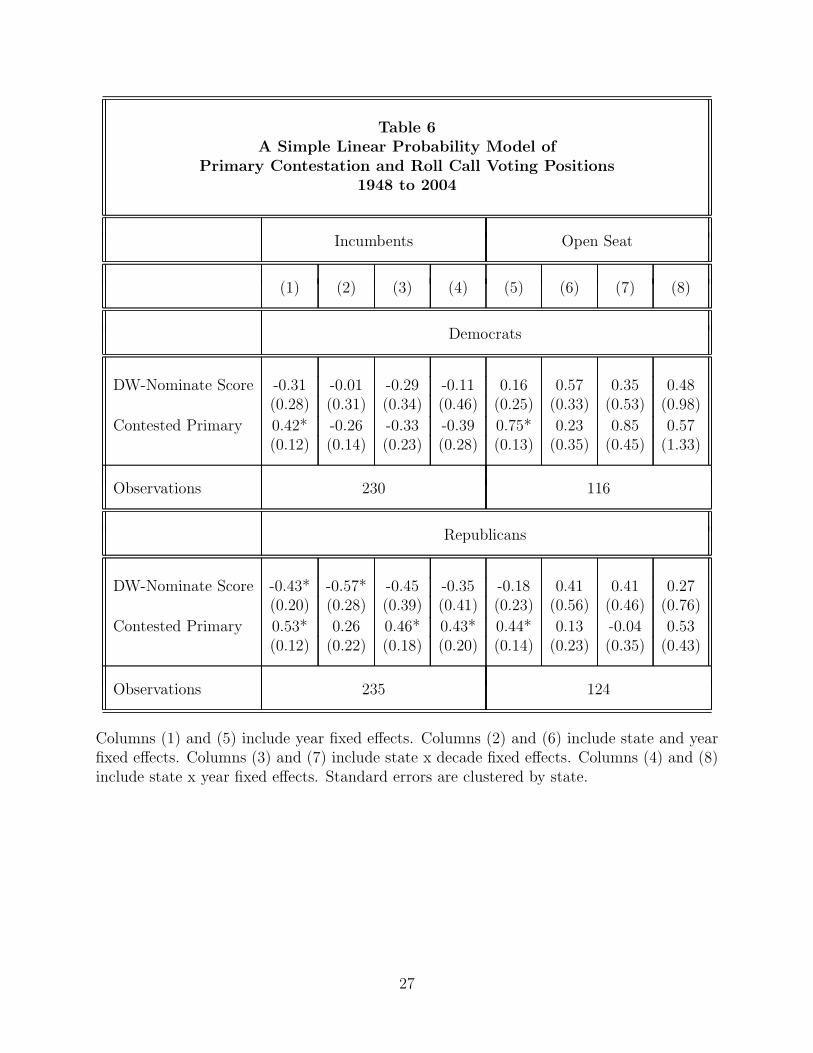
Table 6A Simple Linear Probability Model of
Primary Contestation and Roll Call Voting Positions1948 to 2004
Incumbents Open Seat
(1) (2) (3) (4) (5) (6) (7) (8)
Democrats
DW-Nominate Score -0.31 -0.01 -0.29 -0.11 0.16 0.57 0.35 0.48(0.28) (0.31) (0.34) (0.46) (0.25) (0.33) (0.53) (0.98)
Contested Primary 0.42* -0.26 -0.33 -0.39 0.75* 0.23 0.85 0.57(0.12) (0.14) (0.23) (0.28) (0.13) (0.35) (0.45) (1.33)
Observations 230 116
Republicans
DW-Nominate Score -0.43* -0.57* -0.45 -0.35 -0.18 0.41 0.41 0.27(0.20) (0.28) (0.39) (0.41) (0.23) (0.56) (0.46) (0.76)
Contested Primary 0.53* 0.26 0.46* 0.43* 0.44* 0.13 -0.04 0.53(0.12) (0.22) (0.18) (0.20) (0.14) (0.23) (0.35) (0.43)
Observations 235 124
Columns (1) and (5) include year ¯xed e®ects. Columns (2) and (6) include state and year¯xed e®ects. Columns (3) and (7) include state x decade ¯xed e®ects. Columns (4) and (8)include state x year ¯xed e®ects. Standard errors are clustered by state.
27
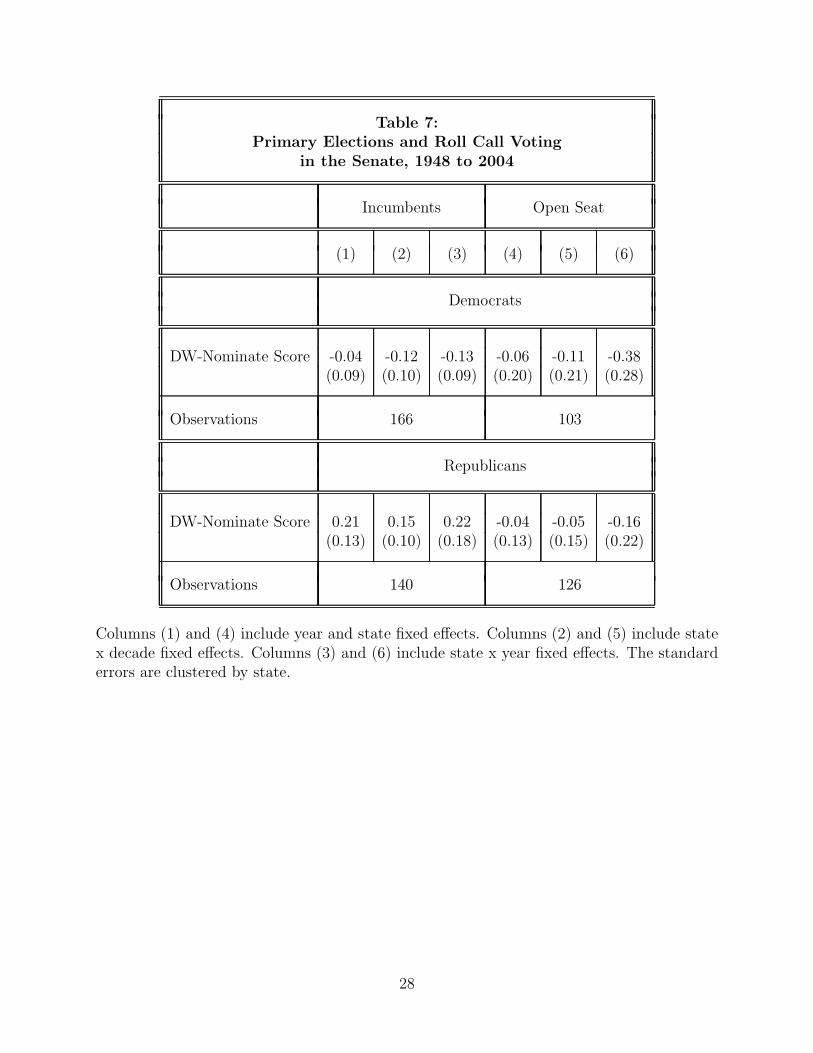
Table 7:Primary Elections and Roll Call Voting
in the Senate, 1948 to 2004
Incumbents Open Seat
(1) (2) (3) (4) (5) (6)
Democrats
DW-Nominate Score -0.04 -0.12 -0.13 -0.06 -0.11 -0.38(0.09) (0.10) (0.09) (0.20) (0.21) (0.28)
Observations 166 103
Republicans
DW-Nominate Score 0.21 0.15 0.22 -0.04 -0.05 -0.16(0.13) (0.10) (0.18) (0.13) (0.15) (0.22)
Observations 140 126
Columns (1) and (4) include year and state ¯xed e®ects. Columns (2) and (5) include statex decade ¯xed e®ects. Columns (3) and (6) include state x year ¯xed e®ects. The standarderrors are clustered by state.
28
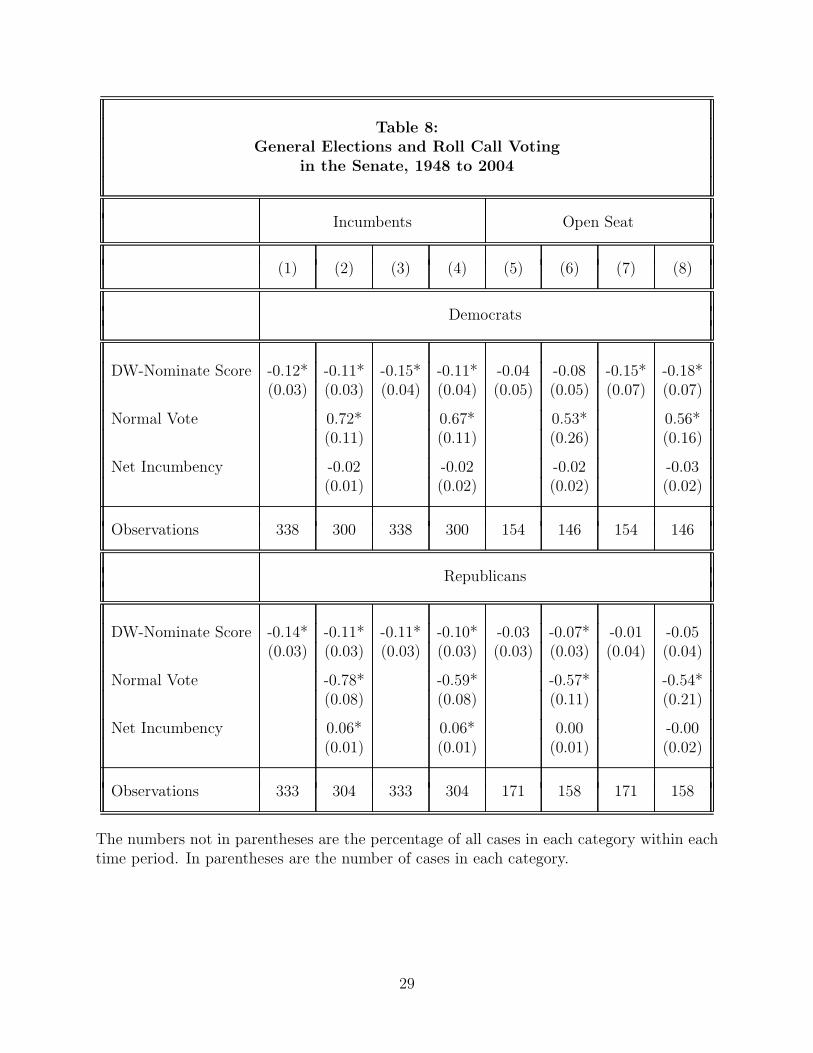
Table 8:General Elections and Roll Call Voting
in the Senate, 1948 to 2004
Incumbents Open Seat
(1) (2) (3) (4) (5) (6) (7) (8)
Democrats
DW-Nominate Score -0.12* -0.11* -0.15* -0.11* -0.04 -0.08 -0.15* -0.18*(0.03) (0.03) (0.04) (0.04) (0.05) (0.05) (0.07) (0.07)
Normal Vote 0.72* 0.67* 0.53* 0.56*(0.11) (0.11) (0.26) (0.16)
Net Incumbency -0.02 -0.02 -0.02 -0.03(0.01) (0.02) (0.02) (0.02)
Observations 338 300 338 300 154 146 154 146
Republicans
DW-Nominate Score -0.14* -0.11* -0.11* -0.10* -0.03 -0.07* -0.01 -0.05(0.03) (0.03) (0.03) (0.03) (0.03) (0.03) (0.04) (0.04)
Normal Vote -0.78* -0.59* -0.57* -0.54*(0.08) (0.08) (0.11) (0.21)
Net Incumbency 0.06* 0.06* 0.00 -0.00(0.01) (0.01) (0.01) (0.02)
Observations 333 304 333 304 171 158 171 158
The numbers not in parentheses are the percentage of all cases in each category within eachtime period. In parentheses are the number of cases in each category.
29
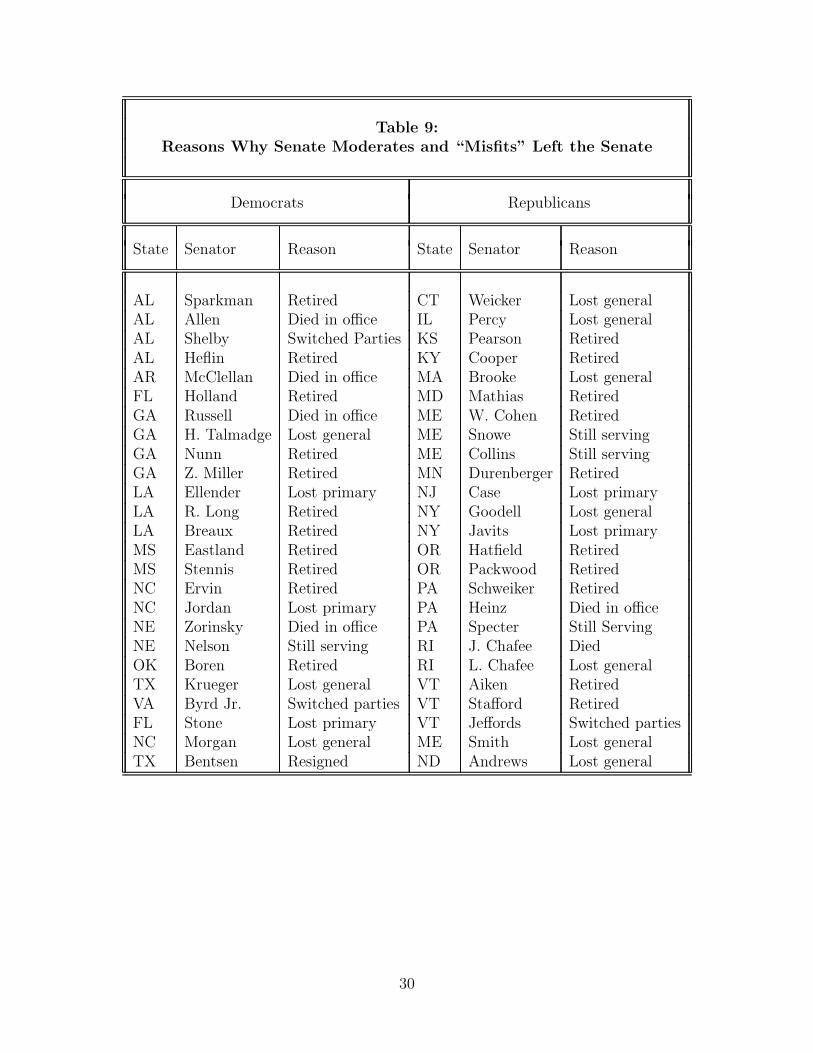
Table 9:Reasons Why Senate Moderates and \Mis¯ts" Left the Senate
Democrats Republicans
State Senator Reason State Senator Reason
AL Sparkman Retired CT Weicker Lost generalAL Allen Died in o±ce IL Percy Lost generalAL Shelby Switched Parties KS Pearson RetiredAL He°in Retired KY Cooper RetiredAR McClellan Died in o±ce MA Brooke Lost generalFL Holland Retired MD Mathias RetiredGA Russell Died in o±ce ME W. Cohen RetiredGA H. Talmadge Lost general ME Snowe Still servingGA Nunn Retired ME Collins Still servingGA Z. Miller Retired MN Durenberger RetiredLA Ellender Lost primary NJ Case Lost primaryLA R. Long Retired NY Goodell Lost generalLA Breaux Retired NY Javits Lost primaryMS Eastland Retired OR Hat¯eld RetiredMS Stennis Retired OR Packwood RetiredNC Ervin Retired PA Schweiker RetiredNC Jordan Lost primary PA Heinz Died in o±ceNE Zorinsky Died in o±ce PA Specter Still ServingNE Nelson Still serving RI J. Chafee DiedOK Boren Retired RI L. Chafee Lost generalTX Krueger Lost general VT Aiken RetiredVA Byrd Jr. Switched parties VT Sta®ord RetiredFL Stone Lost primary VT Je®ords Switched partiesNC Morgan Lost general ME Smith Lost generalTX Bentsen Resigned ND Andrews Lost general
30
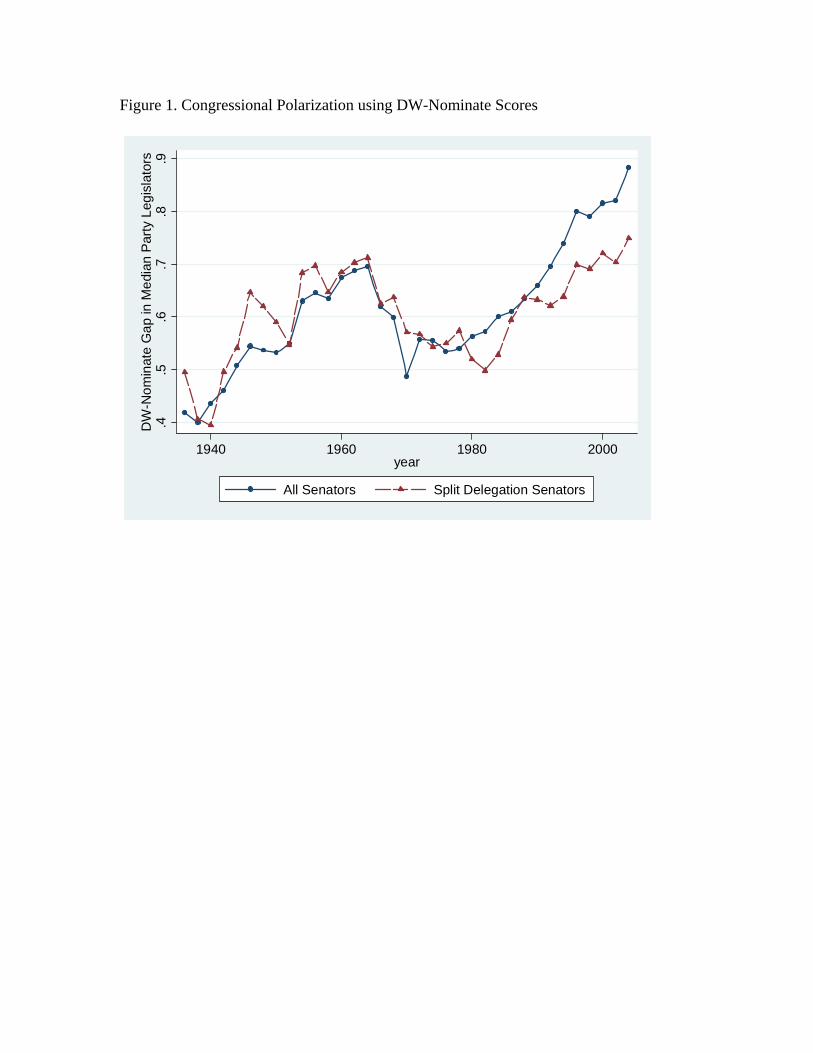
Figure 1. Congressional Polarization using DW-Nominate Scores
.4.5
.6.7
.8.9
DW
-Nom
inat
e G
ap in
Med
ian
Party
Leg
isla
tors
1940 1960 1980 2000year
All Senators Split Delegation Senators
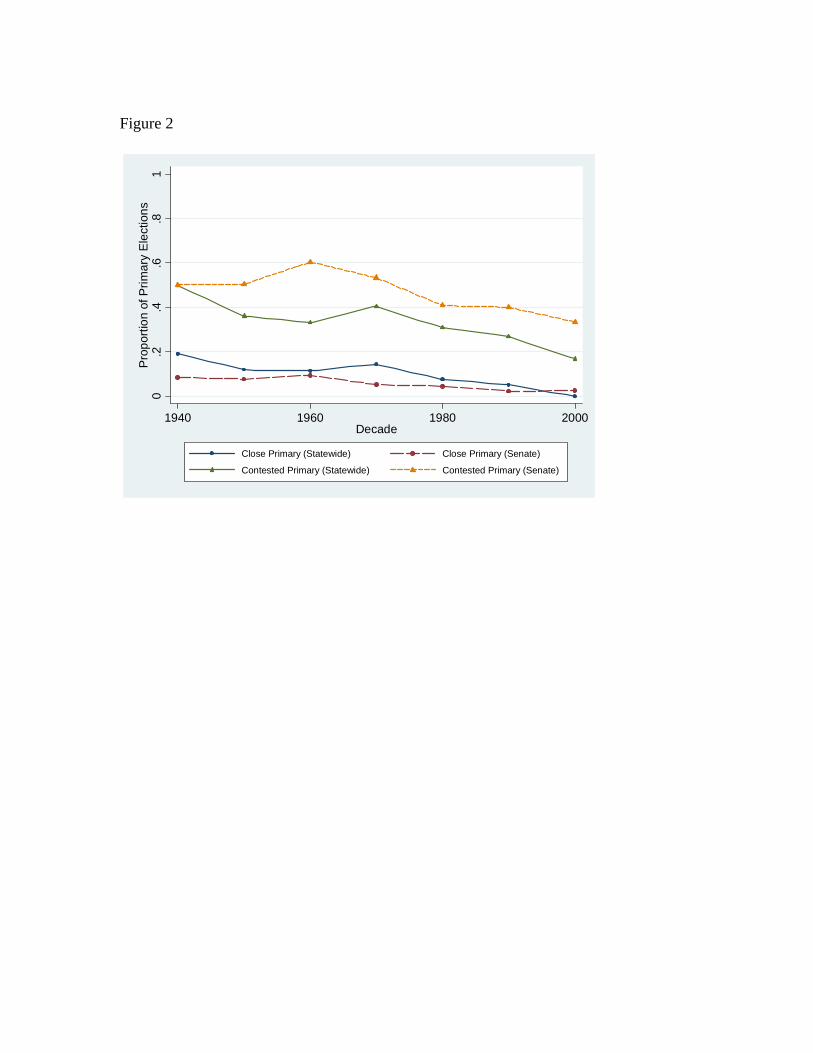
Figure 2
0.2
.4.6
.81
Prop
ortio
n of
Prim
ary
Elec
tions
1940 1960 1980 2000Decade
Close Primary (Statewide) Close Primary (Senate)
Contested Primary (Statewide) Contested Primary (Senate)
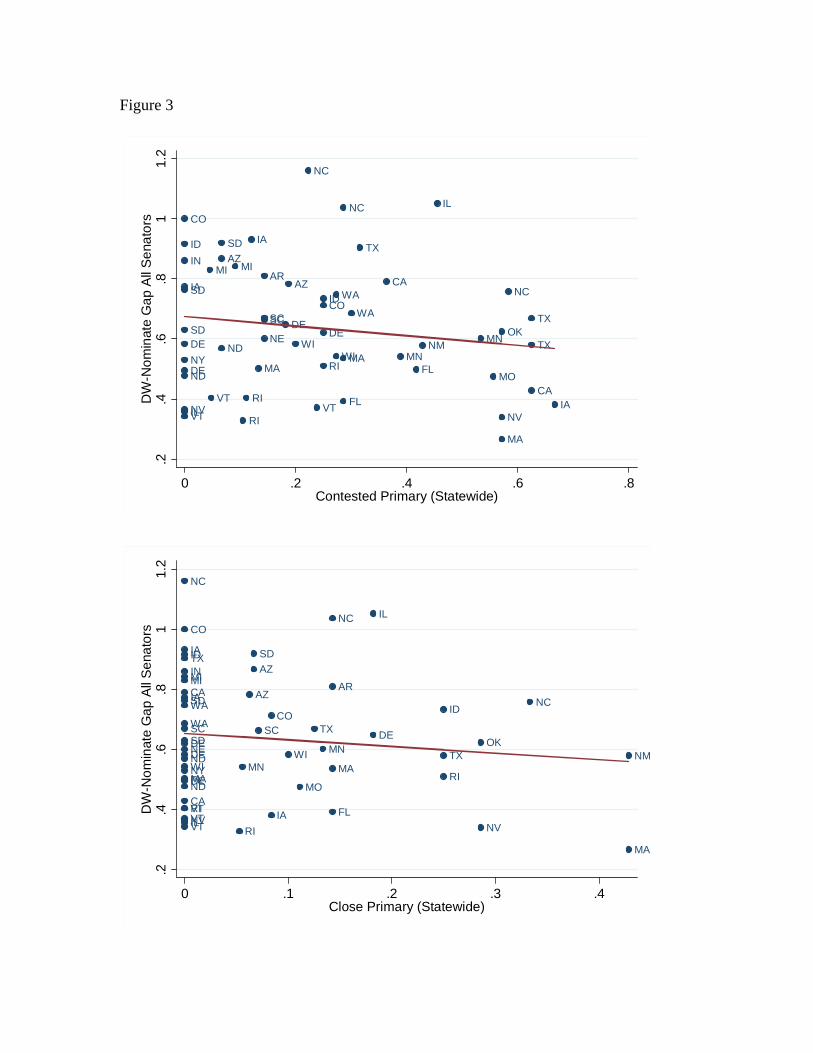
Figure 3
ARAZ
AZ
CA
CA
CO
CO
DE
DEDE
DE
FL
FL
IA
IA
IAID
ID
IL
IL
IN
MAMA
MA
MI MI
MN
MN
MO
NC
NC
NC
ND
ND
NE NM
NVNV
NY
OK
RI
RI
RI
SCSC
SD
SD
SD
TX
TX
TX
VTVT
VT
WA
WA
WIWI
.2.4
.6.8
11.
2D
W-N
omin
ate
Gap
All
Sen
ator
s
0 .2 .4 .6 .8Contested Primary (Statewide)
ARAZ
AZ
CA
CA
CO
CO
DE
DEDEDE
FL
FL
IA
IA
IAID
ID
IL
IL
IN
MAMA
MA
MIMI
MN
MN
MO
NC
NC
NC
ND
ND
NE NM
NVNV
NY
OK
RI
RI
RI
SCSC
SD
SD
SD
TX
TX
TX
VTVT
VT
WA
WA
WIWI
.2.4
.6.8
11.
2D
W-N
omin
ate
Gap
All
Sen
ator
s
0 .1 .2 .3 .4Close Primary (Statewide)
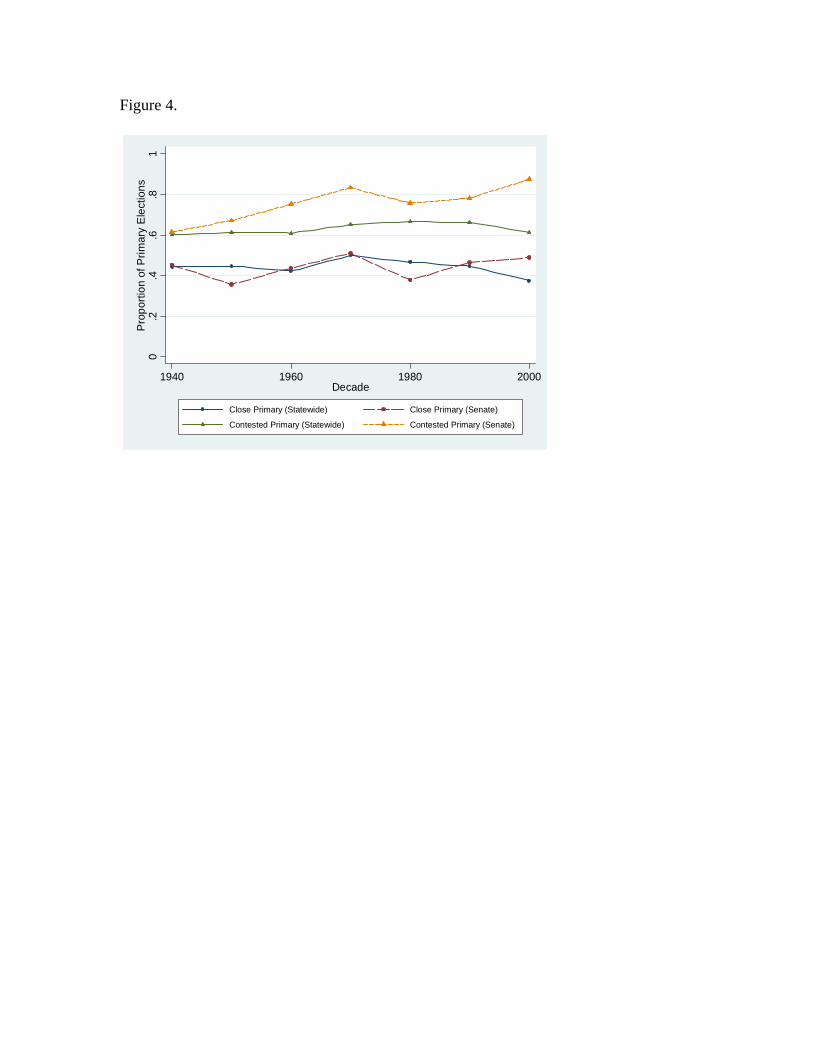
Figure 4.
0.2
.4.6
.81
Pro
porti
on o
f Prim
ary
Ele
ctio
ns
1940 1960 1980 2000Decade
Close Primary (Statewide) Close Primary (Senate)
Contested Primary (Statewide) Contested Primary (Senate)
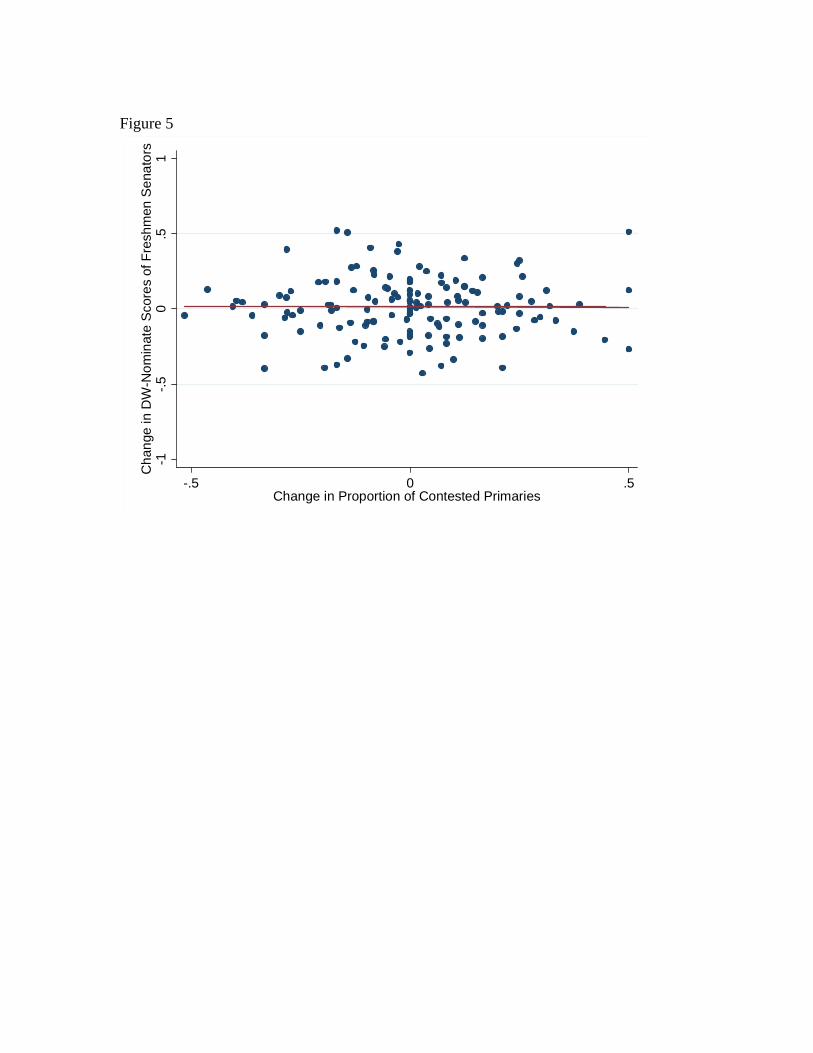
Figure 5
-1-.5
0.5
1C
hang
e in
DW
-Nom
inat
e S
core
s of
Fre
shm
en S
enat
ors
-.5 0 .5Change in Proportion of Contested Primaries
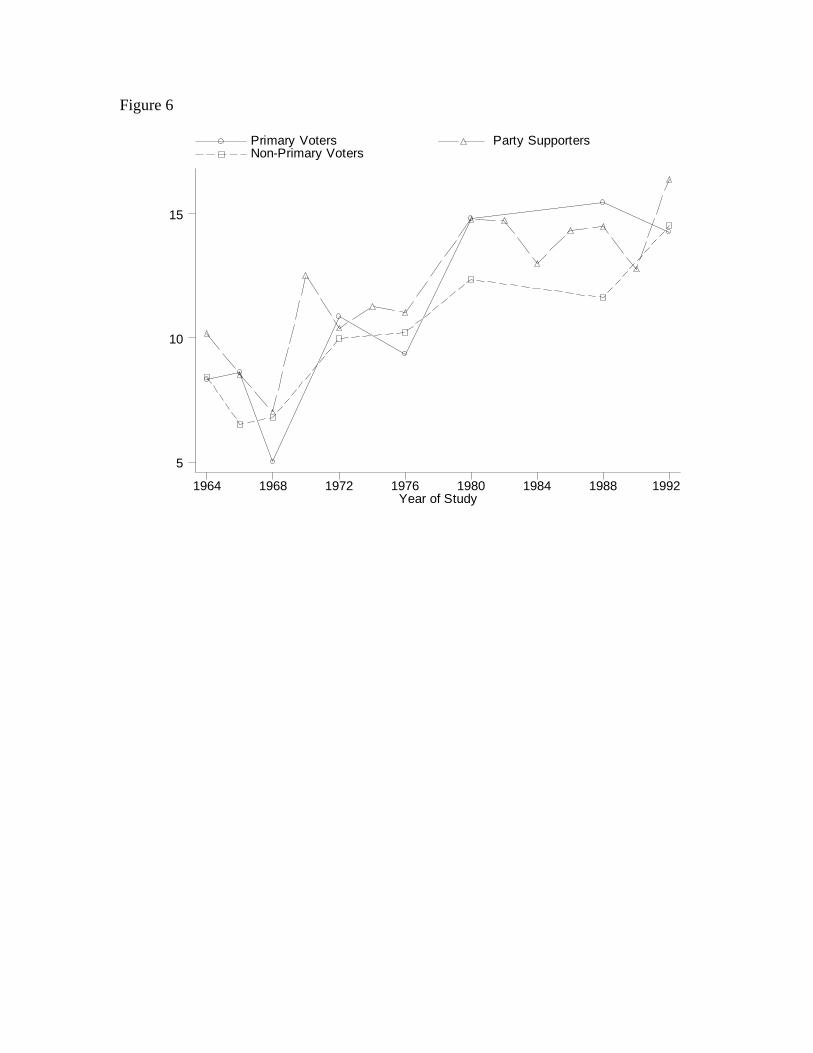
Figure 6
Year of Study
Primary Voters Party Supporters Non-Primary Voters
1964 1968 1972 1976 1980 1984 1988 1992
5
10
15
Figure 7.
AL
AZCO
DE
FL
GA
IA
IL
IN
LA
ME
MN
MO
NC
NY
OH
OK
ORPA
RI
SC
SD TN
TXVA
VT.4.6
.81
1.2
DW
-Nom
inat
e G
ap in
Sen
ate
Del
egat
ions
.4 .6 .8 1 1.2apgap
Figure 8
.07
.08
.09
.1A
vg P
rimar
y Tu
rnou
t (P
ropo
rtion
of S
tate
Pop
ulat
ion)
1940 1960 1980 2000Decade
Figure 9
AL
AZAZAZ
CACACACA
COCOCO
CTCTCTDEDEDE
FLFLFL
GAGAGAGA
ILIL
INKS
LALALALA
MAMAMAMA
MDMDMD
MEME
MN
MOMO
MSMSMSMS
NC
NHNHNHNH
NJ
NYNYNYNY
OHOHOHOH
OKOKOKOK
OROR
PA
RIRIRI
SCSCSCSC
SDSD
TNTNTNTN
TXTXTXTX
VAVA
VTVTVT
WIWIWI
.4.6
.81
1.2
Ideo
logi
cal G
ap in
the
Prim
ary
Ele
ctor
ate
5 10 15 20 25Primary Turnout


![tessexperiments.orgtessexperiments.org/data/levendusky14-0113r1_text.docx · Web view(Mis)perceptions of Partisan Polarization in the American Public [RESEARCH NOTE] WORD COUNT:](https://img.pdfslide.net/doc/110x75/5b7253eb7f8b9a740f8c928e/-web-viewmisperceptions-of-partisan-polarization-in-the-american-public-research.jpg)


![Partisan Polarization and the Effect of Congressional ... · Sinclair reports that members of Congress “have now come to expect their party leaders [in Congress]…to protect and](https://img.pdfslide.net/doc/110x75/5f600a69297c793da0177003/partisan-polarization-and-the-effect-of-congressional-sinclair-reports-that.jpg)