Embed Size (px)
Citation preview
Primary Photodetection Process in Humans & most members of ChordataJames T. Fulton –July 4, 2019
Current Version https://neuronresearch.net/vision/pdf/12primary.pdfMemorialized as DOI: xxx on date TBD
Abstract: Like nearly, if not, all members of Chordata, humans exhibit four spectrally independent1chromophores in their retina. These chromophores are defined explicitly in this Chapter 12. The four2chromophores are members of the Rhodonine family of resonant conjugated retinoids, also known as3members of the carboxylic acid system. They form a liquid-crystalline coating of the opsin proteins4forming the discs of the outer segments of the photoreceptor neurons, but are not chemically combined5with opsin. The photoreceptor neurons used by humans, and all members of Chordata are also6described in detail, based on The Electrolytic Theory of the Neuron. The Pauli Exclusion7Principle plays a crucial role in defining the spectra of the chromophores. The fact that both8endothermic and exothermic members of Chordata employ a biological temperature range9independent of that defined by Arrhenius is critically important. This biological temperature10range is critically important in interpreting the performance of the eye in going from the11photopic to scotopic illumination range. The fundamental photo-transduction process employs a12quantum-mechanical mechanism that has not appeared previously in the vision literature. The13Activa employed inside the photoreceptor neurons is a PNP semiconducting material based on a14liquid-crystalline form of water. A single closed-form equation, the P/D Equation of Section 7.2,15is relied upon here to describe the operation of the photoreceptor neurons under all illumination16and temperature conditions. The equation, when reduced to a Poisson Equation form, includes17the Hodgkin Condition. The details of the electrostenolytic power supply used by all neurons is18cited in this chapter. 19
Keywords: Electrolytic, Biological temperature, quantum-mechanical, Rhodonine, retinoid,20liquid-crystal, semiconductor, PNP, 2-exciton mechanism, adaptation, excitation/de-excitation21equation, electrostenolytics, Pauli Exclusion Principle, Hodgkin Condition, P/D Equation22
Table of Contents, List of Figures, and Index appear at end of this Chapter.23
REFERENCES TO SECTIONS beginning with a numeric indicate a Chapter in “Processes in24Biological Vision” available on line at https://neuronresearch.net/vision/ by clicking on25Download Chapters on the left navigation panel and then selecting the Chapter, Appendix or26ancillary material.27
2 Processes in Biological Vision
PROCESSES IN28
BIOLOGICAL VISION:29
including,30
31
ELECTROCHEMISTRY32
OF THE NEURON33
This material is excerpted from the full β-version of the text. The34final printed version will be more concise due to further editing and35economical constraints. A Table of Contents and an index are located 36at the end of this paper.37
38James T. Fulton39Vision Concepts 40
July 4, 2019 Copyright 2001 James T.42Fulton43
Primary Signal Processing 12- 3
1Released: July 4, 20192Fulton, J. (2014) The Neuron and Neural System. online https://neuronresearch.net/neuron/3Rodieck, R. (1973) The vertebrate retina. San Francisco, CA: W. H. Freeman pg. 3284Oyster, C. (1999) The Human Eye: Structure and Function. Sunderland, MA: Sinauer Assoc. pg 582
12 Primary Signal Processing--Signal Detection 144
12.1 Introduction45
This chapter will focus on the performance characteristics of the Stage 1 visual process based on the overall block46diagram (roadmap) of Section 11.1.4.2.1. This Stage encompasses the operation of the photoreceptor cells in both47their signal detection and signal equilibration roles. Signaling is the primary function of the photoreceptor cells. 48This chapter presents the first detailed description of the signaling path of the photoreceptor cell to appear in print. 49The description relies upon the background developed in previous chapters and the appendices. It relies on a clear50understanding of four separate areas:51
+ the complexity of the photoreceptor/IPM/RPE interface, Section 4.5.1.152
+ the complete solution to the Photoexcitation/De-excitation Equation, P/D Equation of Section 7.253
+ the quantum-mechanical processes incorporated into the chromophores and the Outer Segments of vision, Section545.4.355
+ the role of the metabolic system in the transient performance of the complete stage, developed in Section 8.6 and56section 3.2 of The Neuron and Neural System2.57
The output signals of the photoreceptor cells are essentially fixed in peak-to-peak amplitude regardless of the58absolute amplitude of the input illumination. This is achieved through the use of an adaptation amplifier controlled59by a low pass filter in its power supply. The subsequent signal manipulation processes rely on the essentially fixed60amplitude of the signals from the photoreceptors of Stage 1.61
As late as 1973, Rodieck3 wrote that: “The nature of the coupling mechanism between light absorption on the62lamellar membrane–the photocurrent generated by the outer-segment plasma membrane–is one of the most important63unsolved problems of retinal physiology.” Little has changed since then with regard to the actual mechanism64involved. Only additional concepts have appeared. Both the old and the new concepts have relied primarily upon65kinetic analysis to support their feasibility. Kinetic analysis in the absence of an understanding of the underlying66mechanism, is a very weak tool.67
The situation in the literature has not changed significantly since that time. Although considerable analysis of68possible conceptual mechanisms has appeared, these have not provided a viable hypothesis. This is illustrated by the69question marks in figure 13.29 of the 1999 book by Oyster4. A key problem has been the adoption of a proposal by70Young that the Outer Segment was enclosed by a plasma membrane of the parent photoreceptor cell. Only within71the last few years have images of the Outer Segment appeared at sufficient magnification to show conclusively that72there is no membrane surrounding the disk stack called the Outer Segment. The disk stack is formed by secretion73from the wall of the cell. It is not formed by evagination. See Sections 4.3.5 & 4.6.2.74
There has been a large amount of intellectual capital and laboratory time invested in concepts depending on the75presence of a plasma membrane surrounding the disk stack of each Outer Segment. This is unfortunate. Lacking a76plasma membrane, the concepts of gates in such a membrane is untenable. Lacking gates, the various cascade77theories of how a potential is generated across the membrane are untenable. 78
12.1.1 Glossary79
4 Processes in Biological Vision
Because of several differences in terminology between the conventional wisdom based on chemistry and the80alternate hypotheses presented in this work, it is very important to present the following definitions here. The term81transduction has a significantly different meaning when used in discussing communications via hormones and82communications related to sensing the external environment. This separation has frequently been overlooked during83attempts to use the hormonal concept to describe the sensory process.84
Signal transduction– 851. (with respect to the hormonal system) An intracellular cascade of biochemical event that follow the86interaction between extracellular growth factors and their membrane receptors, ending in the switch of87nuclear mechanisms controlling the proper biological responses. (Battistini, et. al. 1993 in Papa & Tager)88
2. (with respect to the sensory mechanisms of the neural system) The transfer of acoustic energy,89electromagnetic energy or tactile motion by quantum-mechanical sensors into free electrons that can be90further processed by the neural system.91
12.1.2 Background92
12.1.2.1 Relative Physics93
As an example of the multi-disciplinary problem, the descriptions found in the vision literature regarding the94photodetection process and mechanism are quite unlike the similar descriptions found in the realm of physics and95engineering. Photodetection is usually defined in terms of one of three fundamental processes, photo-emission,96photoconduction and thermally mediated conduction due to absorption of photons. Both photo-emission and97photoconduction are features of solid state physics and involve well understood phenomena at the atomic level. 98Thermally mediated conduction is a much simpler process at the atomic level. It involves the heating of the bulk99material. The change in the conductivity of the bulk material reflects this change in temperature. This process is100seldom found in high performance photodetection systems, although, lacking any other uncooled technique, it has101occasionally been used as a low performance detection scheme in infra-red sensors. The process exhibits an102absorption spectrum that is independent of the energy, and hence the wavelength, of the incident photons.103
Photoconduction is achieved by a photon impacting a crystalline lattice, of either a solid or liquid crystalline104material, and creating a long life electron-hole pair. During the lifetime of this pair, multiple electron charges are105able to pass through the lattice. The result is a charge current that may be significantly larger than the quantum flux106of the photons. This process typically exhibits a broad absorption spectrum for photons above a specific energy107level. 108
Photo-emission occurs in two distinct forms in physics, photo-emission from the valence band of a material into a109vacuum (the historically more conventional process of external photo-emission) and photoemission from the valence110band into a higher level conduction or excitation level (so-called internal photoemission). External photo-emission111is characterized by a broad absorption spectrum that begins at a very precise photon energy level (described by112Fermi-Dirac statistics) and extends to indefinitely higher energies. Internal photo-emission exhibits a similar, though113less extended, absorption spectrum in most in-organic materials because the conduction band is quite wide. The114long wavelength absorption edge is still defined by Fermi-Dirac statistics and can be described precisely by the115Fermi-Dirac function. In the case of organic materials, there is normally no conduction band. The conduction band116is replaced by an excitation band that is quite explicitly defined and usually narrow. In these materials, the117absorption spectrum involves the difference in energy between two bounded energy levels, the valence or unexcited118band and the excitation band. The absorption spectrum in this case is defined by the difference in energy between119possible energy states between the two bands (while observing the Pauli Exclusion Principle. This spectrum is120precisely defined by the product of two Fermi-Dirac functions. One describes the short wavelength edge of the121absorption band. The second describes the long wavelength edge of the absorption band. This is the situation122observed in the chromophores of vision.123
It must be appreciated that the photochemistry of resonant organic molecules is basically different from that of124inorganic semiconducting materials. In inorganic photodetecting materials, which typically involve the excitation of125an electron from the valence band to the conduction band, the observed spectral band is a broad, generally flat, one. 126This is because the conduction band is generally wide and any photon with an energy greater than the valence-127conduction band energy difference will cause excitation. This is not generally the case in organic photochemistry. 128The energy transition of interest does not usually involve a conduction band; alternately, it is a transition between129one or more unexcited energy bands to an excited energy band. Both of these bands are described quantum130
Primary Signal Processing 12- 5
5Baylor, D. & Burns M. (1998) Control of rhodopsin activity in vision. Eye vol 12, pp. 521-5256Torre, V. Forti, S. Menini, A. & Campani, M. (1990) Model of phototransduction in retinal rods. Symposia onQuantitative Biology, vol. LV, Cold Spring Harbor, NY: The Cold Spring Harbor Laboratory Press pp.563-573
mechanically--and their energy difference is similarly described. Thus the spectral absorption coefficient due to any131individual transition is generally peaked, with a shape much like in a resonant circuit of electrical engineering132(where it is also possible to combine the features of both resonant and nonresonant elements to achieve unique133spectral performance) In photography, the elements of an organic molecule and an inorganic molecule are nearly134always combined to achieve the desired broad overall spectral response. Moreover, the most important organic135molecules in photography involve multiple auxochromes, i. e. more than three, in each chromophore to achieve136wide spectral response and long stable shelf life for the product (while always abiding by the rules of liquid crystal137chemistry to insure an increase in sensitivity and not a decrease).138
In developing the mechanism of the chromophoric excitation-neural de-excitation process, another embellishment139will be added to the variety of excitation methodologies available. Most investigations of a neuron as a signal140repeater (action potential regenerator operating in the phasic mode) do not focus on the minimal energy required for141excitation of the neuron at a synapse. In the case of the photoreceptor cell (an analog, or electrotonic, amplifier142creating generator waveforms), it appears that a minimum energy level is required and the neuron must be biased143properly. 144
12.1.2.2 Common wisdom of the past145
The primary signal detection process has been studied at a number of different times in the past but the needed tools146were usually not available for adequate interpretation. In the 1930’s, isomerization was one of the few chemical147mechanisms known to the general scientific community that could be caused by photon effects.148
The dominant hypothesis of photodetection in vision for the last half century has been that proposed by Hubbard,149and extended by Kropf based on the work of Wald. The hypothesis being that photodetection involves the150isomerization (by what they call internal photo-emission) of a retinene attached to a protein through a protonated151Schiff base. The de-excitation of the molecule was via a physical re-isomerization. This method of photodetection152has been carried forward as analogous to a switch that initiated the transfer of charge, between specific elements that153are undefined at this time, and that a second action was necessary to terminate the transfer of charge in a timely154manner. Based on this switching analogy, Baylor & Burns recently defined a set of “strong functional constraints”155on any second mechanism5. 156
At that time, the photography field was beginning to introduce color photography to an ever wider range of157applications. However, the technical processes of how it worked were poorly understood. The photo-chemists had158just discovered that it did work and commercial pressures caused a rush to market of a basically cook-book159understanding of the physics (and chemistry). The process did not involve photo-isomerization. The quantum-160mechanical process used in color photography is quite similar to the process actually used in animal vision.161
Neither the isomerization or re-isomerization process, has ever been demonstrated to occur in the in-vivo animal as162part of the vision process. It is a relatively high energy process and not well suited to achieving the near quantum163limited performance of animal vision. By any standard, the previously proposed method of operation in the vision164process is a convoluted and involved one. As the field of semiconductor physics has evolved and the field of liquid165crystal chemistry has appeared, a variety of additional mechanisms have appeared that offer more satisfactory166solutions to the in-vivo photo-detection process. Effective understanding and use of these mechanisms will once167again require a multi-disciplinary approach if one is to understand the operation of the Outer Segment of the 168photoreceptor of animal vision. 169
The most recent redefinition of the above hypothesis in a theoretical context was that of Torre, et. al6. In that work,170“a quantitative reconstruction of the kinetics of phototransduction was attempted.” The resulting model was based171primarily on proposed chemical kinetics instead of detailed descriptions of the processes involved. It included a172large number of degrees of freedom as indicated by the number of arbitrary constants employed. No attempt was173included to treat the quantum mechanical situation. The term phototransduction was employed, rather than174photodetection, to describe the overall “process by which the absorption of a photon by a molecule of rhodopsin in a175photoreceptor is transformed into an electrical signal.” This description skirts the subject of how this is achieved. 176The next sentence says “the electrical signal is caused by the modulation of a current, usually called a photocurrent,177flowing across the light-sensitive channels in the plasma membrane of the outer segments.” What fundamental178
6 Processes in Biological Vision
7Kamiyama, Y. Ogura, T. & Usui, S. (1996) Ionic current model of the vertebrate rod photoreceptor. Vision Res.vol. 36, pp. 4059-40688Leibovic, K. (1990) Science of Vision NY: Springer-Verlag pg 449Fuortes, M. & Hodgkin, A. (1964) Changes in time scale and sensitivity in the ommatidia of Limulus. J. Physiol.vol. 172, pp. 239-26310Borsellino, A. Fuortes, M. & Smith, T. (1965) Visual responses in Limulus. Cold Spring Harbor Symposia onQuantitative Biology. vol XXX, pp 429-443 This paper provides additional background re: Fuortes & Hodgkin
mechanism is used by the light-sensitive channels in the plasma membrane is not discussed. Kamiyama et. al.7 have179combined the transduction model suggested by Torre, et. al. with the excitable membrane model of Hodgkin, Huxley180& Katz to create an ionic current model of the photoreceptor cell. This model is the first to delineate the outer181segment from the inner segment in an electrical analog. It also recognizes the two separate polarity signals182recordable from one photoreceptor cell (note the similarity of their figure 1 to Laughlin discussed below). Beyond183those features, the model is a synthesis of a large group of individual variable resistors in series with arbitrary184voltage and polarity batteries, all in parallel with a current source and a capacitor. The majority of the network is185meant to represent the membrane of the inner segment of the photoreceptor cell. The model was implemented as a186computer simulation program.187
Leibovic has also addressed the transduction and adaptation processes8. However, the result does not satisfy. He188notes “the processes which activate the responses to light are better understood than those which inactive them.” He189goes on “Whatever the details, we can imagine how thresholds and response amplitudes can be related to the190biochemistry.” This work suggests that “to imagine” is a scientifically weaker mechanism than that associated with191intuition.192
The mathematical solution to the equations of the proposed system reduce in a special case to a form explored by193Fourtes & Hodgkin9,10. This special case involves a single processing stage as opposed to the general n-stage194equation they presented. They used a circuit analog employing a pentode vacuum tube in the series arm of each of195their n-stages. This analog is clearly not appropriate based on later investigations. Their n-stage solution was196adopted by a variety of later investigators who defined multiple stages in order to obtain additional degrees of197freedom in their mathematical manipulations. The goal was to account for the delay in output signal versus198excitation that varied with stimulus level. However, Fourtes & Hodgkin were careful to note that “it must be said at199once that the results do not provide real evidence for the existence of anything formally equivalent to a cascade of200ten elements”. Their analysis employed a variable number of elements, or stages, to accommodate a wider range of201excitation levels. 202
The primary reason for the n-stages in their analysis was to provide sufficient delay between the onset of excitation203and the response of the observed biological cells. Their equations did not include an independent delay term because204they did not use complex notation in the solution of their differential equation. Additionally, their model was written205in terms of voltages. For a quantum mechanical process, it is more appropriate to use a charge analog and quantify206the maximum number of excitable but initially bound charges available in the photoreceptor. The limitation on the207total number of charges available in the system transforms the analog into a state variable system. This is the208methodology employed in this work.209
12.1.2.3 Framework of this theory210
This work does not support the conventional wisdom concerning the process of photosensing in vision. It does not211support:212
+ the photoconduction of rhodopsin as the excitation mechanism, 213
+ the isomerization of a retinene as the excitation and de-excitation mechanisms within the photodetection process, 214
+ the switching analogy required to explain the separate excitation and de-excitation of the putative CGMP cascade, 215
+ the putative cGMP cascade as an explanation of the gain mechanism, nor the use of variable resistors without a216means of controlling them in vision. 217
Neither does this work rely upon chemical kinetics as a foundation. 218
Primary Signal Processing 12- 7
11Leibrock, C. Reuter, T. & Lamb, T. (1998) Molecular basis of dark adaptation in rod photoreceptors. Eye, vol. 12,pp 511-52012 Torrey, T. (1971) Morphogenesis of the Vertebrates. New York: Wiley & Sons. pg 466.
An alternate continuous flow process is proposed that does not require a separate and distinct terminating mechanism219or any constraints on such a mechanism. It is based on an entirely electrolytic hypothesis using quantum-mechanical220(internal photoemissive) detection techniques. The hypothesis relies heavily on the presence of the chromophores,221membranes and specific minute volumes of water to be present in the liquid crystalline state of matter. The success222of this schism with the past is illustrated by the results; the first comprehensive, consistent and rigorous223explanation of the photosensing process of vision process.224
From this point on, the term transduction will be used only in the electronic sense defined in225Section 12.1.1. 226
The proposed photodetection process is based on a simple first order physical system defined by a single first order227differential equation (and a very specific set of boundary conditions). The physical model is quantum mechanical228and appropriate for organic photodetectors. The photodetection process is redefined into two mechanisms,229transduction of photons (TD) into excitons (constrained electrons) mechanism and the translation of excitons into230free electrons within a microtubule (TL) . The transduction mechanism is passive. The translation process is based231on an active electrolytic semiconductor device (actually one of two) within the photoreceptor cell. The resulting232model is much simpler and does not involve a computer simulation. It provides simple closed form mathematical233equations describing all of the waveforms associated with the photoreceptor cell under all conditions of continuous234and impulse illumination as well as dark adaptation in the absence of illumination. This equation is defined as the235Photoexcitation/De-excitation Equation (P/D Equation). It is derived in a complete form in Appendix A as well as in236a variety of simplified forms useful under certain simplifying certain conditions. One of these forms was originally237postulated by Hodgkin (See previous paragraph), but without a model to explain its limited applicability.238
12.1.2.3.1 Architecture & integration of the visual system239
As indicated in Section 4.5, the photoreceptor cells of stage 1 do not stand alone. They are highly integrated into a240photoreceptor/IPM/RPE complex. This complex in turn shares a highly integrated role in the overall operation of the241eyes and the complete visual system. From an architectural (or system design) perspective, this integration is242important to the many dynamic aspects of the system. Each system has been optimized with respect to a variety of243design goals related to the environment of the animal. The resulting optimization has an impact on the performance244of the photoreceptor cells of that animal.245
For humans, the optimization has resulted in an adaptation function that is tailored to the diurnal illumination level246defined by the earths rotation. Leibrock, et. al. have reviewed the debate in the vision literature concerning the247inadequacy of the adaptation function in humans11. Such a discussion is parochial to the overall design tradeoff248process. To achieve a significantly faster adaptation rate would compromise the rotational capabilities of the eye249and seriously degrade the ability of the human to read.250
The level of circuit integration found in the photoreceptor cell appears to be the highest of any neuron. This is due to251the large number of discrete functions performed within the individual cell. From a system design perspective, the252photoreceptor cell is a work of art. To achieve this level of integration, the signaling function of the photoreceptor253cell is extremely nonlinear. The individual nonlinearities range from the simplest to the most complex, from the254static to the dynamic. Analyses in the literature that have not recognized these nonlinearities have led to many255unsupportable hypotheses. The concept of "dark light" is one of these. 256
12.1.3 Definition of the cytological situation257
As was developed earlier, the photoreceptor cell found in the vision process is a complex, multi-functional one. The258Outer Segment is not an integral part of the cell; the Inner Segment of the cell has both a exocrine glandular function259and a neural function. It appears that the neural function is not actually involved with the photodetection process;260therefore, it is generally categorized as a secondary receptor in Torrey12 and similar texts. That is to say, the261dendrites of the neuron receive irritation from something other than photons; in this case, the irritation is caused by262interaction with the chromophoric liquid crystal when that element is in an excited state. This situation, involving263the expression, “encapsulated nerve endings”, is well illustrated by the photoreceptor case, where the outer ends of264the dendrites (actually a unique feature labeled a microtubule in the vision modality) are either enclosed in the deep265fissures around the periphery of the disks or at least in intimate contact with the disks in these regions as illustrated266in Section 4.3.5.1.267
8 Processes in Biological Vision
13Baylor, D. & Hodgkin, A. (1973) Detection and resolution of visual stimuli by turtle photoreceptors. J. Physiol.vol. 234, pp. 163-198
The complexity of the photoreceptor cell continues to present a problem for biological researchers. Because of the268sizes involved and the tools available, we are still faced with a situation similar to that of sticking two probes269through the outside case of a radio receiver and trying to define the type of music being received based on the signals270detected. This is a particular problem with “intracellular probing” which is similar to contacting the face of a271microcircuit chip with a probe large enough to contact 10-100 signal traces at one time; in this case the waveform on272the probe may be a complex sum of signals and the internal circuits may be significantly damaged.273
As indicated earlier, the techniques developed by the Baylor school are quite sophisticated and provide very274interesting data. However, even these techniques leave several questions open. For instance, the replacement of the275fluid of the IPM with a ringers solution may change the situation surrounding the OS significantly and create leakage276paths to the polar ringers solution that may not exist in the real situation. It is well documented that the IPM is277isolated from other interstitial fluids but the reasons for this are not documented. Secondly, although not discussed278in detail by those authors, the technique used measures the net charge or current crossing an interface; it does not279mean that only one conductor was involved. This is similar to placing a non-contacting current meter around a cable280containing all of the wires going to a motor. The meter will read either zero or a leakage current but will not give281any indication of how much current is actually passing through the motor windings; If you place the meter around282only one conductor in the cable, you will get a correct reading for that individual conductor. In the Baylor case, it283may be that the measured inward current is actually a leakage current to the ringer’s solution Secondly, the net284current measured may be due to a relatively constant inward current on one conductor subtracted from a second285outward conductor on an adjacent conductor(s).286
12.1.4 Derivation of the Circuit Analog287
The circuit analog defined below may appear arbitrary on first viewing; however, it is able to accurately account for288the performance of the visual system in considerable detail--the key criteria for a good model to meet. The equations289of circuit synthesis do not lead to singular forms of a model but allow for models with different focus, i. e., in290electronic modeling, it is frequently desirable to use either a voltage source model or a current source model but not291both for the same source. Chapter 9 addresses additional points relative to creating circuit analogs. This model has292allowed many details of the mechanisms involved to be illuminated in a very useful way, specifically with regard to293the mechanism of brightness adaptation. This process involves much more than the “bleaching” of a molecule. A294model can never be complete, this one will surely be modified and expanded in the future, that is its basic reason for295existing here.296
As a starting point, no data could be found representing the measured signal output of the chromophoric material297alone following excitation. Therefore, the problem was addressed as a typical 4-port black-box consisting of two298internal stages, transduction of photons to excitons and then translation of the excitons into free electrons on (in) a299conductor. The boundary conditions were available, particularly the output conditions as illustrated in Figure 3 of 300baylor & Hodgkin13. The challenge is to define a simple (or the simplest) circuit that can provide these characteristic301in a biological context. In 2016, a paper was found describing, indirectly, the transfer function of the chromophoric302material of the outer segment (Baylor, Lamb & Yau, 1979, Section 12.8.1.3).303
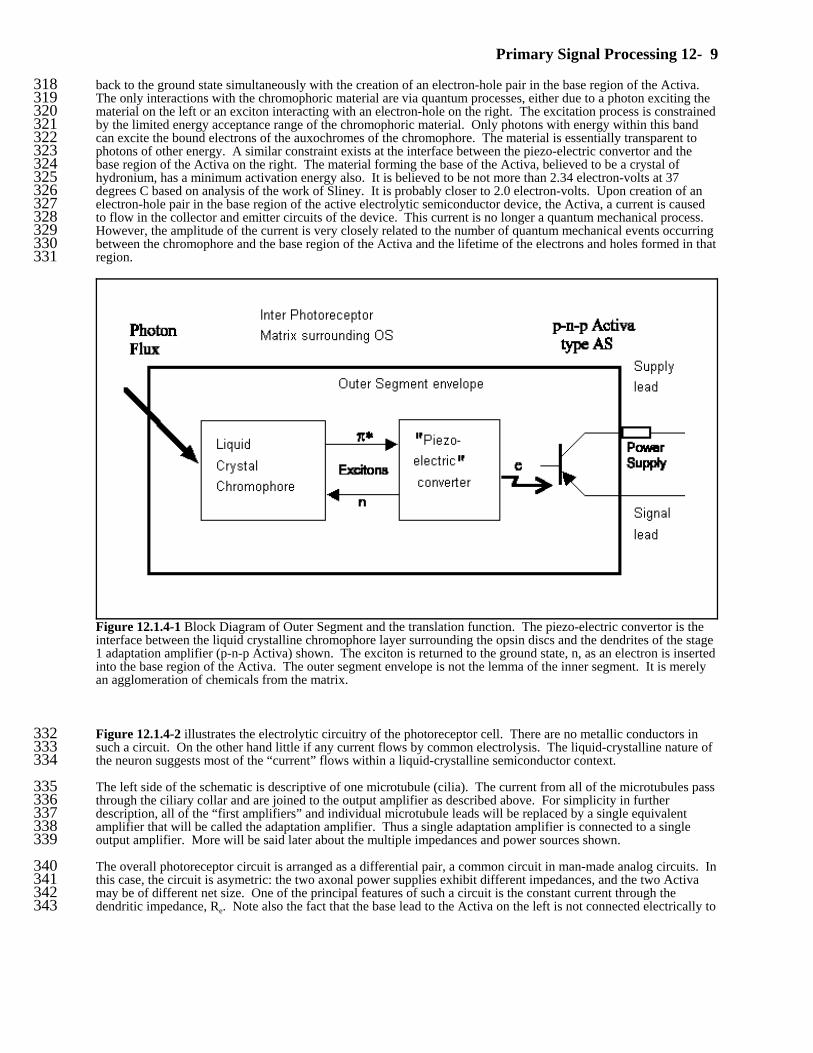
In the literature, transduction has generally been used to describe an overall conceptual process of converting a304photon into some kind of signal useful neurologically. In this work, a much more specific description of this overall305process will be given and the terminology will necessarily be further definitized. Specifically, transduction will be306taken as, and limited to, the process of absorbing an incident photon and creating an excited electron in the B* band307of a chromophoric layer of the OS associated with a photoreceptor cell. Translation will be taken as, and limited to,308the process whereby an excited B* electron of the chromophoric layer is de-excited and a free electron is produced309within the dendritic structure of the neuron associated with the IS of the same photoreceptor cell. These are310intrinsically different kinds of processes. Figure 12.1.4-1 describes the operation of the Outer Segment in block311diagram form, except where it introduces the active device, the Activa. An Activa of type AS is used in the312microtubules of the photoreceptor cell. 313
One of the most important boundary conditions illustrated in this figure is the complete electrical and quantum314mechanical isolation of the chromophoric material of the disk assembly in its two critical roles represented by the315two functional blocks. These blocks are labeled the liquid crystal chromophore and the “piezo-electric convertor. 316The later name may be poorly chosen. The function involved is the de-excitation of an exciton in the chromophore317
Primary Signal Processing 12- 9
Figure 12.1.4-1 Block Diagram of Outer Segment and the translation function. The piezo-electric convertor is theinterface between the liquid crystalline chromophore layer surrounding the opsin discs and the dendrites of the stage1 adaptation amplifier (p-n-p Activa) shown. The exciton is returned to the ground state, n, as an electron is insertedinto the base region of the Activa. The outer segment envelope is not the lemma of the inner segment. It is merelyan agglomeration of chemicals from the matrix.
back to the ground state simultaneously with the creation of an electron-hole pair in the base region of the Activa. 318The only interactions with the chromophoric material are via quantum processes, either due to a photon exciting the319material on the left or an exciton interacting with an electron-hole on the right. The excitation process is constrained320by the limited energy acceptance range of the chromophoric material. Only photons with energy within this band321can excite the bound electrons of the auxochromes of the chromophore. The material is essentially transparent to322photons of other energy. A similar constraint exists at the interface between the piezo-electric convertor and the323base region of the Activa on the right. The material forming the base of the Activa, believed to be a crystal of324hydronium, has a minimum activation energy also. It is believed to be not more than 2.34 electron-volts at 37325degrees C based on analysis of the work of Sliney. It is probably closer to 2.0 electron-volts. Upon creation of an326electron-hole pair in the base region of the active electrolytic semiconductor device, the Activa, a current is caused327to flow in the collector and emitter circuits of the device. This current is no longer a quantum mechanical process. 328However, the amplitude of the current is very closely related to the number of quantum mechanical events occurring329between the chromophore and the base region of the Activa and the lifetime of the electrons and holes formed in that330region.331
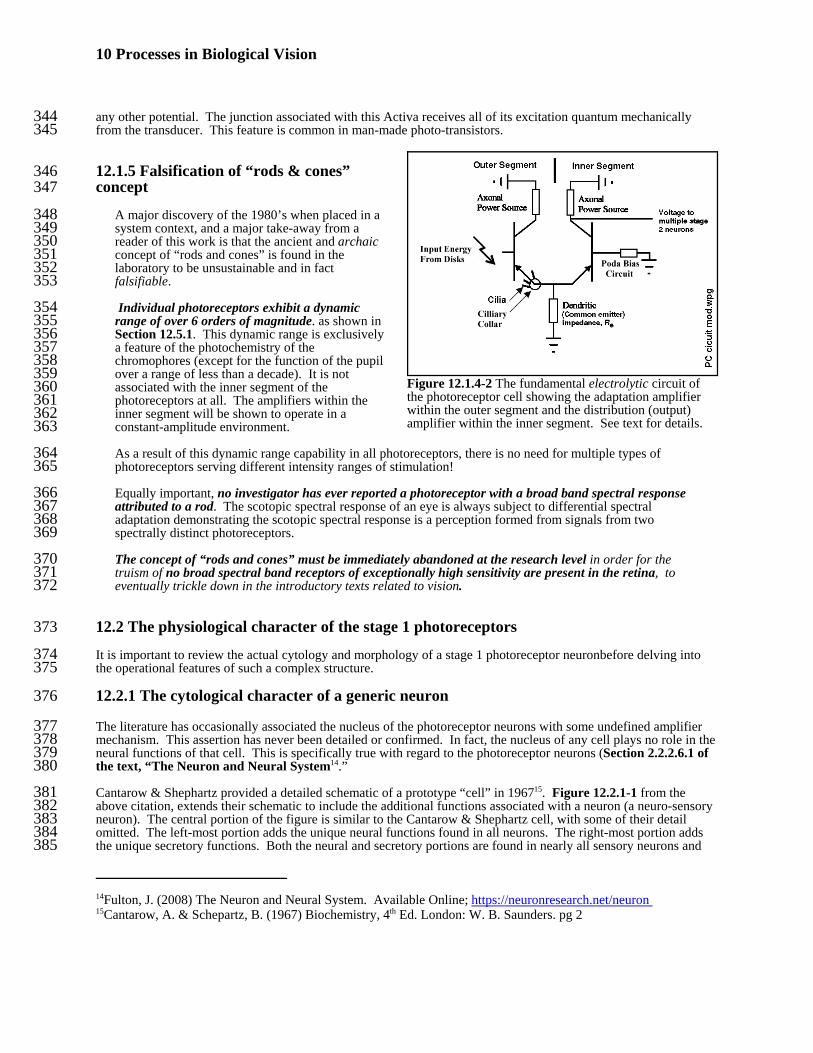
Figure 12.1.4-2 illustrates the electrolytic circuitry of the photoreceptor cell. There are no metallic conductors in332such a circuit. On the other hand little if any current flows by common electrolysis. The liquid-crystalline nature of333the neuron suggests most of the “current” flows within a liquid-crystalline semiconductor context. 334
The left side of the schematic is descriptive of one microtubule (cilia). The current from all of the microtubules pass335through the ciliary collar and are joined to the output amplifier as described above. For simplicity in further336description, all of the “first amplifiers” and individual microtubule leads will be replaced by a single equivalent337amplifier that will be called the adaptation amplifier. Thus a single adaptation amplifier is connected to a single338output amplifier. More will be said later about the multiple impedances and power sources shown.339
The overall photoreceptor circuit is arranged as a differential pair, a common circuit in man-made analog circuits. In340this case, the circuit is asymetric: the two axonal power supplies exhibit different impedances, and the two Activa341may be of different net size. One of the principal features of such a circuit is the constant current through the342dendritic impedance, Re. Note also the fact that the base lead to the Activa on the left is not connected electrically to343
10 Processes in Biological Vision
14Fulton, J. (2008) The Neuron and Neural System. Available Online; https://neuronresearch.net/neuron 15Cantarow, A. & Schepartz, B. (1967) Biochemistry, 4th Ed. London: W. B. Saunders. pg 2
Figure 12.1.4-2 The fundamental electrolytic circuit ofthe photoreceptor cell showing the adaptation amplifierwithin the outer segment and the distribution (output)amplifier within the inner segment. See text for details.
any other potential. The junction associated with this Activa receives all of its excitation quantum mechanically344from the transducer. This feature is common in man-made photo-transistors.345
12.1.5 Falsification of “rods & cones”346concept347
A major discovery of the 1980’s when placed in a348system context, and a major take-away from a349reader of this work is that the ancient and archaic350concept of “rods and cones” is found in the351laboratory to be unsustainable and in fact352falsifiable.353
Individual photoreceptors exhibit a dynamic354range of over 6 orders of magnitude. as shown in355Section 12.5.1. This dynamic range is exclusively356a feature of the photochemistry of the357chromophores (except for the function of the pupil358over a range of less than a decade). It is not359associated with the inner segment of the360photoreceptors at all. The amplifiers within the361inner segment will be shown to operate in a362constant-amplitude environment.363
As a result of this dynamic range capability in all photoreceptors, there is no need for multiple types of364photoreceptors serving different intensity ranges of stimulation!365
Equally important, no investigator has ever reported a photoreceptor with a broad band spectral response366attributed to a rod. The scotopic spectral response of an eye is always subject to differential spectral367adaptation demonstrating the scotopic spectral response is a perception formed from signals from two368spectrally distinct photoreceptors.369
The concept of “rods and cones” must be immediately abandoned at the research level in order for the370truism of no broad spectral band receptors of exceptionally high sensitivity are present in the retina, to371eventually trickle down in the introductory texts related to vision.372
12.2 The physiological character of the stage 1 photoreceptors373
It is important to review the actual cytology and morphology of a stage 1 photoreceptor neuronbefore delving into374the operational features of such a complex structure.375
12.2.1 The cytological character of a generic neuron376
The literature has occasionally associated the nucleus of the photoreceptor neurons with some undefined amplifier377mechanism. This assertion has never been detailed or confirmed. In fact, the nucleus of any cell plays no role in the378neural functions of that cell. This is specifically true with regard to the photoreceptor neurons (Section 2.2.2.6.1 of379the text, “The Neuron and Neural System14.”380
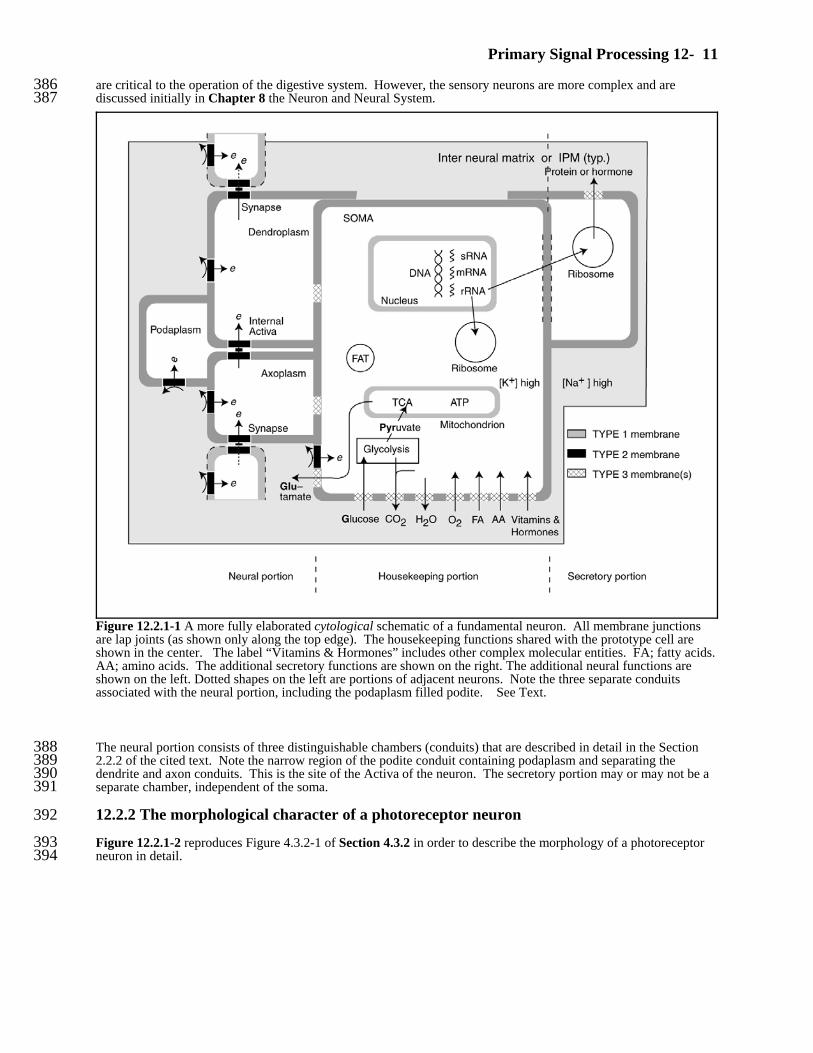
Cantarow & Shephartz provided a detailed schematic of a prototype “cell” in 196715. Figure 12.2.1-1 from the381above citation, extends their schematic to include the additional functions associated with a neuron (a neuro-sensory382neuron). The central portion of the figure is similar to the Cantarow & Shephartz cell, with some of their detail383omitted. The left-most portion adds the unique neural functions found in all neurons. The right-most portion adds384the unique secretory functions. Both the neural and secretory portions are found in nearly all sensory neurons and385
Primary Signal Processing 12- 11
Figure 12.2.1-1 A more fully elaborated cytological schematic of a fundamental neuron. All membrane junctionsare lap joints (as shown only along the top edge). The housekeeping functions shared with the prototype cell areshown in the center. The label “Vitamins & Hormones” includes other complex molecular entities. FA; fatty acids. AA; amino acids. The additional secretory functions are shown on the right. The additional neural functions areshown on the left. Dotted shapes on the left are portions of adjacent neurons. Note the three separate conduitsassociated with the neural portion, including the podaplasm filled podite. See Text.
are critical to the operation of the digestive system. However, the sensory neurons are more complex and are386discussed initially in Chapter 8 the Neuron and Neural System.387
The neural portion consists of three distinguishable chambers (conduits) that are described in detail in the Section3882.2.2 of the cited text. Note the narrow region of the podite conduit containing podaplasm and separating the389dendrite and axon conduits. This is the site of the Activa of the neuron. The secretory portion may or may not be a390separate chamber, independent of the soma.391
12.2.2 The morphological character of a photoreceptor neuron392
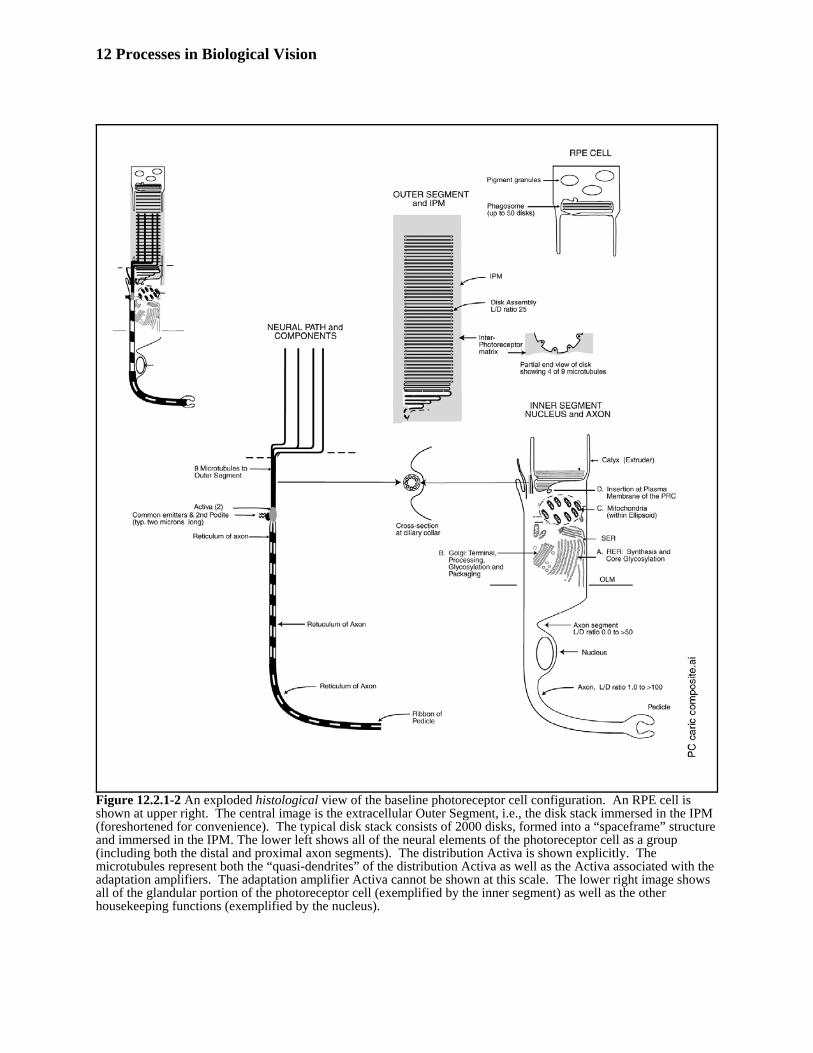
Figure 12.2.1-2 reproduces Figure 4.3.2-1 of Section 4.3.2 in order to describe the morphology of a photoreceptor393neuron in detail. 394
12 Processes in Biological Vision
Figure 12.2.1-2 An exploded histological view of the baseline photoreceptor cell configuration. An RPE cell isshown at upper right. The central image is the extracellular Outer Segment, i.e., the disk stack immersed in the IPM(foreshortened for convenience). The typical disk stack consists of 2000 disks, formed into a “spaceframe” structureand immersed in the IPM. The lower left shows all of the neural elements of the photoreceptor cell as a group(including both the distal and proximal axon segments). The distribution Activa is shown explicitly. Themicrotubules represent both the “quasi-dendrites” of the distribution Activa as well as the Activa associated with theadaptation amplifiers. The adaptation amplifier Activa cannot be shown at this scale. The lower right image showsall of the glandular portion of the photoreceptor cell (exemplified by the inner segment) as well as the otherhousekeeping functions (exemplified by the nucleus).
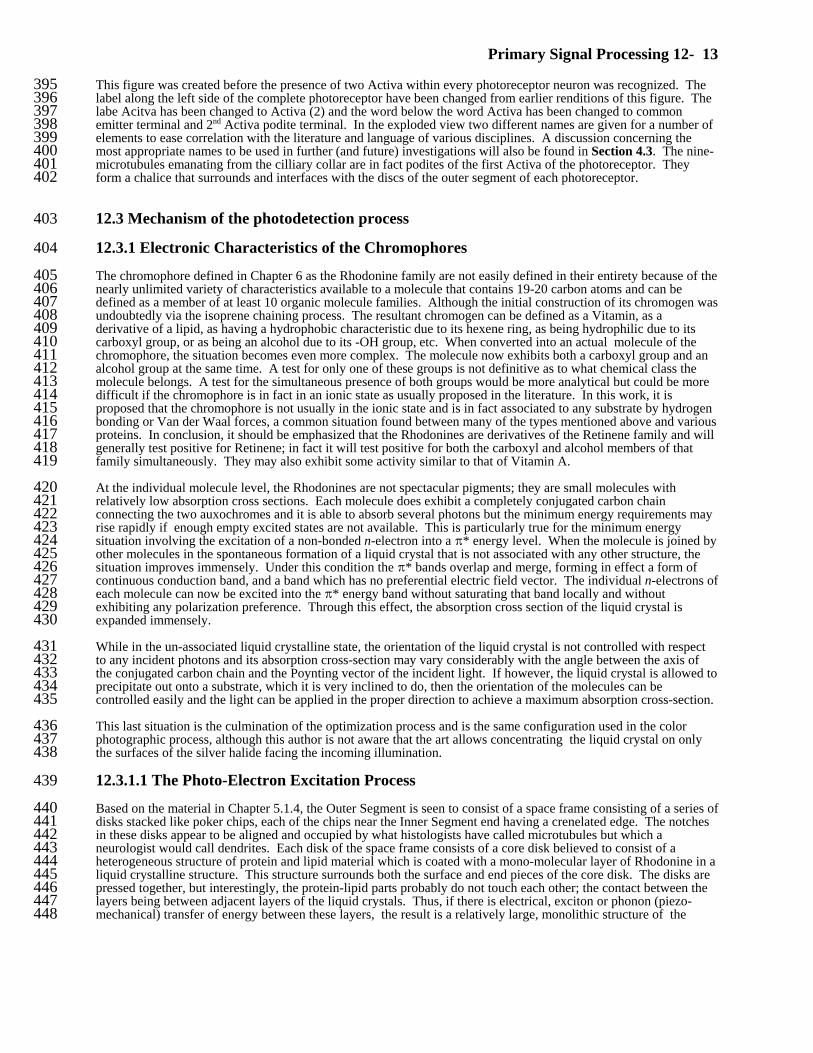
Primary Signal Processing 12- 13
This figure was created before the presence of two Activa within every photoreceptor neuron was recognized. The395label along the left side of the complete photoreceptor have been changed from earlier renditions of this figure. The396labe Acitva has been changed to Activa (2) and the word below the word Activa has been changed to common397emitter terminal and 2nd Activa podite terminal. In the exploded view two different names are given for a number of398elements to ease correlation with the literature and language of various disciplines. A discussion concerning the399most appropriate names to be used in further (and future) investigations will also be found in Section 4.3. The nine-400microtubules emanating from the cilliary collar are in fact podites of the first Activa of the photoreceptor. They401form a chalice that surrounds and interfaces with the discs of the outer segment of each photoreceptor.402
12.3 Mechanism of the photodetection process403
12.3.1 Electronic Characteristics of the Chromophores404
The chromophore defined in Chapter 6 as the Rhodonine family are not easily defined in their entirety because of the405nearly unlimited variety of characteristics available to a molecule that contains 19-20 carbon atoms and can be406defined as a member of at least 10 organic molecule families. Although the initial construction of its chromogen was407undoubtedly via the isoprene chaining process. The resultant chromogen can be defined as a Vitamin, as a408derivative of a lipid, as having a hydrophobic characteristic due to its hexene ring, as being hydrophilic due to its409carboxyl group, or as being an alcohol due to its -OH group, etc. When converted into an actual molecule of the410chromophore, the situation becomes even more complex. The molecule now exhibits both a carboxyl group and an411alcohol group at the same time. A test for only one of these groups is not definitive as to what chemical class the412molecule belongs. A test for the simultaneous presence of both groups would be more analytical but could be more413difficult if the chromophore is in fact in an ionic state as usually proposed in the literature. In this work, it is414proposed that the chromophore is not usually in the ionic state and is in fact associated to any substrate by hydrogen 415bonding or Van der Waal forces, a common situation found between many of the types mentioned above and various416proteins. In conclusion, it should be emphasized that the Rhodonines are derivatives of the Retinene family and will417generally test positive for Retinene; in fact it will test positive for both the carboxyl and alcohol members of that418family simultaneously. They may also exhibit some activity similar to that of Vitamin A.419
At the individual molecule level, the Rhodonines are not spectacular pigments; they are small molecules with420relatively low absorption cross sections. Each molecule does exhibit a completely conjugated carbon chain421connecting the two auxochromes and it is able to absorb several photons but the minimum energy requirements may422rise rapidly if enough empty excited states are not available. This is particularly true for the minimum energy423situation involving the excitation of a non-bonded n-electron into a B* energy level. When the molecule is joined by424other molecules in the spontaneous formation of a liquid crystal that is not associated with any other structure, the425situation improves immensely. Under this condition the B* bands overlap and merge, forming in effect a form of426continuous conduction band, and a band which has no preferential electric field vector. The individual n-electrons of427each molecule can now be excited into the B* energy band without saturating that band locally and without428exhibiting any polarization preference. Through this effect, the absorption cross section of the liquid crystal is429expanded immensely.430
While in the un-associated liquid crystalline state, the orientation of the liquid crystal is not controlled with respect431to any incident photons and its absorption cross-section may vary considerably with the angle between the axis of432the conjugated carbon chain and the Poynting vector of the incident light. If however, the liquid crystal is allowed to433precipitate out onto a substrate, which it is very inclined to do, then the orientation of the molecules can be434controlled easily and the light can be applied in the proper direction to achieve a maximum absorption cross-section.435
This last situation is the culmination of the optimization process and is the same configuration used in the color436photographic process, although this author is not aware that the art allows concentrating the liquid crystal on only 437the surfaces of the silver halide facing the incoming illumination.438
12.3.1.1 The Photo-Electron Excitation Process439
Based on the material in Chapter 5.1.4, the Outer Segment is seen to consist of a space frame consisting of a series of440disks stacked like poker chips, each of the chips near the Inner Segment end having a crenelated edge. The notches441in these disks appear to be aligned and occupied by what histologists have called microtubules but which a442neurologist would call dendrites. Each disk of the space frame consists of a core disk believed to consist of a443heterogeneous structure of protein and lipid material which is coated with a mono-molecular layer of Rhodonine in a444liquid crystalline structure. This structure surrounds both the surface and end pieces of the core disk. The disks are445pressed together, but interestingly, the protein-lipid parts probably do not touch each other; the contact between the446layers being between adjacent layers of the liquid crystals. Thus, if there is electrical, exciton or phonon (piezo-447mechanical) transfer of energy between these layers, the result is a relatively large, monolithic structure of the448
14 Processes in Biological Vision
16Baylor, D. Lamb, T. & Yau, K-W (1979) The membrane current of single rod outer segments. J. Physiol. Vol.288, pp. 589-61117 Dewar, M.(1952) Color and Constitution. III. Polyphenyls, polyenes, and phenylpolyenes; the significance ofcross-conjugation J Chem Soc pp 3544-3550
chromophores held in parallel planes; all (except those involved in turning the corner) with their conjugate chain449axes aligned with the Poynting vector of the incident light. This provides a very large area for the absorption of the450photons with a number of important features:451
+ the photo-electrical properties of the structure do not exhibit any polarization preference for452light traveling along the length of the space frame (although illumination from the side will show a453polarization preference exactly as shown by Baylor, Lamb & Yau16).454
+ the slow wave structure of the conjugated chain of the chromophore makes the effective455distance between the auxochrome layers approximately 230 times their actual spacing according456to Dewar17 resulting in an almost perfect length for causing the peak absorption band to appear in457the visual spectrum at one of three locations depending on which of the Rhodonine chromophore is458present in that photoreceptor.459
+ the spacing between liquid crystalline layers is such that the effective index of refraction of the460entire column of material is not greatly different from that of the immensely more massive protein-461lipid layer and/or the interstitial fluid which is water based with an index near 1.33. This prevents462the incident photons from encountering a major change in index which would cause the photons to463be reflected and expelled from the entrance end of the Outer Segment.464
+ the large number of chromophores present in the shared structure of the space frame provide an465immense number of photo-excitable n-electrons and a shared B* energy band structure which can466accept them. 467
Primary Signal Processing 12- 15
18Rodieck, R. (1973) Op. Cit. pg. 332-337
The absorption cross-section of this structure is dependent on the number of unexcited n-electrons remaining in the468unexcited state to the total number of n-electrons present prior to any excitation. Depending on this ratio, the469effective absorption characteristic can vary over a very large magnitude, more than 10 to the eighth power. If the470light continues to excite n-electrons faster than they are de-excited, the material will “bleach”, thus reducing its471absorption coefficient and resulting in the storage of a large number of electrons in the B* energy state of the liquid472crystalline structure.473
It is important to note that an Outer Segment that is separated from its Inner Segment will continue474to be light sensitive initially. However, the number of available unexcited n-electrons will475continually decrease with photon excitation. The unique dipolar mechanical arrangement of the476auxochromes of the chromophores prevent these materials from relaxing by thermal or flourescent477mechanisms. As a result the material will become transparent. Its only mechanism of relaxation is478by secondary means with time constants measured in hours. Researchers usually report that any479excited material, derived from separated Outer Segments and stored in the dark, has relaxed when480they return to work the next day. 481
12.3.1.2 The Electron-Neural De-excitation Process482
Building on the foundation of the previous Section; one further assumption will be made. It is known that the de-483excitation of photo-electrons of the OS alone in-vitro is a very slow or non-existent process. Generally, de-484excitation will occur overnight which implies a second order thermal relaxation. This fact indicates two things. The485protein/lipid layer at the core of a disk does not provide an effective medium for energy transfer from the liquid486crystalline structure. Further, the no longer vital dendrites of the nervous tissue remaining within the Outer Segment487structure do not provide an effective de-excitation avenue either.488
It is quite reasonable to assume the disk substrate materials alone do not support de-excitation of the liquid crystal.489Neither the protein or the lipid classes of organic material typically exhibit any energy band differences in the range490below 3 electron volts. 491
It is also quite reasonable to assume the no longer living nervous tissue cannot continue to interface with the liquid492crystal in its normal manner. As will be seen below, a biologist would say it is only able to interact with the liquid493crystal when it is in the irritable state when alive, not while it is in its refractive state or when no longer “live”. The494physicist would suggest an alternate explanation. Unless the Activa is properly biased, the electron-hole pairs495created within the base region of the Activa will not be removed from that region. The resultant unsustainable496charge distribution within the region will no longer allow acceptance of energy from the pizo-electric convertor. 497Therefore, the chromophore becomes increasingly excited and it is said to bleach.498
It is also well established that the chromophores, at least the chromogens of the Retinene family do not fluoresce499when excited, indicating that they do not spontaneously de-excite by re-radiation, at least in the anticipated and500observed spectral regions501
Therefore, the proposition will be made that it is a function of the living neural component of the photoreceptor cell502which is responsible for de-exciting the electrons occupying the B* energy state of the liquid crystal in the Outer503Segment of that same cell.504
This proposition introduces an interesting avenue of investigation. A neuron is normally a rate limited signaling505device, with a maximum propagation velocity limited by the impedance of the axon sheath and a specific refractory506interval before it can be caused to fire a subsequent time. A neuron exhibits a minimum input signal below which it507will not fire. This level is generally in the neighborhood of 2.0 electron volts or more. For comparison, the energy508threshold of silver bromide is approximately 2.6 eV. Since the energy of thermally excited electrons at the509temperature of the body is approximately 25 milli-electron-volts, this provides a satisfactory margin against self510induced firing. 2.6 eV is also equal to the energy of an absorbed photon with a wavelength of 0.48 microns, a very511“blue” photon. 2.0 eV. corresponds to a photon at 0.61 micron, an “orange” photon.512
12.4 Earlier conception of the amplification process in neurons513
Rodieck18 has provided a summary of the theories of amplification in vision circa. 1973. He found these to fall into514
16 Processes in Biological Vision
19MacLeod, D. Chen, B. & Crognale, M. (1989) Spatial organization of sensitivity regulation in rod vision. VisionRes. vol. 29, no. 8, pp 965-978
three categories; the proenzyme hypothesis, the photoconduction hypothesis, and the saccule hypothesis. These515theories were primarily concepts at that time and they have not matured substantially. The saccule hypothesis has516been advanced into the glutamate cascade hypothesis. However, this concept is also supported primarily on its517ability to meet the perceived requirements based on kinetics and the use of certain chemicals found ubiquitously near518neurons. As Rodieck said, “A general difficulty with all saccule hypotheses is that they fail to account for the519behavior of cones whose outer-segment lamellar structure results from infolding of the outer-segment plasma520membrane. . .” Concurring with another Rodieck statement, the photoconduction hypothesis, involving a change in521conductivity, is not promising. Unfortunately, he also discounts the entire field of photoconduction and photovoltaic522effects without further definition of the terms. The proenzyme hypothesis has not been pursued since the 1960's.523
The primary problem with the saccule and subsequent cascade theories is the absence of any524evidence of a membrane surrounding the outer segments of the photoreceptors. To the525contrary, recent electron microscopy has shown the total absence of such a membrane in a wide526range of chordates. See the website, www.4colorvisioncom, for a substantial reward for any527conclusive evidence for the presence of such a membrane in humans or other chordates.528
MacLeod, et. al. have argued that the adaptation process is different in cold-blooded than in warm-blooded animals529on purely psychophysical grounds19. They did not provide any rigorous model of the proposed mechanism or even530quantify the gain mechanism involved. They built on a paper by Rushton in 1965 that claimed that the sensitivity of531the rods (the putative achromatic detection mechanisms in vision) never changes and that the adaptation mechanism532was found in a “pool” subsequent to the photoreceptor cells. These concepts are not supported here.533
Based on this work, the mechanism of amplification can be clearly defined based on conventional semi-conductor534electronics applied to the electrolytic environment of biology. The mechanism provides a recognized method and535and achievable amount of amplification. It also explains the variation in the amplification based on the state of the536applicable variables and circuits . The circuit details and results presented below contribute directly to the537comprehensive understanding of the adaptation characteristics of vision presented in Chapters 16 & 17.538
12.5 The Complete Stage 1 Photo Detection Process 539
The block diagram of a suitable network representing the photodetection function of the photoreceptor cell must540contain the following elements:541
1. The chromophoric transducer for which the transfer function is known and known to be 542nonlinear at high signal levels.543
2. The exciton to electron transducer which is known to preserve the quantum nature of the signal at least544at low light levels.545
3. An amplifier with a passband of at least 100 hertz which is able to output approximately 3 x 104546electrons per input photon in the linear region but which exhibits a significant degree of saturation547at output currents near 20 pA.548
4. A power source able to provide the above number of electrons as a minimum to the amplifier when the549incident flux level is measured in 100-1000’s of photons per second per photoreceptor.550
It must exhibit a variable time delay as a function of the input illumination. It is also necessary that some element in551the network provide a level control such that the output signal excursions remain within the dynamic range of the552output device, typically 0- 20 pA in the turtle but ranging up to 29 pA in both the turtle and salamander, while the553input intensity varies slowly over a factor of 105 or more. Although this may consist of an amplifier with a554logarithmic transfer characteristic, this is unlikely. The signal saturation exhibited by the data indicates that a555different approach is more likely. 556
The automatic gain control of vision is quite different. It is associated with the bleaching of the chromophores of the557retina. It involves an internal feedback mechanism (Section 12.5.3). That is there is no identifiable external558feedback path.559
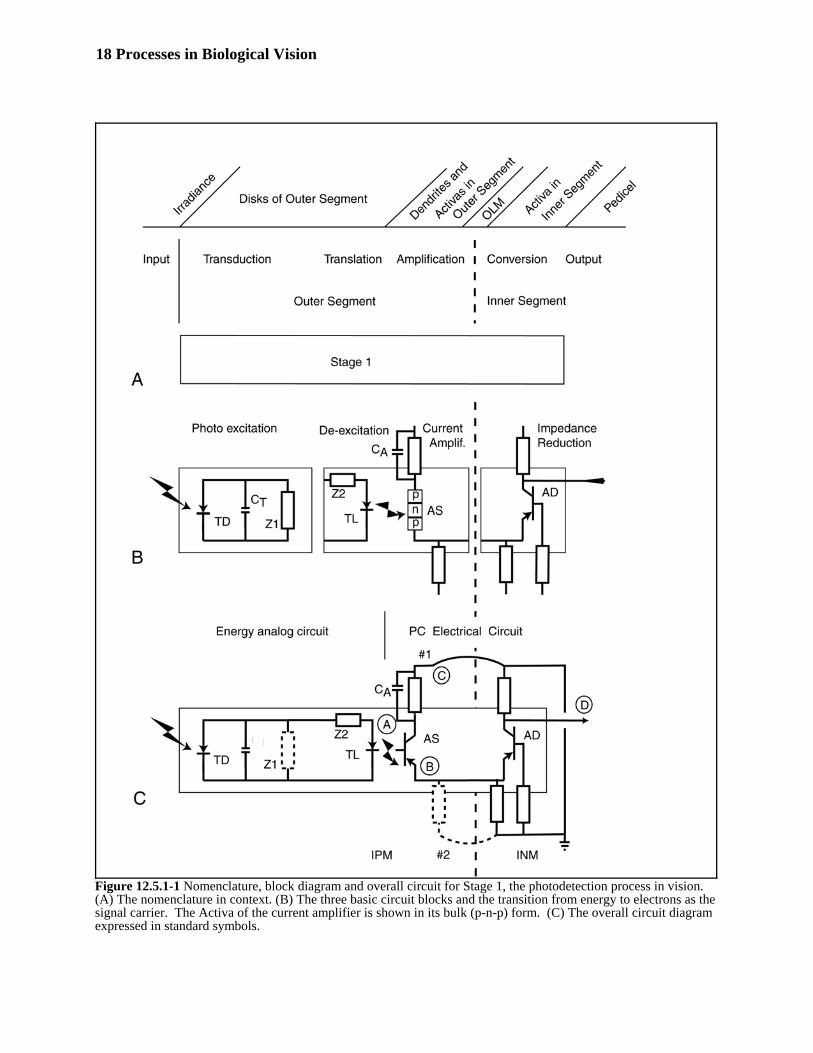
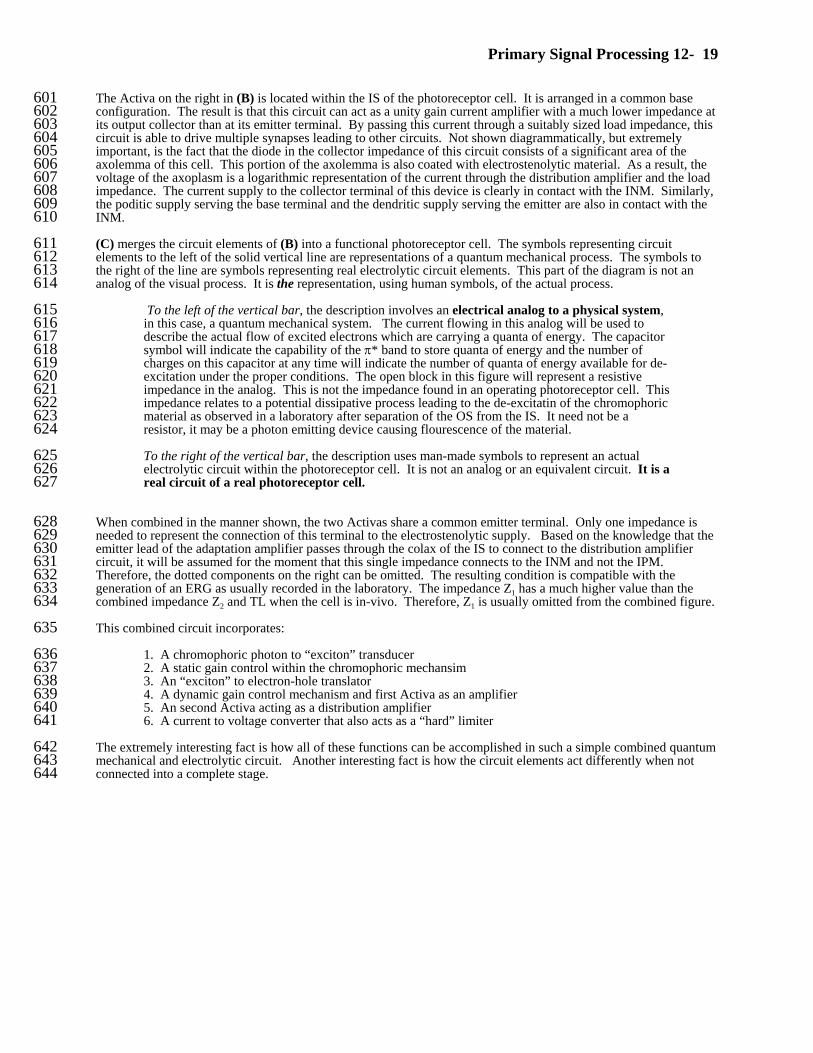
With these requirements and mechanisms in mind, the circuit of Figure 12.5.1-1 is suggested. (A) shows the560
Primary Signal Processing 12- 17
functional block diagram. (B) shows individual portions of the proposed circuit for illustrative purposes and (C)561shows the overall circuit as proposed after assembly. 562
The top level functional block diagram is shown as Stage 1 in (A). It is accompanied by several rows of labels to563orient the reader and provide a consistent relationship between the labels found in the literature. A critical point to564note in the top row of labels is that the dendritic structure associated with the IS is physically located within the OS. 565This places the functions of transduction, translation, and adaptive amplification all within the structure of the OS. 566The IS is the home of the output, or distribution amplifier, of the photoreceptor cell. This amplifier uses an Activa567with a different performance characteristics and therefore a different type designation. The dashed vertical line568indicates the probable location of the Outer Limiting Membrane, OLM. The primary purpose of this membrane569appears to be the chemical separation of the specialized metabolic processing of the IPM from the more normal570metabolic processing of the INM. This membrane is, however, an electrical insulator. It plays a significant role in571the signaling function of the visual system. The two arcs crossing the OLM external to the complete photoreceptor572cell represent the ground bridges that play an important role in creating the conventional ERG waveform.573
(B) presents the individual circuits of the photoreceptor cell for ease of discussion. The two sections on the left are574laid out according to the earlier discussion. The left most diode, labeled TD for TransDuction, is the symbol used575for the electronic analog of the quantum mechanical process supported by the chromophoric material during576excitation. This diode is shunted by a capacitor, CT, representing the quantum mechanical equivalent of the excited577state of the chromophoric material. The diode is also shown shunted by an impedance Z1. As discussed above, the578unique character of the chromophoric molecules makes the decay time constant of the equivalent circuit, Z1 x CT,579hours long. The second diode, labeled TL for TransLation, and impedance, Z2, constitute the de-excitation process580of the chromophoric material when in contact with the properly biased Activa labeled AS. The Activa is shown in its581bulk form to emphasize the energy is transferred from the chromophore material to the n-type region of the p-n-p582device forming the current amplifier. The impedance, Z2, is a pure delay circuit representing the travel time related583to the travel distance between the point of creation of an excited electron, an exciton, in the chromophoric material584and its point of de-excitation along the fissures of the disk stack. This delay element is a variable related to the585intrinsic repulsion between likely charged particles within the conducting region of the π* band of the liquid586crystalline structure. 587
The impedance in the collector lead of the Type AS device is located within furrows of the disk stack and is in588contact with the electrolytes of the IPM. There is no membrane separating the disk stack from the IPM. There are589only the materials associated with the electrostenolytic supply. They are stored as coatings on the outside of the590disk stack, including the volume within the furrows. These materials react on the outer surface of the dendrites in591order to power the type AS Activas. That is why, the real impedances associated with the Activas are shown592straddling the membrane wall of the photoreceptor cell. These are real impedances represented by standard593electronic components. The part outside of the cell wall constitutes the battery element of the supply and the part594inside the cell constitutes the diode representing the cell wall. Where appropriate, these impedances are shown595shunted by a real capacitance. In the case of the type AS device employed in the variable gain adaptation amplifier596circuit, this capacitance is an integral part of a low pass filter along with the electrostenolytic supply and the cell597wall. As will be shown elsewhere in detail, this low pass filter has two poles. These poles determine the shape of598the dark adaptation characteristic of animal vision. This same capacitor is also part of the charging circuit that599controls the light adaptation characteristic of animal vision.600
18 Processes in Biological Vision
Figure 12.5.1-1 Nomenclature, block diagram and overall circuit for Stage 1, the photodetection process in vision.(A) The nomenclature in context. (B) The three basic circuit blocks and the transition from energy to electrons as thesignal carrier. The Activa of the current amplifier is shown in its bulk (p-n-p) form. (C) The overall circuit diagramexpressed in standard symbols.
Primary Signal Processing 12- 19
The Activa on the right in (B) is located within the IS of the photoreceptor cell. It is arranged in a common base601configuration. The result is that this circuit can act as a unity gain current amplifier with a much lower impedance at602its output collector than at its emitter terminal. By passing this current through a suitably sized load impedance, this603circuit is able to drive multiple synapses leading to other circuits. Not shown diagrammatically, but extremely604important, is the fact that the diode in the collector impedance of this circuit consists of a significant area of the605axolemma of this cell. This portion of the axolemma is also coated with electrostenolytic material. As a result, the606voltage of the axoplasm is a logarithmic representation of the current through the distribution amplifier and the load607impedance. The current supply to the collector terminal of this device is clearly in contact with the INM. Similarly,608the poditic supply serving the base terminal and the dendritic supply serving the emitter are also in contact with the609INM.610
(C) merges the circuit elements of (B) into a functional photoreceptor cell. The symbols representing circuit611elements to the left of the solid vertical line are representations of a quantum mechanical process. The symbols to612the right of the line are symbols representing real electrolytic circuit elements. This part of the diagram is not an613analog of the visual process. It is the representation, using human symbols, of the actual process. 614
To the left of the vertical bar, the description involves an electrical analog to a physical system,615in this case, a quantum mechanical system. The current flowing in this analog will be used to616describe the actual flow of excited electrons which are carrying a quanta of energy. The capacitor617symbol will indicate the capability of the π* band to store quanta of energy and the number of618charges on this capacitor at any time will indicate the number of quanta of energy available for de-619excitation under the proper conditions. The open block in this figure will represent a resistive620impedance in the analog. This is not the impedance found in an operating photoreceptor cell. This621impedance relates to a potential dissipative process leading to the de-excitatin of the chromophoric622material as observed in a laboratory after separation of the OS from the IS. It need not be a623resistor, it may be a photon emitting device causing flourescence of the material.624
To the right of the vertical bar, the description uses man-made symbols to represent an actual625electrolytic circuit within the photoreceptor cell. It is not an analog or an equivalent circuit. It is a626real circuit of a real photoreceptor cell. 627
When combined in the manner shown, the two Activas share a common emitter terminal. Only one impedance is628needed to represent the connection of this terminal to the electrostenolytic supply. Based on the knowledge that the629emitter lead of the adaptation amplifier passes through the colax of the IS to connect to the distribution amplifier630circuit, it will be assumed for the moment that this single impedance connects to the INM and not the IPM. 631Therefore, the dotted components on the right can be omitted. The resulting condition is compatible with the632generation of an ERG as usually recorded in the laboratory. The impedance Z1 has a much higher value than the633combined impedance Z2 and TL when the cell is in-vivo. Therefore, Z1 is usually omitted from the combined figure.634
This combined circuit incorporates:635
1. A chromophoric photon to “exciton” transducer6362. A static gain control within the chromophoric mechansim6373. An “exciton” to electron-hole translator6384. A dynamic gain control mechanism and first Activa as an amplifier 6395. An second Activa acting as a distribution amplifier6406. A current to voltage converter that also acts as a “hard” limiter641
The extremely interesting fact is how all of these functions can be accomplished in such a simple combined quantum642mechanical and electrolytic circuit. Another interesting fact is how the circuit elements act differently when not643connected into a complete stage.644
20 Processes in Biological Vision
12.5.1 The Transduction Block in vision 645
The transduction function within a photoreceptor is performed by a liquid crystalline material coated onto the646external surface of a protein substrate, known as opsin. The liquid crystalline material consists of one of four647chromophores with an overall sensitivity to light with a wavelength of between roughly 300 nm. and 675 nm. Each648chromophore is sensitive to a region of about 100 nm. within this range. 649
12.5.1.1 Fundamentals of biological transduction in vision650
The chromophores are retinoids derived from Vitamin A. However, they are not retinal, retinol or one of these651materials associated with the protein, opsin, through a Schiff-base linkage. Whereas both retinal and retinol contain652a single polar atom in a conjugated carbon chain, the chromophores contain two polar atoms in a conjugated carbon653chain. The optical performance of the compounds with 2-polar atoms is significantly different. 654
Both retinal and retinol exhibit an absorption spectra related to the length of the conjugated carbon chain they are655based on. The peak of this absorption spectra is nominally 500 nm (some investigators have measured 498.3 nm). 656The absorption spectra of these materials is isotropic in dilute solution. The absorption coefficient of these materials657is not very high. 658
The chromophores of the visual process are different. They exhibit a higher absorption coefficient based on the659quantum resonance occurring between the two polar atoms. This resonance absorption is only exhibited when the660material is in the liquid crystalline state. The spectral peak is not related to the total length of the conjugated carbon661chain. It is only related to the length of the conjugated chain, including the polar atoms as termini, between the two662polar atoms. Because of the “slow wave structure” found in the liquid-crystal, the spectral response of these663materials is highly anisotropic. Peak absorption is achieved when the incident light is parallel to the optical axis of664the individual molecules. This optical axis is essentially parallel to the mechanical axis of these all-trans molecules. 665Because of the “slow wave structure,” the liquid crystal is most sensitive to a wavelength approximately 250 times666longer than the physical length of the molecule. 667
The transduction block consists of the disks of the OS, more specifically, the chromophoric material, rhodonine, in668the liquid crystal form present as a coating over the structural protein opsin. These coated disks are stacked into a669column of thin disks. The photons that are intercepted by this column of disks, normally the column is irradiated670along its cylindrical axis, are absorbed by the chromophores and cause an electron to be excited into the B* band of671the crystal. Whether a photon is absorbed or not is controlled by the absorption cross-section of the OS at the672spectral wavelength of the photon. All absorbed photons generate excited electrons. These excited electrons move673within the energy band of the liquid crystal until they encounter some mechanism to cause their de-excitation. 674Normally, this cannot occur within the crystalline structure because of the symmetrical dipole configuration of the675chromophores and the inability of the protein structure to absorb energy at these energy levels, approximately 1.0 to6762.5 electron volts. Over an extended period of time, the electrons will be de-excited through second order thermal677processes such as interaction with the material found in the inter-photoreceptor matrix (IPM). This secondary678process involves time constants on the order of a few minutes to a few hours.679
Because of its great significance in vision, the transduction process and the resultant transfer characteristic of the680process is treated separately in Appendix A and more compactly in Section 7.2 of this work. The complete681transduction equation, presented there as the Photoexcitation/De-excitation Equation (or the P/D Equation) is found682to involve a differential equation of the first order with a complex argument. This complete equation can be683simplified under a number of different assumptions leading to the correct mathematical form to correlate with the684work of many different investigators. The results of this treatment will be utilized beginning with Section 12.7.685
An analog of the energy circuit for the transduction block is shown in the left portion of (b). This analog consists of686a radiation sensitive photoemitter, a capacitor and a resistive element. This circuit can operate without the presence687of a power source (a battery). As is discussed in Appendix A, the performance of the photoemitter is a bit688specialized in that this circuit analog is isolated electrically from any other source of charges and involves quantum689mechanics. The total number of available charges is finite. Therefore, the number of charges generated by the690photoemitter, is limited by the number already moved from the bottom of the circuit to the top and stored on the691capacitor. The excess charges stored on the capacitor are eventually returned to their original location by the692resistive element. The value of this resistive element will become an important consideration in the overall operation693of the circuit.694
Primary Signal Processing 12- 21
In the case of chordates, the liquid crystalline material of the chromophores is formed on the surface of the disc695substrates with the optical axis of the chromophore perpendicular to the surface of the disc. In this configuration, the696liquid crystal exhibits a very high absorption coefficient for light passing along the axis of the disc stack. It exhibits697essentially no absorption to light passing perpendicular to the stack. 698
The above situation explains a problem in many laboratory experiments. The spectral absorption measured by699micro-reflectometry along the mechanical axis of the OS will exhibit the anisotropic resonance absorption spectrum700of one of the four chromophores. The peak will occur at either 342, 437, 523 or 625 nm. for animals at a body701temperature of 37°C (98.6° F). The spectral absorption measured using an optical beam passing perpendicular to the702mechanical axis of an OS will always exhibit the isotropic (non-resonant) absorption spectrum of the underlying703conjugated carbon chain. In this case that chain shows a peak at 500 nm. regardless of which chromophore is704actually present. This peak is not exclusive to retinal or retinol. It is characteristic of any simple conjugated carbon705chain terminated with at least one polar atom.706
12.5.1.2 Fundamental quantum-mechanics of biological transduction in vision707
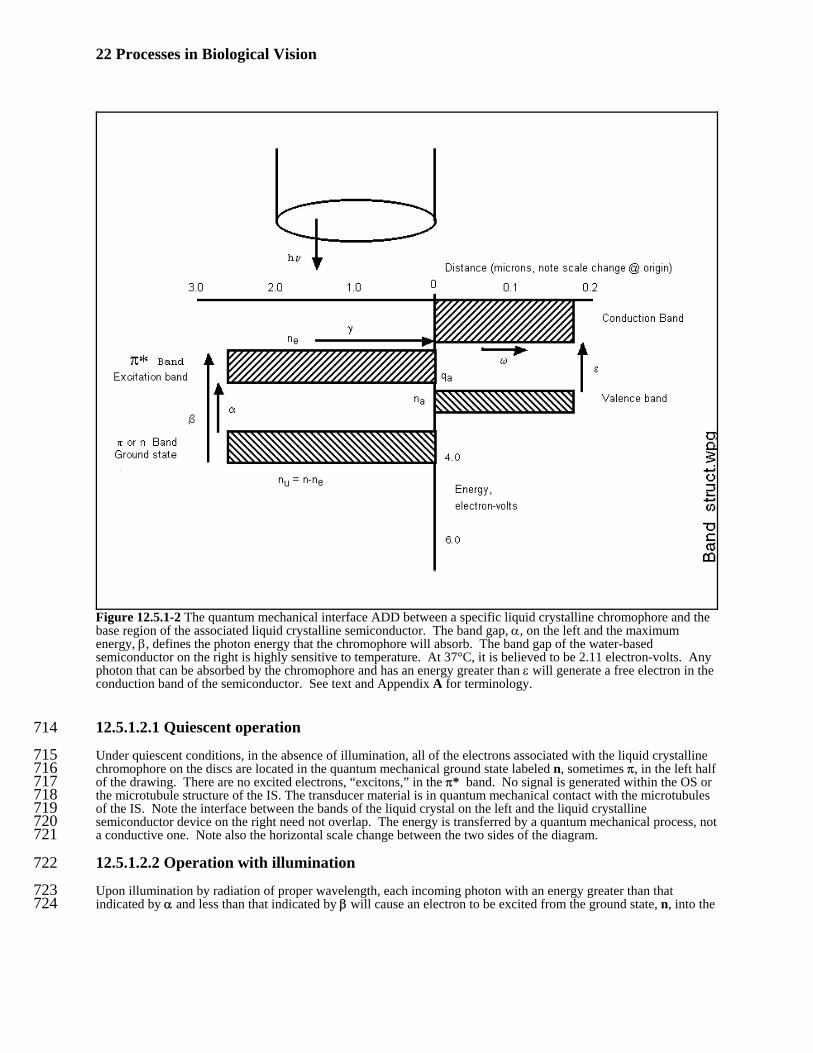
Figure 12.5.1-2 illustrates the quantum mechanical model of the transduction process for a specific chromophore to708transfer the energy of an incident photon to the dendrite of the IS for further manipulation. The terminology is709discussed in detail in Appendix A. Only the highlights will be discussed below. The light shown enterring from the710top is parallel to the long axis of the conjugated retinoid forming the chromophore. The typical disc diameter is 2.0711microns as shown on the left. The dimensions of the base region of the distributed 1st Activa within a microtubule of712the photoreceptor is much smaller, on the order of 0.1 microns.713
22 Processes in Biological Vision
Figure 12.5.1-2 The quantum mechanical interface ADD between a specific liquid crystalline chromophore and thebase region of the associated liquid crystalline semiconductor. The band gap, α, on the left and the maximumenergy, β, defines the photon energy that the chromophore will absorb. The band gap of the water-basedsemiconductor on the right is highly sensitive to temperature. At 37°C, it is believed to be 2.11 electron-volts. Anyphoton that can be absorbed by the chromophore and has an energy greater than ε will generate a free electron in theconduction band of the semiconductor. See text and Appendix A for terminology.
12.5.1.2.1 Quiescent operation714
Under quiescent conditions, in the absence of illumination, all of the electrons associated with the liquid crystalline715chromophore on the discs are located in the quantum mechanical ground state labeled n, sometimes π, in the left half716of the drawing. There are no excited electrons, “excitons,” in the π* band. No signal is generated within the OS or717the microtubule structure of the IS. The transducer material is in quantum mechanical contact with the microtubules718of the IS. Note the interface between the bands of the liquid crystal on the left and the liquid crystalline719semiconductor device on the right need not overlap. The energy is transferred by a quantum mechanical process, not720a conductive one. Note also the horizontal scale change between the two sides of the diagram.721
12.5.1.2.2 Operation with illumination 722
Upon illumination by radiation of proper wavelength, each incoming photon with an energy greater than that723indicated by α and less than that indicated by β will cause an electron to be excited from the ground state, n, into the724
Primary Signal Processing 12- 23
20Gennis, R. (1989) Biomembranes: molecular structure and function. NY: Springer-Verlag pg. 354
π* band of the liquid crystalline transducer. These excitons appear at a location directly above where the photon725was absorbed. This can be anywhere in the 2.0 micron diameter of the crystalline structure shown. These excitons726will travel to the quantum junction with the translation circuitry of the photoreceptor cell by one of several means. 727The important point is that there travel velocity is finite and the resulting ensemble of excited electrons exhibits a728finite delay time between excitation and arrival at the boundary where excitation can occur.729
The lifetime of excitons in the π∗ band is very long relative to events associated with vision, i.e., the chromophores730incorporating oxygen atoms are not known to fluoresce under physiological conditions.731
Upon arrival at the boundary, the excitons are prepared to give up their energy if there is a quantum mechanical732opportunity to do so. This opportunity is provided by the input structure of the dendrites. Under normal conditions,733each exciton will give up its energy and be de-excited back to the ground state, n, in exchange for a free electron (or734hole) being released within the junction of the first Activa within the microtubule structure interfacing with the outer735segment.736
At any given time the absorption coefficient of the liquid crystal associated with a given disc (or possibly a surface737of the disc if the coating is fractured along the disc edge), is proportional to the number of unexcited electrons in the738n band given by nu = n - ne739
12.5.1.2.3 Transient operation 740
The transient performance of the transducer is quite straight forward. However, it does include a state variable. 741Upon the application of illumination, the absorption coefficient is directly proportional to the number of unexcited742electrons in the n band. If the photoreceptor has been in the dark for some time, all of the available electrons are in743the n band and nu = n. If however, the photoreceptor was recently illuminated, it is possible some of the excited744electrons have not yet been de-excited. In that case, the number of available electrons is nu = n - ne. Once a photon745is absorbed, an exciton appears in the π∗ band within less than a microsecond. The travel time to the boundary is746appreciably longer and is a function of how many excitons are in the band. Once at the boundary, de-excitation747occurs in less than a microsecond under physiological conditions. The result is that the “attack” transient response748of the transducer to illumination, the time to generate excitons in the π∗ band, has a short time constant and the749“decay” transient response, the time to clear the π∗ band, has a much longer time constant. However, these are not750the time constants of interest in vision. 751
In vision, the time constants of interest are related to the boundary situation. The attack time constant related to752vision is a function of the travel time between the creation of an exciton and its arrival at the boundary, ready for de-753excitation. This time constant is a function of the illumination level. The decay time constant is related to how long754it takes to clear the π∗ band of excitons after the illumination ceases. Normally, this time constant is independent of755the prior illumination level. The entire equation of the transient response of the transducer/translation process is756given in the Photoexcitation/De-excitation Equation, (P/D) given in Appendix A. The attack time constant of the757combination is quite variable, extending from less than one millisecond for high illumination to greater than one-half758second for very low illumination. The decay time constant is nearly constant at a given temperature. For humans,759its value is 0.525 seconds. These are only two of the time constants important in vision. They are essentially760independent of any metabolic conditions occurring in conjunction with the active circuitry of the eye.761
12.5.1.3 The quasi-static transduction process762
Eddington, writing in Gennis20 as late as 1989, attempted to describe the operation of the signal transduction process763in terms of a cytoplasmic cascade. His conclusion as of 1989 was that “the details are somewhat murky or764unknown.” The following and later sections will clarify most of these details. However, the clarification is not765compatible with a cytoplasmic cascade. 766
Figure 12.5.1-3 highlights the steady-state transfer characteristic of the transduction process. The frame on the left767summarizes the functional elements involved. For simplicity, all of the chromophores of a given region of the retina768will be considered en masse and (initially) to exhibit a single absorption spectrum described as that of the769M–channel. 770
In this figure, the expression “chromophores en masse” can be interpreted in two distinct ways. It can refer to771
24 Processes in Biological Vision
the group of chromophores, of a specific spectral type, in the liquid-crystalline state associated with and772appropriately oriented within a single outer segment of a photoreceptor. 773
Alternately, it can refer to a larger group associated with multiple outer segments exhibiting the same spectral774sensitivity within a given unit area of the retinal surface. 775
The Activa shown can consist of a single Activa within a single photoreceptor or it can represent a group of776Activas associated with a group of outer segments as defined above. 777
In either case, the single base connection to the chromophores en masse shown consists of multiple neurites778contacting the chromophore material at the edges of the disc stack(s). These neurites have frequently been779described morphologically as dendrites. However, they are more complex than typical dendrites. The780morphological label microtubules will be used when speaking of these neurites until their functional role is781defined in Section 12.5.2.782
The excitation photon flux is shown as F photons/sec. The total number of orbitals available for excitation on the783surface of a disc will be taken as A0. The exact value of A0 is discussed in Section 4.3.5.3.5; The value is on the784order of 107 per disc and 1010 for a complete outer segment of one photoreceptor. Each absorbed photon results in an785electron in a π–orbitals (the ground state) being excited into a π*–orbital. The instantaneous absorption coefficient786is a variable that depends on the total number of unexcited electrons in the π–orbitals, A0 –(F-K). The Activa787provides a de-excitation mechanism described by K de-excitons/sec. This de-excitation mechanism is represented788by a current that is a fixed percentage of the collector current, Ic. The reciprocal of this percentage is defined as the789amplification of the circuit. Z describes the impedance of the electrostenolytic source associated with the –150 mV790supply potential. This Z plays a major role in describing the “dark adaptation characteristic” of human vision791(Section 17.6). The output signal of the overall circuit is taken as the voltage across the resistor in the emitter circuit792of the Activa, AS.793
The photon excitation process is described in detail in Section 5.4.3. The precise interface between the base current,794K, of the Activa and the chromophore, and how it results in the de-excitation of the chromophores, is a more795complex quantum-mechanical process than required to understand the overall circuit operation. It will be796summarized in Section 12.5.2.797
The highly sensitive chromophores are surrounded by higher energy (insulating) materials except for the active798tissue of the microtubules perpendicular to the edges of each opsin disk. The surrounding material consists of the799inter-photoreceptor-matrix, IPM, and not a lemma associated with the inner segment. Further, the excitation process800involves the triplet state of p*–orbitals and is peculiar to oxygen. Electrons from this level do not de-excite801spontaneously (thermally). See Section 5.3.1. Thus, the excitation level of the chromophores is determined by the802difference between the level of photon excitation, F, and the level of de-excitation via the base current of the Activa,803K.804
Frame A shows the overall situation for a constant level of de-excitation, K de-excitons/sec. As the photon flux805level increases above the de-excitation level, the net excitation level, the number of π*–orbitals, within the806chromophore increases. As a result, the number of unexcited π–orbitals is drastically reduced.807
Frame B illustrates the net absorptance of the chromophoric mass as a function of the photon flux. For fluxes below808K, there is no net excitation level and the absorptance coefficient is essentially constant at its maximum value. An809absorptance can be described by a relative optical density as shown by the right scale. At maximum absorptance, Ao,810the optical density of the chromophore mass is high, taken here as a relative density of 2.0 or 100%. As the811absorptance decreases, the optical density also decreases. The chromophore mass is said to bleach as a function of812the excitation level. This is caused by the failure of the de-excitation flux, K, to equal the potential photon-excited813flux.814
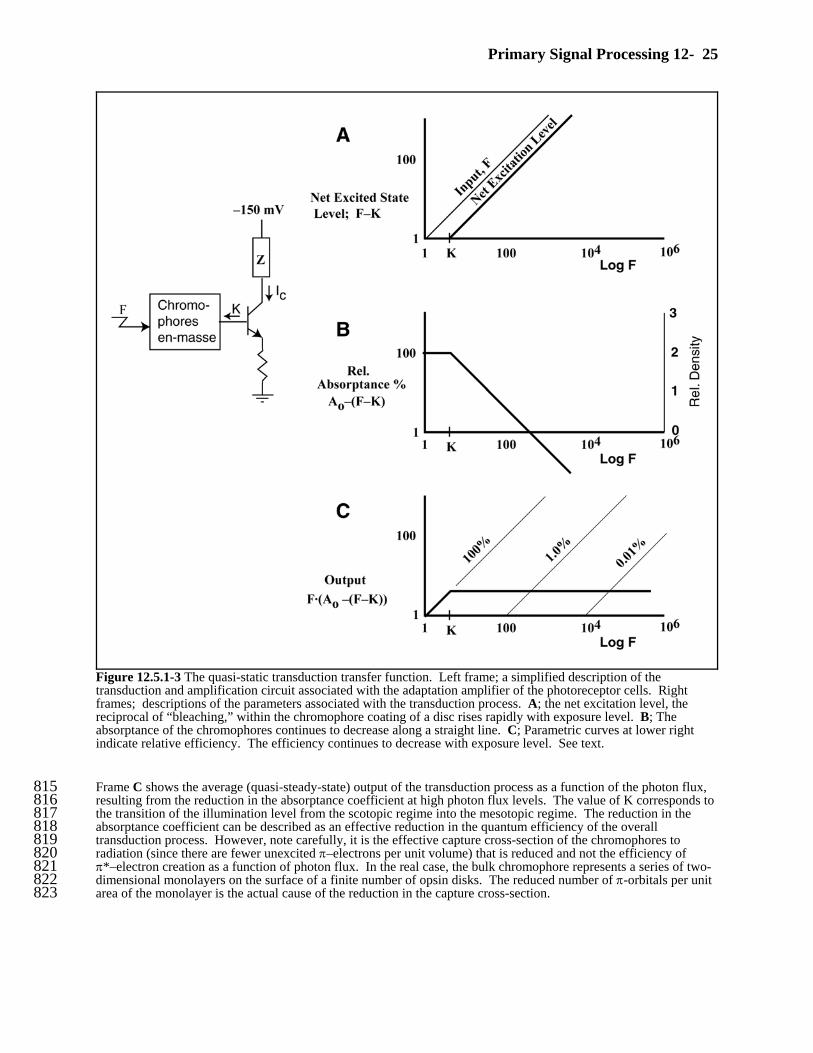
Primary Signal Processing 12- 25
Frame C shows the average (quasi-steady-state) output of the transduction process as a function of the photon flux,815resulting from the reduction in the absorptance coefficient at high photon flux levels. The value of K corresponds to816the transition of the illumination level from the scotopic regime into the mesotopic regime. The reduction in the817absorptance coefficient can be described as an effective reduction in the quantum efficiency of the overall818transduction process. However, note carefully, it is the effective capture cross-section of the chromophores to819radiation (since there are fewer unexcited π–electrons per unit volume) that is reduced and not the efficiency of820π*–electron creation as a function of photon flux. In the real case, the bulk chromophore represents a series of two-821dimensional monolayers on the surface of a finite number of opsin disks. The reduced number of π-orbitals per unit822area of the monolayer is the actual cause of the reduction in the capture cross-section.823
Figure 12.5.1-3 The quasi-static transduction transfer function. Left frame; a simplified description of thetransduction and amplification circuit associated with the adaptation amplifier of the photoreceptor cells. Rightframes; descriptions of the parameters associated with the transduction process. A; the net excitation level, thereciprocal of “bleaching,” within the chromophore coating of a disc rises rapidly with exposure level. B; Theabsorptance of the chromophores continues to decrease along a straight line. C; Parametric curves at lower rightindicate relative efficiency. The efficiency continues to decrease with exposure level. See text.
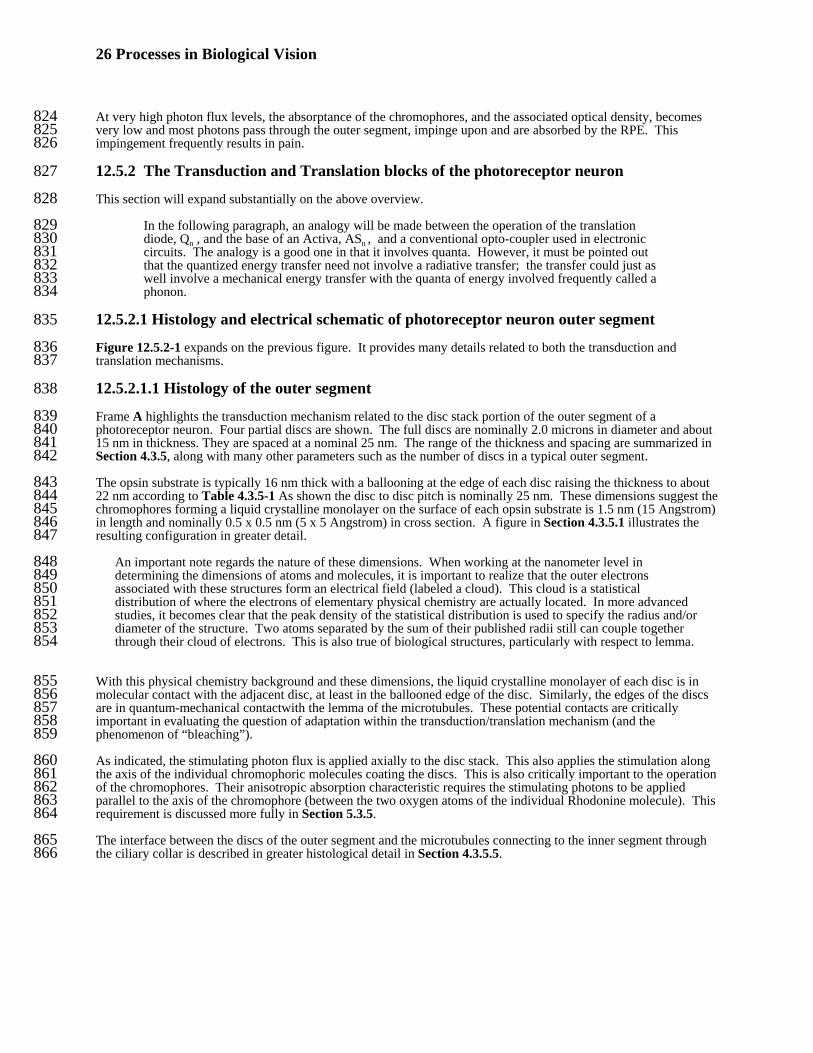
26 Processes in Biological Vision
At very high photon flux levels, the absorptance of the chromophores, and the associated optical density, becomes824very low and most photons pass through the outer segment, impinge upon and are absorbed by the RPE. This825impingement frequently results in pain.826
12.5.2 The Transduction and Translation blocks of the photoreceptor neuron827
This section will expand substantially on the above overview.828
In the following paragraph, an analogy will be made between the operation of the translation829diode, Qn , and the base of an Activa, ASn , and a conventional opto-coupler used in electronic830circuits. The analogy is a good one in that it involves quanta. However, it must be pointed out831that the quantized energy transfer need not involve a radiative transfer; the transfer could just as832well involve a mechanical energy transfer with the quanta of energy involved frequently called a833phonon. 834
12.5.2.1 Histology and electrical schematic of photoreceptor neuron outer segment835
Figure 12.5.2-1 expands on the previous figure. It provides many details related to both the transduction and836translation mechanisms.837
12.5.2.1.1 Histology of the outer segment838
Frame A highlights the transduction mechanism related to the disc stack portion of the outer segment of a839photoreceptor neuron. Four partial discs are shown. The full discs are nominally 2.0 microns in diameter and about84015 nm in thickness. They are spaced at a nominal 25 nm. The range of the thickness and spacing are summarized in841Section 4.3.5, along with many other parameters such as the number of discs in a typical outer segment.842
The opsin substrate is typically 16 nm thick with a ballooning at the edge of each disc raising the thickness to about84322 nm according to Table 4.3.5-1 As shown the disc to disc pitch is nominally 25 nm. These dimensions suggest the844chromophores forming a liquid crystalline monolayer on the surface of each opsin substrate is 1.5 nm (15 Angstrom)845in length and nominally 0.5 x 0.5 nm (5 x 5 Angstrom) in cross section. A figure in Section 4.3.5.1 illustrates the846resulting configuration in greater detail.847
An important note regards the nature of these dimensions. When working at the nanometer level in848determining the dimensions of atoms and molecules, it is important to realize that the outer electrons849associated with these structures form an electrical field (labeled a cloud). This cloud is a statistical850distribution of where the electrons of elementary physical chemistry are actually located. In more advanced851studies, it becomes clear that the peak density of the statistical distribution is used to specify the radius and/or852diameter of the structure. Two atoms separated by the sum of their published radii still can couple together853through their cloud of electrons. This is also true of biological structures, particularly with respect to lemma.854
With this physical chemistry background and these dimensions, the liquid crystalline monolayer of each disc is in855molecular contact with the adjacent disc, at least in the ballooned edge of the disc. Similarly, the edges of the discs856are in quantum-mechanical contactwith the lemma of the microtubules. These potential contacts are critically857important in evaluating the question of adaptation within the transduction/translation mechanism (and the858phenomenon of “bleaching”).859
As indicated, the stimulating photon flux is applied axially to the disc stack. This also applies the stimulation along860the axis of the individual chromophoric molecules coating the discs. This is also critically important to the operation861of the chromophores. Their anisotropic absorption characteristic requires the stimulating photons to be applied862parallel to the axis of the chromophore (between the two oxygen atoms of the individual Rhodonine molecule). This863requirement is discussed more fully in Section 5.3.5.864
The interface between the discs of the outer segment and the microtubules connecting to the inner segment through865the ciliary collar is described in greater histological detail in Section 4.3.5.5.866
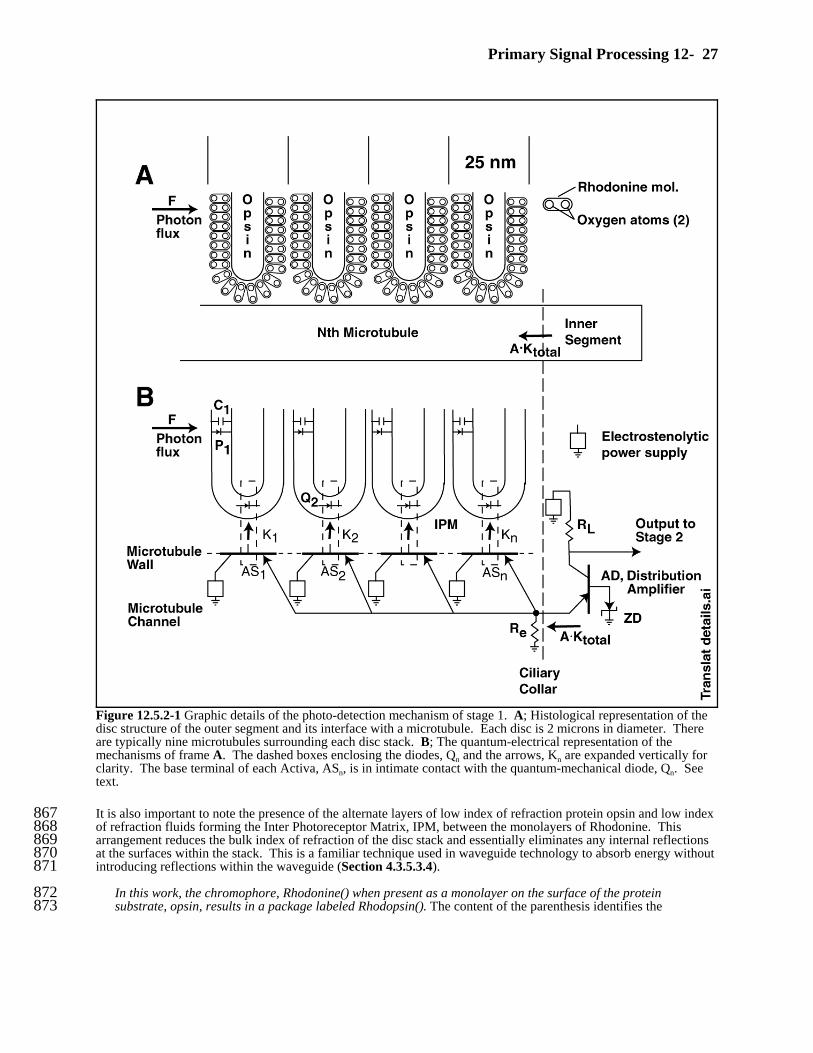
Primary Signal Processing 12- 27
It is also important to note the presence of the alternate layers of low index of refraction protein opsin and low index867of refraction fluids forming the Inter Photoreceptor Matrix, IPM, between the monolayers of Rhodonine. This868arrangement reduces the bulk index of refraction of the disc stack and essentially eliminates any internal reflections869at the surfaces within the stack. This is a familiar technique used in waveguide technology to absorb energy without870introducing reflections within the waveguide (Section 4.3.5.3.4).871
In this work, the chromophore, Rhodonine() when present as a monolayer on the surface of the protein872substrate, opsin, results in a package labeled Rhodopsin(). The content of the parenthesis identifies the873
Figure 12.5.2-1 Graphic details of the photo-detection mechanism of stage 1. A; Histological representation of thedisc structure of the outer segment and its interface with a microtubule. Each disc is 2 microns in diameter. Thereare typically nine microtubules surrounding each disc stack. B; The quantum-electrical representation of themechanisms of frame A. The dashed boxes enclosing the diodes, Qn and the arrows, Kn are expanded vertically forclarity. The base terminal of each Activa, ASn, is in intimate contact with the quantum-mechanical diode, Qn. Seetext.
28 Processes in Biological Vision
chromophore present and its absorption spectrum. Historically, rhodopsin has been defined as only the874protein substrate (that does include a minuscule amount of retinol/ retinal–this retinol may act as a seed for875the formation of the protein molecule (Section 5.1.4). The molecular weight of one ligand of retinal is 284876while the protein portion of bovine opsin is 41159. The retinal is only 0.68% of the total molecular weight of877the composite molecule. No one has ever described how this simpler package acts as a photoreceptor within878the outer segment of the photoreceptor neuron. Nor has any investigator every shown that this simpler879package supports an anisotropic absorption characteristic in the visual wavelength of vision. Dratz &880Hargrave have noted the axis of the retinol ligand is nominally perpendicular to the stimulating radiation881(Section 5.1.4.1).882
The axis of the Rhodonine() molecules are nominally parallel to the stimulating radiation and form a liquid883crystalline surface intercepting the radiation that is 100% chromophore (Section 5.5.8).884
In the upper part of frame A, transduction of the photon flux, F, into excitons occurs in the chromophore coating885consisting of Rhodonine molecules. The individual molecules are each capable of a single conversion of a photon to886an excited state. After that conversion, the molecule is transparent to further irradiation. However, the presence of887these molecules in a liquid crystalline state of matter means that their exciton is free to move within the excited888energy band (the B* band) of the whole coating of a single disc and their exciton is readily returned to the ground889state by action occurring elsewhere in the coating. This de-excitation occurs at the coating interface with the890microtubule shown.891
The interpretation of ACKtotal will be addressed below.892
12.5.2.1.2 Schematic of the outer segment893
Frame B of describes the quantum-mechanical and electronic mechanisms associated with the histological package894of frame A. 895
To understand the details of this frame, the reader must have a significant background in quantum- mechanics896and semiconductor physics. Lacking that background, the reader is directed to the critically important897material in Chapter 10, that relies upon the details of these subjects addressed in discussions in Chapter 8898and Section 9.2. Section 10.8.5 focuses on the photoreceptor neuron. 899
The most important feature in this material is the ability of the lemma of a neuron, in conjunction with its900internal reticulum to form an active semiconductor device labeled an Activa. This device is analogous to a901man-made transistor of the PNP type. In this frame, two are shown, the adaptation amplifier, AS, and the902distribution amplifier, AD. The adaptation amplifier is shown as a distributed device, AS1, AS2 . . . ASn 903along the surface of a microtubule as described above. The darkened horizontal lines form the base(s) of the904distributed device, AS as shown. The emitters (shown with arrowheads contacting the bases) of these905distributed devices are all connected in parallel to the emitter of the second Activa within the distribution906amplifier, AD. The collectors of these same distributed devices are shown connected to individual907electrostenolytic power sources (Section 8.6). 908
The details of the quantum-mechanical mechanism appears in Section 5.4. In frame B, The total photon stimulating909photon flux generating excitons within the excited energy band of the liquid crystalline chromophores is labeled F. 910The sum of the charges seeking to de-excite these excitons by quantum-mechanical means is labeled K = K1 + k2 @ @ @911@ + Kn where n is the number of disks in direct quantum-mechanical contact with one of the nominally nine912microtubules.913
Note, because of the liquid crystalline nature of the chromophores of each disc and the quantum-mechanical914contact between discs, it is possible for excitons to be generated in the coating of a disc not in contact with a915microtubule, those excitons to travel within the excited energy band to another disc that is in quantum-916mechanical contact with a microtubule, and thereby be de-excited back to its ground state.917
Any individual chromophore molecule can capture a photon traveling parallel to its axis and raise an electron from918its ground state to an excited state, per Section 5.4. In this frame, the photodiode labeled P1 and the excited energy919band, diagramed using the conventional capacitance symbol labeled C1, represent this individual chromophore. It is920one of an astronomical number of chromophore molecules coating each disc. More specific numbers will be921described in subsections below. Note that once excited, the excitons associated with C1 are free to travel within the922
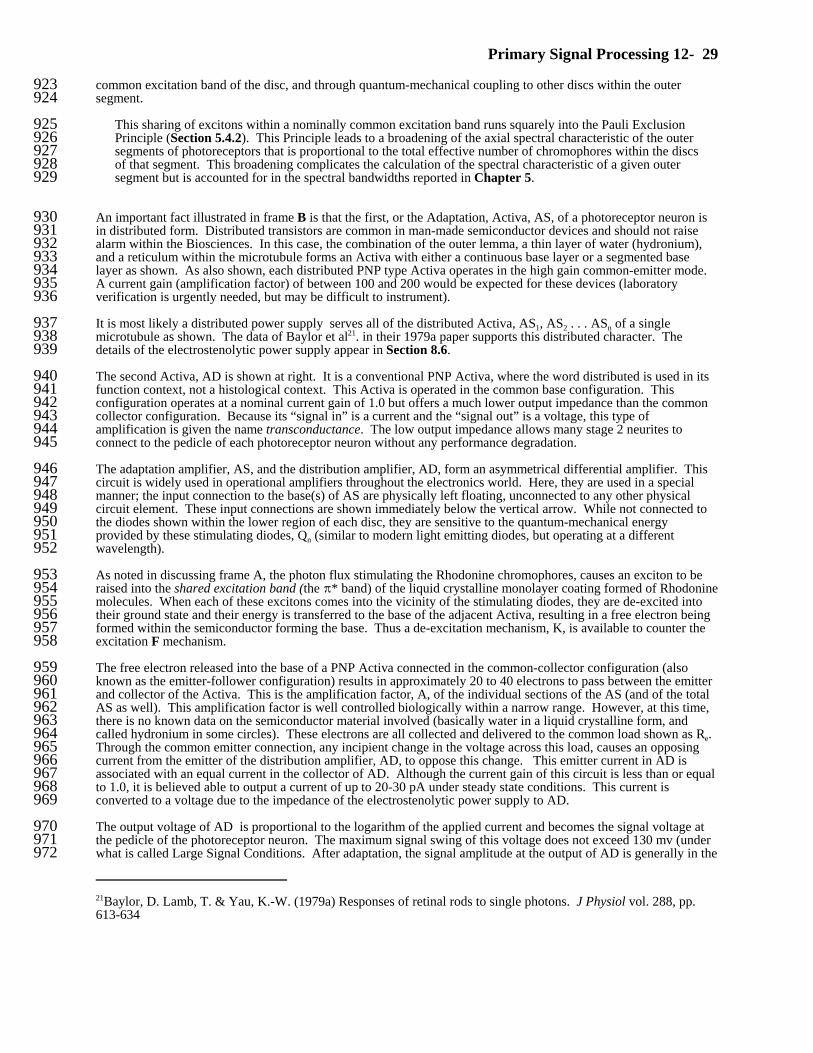
Primary Signal Processing 12- 29
21Baylor, D. Lamb, T. & Yau, K.-W. (1979a) Responses of retinal rods to single photons. J Physiol vol. 288, pp.613-634
common excitation band of the disc, and through quantum-mechanical coupling to other discs within the outer923segment.924
This sharing of excitons within a nominally common excitation band runs squarely into the Pauli Exclusion925Principle (Section 5.4.2). This Principle leads to a broadening of the axial spectral characteristic of the outer926segments of photoreceptors that is proportional to the total effective number of chromophores within the discs927of that segment. This broadening complicates the calculation of the spectral characteristic of a given outer928segment but is accounted for in the spectral bandwidths reported in Chapter 5.929
An important fact illustrated in frame B is that the first, or the Adaptation, Activa, AS, of a photoreceptor neuron is930in distributed form. Distributed transistors are common in man-made semiconductor devices and should not raise931alarm within the Biosciences. In this case, the combination of the outer lemma, a thin layer of water (hydronium),932and a reticulum within the microtubule forms an Activa with either a continuous base layer or a segmented base933layer as shown. As also shown, each distributed PNP type Activa operates in the high gain common-emitter mode. 934A current gain (amplification factor) of between 100 and 200 would be expected for these devices (laboratory935verification is urgently needed, but may be difficult to instrument).936
It is most likely a distributed power supply serves all of the distributed Activa, AS1, AS2 . . . ASn of a single937microtubule as shown. The data of Baylor et al21. in their 1979a paper supports this distributed character. The938details of the electrostenolytic power supply appear in Section 8.6.939
The second Activa, AD is shown at right. It is a conventional PNP Activa, where the word distributed is used in its940function context, not a histological context. This Activa is operated in the common base configuration. This941configuration operates at a nominal current gain of 1.0 but offers a much lower output impedance than the common942collector configuration. Because its “signal in” is a current and the “signal out” is a voltage, this type of943amplification is given the name transconductance. The low output impedance allows many stage 2 neurites to944connect to the pedicle of each photoreceptor neuron without any performance degradation.945
The adaptation amplifier, AS, and the distribution amplifier, AD, form an asymmetrical differential amplifier. This946circuit is widely used in operational amplifiers throughout the electronics world. Here, they are used in a special947manner; the input connection to the base(s) of AS are physically left floating, unconnected to any other physical948circuit element. These input connections are shown immediately below the vertical arrow. While not connected to949the diodes shown within the lower region of each disc, they are sensitive to the quantum-mechanical energy950provided by these stimulating diodes, Qn (similar to modern light emitting diodes, but operating at a different951wavelength).952
As noted in discussing frame A, the photon flux stimulating the Rhodonine chromophores, causes an exciton to be953raised into the shared excitation band (the B* band) of the liquid crystalline monolayer coating formed of Rhodonine954molecules. When each of these excitons comes into the vicinity of the stimulating diodes, they are de-excited into955their ground state and their energy is transferred to the base of the adjacent Activa, resulting in a free electron being956formed within the semiconductor forming the base. Thus a de-excitation mechanism, K, is available to counter the957excitation F mechanism.958
The free electron released into the base of a PNP Activa connected in the common-collector configuration (also959known as the emitter-follower configuration) results in approximately 20 to 40 electrons to pass between the emitter960and collector of the Activa. This is the amplification factor, A, of the individual sections of the AS (and of the total961AS as well). This amplification factor is well controlled biologically within a narrow range. However, at this time,962there is no known data on the semiconductor material involved (basically water in a liquid crystalline form, and963called hydronium in some circles). These electrons are all collected and delivered to the common load shown as Re. 964Through the common emitter connection, any incipient change in the voltage across this load, causes an opposing965current from the emitter of the distribution amplifier, AD, to oppose this change. This emitter current in AD is966associated with an equal current in the collector of AD. Although the current gain of this circuit is less than or equal967to 1.0, it is believed able to output a current of up to 20-30 pA under steady state conditions. This current is968converted to a voltage due to the impedance of the electrostenolytic power supply to AD. 969
The output voltage of AD is proportional to the logarithm of the applied current and becomes the signal voltage at970the pedicle of the photoreceptor neuron. The maximum signal swing of this voltage does not exceed 130 mv (under971what is called Large Signal Conditions. After adaptation, the signal amplitude at the output of AD is generally in the972
30 Processes in Biological Vision
few mv range (the Small Signal Condition). The logarithmic character of the signal under Large Signal Condition is973due to the input characteristic of any Activa or man-made transistor. This input characteristic is determined by the974fact that it is associated with the diode forming the PN junction of a PNP semiconductor device.975
976At an earlier time, the symbology for a transistor was drawn as two back-to-back diodes. Later977there were heated discussions within the IEEE over which way the arrow should point on the978emitter lead to define the type of transistor involved in the symbol finally adopted. 979
Under Small Signal Conditions, a limited range of the diode input characteristic can be approximated by a linear980resistor.981
Although the schematic shown above is compatible with the composition of the membrane associated with all982neurons, it does not require the physical movement of any atoms or ions through any lemma of the neuron, physical983movement is limited to electrons “holes” (the absence of electrons in the lattice of a crystalline semiconductor). 984
12.5.2.2 Polarity, signal amplitude & Impedance of the photoreceptor amplifiers 985
To work effectively, the differential amplifier enclosed in every inner segment (including the microtubules) of every 986photoreceptor must be properly biased electrically. While any electrical potential within a chemical theory of the987photoreceptor is of little importance; in the Electrolytic Theory of the Neuron, it is critically important.988
It is important to remember Ben Franklin’s biggest mistake here. The conventional current he989defined flows from the positive to the negative terminals of a battery (in the external circuit). 990The actual electron flow is in the opposite direction; electrons flow from the negative terminal to991the positive terminal. Care must be taken when talking of transistor devices and Activa to992distinguish between the “current flow” and the “electron flow”. The terms are frequently used993interchangably by scientists familiar with this situation.994
It should be obvious based on the above discussion that when F = 0, no excitons are formed in the shared excitation995band (the B* band) of any disc within the OS. Without any excitons to de-excite, and the subsequent production of 996free electrons in the base of AS, the electron flow from the electrostenolytic power supply through the Activa will be997zero (except for a very small leakage current). In this case, any voltage across the resistance Re, must by provide by998the distribution amplifier, AD. The breakdown voltage of the zener diode, ZD, is chosen to insure such a voltage999across Re exists. This voltage typically stabilizes at less than a few millivolts. At this voltage, the electron flow1000through AD will be small and the quiescent value of the collector voltage will be only a few millivolts below the1001–154 millivolts of the electrostenolytic power supply.1002
When the photon flux is raised above F = 0, the sum of the electrons flowing through AS will attempt to increase the1003negative voltage across Re. However this increased negative voltage at the emitter of AD will cause more electron1004flow through AD and the load resistor, RL. The voltage drop across RL will lower the negative collector voltage. 1005This reduction in the negative voltage at the collector will constitute a positive going output signal at the pedicle1006leading to stage 2. The collector voltage of AD can only be reduced until it approaches its emitter voltage at that1007time, typically at –20 mV. The result is a maximum output signal voltage at the pedicle of the photoreceptor of less1008than +130 mV = –20 – (–150). Signal voltages approaching this magnitude have been frequently reported in the1009literature. However, outside of the laboratory and under realistic conditions, the maximum signal voltage is less than1010100 mV1011
The impedance of neural circuits is remarkably high, and not found in man-made electronic circuits prior to the1012development of very high density printed circuits. For a 130 mV to appear across RL with only 30 picoamperes1013passing through AD, the value of RL would be about four megohms. And this value is used in a distribution1014amplifier requiring a low output impedance. Smaller neurons will be found to have output impedances of 1001015megohms and above. This is particularly true of small neurons below the resolution of light microscopy.1016
12.5.2.3 The photoreceptor neuron from a different physiological perspective1017
Figure 12.5.2-2 shows an alternate schematic of the stage 1 photoreceptor neuron (expanded from frame B of1018Figure 12.5.1-1, allowing other features to be illustrated. 1019
The photo-excitation (transduction) mechanism consists of a Rhodonine molecule (a chromophore) acting as a1020
Primary Signal Processing 12- 31
22Goldman, S. (1949) Transformation calculus and electrical transients, Chap 10. NY: Prentice-Hall
Figure 12.5.2-2 Alternate quantum-electrical schematic of the stage 1 photoreceptor neuron. The impedancesshown above the two Activa, AS & AD, include individual electrostenolytic power sources. The resistive element,Re and the zener diode, ZD are connected to the local electrical ground formed by the inter-photoreceptor matrix,IPM. The symbol at far left represents incident energy within the spectral band of the chromophore of thephotoreceptor. The similar symbol between Q and the N-type region of the first Activa, AS, represents a quantum-mechanical energy transfer. The impedances shown in the collector lead of the Activa include separateelectrostenolytic power sources. The impedances along the bottom all connect to a common ground (the matrixsurrounding the neuron). See text.
photon-to-exciton converter. For each photon absorbed, one electron is moved from the ground state to the π*1021excitation band of the liquid-crystalline lattice of the outer segment, OS. The symbols, CT and Z1 are used to define1022the decay time constant of these excitons. Because of the unique properties of the oxygen atoms of Rhodonine1023molecules (Section 5.3), the life time of these excitons is very long in the absence of any discharge mechanism. 1024Conceptually, when an individual Rhodonine molecule is excited, it is no longer subject to excitation and appears1025transparent to the photon flux. Within the liquid-crystalline lattice, the electronic energy bands are shared, and a1026reduction in absorption cross section for the entire lattice results from the net increase in excitons as a function of1027time.1028
The photon/chromophore stimulation mechanism is described in detail in Section 5.4. It is common to1029virtually all light sensitive processes. 1030
The π* and n energy bands shown are continuous within the liquid crystalline lattice formed by the monolayer of1031chromophores on each disc. These bands may be shared between adjacent discs. Excitons in the π* band are known1032to travel at a finite speed within the π*. Z2 is a essentially a delay line reflecting the time for an exciton to travel1033from its point of origin to its point of de-excitation. The average of this time delay is the dominant delay term in the1034(photo) excitation/de-excitation equation, P/D Equation, of Section 7.2.1035
This delay term can be addressed mathematically22 and it is a function of the electric field created within the1036discs, i. e. the delay is inversely proportional to the number of excited electrons present at any given instant. 1037The higher the excitation rate, the stronger the electric field created, the shorter the transport delay. The1038equation in this case involves a first order Bessel function of the first kind to describe the unit delay1039involved. It is incorporated in the delay term of the photoexcitation/de-excitation process of Section10407.2.4.2.1.1041
1042On arriving at the edge of the disc, the exciton becomes involved in the de-excitation mechanism between the1043chromophore coating and the wall of the microtubule where the Activa, AS, is located. The de-excitation1044mechanism involves a quantum-mechanical process where the exciton is returned to its ground state, and a free1045electron is produced within the N-type material of the base of the Activa, AS. With the return of the Rhodonine1046molecule to its ground state, it is again susceptible of capturing another photon arriving within its absorption1047spectrum.1048
32 Processes in Biological Vision
There is an energy threshold related to the first Activa of the neuron; on the order of 2.11 electron-volts in1049human endotherms Section 12.5.2.4). This threshold affects the de-excitation of excitons resulting from1050absorption of long wavelength photons, at wavelengths longer than about 0.587 microns. This threshold1051requires the summation of the energy from more than one exciton within the chromophore to generate one1052free electron in the base terminal lead of the first amplifier of the neuron (a 2-exciton mechanism).1053
The electrostenolytic power supply cited in the caption will be described in Section 8.6.1054
The translation of energy between Q and the N-type material of the Activa. are diagramed in Section 4.2.2 and in1055exploded view in Section 4.3.2. For short wavelength photons and high photon fluxes, this element can be1056considered a network having a transfer function characterized by a constant gain, wide frequency response and zero1057time delay, i. e. it can be ignored. 1058
The current amplifier, labeled AS in this figure, is also labeled the adaptation amplifier, or first amplifier of a stage 11059neuron elsewhere in this work. It is truly the first amplifier containing an active device—Activa—within the visual1060modality of the neural system. Connected as a common emitter device, it offers high gain, on the order of 40:1 but1061potentially 200:1, similar to man-made transistors of the junction type. It is not directly associated with the1062adaptation process (Section 7.2.6.1.2). The adaptation process is found in the chromophores of the outer segment of1063the stage 1 photoreceptors (Section 12.5.3)1064
The distribution amplifier, labeled AD in the figure shares a common emitter terminal with the first amplifier, thus1065forming an asymmetrical differential pair. The purpose of the distribution amplifier is to reduce the impedance of1066the signal source at the pedicle of the photoreceptor neurons. It does this by converting the signal from a current at1067the output of the first amplifier to a voltage at the collector of the second amplifier. This allows the distribution1068amplifier to interface efficiently with the multiple neurons of the stage 2 signal processing neurons within the retina.1069
12.5.2.4 The special case of the long wavelength visual channel(s)–a 2-exciton process1070
As indicated in Section 12.5.4, there is a special situation that is frequently found in the long wavelength1071chromophoric channel of the visual system. It is virtually identical to the phenomena found in modern silver halide1072photography where a “dye” similar to the rhodonine family (a conjugated carboxyl-ion system) is used to coat the1073silver halide crystals. By coating the crystal in this way, the spectral sensitivity of the silver halide emulsion is1074extended to wavelengths beyond the band gap limit of the crystal itself. In that trade, the dye is usually labeled a1075“coupler.”1076
Specifically, the dye is deposited as a liquid crystal on at least a portion of the surface of the silver halide crystal. 1077The incident photon excites the chromophore and an electron is transferred to the B* band of the chromophore just1078as described earlier. However, this excited electron does not have sufficient excess energy to cause the release of a1079free electron at the interface with the silver halide crystal.1080
Here again, the process is quantum-mechanical and the correct method to handle this problem is a probabilistic one. 1081The question becomes; what is the probability that one or more excited electrons, acting in consort at the interface,1082can cause a free electron to be created in the silver halide crystal. This action would involve the summing of the1083energy of individual excited electrons. The equation could be written as follows: P(free) = P(1) + P(2|1)*P(1): i.e.,1084what is the probability that a free electron will be released as a result of the action of one excited electron acting1085alone, P(1), plus (or) the action of a second excited electron P(2|1) acting essentially simultaneously with the first, or1086another excited electron, P(1). Figure 12.5.2-3(left) describes conceptually the probability that a single exciton,1087with the energy of the photon that generated it, can generate a free electron at the disk-microtubule interface. The1088assumption is that the band gap of the liquid crystalline water of the Activa is 2.2 electron-Volts. An electron-Volt1089equals 1.6 x 10⁻¹² ergs. In chemical terms, 1 electron-Volt per mole is about 23,000 calories per mole. 1090
In this work, liquid crystalline water has been called hydronium, a term used in many contexts but not generally as1091used here. In this context, the liquid crystalline water is a state of matter between the liquid state and the solid state1092(ice in one of over a dozen specific configurations). The liquid crystalline state is most often encountered in water at1093a temperature between zero and a few degrees centigrade. It is also frequently found as a boundary layer (the1094Helmholtz double layer) at an interface between bulk water and a container wall in the absence of stirring. It is often1095found in a confined space measured in nanometers.1096
The figure is conceptual; both the terminology and equations of probability theory become very complex very1097fast. It is the concept that is important here, not precise values. As an example, the band gap of water in the1098
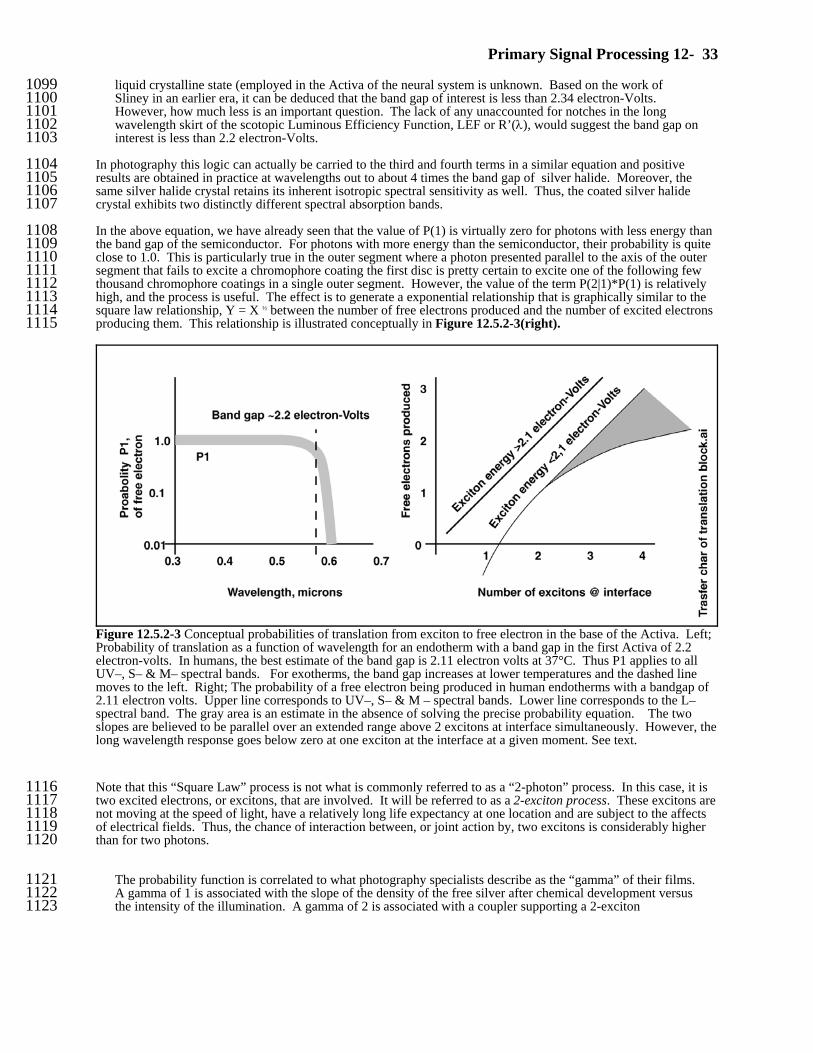
Primary Signal Processing 12- 33
Figure 12.5.2-3 Conceptual probabilities of translation from exciton to free electron in the base of the Activa. Left;Probability of translation as a function of wavelength for an endotherm with a band gap in the first Activa of 2.2electron-volts. In humans, the best estimate of the band gap is 2.11 electron volts at 37°C. Thus P1 applies to allUV–, S– & M– spectral bands. For exotherms, the band gap increases at lower temperatures and the dashed linemoves to the left. Right; The probability of a free electron being produced in human endotherms with a bandgap of2.11 electron volts. Upper line corresponds to UV–, S– & M – spectral bands. Lower line corresponds to the L–spectral band. The gray area is an estimate in the absence of solving the precise probability equation. The twoslopes are believed to be parallel over an extended range above 2 excitons at interface simultaneously. However, thelong wavelength response goes below zero at one exciton at the interface at a given moment. See text.
liquid crystalline state (employed in the Activa of the neural system is unknown. Based on the work of1099Sliney in an earlier era, it can be deduced that the band gap of interest is less than 2.34 electron-Volts. 1100However, how much less is an important question. The lack of any unaccounted for notches in the long1101wavelength skirt of the scotopic Luminous Efficiency Function, LEF or R’(λ), would suggest the band gap on1102interest is less than 2.2 electron-Volts.1103
In photography this logic can actually be carried to the third and fourth terms in a similar equation and positive1104results are obtained in practice at wavelengths out to about 4 times the band gap of silver halide. Moreover, the1105same silver halide crystal retains its inherent isotropic spectral sensitivity as well. Thus, the coated silver halide1106crystal exhibits two distinctly different spectral absorption bands. 1107
In the above equation, we have already seen that the value of P(1) is virtually zero for photons with less energy than1108the band gap of the semiconductor. For photons with more energy than the semiconductor, their probability is quite1109close to 1.0. This is particularly true in the outer segment where a photon presented parallel to the axis of the outer1110segment that fails to excite a chromophore coating the first disc is pretty certain to excite one of the following few1111thousand chromophore coatings in a single outer segment. However, the value of the term P(2|1)*P(1) is relatively1112high, and the process is useful. The effect is to generate a exponential relationship that is graphically similar to the1113square law relationship, Y = X ½ between the number of free electrons produced and the number of excited electrons1114producing them. This relationship is illustrated conceptually in Figure 12.5.2-3(right). 1115
Note that this “Square Law” process is not what is commonly referred to as a “2-photon” process. In this case, it is1116two excited electrons, or excitons, that are involved. It will be referred to as a 2-exciton process. These excitons are1117not moving at the speed of light, have a relatively long life expectancy at one location and are subject to the affects1118of electrical fields. Thus, the chance of interaction between, or joint action by, two excitons is considerably higher1119than for two photons.1120
The probability function is correlated to what photography specialists describe as the “gamma” of their films. 1121A gamma of 1 is associated with the slope of the density of the free silver after chemical development versus1122the intensity of the illumination. A gamma of 2 is associated with a coupler supporting a 2-exciton1123
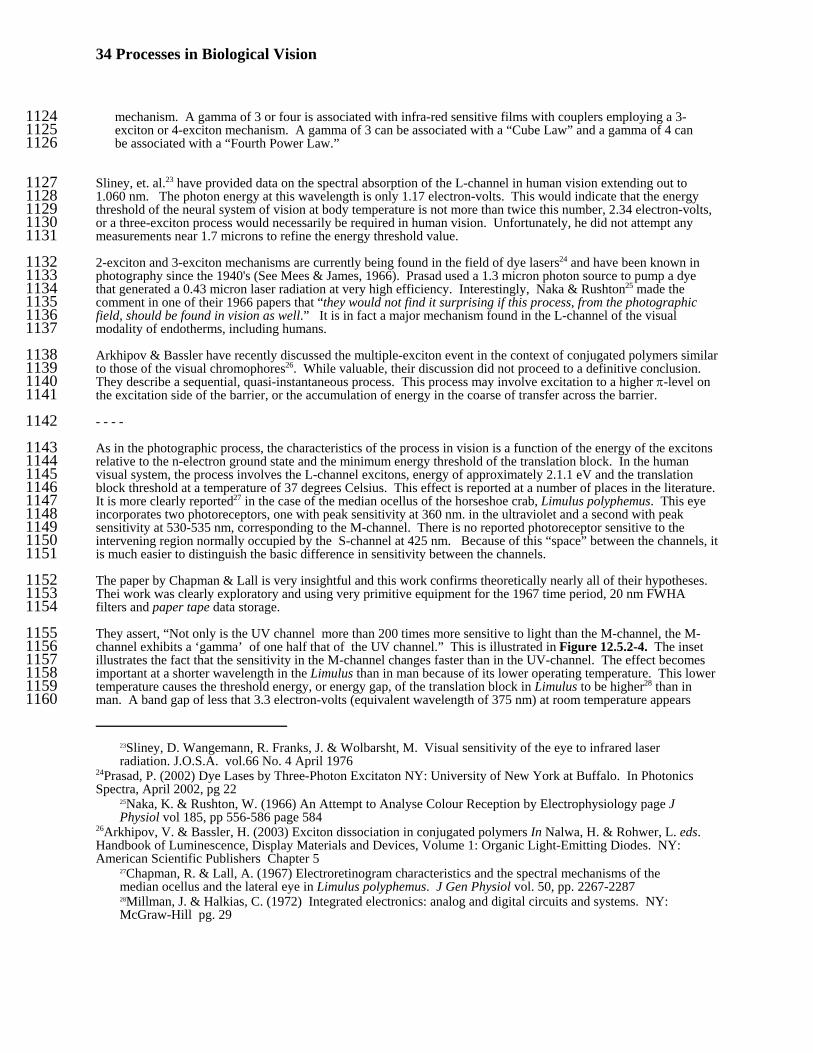
34 Processes in Biological Vision
23Sliney, D. Wangemann, R. Franks, J. & Wolbarsht, M. Visual sensitivity of the eye to infrared laserradiation. J.O.S.A. vol.66 No. 4 April 1976
24Prasad, P. (2002) Dye Lases by Three-Photon Excitaton NY: University of New York at Buffalo. In PhotonicsSpectra, April 2002, pg 22
25Naka, K. & Rushton, W. (1966) An Attempt to Analyse Colour Reception by Electrophysiology page JPhysiol vol 185, pp 556-586 page 584
26Arkhipov, V. & Bassler, H. (2003) Exciton dissociation in conjugated polymers In Nalwa, H. & Rohwer, L. eds.Handbook of Luminescence, Display Materials and Devices, Volume 1: Organic Light-Emitting Diodes. NY:American Scientific Publishers Chapter 5
27Chapman, R. & Lall, A. (1967) Electroretinogram characteristics and the spectral mechanisms of themedian ocellus and the lateral eye in Limulus polyphemus. J Gen Physiol vol. 50, pp. 2267-228728Millman, J. & Halkias, C. (1972) Integrated electronics: analog and digital circuits and systems. NY:McGraw-Hill pg. 29
mechanism. A gamma of 3 or four is associated with infra-red sensitive films with couplers employing a 3-1124exciton or 4-exciton mechanism. A gamma of 3 can be associated with a “Cube Law” and a gamma of 4 can1125be associated with a “Fourth Power Law.”1126
Sliney, et. al.23 have provided data on the spectral absorption of the L-channel in human vision extending out to11271.060 nm. The photon energy at this wavelength is only 1.17 electron-volts. This would indicate that the energy1128threshold of the neural system of vision at body temperature is not more than twice this number, 2.34 electron-volts,1129or a three-exciton process would necessarily be required in human vision. Unfortunately, he did not attempt any1130measurements near 1.7 microns to refine the energy threshold value.1131
2-exciton and 3-exciton mechanisms are currently being found in the field of dye lasers24 and have been known in1132photography since the 1940's (See Mees & James, 1966). Prasad used a 1.3 micron photon source to pump a dye1133that generated a 0.43 micron laser radiation at very high efficiency. Interestingly, Naka & Rushton25 made the1134comment in one of their 1966 papers that “they would not find it surprising if this process, from the photographic1135field, should be found in vision as well.” It is in fact a major mechanism found in the L-channel of the visual1136modality of endotherms, including humans.1137
Arkhipov & Bassler have recently discussed the multiple-exciton event in the context of conjugated polymers similar1138to those of the visual chromophores26. While valuable, their discussion did not proceed to a definitive conclusion. 1139They describe a sequential, quasi-instantaneous process. This process may involve excitation to a higher π-level on1140the excitation side of the barrier, or the accumulation of energy in the coarse of transfer across the barrier.1141
- - - -1142
As in the photographic process, the characteristics of the process in vision is a function of the energy of the excitons1143relative to the n-electron ground state and the minimum energy threshold of the translation block. In the human1144visual system, the process involves the L-channel excitons, energy of approximately 2.1.1 eV and the translation1145block threshold at a temperature of 37 degrees Celsius. This effect is reported at a number of places in the literature. 1146It is more clearly reported27 in the case of the median ocellus of the horseshoe crab, Limulus polyphemus. This eye1147incorporates two photoreceptors, one with peak sensitivity at 360 nm. in the ultraviolet and a second with peak1148sensitivity at 530-535 nm, corresponding to the M-channel. There is no reported photoreceptor sensitive to the1149intervening region normally occupied by the S-channel at 425 nm. Because of this “space” between the channels, it1150is much easier to distinguish the basic difference in sensitivity between the channels. 1151
The paper by Chapman & Lall is very insightful and this work confirms theoretically nearly all of their hypotheses. 1152Thei work was clearly exploratory and using very primitive equipment for the 1967 time period, 20 nm FWHA1153filters and paper tape data storage.1154
They assert, “Not only is the UV channel more than 200 times more sensitive to light than the M-channel, the M-1155channel exhibits a ‘gamma’ of one half that of the UV channel.” This is illustrated in Figure 12.5.2-4. The inset1156illustrates the fact that the sensitivity in the M-channel changes faster than in the UV-channel. The effect becomes1157important at a shorter wavelength in the Limulus than in man because of its lower operating temperature. This lower1158temperature causes the threshold energy, or energy gap, of the translation block in Limulus to be higher28 than in1159man. A band gap of less that 3.3 electron-volts (equivalent wavelength of 375 nm) at room temperature appears1160
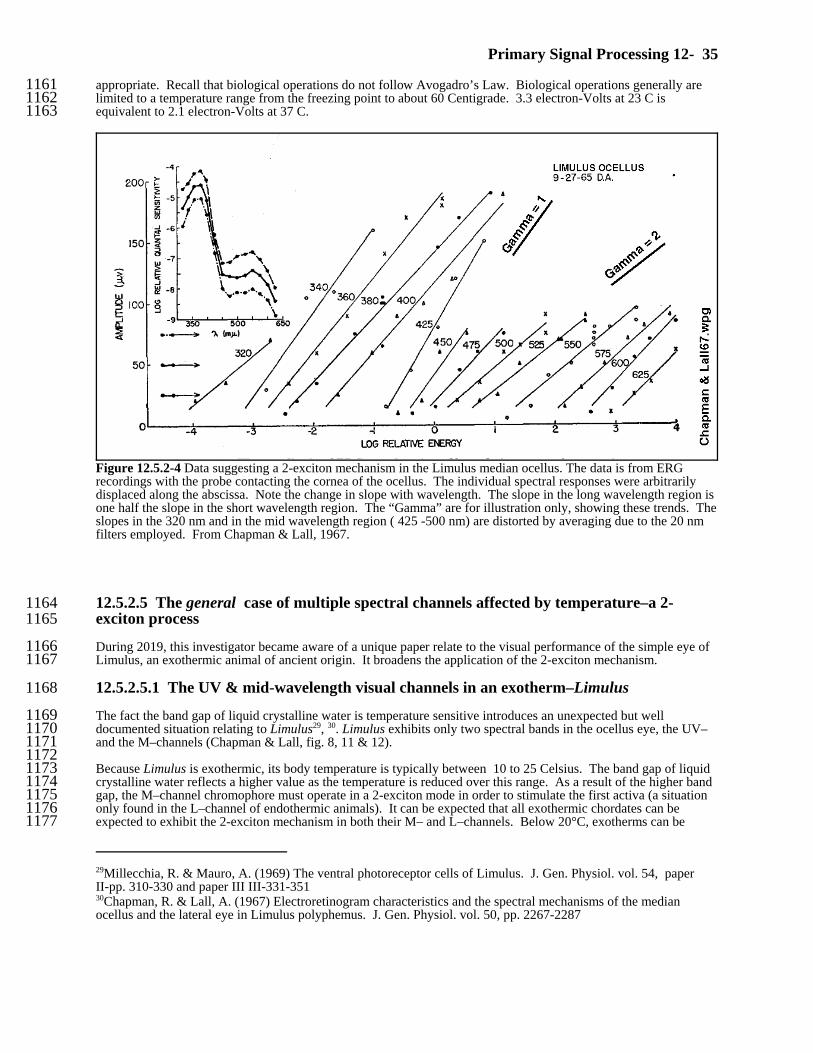
Primary Signal Processing 12- 35
29Millecchia, R. & Mauro, A. (1969) The ventral photoreceptor cells of Limulus. J. Gen. Physiol. vol. 54, paperII-pp. 310-330 and paper III III-331-351 30Chapman, R. & Lall, A. (1967) Electroretinogram characteristics and the spectral mechanisms of the medianocellus and the lateral eye in Limulus polyphemus. J. Gen. Physiol. vol. 50, pp. 2267-2287
Figure 12.5.2-4 Data suggesting a 2-exciton mechanism in the Limulus median ocellus. The data is from ERGrecordings with the probe contacting the cornea of the ocellus. The individual spectral responses were arbitrarilydisplaced along the abscissa. Note the change in slope with wavelength. The slope in the long wavelength region isone half the slope in the short wavelength region. The “Gamma” are for illustration only, showing these trends. Theslopes in the 320 nm and in the mid wavelength region ( 425 -500 nm) are distorted by averaging due to the 20 nmfilters employed. From Chapman & Lall, 1967.
appropriate. Recall that biological operations do not follow Avogadro’s Law. Biological operations generally are1161limited to a temperature range from the freezing point to about 60 Centigrade. 3.3 electron-Volts at 23 C is1162equivalent to 2.1 electron-Volts at 37 C.1163
12.5.2.5 The general case of multiple spectral channels affected by temperature–a 2-1164exciton process1165
During 2019, this investigator became aware of a unique paper relate to the visual performance of the simple eye of1166Limulus, an exothermic animal of ancient origin. It broadens the application of the 2-exciton mechanism.1167
12.5.2.5.1 The UV & mid-wavelength visual channels in an exotherm–Limulus1168
The fact the band gap of liquid crystalline water is temperature sensitive introduces an unexpected but well1169documented situation relating to Limulus29, 30. Limulus exhibits only two spectral bands in the ocellus eye, the UV–1170and the M–channels (Chapman & Lall, fig. 8, 11 & 12). 1171 1172Because Limulus is exothermic, its body temperature is typically between 10 to 25 Celsius. The band gap of liquid1173crystalline water reflects a higher value as the temperature is reduced over this range. As a result of the higher band1174gap, the M–channel chromophore must operate in a 2-exciton mode in order to stimulate the first activa (a situation1175only found in the L–channel of endothermic animals). It can be expected that all exothermic chordates can be1176expected to exhibit the 2-exciton mechanism in both their M– and L–channels. Below 20°C, exotherms can be1177
36 Processes in Biological Vision
expected to employ a 2-exciton mechanism in the S–, M– & L–channels. 1178 1179
12.5.2.5.2 The proposed band gap of liquid-crystalline water versus temperature1180
The band gap of the N-type semiconductor material used in a PNP Activa (liquid-crystalline water) is a very1181important parameter when the Activa is used in a sensory neuron. Figure 12.5.2-5 is a first known estimate of the1182band gap for liquid-crystalline water employed throughout the neural system of animals in general, including the1183primitive Limulus, and both exothermic and endothermic members of Chordata. The values given are crudely1184determined from the 2-exciton mechanism found in a majority of eyes. In endothermal animals, the value at 371185Celsius is near 2.1 electron-Volts. In exothermic animals, at 23 Celsius, the value is closer to 3.3 electron-Volts.1186
There has been virtually no research on water as a1187semiconductor when in the liquid crystalline form, at1188any temperature. There is one paper that has suggested1189a value of 2.1416 eV at 37°C.1190
Section 8.1.3.3 will seek to understand the1191semiconductor properties of liquid-crystalline water1192based on such phenomenon as glacial blue ice, as1193opposed to common blue ice found in sea water..1194
12.5.2.5.3 The impact on visual1195discrimination of the 2-exciton mode of1196photodetection1197
When this new relationship for the transfer1198characteristic of the translation block is introduced for1199the long wavelength chromophoric channel of humans1200and other endotherms, the results are significant in at1201least three ways. These will be discussed exhaustively1202in Section 13.5.3. Briefly, for endothermic animals1203they result in, 1204
1. Gamma Differences among the L– and M–channels1205of vision at specific light levels.1206
2. Decrease in long wavelength channel sensitivity relative to the other channels to broadband 1207illumination1208
3. Loss in spectral discrimination in the region between the M- & L- channel with lowered 1209broadband illumination1210
Item one is the probable cause of the fascination of humans with a flickering fireplace.1211
12.5.2.5.4 The impact on the P/D Equation of the 2-exciton mode of photodetection1212
The variation in the band gap of the Activa of the adaptation amplifier (the first) with temperature appears to be1213similar to the variation in the P/D Equation describing the performance of the chromophores of the outer segment of1214each photoreceptor. The P/D Equation, describing the current injected into the neural system by a single disk in1215response to an impulse stimulus. It is presented in Section 7.2 and supported in detail in Appendix A.1216
In the current situation, the variation in the band gap relates to the minimum energy exciton that can be transferred to1217the base of the first Activa. While closely related morphologically, the mechanisms appear to be totally unrelated1218except for their variation with temperature.1219
Figure 12.5.2-5 Estimate: Band gap of liquid crystallinewater. The black line is the best estimate and the grayband is the potential range in this value. This estimate isbased on endothermic animals (primarily humans) plusthe data from Limulus. Disassociation of bulk waternormally occurs at 5.13 eV.
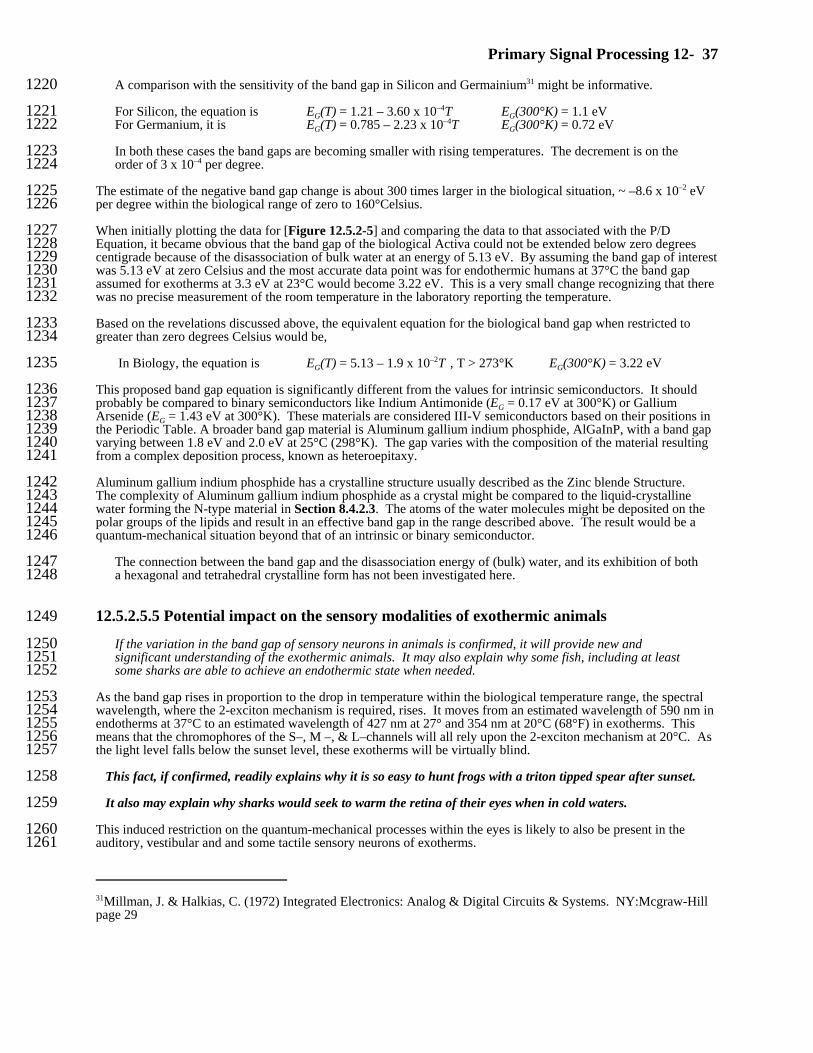
Primary Signal Processing 12- 37
31Millman, J. & Halkias, C. (1972) Integrated Electronics: Analog & Digital Circuits & Systems. NY:Mcgraw-Hillpage 29
A comparison with the sensitivity of the band gap in Silicon and Germainium31 might be informative.1220
For Silicon, the equation is EG(T) = 1.21 – 3.60 x 10⁻⁴T EG(300°K) = 1.1 eV1221For Germanium, it is EG(T) = 0.785 – 2.23 x 10⁻⁴T EG(300°K) = 0.72 eV1222
In both these cases the band gaps are becoming smaller with rising temperatures. The decrement is on the1223order of 3 x 10⁻⁴ per degree.1224
The estimate of the negative band gap change is about 300 times larger in the biological situation, ~ –8.6 x 10⁻² eV1225per degree within the biological range of zero to 160°Celsius. 1226
When initially plotting the data for [Figure 12.5.2-5] and comparing the data to that associated with the P/D1227Equation, it became obvious that the band gap of the biological Activa could not be extended below zero degrees1228centigrade because of the disassociation of bulk water at an energy of 5.13 eV. By assuming the band gap of interest1229was 5.13 eV at zero Celsius and the most accurate data point was for endothermic humans at 37°C the band gap 1230assumed for exotherms at 3.3 eV at 23°C would become 3.22 eV. This is a very small change recognizing that there1231was no precise measurement of the room temperature in the laboratory reporting the temperature.1232
Based on the revelations discussed above, the equivalent equation for the biological band gap when restricted to1233greater than zero degrees Celsius would be,1234
In Biology, the equation is EG(T) = 5.13 – 1.9 x 10⁻²T , T > 273°K EG(300°K) = 3.22 eV1235
This proposed band gap equation is significantly different from the values for intrinsic semiconductors. It should1236probably be compared to binary semiconductors like Indium Antimonide (EG = 0.17 eV at 300°K) or Gallium1237Arsenide (EG = 1.43 eV at 300°K). These materials are considered III-V semiconductors based on their positions in1238the Periodic Table. A broader band gap material is Aluminum gallium indium phosphide, AlGaInP, with a band gap1239varying between 1.8 eV and 2.0 eV at 25°C (298°K). The gap varies with the composition of the material resulting1240from a complex deposition process, known as heteroepitaxy.1241
Aluminum gallium indium phosphide has a crystalline structure usually described as the Zinc blende Structure.1242The complexity of Aluminum gallium indium phosphide as a crystal might be compared to the liquid-crystalline1243water forming the N-type material in Section 8.4.2.3. The atoms of the water molecules might be deposited on the1244polar groups of the lipids and result in an effective band gap in the range described above. The result would be a1245quantum-mechanical situation beyond that of an intrinsic or binary semiconductor. 1246
The connection between the band gap and the disassociation energy of (bulk) water, and its exhibition of both1247a hexagonal and tetrahedral crystalline form has not been investigated here.1248
12.5.2.5.5 Potential impact on the sensory modalities of exothermic animals1249
If the variation in the band gap of sensory neurons in animals is confirmed, it will provide new and1250significant understanding of the exothermic animals. It may also explain why some fish, including at least1251some sharks are able to achieve an endothermic state when needed.1252
As the band gap rises in proportion to the drop in temperature within the biological temperature range, the spectral1253wavelength, where the 2-exciton mechanism is required, rises. It moves from an estimated wavelength of 590 nm in1254endotherms at 37°C to an estimated wavelength of 427 nm at 27° and 354 nm at 20°C (68°F) in exotherms. This1255means that the chromophores of the S–, M –, & L–channels will all rely upon the 2-exciton mechanism at 20°C. As1256the light level falls below the sunset level, these exotherms will be virtually blind.1257
This fact, if confirmed, readily explains why it is so easy to hunt frogs with a triton tipped spear after sunset.1258
It also may explain why sharks would seek to warm the retina of their eyes when in cold waters.1259
This induced restriction on the quantum-mechanical processes within the eyes is likely to also be present in the1260auditory, vestibular and and some tactile sensory neurons of exotherms.1261
38 Processes in Biological Vision
12.5.3 CRUCIAL MECHANISM: Adaptation of the outer segment–the phenomenon of1262bleaching1263
This sub-section addresses the quiescent, or steady, state of adaptation only. The transient, large signal light1264and dark adaptation (which involve different time constants) are addressed fullly in Section 7.2.2. Small1265signals generated by photoreceptors examining a scene do not affect the state of adaptation of the eye. 1266Adaptation affects all of the photoreceptors in a local area of the retina on a spectral channel by spectral1267channel basis.1268
The net number of Rhodonine molecules in the ground state at any moment is indicative of the sensitivity of the total1269coating to stimulation. This sensitivity is also indicative of the state of adaptation of that OS. The number of1270molecules of Rhodonine per disc is very large. For a 2 micron diameter opsin substrate coated on both sides by a1271monolayer of Rhodonine molecules (neglecting the edge regions of coating), there are approximately 2 x 1081272molecules of potentially excitable chromophore (Section 4.3.5.5) per outer segment, OS.1273
After a period measured in tens of seconds following the cessation of stimulation, all of the molecules of an outer1274segment, of an operational neuron, will be in their ground state and the OS will be at maximum sensitivity. Upon1275stimulation, the sensitivity will be given by the recent state of excitation, F, minus the recent state of de-excitation,1276K. The availability of charges to de-excite the chromophore molecules is usually less than required by the flux, F. 1277As a result, the sensitivity of the OS decreases until a balance is achieved between the photon flux, F, and the de-1278excitation, K. This is the extremely important mechanism of adaptation. As a result of this mechanism, the average1279sensitivity of the OS becomes inverse to the average incident flux, F. The product of the average incident flux, F,1280times the average sensitivity is therefore a constant. Any short term change in the incident flux causes the value of1281K to vary accordingly, and this variation becomes the output signal delivered to the distribution Activa of the inner1282segment. This short term mechanism is termed the (photo) excitation/de-excitation mechanism in this work and its1283description is the Excitation/De-excitation Equation, the E/D Equation. The reason “photo” is in parentheses is1284because this same equation has been found to apply to all sensory modalities in the neural system of Chordata.1285The overall operation of the transduction mechanism is addressed in Appendix A. 1286
With the large number of chromophore molecules per OS (about 2 x 10⁸), the number of chromophore molecules in1287the ground state can easily drop to less than 1000. This would reduce the sensitivity of the OS by a factor of 2 x 105,1288a value commensurate with the dynamic range of vision. This is without factoring in the additional dynamic range1289(~10:1, Section 2.4.7) provided by the iris of the eye. A value of 106:1 is compatible with the known adaptation1290range of the human eye (Section 7.2.4 and Section 17.6.1, particularly Figure 17.6.1-6). This dynamic range is1291compatible with the white area of figure 2.1.1-2 in Section 2.1.1.1. Outside the white area the performance of the1292visual modality is limited by a broad range of factors.1293
Note the incredible fact; the operating efficiency of the individual OS, under photopic condition is less than12940.001% compared to its scotopic operating efficiency. This means the level of bleaching under photopic1295conditions is also on the order of 0.001% of its unbleached condition. These numbers cannot be plotted1296realistically on linear scales. The level of bleaching is estimated to reach 99.999% before the lower edge of1297the photopic regime is reached (3 x 10+3 cd/m2).1298
Figure 12.5.3-1 provides a caricature of the crucial adaptation mechanism, the ability of the chromophores within1299the outer segment of each photoreceptor to deliver a constant output signal to the inner segment under virtually any1300state of excitation. It is the ability of the chromophores of vision to maintain the product of illuminance and the1301adaptive state (the sensitivity) over a very wide range of stimulation. The abscissa is shown with two separate1302relative scales. The photon flux is the preferred scale as it is independent of the number of photons as a function of1303wavelength and color temperature which is not true of the illuminance scale. Similarly, the ordinate scale applies to1304two separate parameters.1305
Primary Signal Processing 12- 39
The output signal range about the mean1306varies between about 0.1 to 10 mV1307positive, with a 20 mV positive signal1308resulting in some saturation at the1309pedicle of the photoreceptor neuron.1310
For levels of F below K, the available1311base current is sufficient to de-excite all1312of the excitons produced in real time. 1313This situation maintains the sensitivity1314of the disc (or all of the discs of the1315outer segment, at maximum. In this1316regime, the output to the Activa follows1317the incident photon flux faithfully. At1318some high, but undetermined , photon1319flux, the pool of ground state electrons1320will be so depleted that the sensitivity1321of the disc will approach a vertical1322asymptote. This situation will cause1323the output to go to zero. Except under1324these two extreme conditions,1325adaptation is remarkably well behaved1326over many orders of magnitude of1327photon flux.1328
At average illuminance level1329significantly below K (two or more1330magnitudes), the information extraction1331engines of stage 4 restrict the1332bandwidth of the signaling channels1333and information processing channels to1334make optimum use of the information1335available1336
In summary,1337
It is important to note the visual modality operates as a nominally constant quiescent signal amplitude1338system beyond stage 1. This appears to be true for all operating modalities within the neural system. The1339nominal quiescent signal amplitude, for bipolar signals, throughout the neural system is nearly constant.1340
It is similarly important to note, stage 1 of the visual modality does not utilize high signal amplification1341except that of the 1st Activa, of all sensory neurons. The current gain of the 1st Activa is between 40 and 2001342based on similar man-made transistors and the few data points in the literature relating the pA currents1343through the base and emitter leads of the 1st Activa.1344
To maintain this nominally constant signal amplitude throughout the neural system, the adaptation1345mechanism is primarily a signal reduction mechanism in the presence of very high intensity luminance. It1346operates over a loss range of 0 dB to greater than –80 dB. 0 dB is the fully dark adapted condition.1347
12.5.4 Effect of dis-assembly in the laboratory1348
It is very instructive to take a moment to examine the characteristics of the overall photodetection process, Stage 1,1349in the visual process developed here and to examine the observable characteristics of the various components in the1350laboratory.1351
12.5.4.1 Probing1352
Figure 12.5.3-1 CRUCIAL CONCEPT: Adaptation & the constantsignal output of discs of photoreceptors. K; the maximum averageelectron flow available from the base terminal of the first Activa, AS. Except at illumination levels (or photon flux, F) below the scotopicregime, the product of the average photon flux and the sensitivity equalsa constant. Short term photon flux changes about the average constitutethe output signal delivered to the base of the first Activa, AS. See text.
40 Processes in Biological Vision
As indicated elsewhere, the process of probing the photoreceptor cell in the laboratory is an awkward process,1353although useful information can be and is obtained. The size of typical probes is 10-25 microns, much larger than1354the 0.1 to 2 micron structures involved in the smaller neurons used in the stage 2 signal processing and stage 4 &51355information extraction activities related to vision. Therefore, attempting to obtain electronic signals that are not1356contaminated by the probing process is difficult and time consuming, essentially a probabilistic process in itself.1357
At impedance levels of 100 megohms associated with the smaller neurons, the capacitance associated with the output1358pedicle is frequently at or below five picofarads. Loading the output circuit of the neuron with an electrical probe1359exhibiting an equal or higher capacitance leads to problems. Such loading of a neuron will usually produce a highly1360distorted output on an oscilloscope. The investigator must makes a careful choice of electrical probes. In these1361situations, an open-gate MOS type of transistor most likely must be used as the very tip of the probe.1362
12.5.4.2 Dissection1363
If the “battery” powering the neural portion of the photoreceptor cell is disconnected from the neuron, the resting1364potential and the output waveforms associated with the cell will be grossly affected. Even penetrating the cell1365membrane has the potential of changing the resting potential and hence the overall performance of the cell.1366
Removing one or more neurons and placing them in a petri dish requires careful attention to the chemical1367environment surrounding the neurons. If the environment does not include glutamic acid at a concentration1368of a few %, the electrostenolytic “battery” on the surface of each neuron will be deprived of its source of1369energy. Any Ringer’s Solution must contain glutamic acid (at a nominal 3% concentration) if the neurons1370are to be kept functional.1371
As shown in the pipette isolation technique, the total current into and out of the OS can be measured during1372irradiation by sucking the OS of an otherwise complete cell into a pipette which is connected into an electrical1373measuring set. Breaking the connection between the OS and the IS immediately terminates the electrical response to1374irradiation. The OS can still be bleached but it will not return to the unbleached condition except after an extended1375period of time. The OS is not a stand-alone photoreceptor. It must be attached to the IS for proper operation.1376
Similarly, the output of the IS, as measured at the pedicel, does not respond to irradiation in the absence of a proper1377connection to the OS via the microtubules passing through the cilium.1378
12.5.4.3 Extraction of the chromophores of vision–the Rhodonines1379
The conventional process for extracting the visual chromophores in the laboratory does not lead to the1380extraction of the original material nor does it preserve the necessary and specific configuration of the1381chemical material that gives it its unique properties. 1382
To date, the method of extracting the active chromophores of vision has assumed they are contained within the discs1383of the outer segment of the photoreceptor neurons. The fact that electron-micrography has shown there is an1384important material coating the outside of the discs has been ignored. The goal has been to strip away all of the1385material surrounding the discs themselves using very coarse laboratory techniques that have routinely stripped away1386the actual chromophoric material and generally destroyed both its liquid-crystalline state of matter (Section 5.5.15)1387and its molecular structure by exposing the material to oxidative processes.1388
If the chromophoric molecules extracted above are now treated with an oxidizing agent, which most detergents are,1389in order to speed up the extraction process, another significant change takes place; the delicate chromophoric1390molecules are now oxidized by the detergent and they lose one or both of their heavy atom terminal groups--to be1391replaced typically by a hydrogen or a methyl group. The effect of this action is to transform the Rhodonines into a1392retinene or a similar fragment that is no longer a chromophore in the visual spectrum. The remaining material can1393no longer by characterized as a visual chromophore but only as a chromogen.1394
If any of the original chromophoric material remains in the aliquot preserved by the investigator, any oxygen1395associated with the chromophoric material will be excited into its triplet state. As a result, the chromophoric1396material becomes transparent with a relaxation time measured in tens of minutes to hours. The material will almost1397certainly be solubilized and lose its resonance properties associated with the liquid-crystalline state of matter. 1398
As a result of this mishandling, the investigator is left to analyze the protein material forming the discs. Lo and1399behold, the dominant proteins of the disc is opsin and opsin does include a negligibly small ligand of retinol,1400
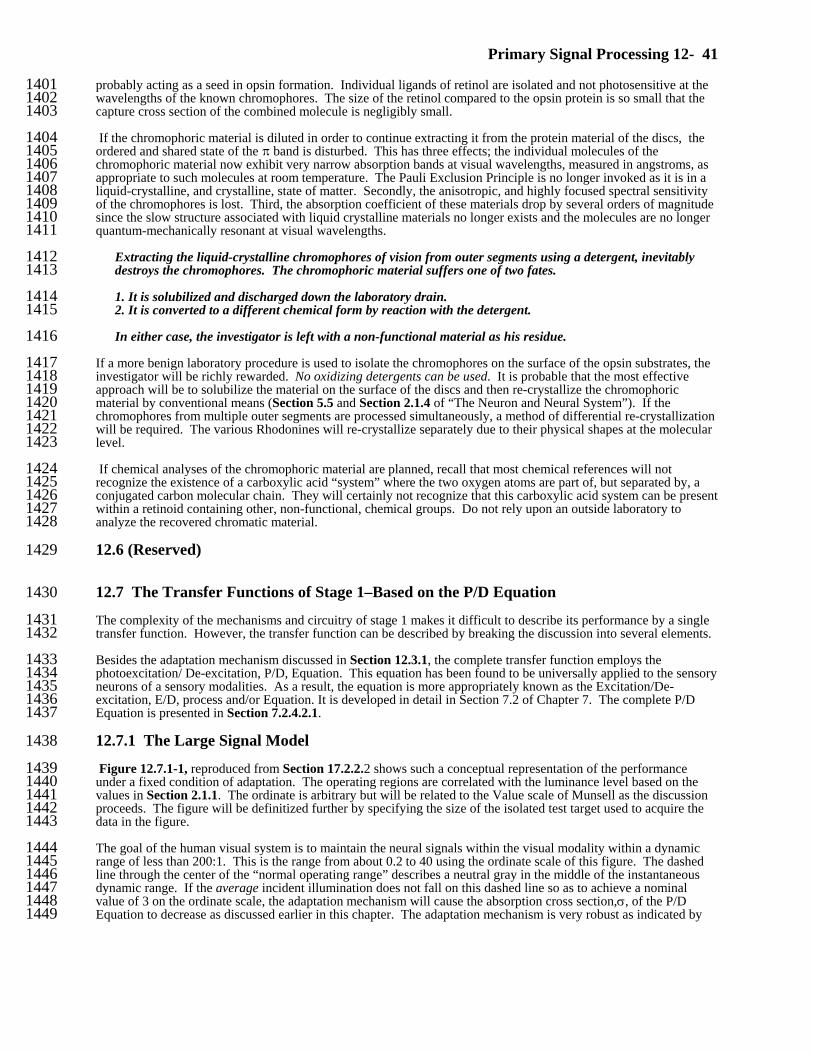
Primary Signal Processing 12- 41
probably acting as a seed in opsin formation. Individual ligands of retinol are isolated and not photosensitive at the1401wavelengths of the known chromophores. The size of the retinol compared to the opsin protein is so small that the1402capture cross section of the combined molecule is negligibly small. 1403
If the chromophoric material is diluted in order to continue extracting it from the protein material of the discs, the1404ordered and shared state of the B band is disturbed. This has three effects; the individual molecules of the1405chromophoric material now exhibit very narrow absorption bands at visual wavelengths, measured in angstroms, as1406appropriate to such molecules at room temperature. The Pauli Exclusion Principle is no longer invoked as it is in a1407liquid-crystalline, and crystalline, state of matter. Secondly, the anisotropic, and highly focused spectral sensitivity1408of the chromophores is lost. Third, the absorption coefficient of these materials drop by several orders of magnitude1409since the slow structure associated with liquid crystalline materials no longer exists and the molecules are no longer1410quantum-mechanically resonant at visual wavelengths.1411
Extracting the liquid-crystalline chromophores of vision from outer segments using a detergent, inevitably1412destroys the chromophores. The chromophoric material suffers one of two fates.1413
1. It is solubilized and discharged down the laboratory drain.14142. It is converted to a different chemical form by reaction with the detergent.1415
In either case, the investigator is left with a non-functional material as his residue.1416
If a more benign laboratory procedure is used to isolate the chromophores on the surface of the opsin substrates, the1417investigator will be richly rewarded. No oxidizing detergents can be used. It is probable that the most effective1418approach will be to solubilize the material on the surface of the discs and then re-crystallize the chromophoric1419material by conventional means (Section 5.5 and Section 2.1.4 of “The Neuron and Neural System”). If the1420chromophores from multiple outer segments are processed simultaneously, a method of differential re-crystallization1421will be required. The various Rhodonines will re-crystallize separately due to their physical shapes at the molecular1422level. 1423
If chemical analyses of the chromophoric material are planned, recall that most chemical references will not1424recognize the existence of a carboxylic acid “system” where the two oxygen atoms are part of, but separated by, a1425conjugated carbon molecular chain. They will certainly not recognize that this carboxylic acid system can be present1426within a retinoid containing other, non-functional, chemical groups. Do not rely upon an outside laboratory to1427analyze the recovered chromatic material. 1428
12.6 (Reserved)1429
12.7 The Transfer Functions of Stage 1–Based on the P/D Equation1430
The complexity of the mechanisms and circuitry of stage 1 makes it difficult to describe its performance by a single1431transfer function. However, the transfer function can be described by breaking the discussion into several elements.1432
Besides the adaptation mechanism discussed in Section 12.3.1, the complete transfer function employs the1433photoexcitation/ De-excitation, P/D, Equation. This equation has been found to be universally applied to the sensory1434neurons of a sensory modalities. As a result, the equation is more appropriately known as the Excitation/De-1435excitation, E/D, process and/or Equation. It is developed in detail in Section 7.2 of Chapter 7. The complete P/D1436Equation is presented in Section 7.2.4.2.1.1437
12.7.1 The Large Signal Model1438
Figure 12.7.1-1, reproduced from Section 17.2.2.2 shows such a conceptual representation of the performance1439under a fixed condition of adaptation. The operating regions are correlated with the luminance level based on the1440values in Section 2.1.1. The ordinate is arbitrary but will be related to the Value scale of Munsell as the discussion1441proceeds. The figure will be definitized further by specifying the size of the isolated test target used to acquire the1442data in the figure. 1443
The goal of the human visual system is to maintain the neural signals within the visual modality within a dynamic1444range of less than 200:1. This is the range from about 0.2 to 40 using the ordinate scale of this figure. The dashed1445line through the center of the “normal operating range” describes a neutral gray in the middle of the instantaneous1446dynamic range. If the average incident illumination does not fall on this dashed line so as to achieve a nominal1447value of 3 on the ordinate scale, the adaptation mechanism will cause the absorption cross section,σ, of the P/D1448Equation to decrease as discussed earlier in this chapter. The adaptation mechanism is very robust as indicated by1449
42 Processes in Biological Vision
the diagonal lines in this figure. Under very bright illumination (the hyperopic regime), the absorption cross section1450can decrease by 80 dB, a value of nominally 104:1. If the average illumination still does not conform to a brightness1451value of about 3, the visual system will saturate and enter a condition normally associated with “snow blindness.” 1452The perception of scene contrast will be reduced to near zero. For illumination levels below the photopic regime,1453full dark adaptation will be approached. Usually, the scene contrast is greatly reduced in this regime, with starlight1454the dominant natural source. Th result is a reduced signal level in the brightness of the neural signal.1455
- - - 1456
The solid curved line intersecting with the dash-dot line labeled compression can be expected to describe the overall1457response of the visual system to a luminance stimulus in the absence of any adaptation mechanism. If the feedback1458employed by the sensory neurons was 100% effective in limiting the growth in the neural signal above a specific cut-1459in value, the curve labeled 100% adaptation asymptote would be achieved with the introduction of adaptation. 1460However, the feedback employed in vision, like in hearing, is not designed to provide a hard limit on the brightness1461response. It is designed to expand the brightness range associated with a given luminance range over a limited1462operating range known as the photopic region. The result is the dashed line through the middle of the shaded box1463labeled “Normal Operating Regime.” The following material will attempt to quantify the scales of this figure more1464completely.1465
Figure 12.7.1-1 Proposed template for the perceived visual brightness as a function of luminance intensity inhumans ADD. The dashed line within the Normal Operating Regime is called the terminal brightness locus byStevens & Stevens. The Compression line is called the Dark adaptation line by them.
Primary Signal Processing 12- 43
The large signal model must be evaluated in terms of the temporal characteristics of the input signal. If the signal is1466at a constant level with respect to time, changes in the scene contrast will be handled differently. The adaptation1467mechanism has a limited response time usually measured in seconds.1468
12.7.1.1 Short term large signal model– milliseconds duration1469
For short term stimuli, such as those illustrated in Section 12.8.1-4A, the adaptation mechanism remains frozen1470during short duration stimuli. Thus the dynamic range of the 1st Activa (in the adaptation amplifier) is usually1471controlling. The figure shows a hard saturation at the 20 picoampere level within a fraction of a second following1472the P/D response. The signal labeled 7.8 photons/micron2 was handled by the 1st Activa well (a dynamic signal level1473of 243:1) but saturated at a signal level of 16 photons/micron2 (a dynamic signal level of 500:1).1474
12.7.1.2 Longer term large signal model– seconds or longer duration1475
For longer term stimuli, lasting more than a few seconds, the adaptation mechanism is controlling. Within the time1476constant set by the 1st Activa electrostenolytic power supply, the adaptation mechanism will re-establish the nominal1477brightness value of 3 as described above. Until it has had time to do this for increases in illumination (which may1478take many time constants for illumination changes of a decade or more), the system will saturate, and generally1479cause pain to be reported to the brain. This is the situation encountered on leaving a movie theater in the middle of1480the afternoon on a clear day. For significant reductions in illumination, the adaptation mechanism also requires time1481to change the sensitivity (to raise the absorption cross section, σ). This is the situation when you enter a movie1482theater from outside on a bright clear day.1483
44 Processes in Biological Vision
- - - -xxx1484
Based on the observed characteristics in the referenced test data and the literature, the large signal dynamic range of1485the photoreceptor is quite enormous. It is a photon counter at low irradiances and its maximum signal level is1486limited, according to the P/D, by the availability of n-electrons in the chromophoric liquid crystal of the OS (the total1487of all discs which are in electronic communications within a single OS). The maximum sustained signal level, io,1488may also be limited metabolically by the ability of the IS to support the necessary supply current under long term1489conditions; this would introduce another time constant into the overall “Adaptation Equation”.1490
The instantaneous dynamic range of the photoreceptor is much smaller. As shown by the test data, the maximum1491output current available from most photoreceptors is in the 20-30 pA range and it clearly exhibits the logarithmic1492characteristic of the diode at the input to the amplifier stage. Whether it is appropriate to describe the diode circuit1493as a clamp depends on the values of the resistors involved. But clearly, for large instantaneous signal changes, the1494signal level is clamped to io=is.1495
It should be noted that the overall dynamic range of the eye is essentially linear until the number of available n-1496electrons is depleted. However, the instantaneous dynamic range is effectively limited to a range on the order of 1497100:1 and the output is a very accurate logarithmic function of the input.1498
12.7.2 The Small Signal Model1499
The small signal model of the photoreceptor is straight forward based on the graphic above and the complete P/D1500equation. This equation is differentiable and an exact output can be obtained for any input condition. The P/D1501equation remains a linear equation under all small signal conditions and the 1st Activa does not saturate.1502
Within the dynamic range of the 1st Activa (about 200:1) and the adaptation mechanism, The perceived scene1503contrast will be faithfully reported to the brain (stage 5 of the visual modality). As noted above for low scene1504illumination, the scene contrast may be low. As a result, the perceived scene contrast reported to the brain may also1505be low. The stage 4 information extraction engines of the visual modality appears to make certain algorithmic1506modification under these conditions to optimize the information provided to stage 5.1507
12.7.4 The transient state transfer function EMPTY1508
[Work in Devoe 1966 including the circuit diagram shown in Armington 1974]1509
Note also Crone page 190 and the mathematical problem with this description1510

Primary Signal Processing 12- 45
Figure 12.8.1-1 Waveforms associated with thephotoreceptor cell. The photons are shown arriving at the disc stack of the outer segment from the wrong directionfor simplicity. The electrostenolytic supply to thecollector of the adaptation amplifier Activa has beenshown explicitly. See text.
12.8 Comparison with data in the Literature1511
This section may appear superfluous since much of the most important literature has been utilized in the1512development and justification of the overall model. However, there are more comparisons to be made.1513
It is necessary to show how the model developed here applies to all types of animal vision. Thus, it must be shown1514to apply to Arthropoda and Mollusca (basically all invertebrates with vision) and to Chordata (the vertebrates and1515some of their ancestors) and possibly a few unusual cases such as Limulus (which may have a unique photoreceptor1516cell, known as the eccentric cell) and Annelida.1517
Reference will be made to the Photoexcitation/De-excitation Equation (P/D Equation) developed in Section 16.3. It1518describes the electrical waveforms generated within the outer and inner segments of the photoreceptor cells. After1519some modification, the P/D Equation appears as the “generator waveform” at the pedicle of a photoreceptor cell. 1520Reference will also be made to Section 11.1.5 where a variety of waveforms were defined by Class. Figure 12.8.1-15211 offers a modified diagram annotating the relationship of these waveforms to the photoreceptor cell. The1522electrostenolytic supply for the adaptation amplifier (on the left) has been shown explicitly because of its importance1523to the discussion of Section 12.8.1. 2 & 3. The details of this circuit, its relation to the vascular supply of the retina1524and its impact on adaptation mechanism will be detailed in Sections 12.5.3.2.1 & 16.4.2.1. The Class A waveform1525path is shown dashed because there is no known technique for contacting the open connection to the base region of1526the Activa within the adaptation amplifier. However, using the Faraday cage technique of Baylor et al., the signal1527current of the Class C waveform has been found to equal the Class A signal waveform. Effectively, all of the1528important waveforms of the photoreceptor have been recorded in the laboratory as will be discussed below. 1529
The area between the RPE and the inner segments of1530the photoreceptors is chemically unique. It is an area1531free of oxygen and dopamine and filled with the discs1532of the outer segments. Oxygen must be excluded to1533avoid oxidation of the chromophore material on the1534discs in liquid-crystalline form. The discs are1535immersed in a solution of chromophores and1536chromophore carriers, IRBP’s. The solution also1537contains glutamate as the neural system fuel and1538GABA as a waste product of electrostenolytics. 1539Bruck’s membrane is well documented as the outer1540surface of the RPE farthest from the pupil of the eye. 1541Verhoeff’s membrane is less well documented and may1542not be a physical membrane. Alternately, it may be a1543highly cribiform surface of limited structural strength. 1544
12.8.1 The outer segment and the suction1545pipette technique1546
The Baylor team has been studying the photoreceptor1547cell for many years using a technique where a single1548operational OS is sucked into a Faraday cage in the1549form of a micropipette. In the more recent1550experiments, this pipette has had a thermocouple1551mounted near the tip of the pipette to provide precise temperature information. By moving the OS into the Faraday1552cage gradually, it is possible to determine the source of the current emanating from the OS. The current is very1553uniform as a function of the length of the OS. This technique essentially isolates the selected OS from the IPM. 1554Therefore, the collected current is returned to the system through the ground connection provided by the1555experimenter. In this way, a Class C waveform is obtained but the return path is not via the ground bridge between1556the IPM and the INM. The waveform is usually measured as a current because of the extremely high impedance1557level. 1558
If measured as a voltage, the Class C waveform can be considered the result of a second order physical system if the1559capacitance associated with the collector is significant. Therefore, the waveform is not discontinuous, as in the Class1560B waveforms, where the amplitude departs abruptly from the baseline. It would depart with a small amount of1561curvature after the intrinsic delay of the P/D Equation. Other considerations may apply, see Section 16.4.1.1.8.1562
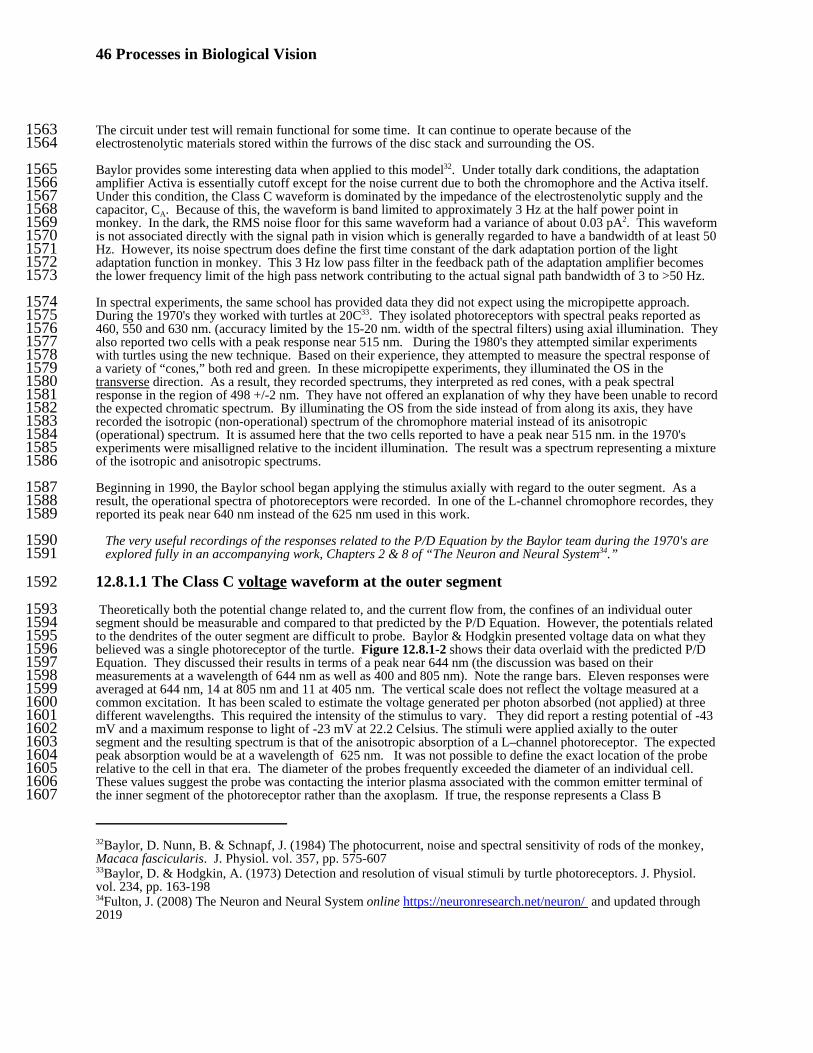
46 Processes in Biological Vision
32Baylor, D. Nunn, B. & Schnapf, J. (1984) The photocurrent, noise and spectral sensitivity of rods of the monkey,Macaca fascicularis. J. Physiol. vol. 357, pp. 575-60733Baylor, D. & Hodgkin, A. (1973) Detection and resolution of visual stimuli by turtle photoreceptors. J. Physiol.vol. 234, pp. 163-19834Fulton, J. (2008) The Neuron and Neural System online https://neuronresearch.net/neuron/ and updated through2019
The circuit under test will remain functional for some time. It can continue to operate because of the1563electrostenolytic materials stored within the furrows of the disc stack and surrounding the OS. 1564
Baylor provides some interesting data when applied to this model32. Under totally dark conditions, the adaptation1565amplifier Activa is essentially cutoff except for the noise current due to both the chromophore and the Activa itself. 1566Under this condition, the Class C waveform is dominated by the impedance of the electrostenolytic supply and the1567capacitor, CA. Because of this, the waveform is band limited to approximately 3 Hz at the half power point in1568monkey. In the dark, the RMS noise floor for this same waveform had a variance of about 0.03 pA2. This waveform1569is not associated directly with the signal path in vision which is generally regarded to have a bandwidth of at least 501570Hz. However, its noise spectrum does define the first time constant of the dark adaptation portion of the light1571adaptation function in monkey. This 3 Hz low pass filter in the feedback path of the adaptation amplifier becomes1572the lower frequency limit of the high pass network contributing to the actual signal path bandwidth of 3 to >50 Hz.1573
In spectral experiments, the same school has provided data they did not expect using the micropipette approach. 1574During the 1970's they worked with turtles at 20C33. They isolated photoreceptors with spectral peaks reported as1575460, 550 and 630 nm. (accuracy limited by the 15-20 nm. width of the spectral filters) using axial illumination. They1576also reported two cells with a peak response near 515 nm. During the 1980's they attempted similar experiments1577with turtles using the new technique. Based on their experience, they attempted to measure the spectral response of1578a variety of “cones,” both red and green. In these micropipette experiments, they illuminated the OS in the1579transverse direction. As a result, they recorded spectrums, they interpreted as red cones, with a peak spectral1580response in the region of 498 +/-2 nm. They have not offered an explanation of why they have been unable to record1581the expected chromatic spectrum. By illuminating the OS from the side instead of from along its axis, they have1582recorded the isotropic (non-operational) spectrum of the chromophore material instead of its anisotropic1583(operational) spectrum. It is assumed here that the two cells reported to have a peak near 515 nm. in the 1970's1584experiments were misalligned relative to the incident illumination. The result was a spectrum representing a mixture1585of the isotropic and anisotropic spectrums.1586
Beginning in 1990, the Baylor school began applying the stimulus axially with regard to the outer segment. As a1587result, the operational spectra of photoreceptors were recorded. In one of the L-channel chromophore recordes, they1588reported its peak near 640 nm instead of the 625 nm used in this work.1589
The very useful recordings of the responses related to the P/D Equation by the Baylor team during the 1970's are1590explored fully in an accompanying work, Chapters 2 & 8 of “The Neuron and Neural System34.”1591
12.8.1.1 The Class C voltage waveform at the outer segment1592
Theoretically both the potential change related to, and the current flow from, the confines of an individual outer1593segment should be measurable and compared to that predicted by the P/D Equation. However, the potentials related1594to the dendrites of the outer segment are difficult to probe. Baylor & Hodgkin presented voltage data on what they1595believed was a single photoreceptor of the turtle. Figure 12.8.1-2 shows their data overlaid with the predicted P/D1596Equation. They discussed their results in terms of a peak near 644 nm (the discussion was based on their1597measurements at a wavelength of 644 nm as well as 400 and 805 nm). Note the range bars. Eleven responses were1598averaged at 644 nm, 14 at 805 nm and 11 at 405 nm. The vertical scale does not reflect the voltage measured at a1599common excitation. It has been scaled to estimate the voltage generated per photon absorbed (not applied) at three1600different wavelengths. This required the intensity of the stimulus to vary. They did report a resting potential of -431601mV and a maximum response to light of -23 mV at 22.2 Celsius. The stimuli were applied axially to the outer1602segment and the resulting spectrum is that of the anisotropic absorption of a L–channel photoreceptor. The expected1603peak absorption would be at a wavelength of 625 nm. It was not possible to define the exact location of the probe1604relative to the cell in that era. The diameter of the probes frequently exceeded the diameter of an individual cell. 1605These values suggest the probe was contacting the interior plasma associated with the common emitter terminal of1606the inner segment of the photoreceptor rather than the axoplasm. If true, the response represents a Class B1607
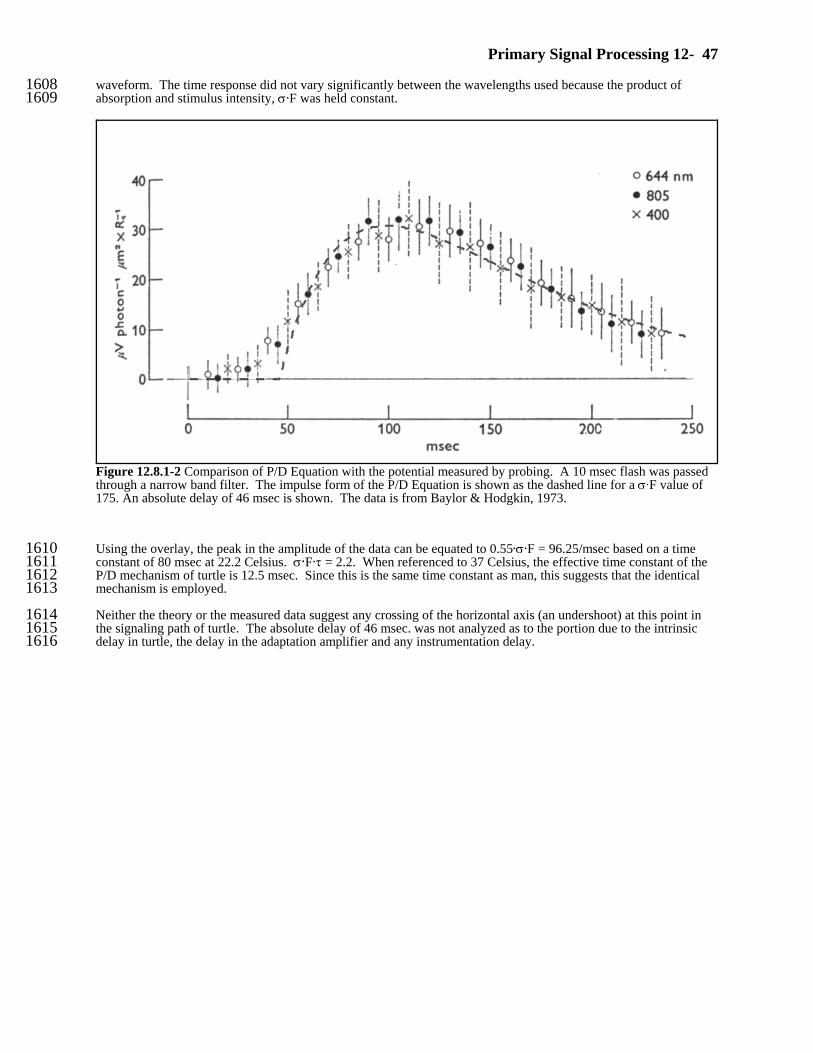
Primary Signal Processing 12- 47
Figure 12.8.1-2 Comparison of P/D Equation with the potential measured by probing. A 10 msec flash was passedthrough a narrow band filter. The impulse form of the P/D Equation is shown as the dashed line for a σAF value of175. An absolute delay of 46 msec is shown. The data is from Baylor & Hodgkin, 1973.
waveform. The time response did not vary significantly between the wavelengths used because the product of1608absorption and stimulus intensity, σ@F was held constant.1609
Using the overlay, the peak in the amplitude of the data can be equated to 0.55@σ@F = 96.25/msec based on a time1610constant of 80 msec at 22.2 Celsius. σ@F@τ = 2.2. When referenced to 37 Celsius, the effective time constant of the1611P/D mechanism of turtle is 12.5 msec. Since this is the same time constant as man, this suggests that the identical1612mechanism is employed.1613
Neither the theory or the measured data suggest any crossing of the horizontal axis (an undershoot) at this point in1614the signaling path of turtle. The absolute delay of 46 msec. was not analyzed as to the portion due to the intrinsic1615delay in turtle, the delay in the adaptation amplifier and any instrumentation delay.1616
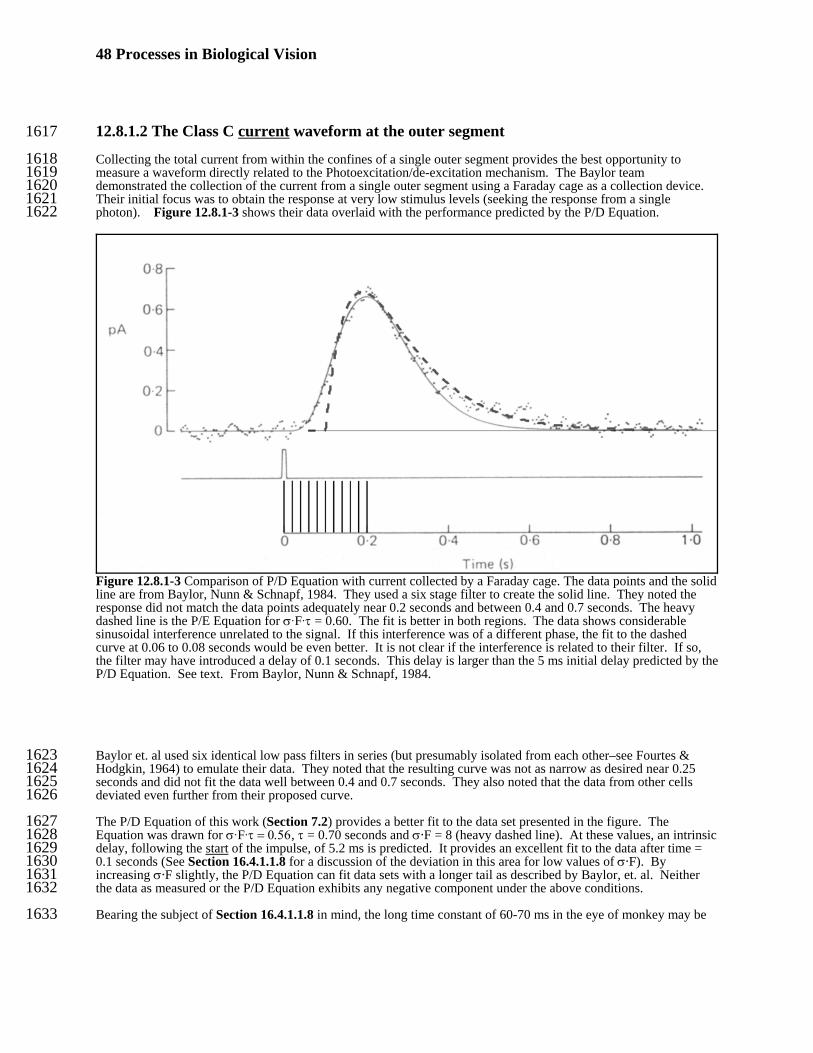
48 Processes in Biological Vision
Figure 12.8.1-3 Comparison of P/D Equation with current collected by a Faraday cage. The data points and the solidline are from Baylor, Nunn & Schnapf, 1984. They used a six stage filter to create the solid line. They noted theresponse did not match the data points adequately near 0.2 seconds and between 0.4 and 0.7 seconds. The heavydashed line is the P/E Equation for σAFAτ = 0.60. The fit is better in both regions. The data shows considerablesinusoidal interference unrelated to the signal. If this interference was of a different phase, the fit to the dashedcurve at 0.06 to 0.08 seconds would be even better. It is not clear if the interference is related to their filter. If so,the filter may have introduced a delay of 0.1 seconds. This delay is larger than the 5 ms initial delay predicted by theP/D Equation. See text. From Baylor, Nunn & Schnapf, 1984.
12.8.1.2 The Class C current waveform at the outer segment1617
Collecting the total current from within the confines of a single outer segment provides the best opportunity to1618measure a waveform directly related to the Photoexcitation/de-excitation mechanism. The Baylor team1619demonstrated the collection of the current from a single outer segment using a Faraday cage as a collection device. 1620Their initial focus was to obtain the response at very low stimulus levels (seeking the response from a single1621photon). Figure 12.8.1-3 shows their data overlaid with the performance predicted by the P/D Equation.1622
Baylor et. al used six identical low pass filters in series (but presumably isolated from each other–see Fourtes &1623Hodgkin, 1964) to emulate their data. They noted that the resulting curve was not as narrow as desired near 0.251624seconds and did not fit the data well between 0.4 and 0.7 seconds. They also noted that the data from other cells1625deviated even further from their proposed curve.1626
The P/D Equation of this work (Section 7.2) provides a better fit to the data set presented in the figure. The1627Equation was drawn for σAFAτ = 0.56, τ = 0.70 seconds and σ@F = 8 (heavy dashed line). At these values, an intrinsic1628delay, following the start of the impulse, of 5.2 ms is predicted. It provides an excellent fit to the data after time =16290.1 seconds (See Section 16.4.1.1.8 for a discussion of the deviation in this area for low values of σ@F). By1630increasing σ@F slightly, the P/D Equation can fit data sets with a longer tail as described by Baylor, et. al. Neither1631the data as measured or the P/D Equation exhibits any negative component under the above conditions.1632
Bearing the subject of Section 16.4.1.1.8 in mind, the long time constant of 60-70 ms in the eye of monkey may be1633
Primary Signal Processing 12- 49
significant. If this value was confirmed for higher levels of σCF, it would suggest a significant difference between1634humans and the Macaca family. Such a long time constant compared to the 12.5 ms of humans would suggest much1635less capability in analyzing fine detail quickly. This capability is critical in reading (other than for the large block1636characters usually used in learning experiments with monkeys ).1637
More experimentation is needed in this area to further refine the instrumentation and separate the data into additional1638classes if necessary. Establishing mean values and range bars for each class of data would allow further perfection1639of the theoretical model.1640
The data of figure 3 of Baylor, Lamb & Yau (1979a) provides very important data concerning the class C current1641waveform. Figure 12.8.1-4 reproduces their data for the Class C current of the toad, Bufo marinus, using the suction1642pipette technique and transverse stimulation of a “red rod.” Temperature was poorly controlled to the range of 18-164325° Celsius. The peak absorption was at 500 nm as expected for the intrinsic absorption of the Rhodonines when the1644outer segment is subject to transverse stimulation. Frame A shows the data as collected, including significant1645saturation at 20 pA output current. Below 20 pA output current, the waveform faithfully reproduces the theoretical1646P/D response. Frame B shows the expected performance of the first Activa under these operating conditions. A1647nominal electrostenolytic supply voltage of -154 mV is assumed. A nominal electrostenolytic supply impedance of 71648megohms is also assumed. Under these conditions, the instantaneous output current, ic, is proportional to the1649excitation current, ib, for output current levels below 20 pA. The output current is outgoing from the cell to the1650pipette wall. As the excitation current increases, the output current increases proportionately in accordance with the1651load line, until the load line, RL, intersects the saturation line. At this point, the Activa stops exhibiting “transistor1652action” since the collector potential is below the saturation potential. This is the reason for the hard saturation in1653frame A.1654
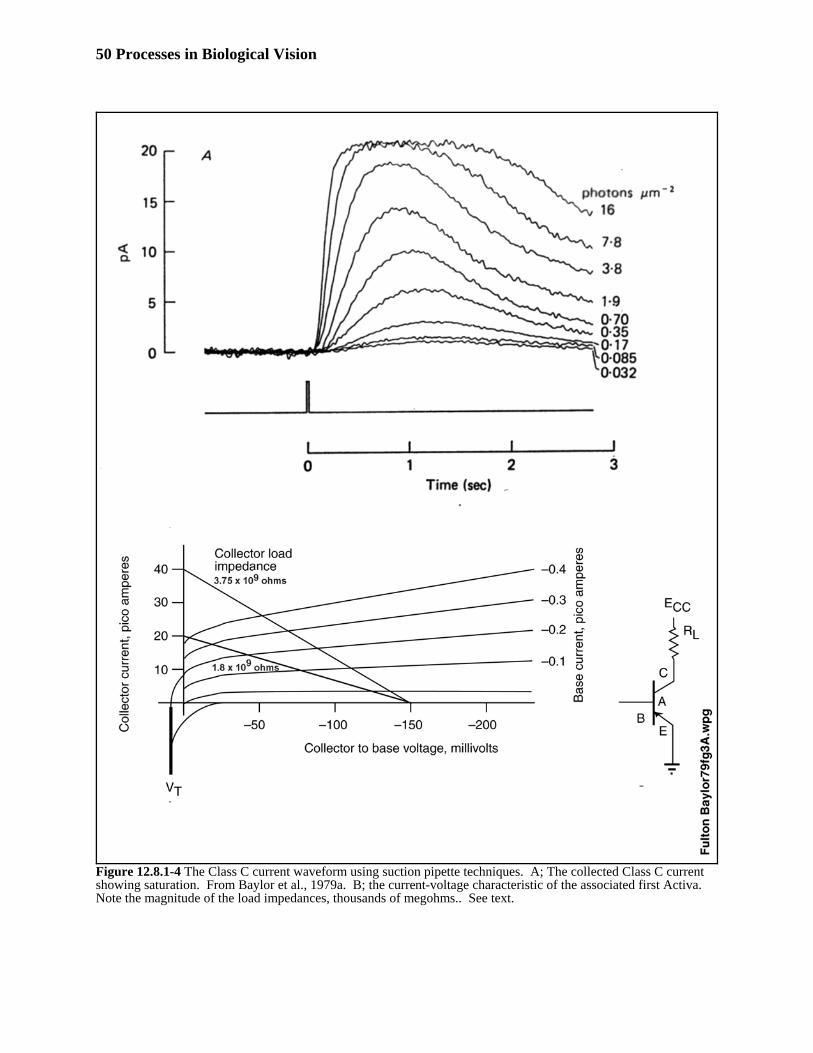
50 Processes in Biological Vision
Figure 12.8.1-4 The Class C current waveform using suction pipette techniques. A; The collected Class C currentshowing saturation. From Baylor et al., 1979a. B; the current-voltage characteristic of the associated first Activa. Note the magnitude of the load impedances, thousands of megohms.. See text.
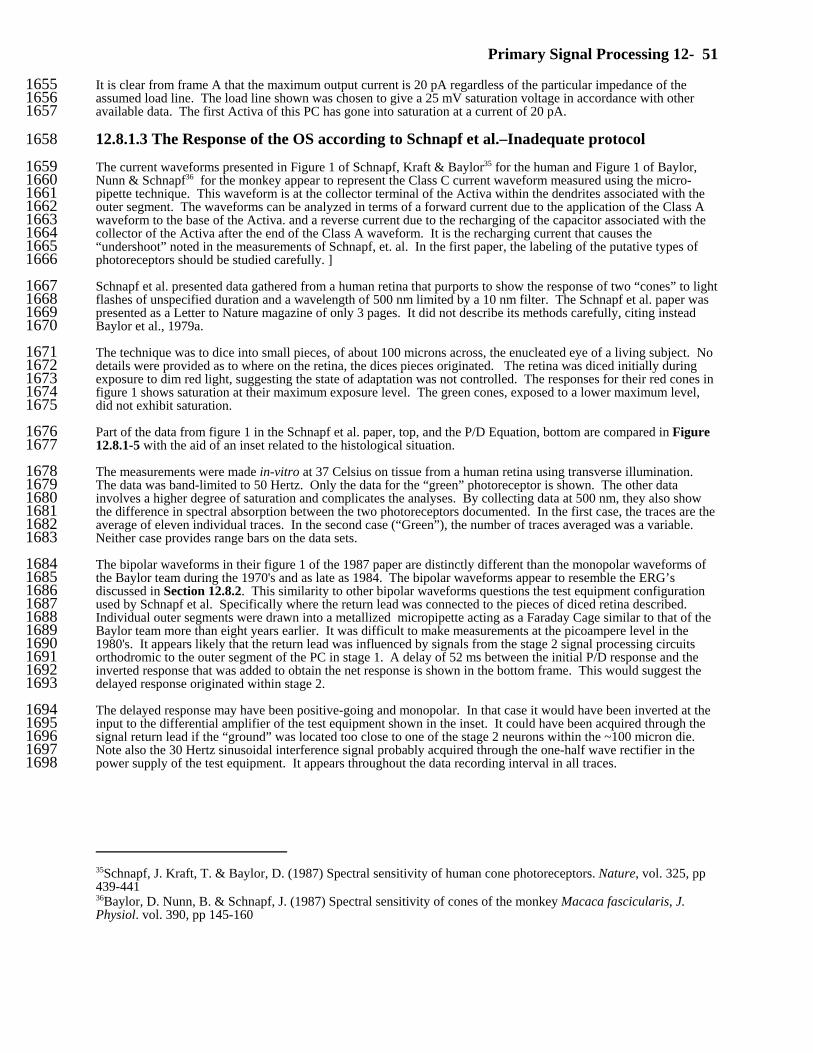
Primary Signal Processing 12- 51
35Schnapf, J. Kraft, T. & Baylor, D. (1987) Spectral sensitivity of human cone photoreceptors. Nature, vol. 325, pp439-44136Baylor, D. Nunn, B. & Schnapf, J. (1987) Spectral sensitivity of cones of the monkey Macaca fascicularis, J.Physiol. vol. 390, pp 145-160
It is clear from frame A that the maximum output current is 20 pA regardless of the particular impedance of the1655assumed load line. The load line shown was chosen to give a 25 mV saturation voltage in accordance with other1656available data. The first Activa of this PC has gone into saturation at a current of 20 pA.1657
12.8.1.3 The Response of the OS according to Schnapf et al.–Inadequate protocol1658
The current waveforms presented in Figure 1 of Schnapf, Kraft & Baylor35 for the human and Figure 1 of Baylor,1659Nunn & Schnapf36 for the monkey appear to represent the Class C current waveform measured using the micro-1660pipette technique. This waveform is at the collector terminal of the Activa within the dendrites associated with the1661outer segment. The waveforms can be analyzed in terms of a forward current due to the application of the Class A1662waveform to the base of the Activa. and a reverse current due to the recharging of the capacitor associated with the1663collector of the Activa after the end of the Class A waveform. It is the recharging current that causes the1664“undershoot” noted in the measurements of Schnapf, et. al. In the first paper, the labeling of the putative types of1665photoreceptors should be studied carefully. ]1666
Schnapf et al. presented data gathered from a human retina that purports to show the response of two “cones” to light1667flashes of unspecified duration and a wavelength of 500 nm limited by a 10 nm filter. The Schnapf et al. paper was1668presented as a Letter to Nature magazine of only 3 pages. It did not describe its methods carefully, citing instead1669Baylor et al., 1979a.1670
The technique was to dice into small pieces, of about 100 microns across, the enucleated eye of a living subject. No1671details were provided as to where on the retina, the dices pieces originated. The retina was diced initially during1672exposure to dim red light, suggesting the state of adaptation was not controlled. The responses for their red cones in1673figure 1 shows saturation at their maximum exposure level. The green cones, exposed to a lower maximum level,1674did not exhibit saturation.1675
Part of the data from figure 1 in the Schnapf et al. paper, top, and the P/D Equation, bottom are compared in Figure167612.8.1-5 with the aid of an inset related to the histological situation.1677
The measurements were made in-vitro at 37 Celsius on tissue from a human retina using transverse illumination. 1678The data was band-limited to 50 Hertz. Only the data for the “green” photoreceptor is shown. The other data1679involves a higher degree of saturation and complicates the analyses. By collecting data at 500 nm, they also show1680the difference in spectral absorption between the two photoreceptors documented. In the first case, the traces are the1681average of eleven individual traces. In the second case (“Green”), the number of traces averaged was a variable. 1682Neither case provides range bars on the data sets.1683
The bipolar waveforms in their figure 1 of the 1987 paper are distinctly different than the monopolar waveforms of1684the Baylor team during the 1970's and as late as 1984. The bipolar waveforms appear to resemble the ERG’s1685discussed in Section 12.8.2. This similarity to other bipolar waveforms questions the test equipment configuration1686used by Schnapf et al. Specifically where the return lead was connected to the pieces of diced retina described. 1687Individual outer segments were drawn into a metallized micropipette acting as a Faraday Cage similar to that of the1688Baylor team more than eight years earlier. It was difficult to make measurements at the picoampere level in the16891980's. It appears likely that the return lead was influenced by signals from the stage 2 signal processing circuits1690orthodromic to the outer segment of the PC in stage 1. A delay of 52 ms between the initial P/D response and the1691inverted response that was added to obtain the net response is shown in the bottom frame. This would suggest the1692delayed response originated within stage 2. 1693
The delayed response may have been positive-going and monopolar. In that case it would have been inverted at the1694input to the differential amplifier of the test equipment shown in the inset. It could have been acquired through the1695signal return lead if the “ground” was located too close to one of the stage 2 neurons within the ~100 micron die. 1696Note also the 30 Hertz sinusoidal interference signal probably acquired through the one-half wave rectifier in the1697power supply of the test equipment. It appears throughout the data recording interval in all traces. 1698
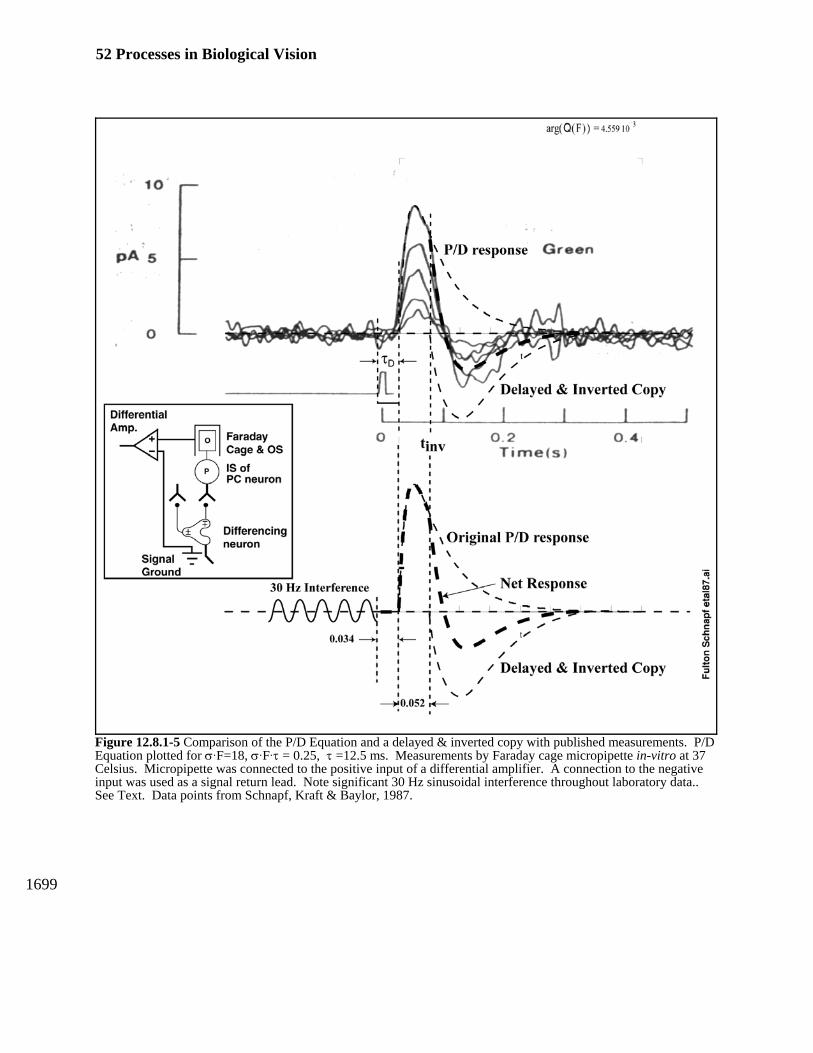
52 Processes in Biological Vision
Figure 12.8.1-5 Comparison of the P/D Equation and a delayed & inverted copy with published measurements. P/DEquation plotted for σAF=18, σAFAτ = 0.25, τ =12.5 ms. Measurements by Faraday cage micropipette in-vitro at 37Celsius. Micropipette was connected to the positive input of a differential amplifier. A connection to the negativeinput was used as a signal return lead. Note significant 30 Hz sinusoidal interference throughout laboratory data.. See Text. Data points from Schnapf, Kraft & Baylor, 1987.
1699
Primary Signal Processing 12- 53
37Baylor, D. Lamb, T. & Yau, K.-W. (1979) The membrane current of single rod outer segments. J. Physiol. vol.288, pp. 589-61138Penn, R. & Hagins, W. (1969) Signal transmission along retinal rods and the origin of the electroretinographic a-wave. Nature, vol. 223, pp. 201-20539Hagins, W. (1965) Electrical signs of information flow in photoreceptors. In Symposia on Quantitative Biology,vol. XXX Long Island, NY: Cold Spring Harbor Laboratory
The P/D Equation in the lower frame is plotted for an absorbed photon flux, σ@F = 18, a temperature of 37 Celsius1700and a time constant of 12.5 ms. σ@F = 18 appears to represent their stimulus of 2,542 photons/ micron2 quite well. 1701The P/D Equaton allows the precise state of adaptation, related to σ, to be calculated. The P/D Equation predicted1702an intrinsic time delay of τ = 46 ms. This is slightly longer than the 34 ms measured relative to zero on the graph of1703the original publication. The difference, 16 ms, may be impacted by the (unspecified) width, and quality of the pulse1704used. The initial delay, τD is measured from the beginning of the stimulus. The origin of the time scale is taken as1705the center of the pulse shown. Theoretically, it should be taken at the initial point of the stimulation.1706
In the top frame, the P/D function (upper thin dashed line) overlays the upper curve so well, it is difficult to see the1707features in the data curve. Both curves rise, peak and begin to descend along identical loci. At the time marked tinv,1708there is a distinct discontinuity in the measured curve. It is at this time that the delayed and inverted copy of the P/D1709response becomes significant. Becuase of the 50 Hz bandpass filtering and the filtering within the inner segment of1710the PC, the time course of the filtered and delayed copy is estimated. The instantaneous difference between the P/D1711response and the delayed copy is shown by the heavy dashed line through the data set. This line, when combined1712with the P/D Equation prior to tinv, traces the expected path for a noise free response to the stimulus as measured in1713the laboratory.1714
In the above figure, a case can be made for an α-wave and a β-wave as in ERG recordings. However, it is1715obvious that a choice must be made as to where the transition occurs; it can be taken as the start of the1716delayed representation at tinv or it can be taken at the point the net response crosses the horizontal axis. Using1717tinv as the transition point eliminates the amplitude of the delayed response from affecting the transition.1718
12.8.1.3 The peak Class C waveform at different positions along the outer segment1719
Figure 12.8.1-6 provides the results of the suction pipette technique developed by Baylor, et. al37. using the suction1720pipette as a Faraday Cage enclosing a portion of a photoreceptor cell. The procedure involves the isolation of a1721single in-vivo PC by sucking it into a Faraday cage. All of the current emanating from the PC along that part of the1722cell enclosed by the Faraday cage is collected and measured. The PC was from a toad, Bufo marinus. They speak of1723“red” rods (their terminology and emphasis) however all of their data exhibits a peak wavelength at 500 nm because1724of the use of illumination presented transverse to the axis of the outer segment. Test were performed at room1725temperature.1726
The data suggests that in the toad, the microtubules extend the length of the outer segment. The current collected in1727their experiments changed by 0.7 pA/micron for their average outer segment.1728
The peak current decayed from 26.8 pA on the first of two measurements to 22.4 pA on the second suggesting a lack1729of glutamate in their Ringer’s solution. They did not describe their Ringer’s solution which is normally glutamate-1730free. 1731
The current profile is quite similar to the voltage profile measured earlier by Penn & Hagins38 in bulk retinal1732membranes. This profile suggests that the IPM is a resistive medium but the simple electrical model developed by1733Hagins for the photoreceptor cell is too simple39. A more comprehensive model will be provided later in this work.1734
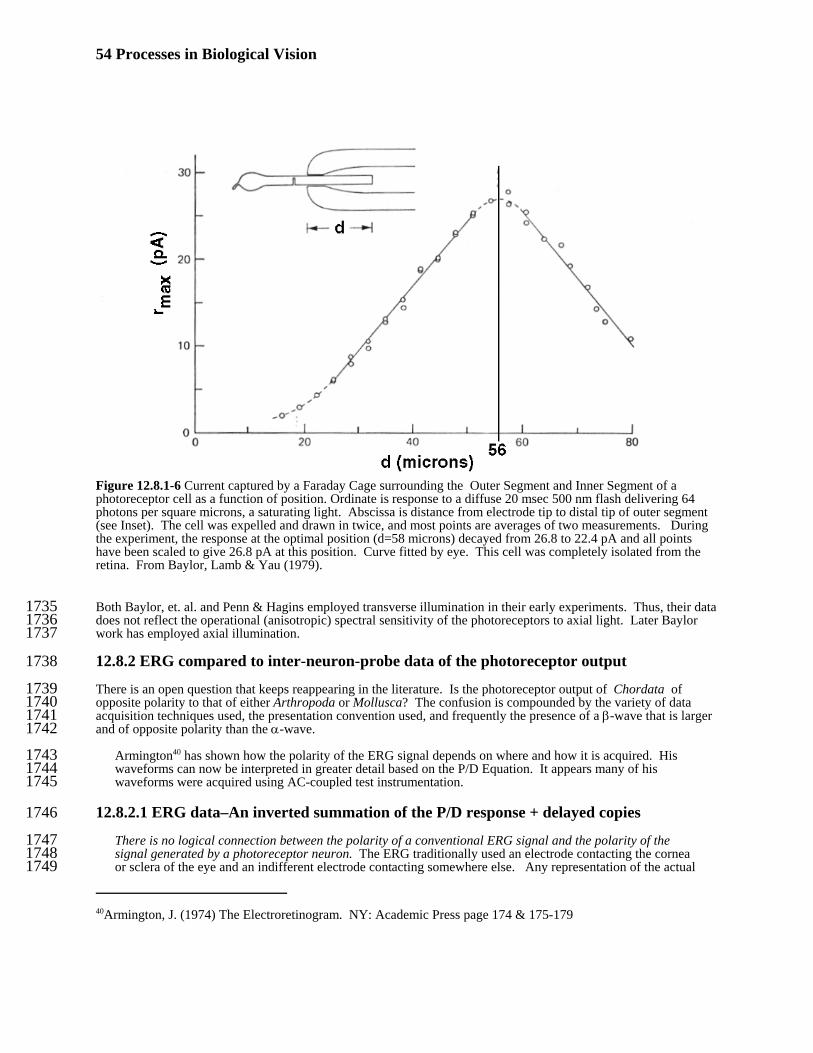
54 Processes in Biological Vision
40Armington, J. (1974) The Electroretinogram. NY: Academic Press page 174 & 175-179
Figure 12.8.1-6 Current captured by a Faraday Cage surrounding the Outer Segment and Inner Segment of aphotoreceptor cell as a function of position. Ordinate is response to a diffuse 20 msec 500 nm flash delivering 64photons per square microns, a saturating light. Abscissa is distance from electrode tip to distal tip of outer segment(see Inset). The cell was expelled and drawn in twice, and most points are averages of two measurements. Duringthe experiment, the response at the optimal position (d=58 microns) decayed from 26.8 to 22.4 pA and all pointshave been scaled to give 26.8 pA at this position. Curve fitted by eye. This cell was completely isolated from theretina. From Baylor, Lamb & Yau (1979).
Both Baylor, et. al. and Penn & Hagins employed transverse illumination in their early experiments. Thus, their data1735does not reflect the operational (anisotropic) spectral sensitivity of the photoreceptors to axial light. Later Baylor1736work has employed axial illumination.1737
12.8.2 ERG compared to inter-neuron-probe data of the photoreceptor output1738
There is an open question that keeps reappearing in the literature. Is the photoreceptor output of Chordata of1739opposite polarity to that of either Arthropoda or Mollusca? The confusion is compounded by the variety of data1740acquisition techniques used, the presentation convention used, and frequently the presence of a β-wave that is larger1741and of opposite polarity than the α-wave. 1742
Armington40 has shown how the polarity of the ERG signal depends on where and how it is acquired. His1743waveforms can now be interpreted in greater detail based on the P/D Equation. It appears many of his1744waveforms were acquired using AC-coupled test instrumentation.1745
12.8.2.1 ERG data–An inverted summation of the P/D response + delayed copies1746
There is no logical connection between the polarity of a conventional ERG signal and the polarity of the1747signal generated by a photoreceptor neuron. The ERG traditionally used an electrode contacting the cornea1748or sclera of the eye and an indifferent electrode contacting somewhere else. Any representation of the actual1749
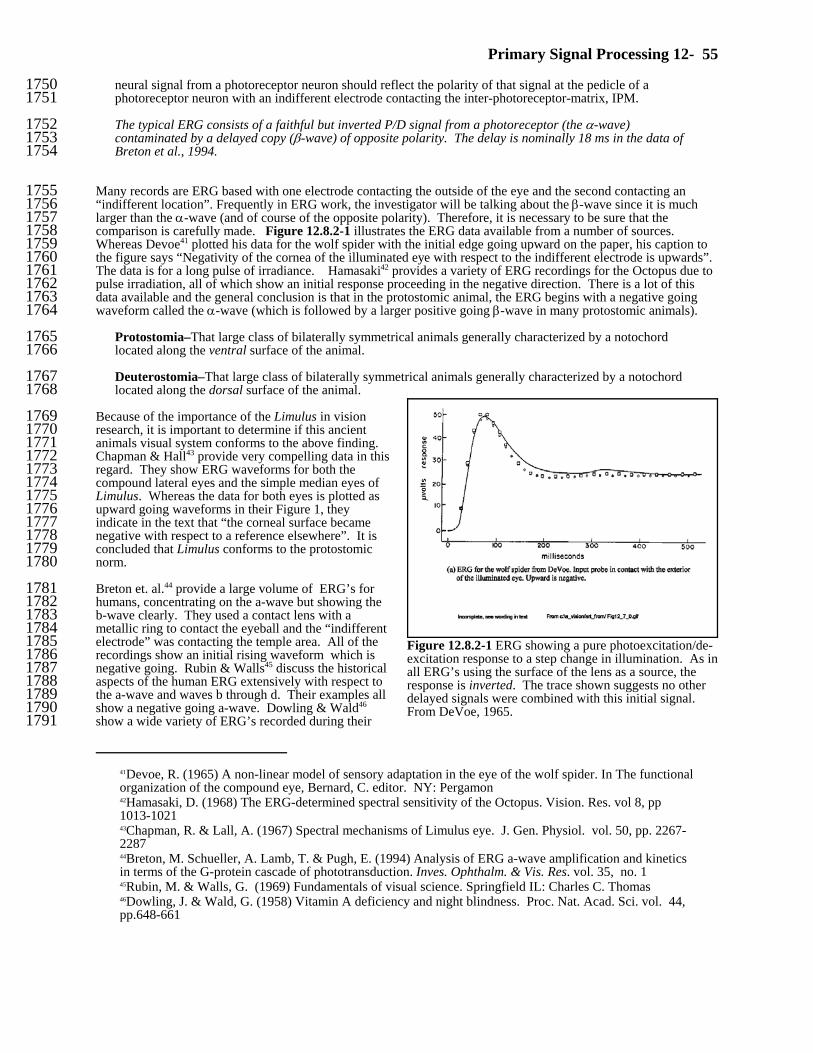
Primary Signal Processing 12- 55
41Devoe, R. (1965) A non-linear model of sensory adaptation in the eye of the wolf spider. In The functionalorganization of the compound eye, Bernard, C. editor. NY: Pergamon42Hamasaki, D. (1968) The ERG-determined spectral sensitivity of the Octopus. Vision. Res. vol 8, pp1013-102143Chapman, R. & Lall, A. (1967) Spectral mechanisms of Limulus eye. J. Gen. Physiol. vol. 50, pp. 2267-228744Breton, M. Schueller, A. Lamb, T. & Pugh, E. (1994) Analysis of ERG a-wave amplification and kineticsin terms of the G-protein cascade of phototransduction. Inves. Ophthalm. & Vis. Res. vol. 35, no. 145Rubin, M. & Walls, G. (1969) Fundamentals of visual science. Springfield IL: Charles C. Thomas46Dowling, J. & Wald, G. (1958) Vitamin A deficiency and night blindness. Proc. Nat. Acad. Sci. vol. 44,pp.648-661
Figure 12.8.2-1 ERG showing a pure photoexcitation/de-excitation response to a step change in illumination. As inall ERG’s using the surface of the lens as a source, theresponse is inverted. The trace shown suggests no otherdelayed signals were combined with this initial signal. From DeVoe, 1965.
neural signal from a photoreceptor neuron should reflect the polarity of that signal at the pedicle of a1750photoreceptor neuron with an indifferent electrode contacting the inter-photoreceptor-matrix, IPM.1751
The typical ERG consists of a faithful but inverted P/D signal from a photoreceptor (the α-wave)1752contaminated by a delayed copy (β-wave) of opposite polarity. The delay is nominally 18 ms in the data of1753Breton et al., 1994.1754
Many records are ERG based with one electrode contacting the outside of the eye and the second contacting an1755“indifferent location”. Frequently in ERG work, the investigator will be talking about the β-wave since it is much1756larger than the α-wave (and of course of the opposite polarity). Therefore, it is necessary to be sure that the1757comparison is carefully made. Figure 12.8.2-1 illustrates the ERG data available from a number of sources. 1758Whereas Devoe41 plotted his data for the wolf spider with the initial edge going upward on the paper, his caption to1759the figure says “Negativity of the cornea of the illuminated eye with respect to the indifferent electrode is upwards”. 1760The data is for a long pulse of irradiance. Hamasaki42 provides a variety of ERG recordings for the Octopus due to1761pulse irradiation, all of which show an initial response proceeding in the negative direction. There is a lot of this1762data available and the general conclusion is that in the protostomic animal, the ERG begins with a negative going1763waveform called the α-wave (which is followed by a larger positive going β-wave in many protostomic animals).1764
Protostomia–That large class of bilaterally symmetrical animals generally characterized by a notochord1765located along the ventral surface of the animal.1766
Deuterostomia–That large class of bilaterally symmetrical animals generally characterized by a notochord1767located along the dorsal surface of the animal.1768
Because of the importance of the Limulus in vision1769research, it is important to determine if this ancient1770animals visual system conforms to the above finding. 1771Chapman & Hall43 provide very compelling data in this1772regard. They show ERG waveforms for both the1773compound lateral eyes and the simple median eyes of1774Limulus. Whereas the data for both eyes is plotted as1775upward going waveforms in their Figure 1, they1776indicate in the text that “the corneal surface became1777negative with respect to a reference elsewhere”. It is1778concluded that Limulus conforms to the protostomic1779norm.1780
Breton et. al.44 provide a large volume of ERG’s for1781humans, concentrating on the a-wave but showing the1782b-wave clearly. They used a contact lens with a1783metallic ring to contact the eyeball and the “indifferent1784electrode” was contacting the temple area. All of the1785recordings show an initial rising waveform which is1786negative going. Rubin & Walls45 discuss the historical1787aspects of the human ERG extensively with respect to1788the a-wave and waves b through d. Their examples all1789show a negative going a-wave. Dowling & Wald461790show a wide variety of ERG’s recorded during their1791
56 Processes in Biological Vision
47Breton, M. Scheuller, A. Lamb, T. & Pugh, E. (1994) Analysis of ERG a-wave amplification and kineticsin terms of the G-protein cascade of phototransduction. Invest. Ophthalm. & Vision Sci. vol 35 #1 pg 295-30948Breton, M. Scheuller, A. Lamb, T. & Pugh, E. (1994) Analysis of ERG a-wave amplification and kineticsin terms of the G-protein cascade of phototransduction. Invest. Ophthalm. & Vision Sci. vol 35 #1 pg 295-309
investigations of vitamin A deficiency in rats. They take pains to show an enlarged view of one of the ERG’s to1792emphasize that the initial response is the negative going a-wave followed by a larger positive going b-wave. 1793
Smith & Lamb present a human ERG based on a well characterized experiment using only “blue” light (peak1794wavelength of 450 nm, Lee # 195, but no definition of the cutoff wavelength).1795
The literature clearly indicates that the leading edge of the a-wave captured by ERG is negative going in Chordata.1796
Based on the available data, with the input electrode contacting the eye surface, the ERG’s of Chordata and both1797Arthropoda and Mollusca begin with a negative going a-wave. The ERG a-wave is an inverted replica of the1798actual P/D response at the pedicle of the photoreceptor neurons.1799
12.8.2.1.1 The ERG based on Ganzfeld illumination of Breton et al.–19941800
Breton et. al.47 have provided a largely theoretical derivation of the response of the photoreceptors of the human eye1801without the benefit of any schematic of the eye or retina, or any consideration for the stage 2 signal processing1802incorporated into the human retina. They employ a modified contact lens to measure the electrical potential of the1803cornea with a reference electrode placed on the temple and a ground electrode on the forehead. The reference1804electrode suggests they were using a differential amplifier as the principle electrical input circuit. They used a1805Ganzfeld sphere to illuminate the entire field of view simultaneously as the result of a short flash introduced into the1806sphere.1807
Their null hypothesis is based on a chemical theory of vision. They outline a very complex series of chemical1808events occurring in succession following a short flash of light. The flash initiates a G-protein cascade of1809phototransduction that results in a neural signal (of unknown character). They assume their measured1810electrical response, a(t) in microvolts, is proportional to their calculated response R(t). R(t) is a normalized1811photoresponse, 1 – F(t) where F(t) is the cGMP-activated current as a fraction of resting ((dark) level, Φ,1812citing their equation 5.1813
They predict that each member of the family of responses, a(t), when normalized, should generate “a delayed1814gaussian function of time,” whose width from teff (at any criterions response amplitude) should be inversely1815proportional to the square root of the number of photoisomerizations produced by the brief flash. It appears1816their delayed gaussian is a Michelis Equation, also known as the Logistics Equation. 1817
Their equations predict a maximum rate of rise for their delayed gaussian at intensity Φ is given by the square1818root of ACΦ/e. They then note, “Experimentally, it is found that the maximum rate of rise of the a-wave does1819not increase indefinitely but saturates a high intensity, although such saturation is not predicted by our1820equations.”1821
The assumption that their measured voltage is generated by their G-protein cascade, and that the failure of their1822equations to predict a clear saturation in their data are enough to falsify their null hypothesis. But there is more,1823their model only applies to the initial rise in the phototransduction response. Their delayed gaussian function1824creates a highly improbable step response to an initial impulse, However, their collected data may be useful1825when related to The Electrolytic Theory of the Neuron.1826
The analysis of photo-transduction by Breton et al. based on a putative G-protein cascade can be ignored!1827
The recent work of Breton et. al.48 deserves special attention in light of the electrolytic model proposed here for1828several reasons.1829
First, with the P/D Equation of Section 7.2 shown to describe the total response measured at the OS as a function of1830irradiance, including both the rising response and the trailing response; it is possible to subtract an appropriate set of1831
Primary Signal Processing 12- 57
these waveforms from their figure 3 and thereby obtain a new set of waveforms related to the rest of the signaling1832system subsequent to this interface. Figure 12.8.2-2 shows their original Figure 3(A) and the same figure in frame B1833after the portion of the waveforms occurring after 30 ms have been removed.1834 1835Second, it should be noted that the data of Breton et. al. is not taken from a single photoreceptor in a suction pipette;1836the waveforms shown in Figure 12.8.2-2 are the cumulative waveforms obtained when a single flash of light is1837applied to virtually all of the photoreceptors in the eye simultaneously. To obtain a plot as they do that still1838faithfully follows the predicted response of a single photoreceptor, even after averaging the result of two to four1839flashes, strongly infers that all of the active photoreceptors of a specific spectral response in a given retina are1840basically identical under threshold conditions--identical in sensitivity, amplification, bias potentials, and axon1841lengths etc. 1842
Third, if the wavelength of the stimulating flash is not restricted to stimulating only one chromatic channel, the1843signals recorded by an ERG will contain highly confusing traces after about 20 ms; By proper choice of wavelength,1844494 nm or 572 nm, it may even be possible to cancel the modified a-wave traces added to those traces in the b*-1845wave interval defined below. Such cancellation calls for the suggested wavelengths by adhered to within ±1 nm.1846
- - - -1847
Looking at frame A of the Breton figure, the traces labeled the so-called a-wave are recognizable as an inverted set1848of waveforms described by the P/D Equation of this work, out to about 16 ms for the trace with the greatest slope1849and out to about 25 ms for the lowest slope trace. Each exhibits a delay after the initial flash, exhibit an initial slope1850that is a function of the intensity of the flash, reaches a peak, and then begins to return to the baseline. After those1851periods, the traces, consisting of the b-wave set, become more and more confused until they reach 45 ms. However,1852if the b-wave set of traces in frame A is truncated as shown in frame B, the confusion is reduced. Note the1853numbering of the a-wave traces and their counterpart numbering in the b*-wave interval. 1854
Armington (1974) has defined the late interval of the b-wave, the c-wave. In the process, he also attempted1855to show a single ERG that has features associated with both the photopic and scotopic regime. 1856
Trace 1 before 17 ms, appears to be a fairly conventional P/D Equation waveform. At about 17 ms, trace 1 now1857consists of the continuing return of the original trace 1 to which has been algebraically added and delayed, inverted1858and scaled version of the original trace 1. The delay is approximately 17 ms. The scaling is on the order of 62%. 1859There is an additional negative going segment added algebraically to trace 1 between 17 and 19 ms.1860
Trace 10 follows the same pattern. However, since it was caused by a much lower intensity initial flash, it begins1861after a more significant delay, reaches a lower maximum at 17 ms after a lower slope rise (all as predicted by the P/D1862Equation) At about 24 ms, it too encounters a significant change. At about 24 ms, trace 10 now consists of the1863continuing return of the original trace 10 to which has been algebraically added and delayed, inverted and scaled1864version of the original trace 10. Like in trace 1, there is an additional negative going segment added algebraically to1865trace 10 between 18 and 23 ms.1866
Traces 2 through 9 follow the same pattern within the limits set by trace 1 and trace 10.1867
Based on this analysis of the traces, the inverted traces were added to the original traces at between 17 and 19 ms1868from when they departed from the baseline initially. This is too long for the electronic signal generated by the P/D1869mechanism in the outer segments of the photoreceptor neuron to travel to the distribution amplifier. However, it is1870not too long for the signal to travel to the first Activa of the stage 2 signal processing neurons (with or without1871traveling through a bipolar neuron. See Section 13.1 for the morphology and Section 13.2 for the electrical1872schematic supporting these assertions. Both a horizontal neuron and an amercine neuron are exhibit differential1873inputs and are quite capable of generating the inverted copy of the initial waveform. 1874
The complexity of the potential routes through the stage 2 signal processing after 30 ms, as described in Section187513.2, indicates that ERG experiments will not likely be a profitable avenue for analyzing stage 2 signal processing.1876
- - -1877
The use of Ganzfeld illumination in ERG experiments and then trying to explain the unknowns relating to summing1878all of the neural paths to form a single trace following a flash stimulation appears awkward. An alternate would be1879to stimulate only the 1.2° diameter foveola in one set of experiments and then stimulate the fovea out to about 8°1880diameter while excluding the foveola. The resulting data should provide a more manageable and interpretable1881framework. The lengths of the axons of stage 1 photoreceptors in the foveola are known to be significantly longer1882than the axons of these same photoreceptors located in the fovea outside the foveola.1883
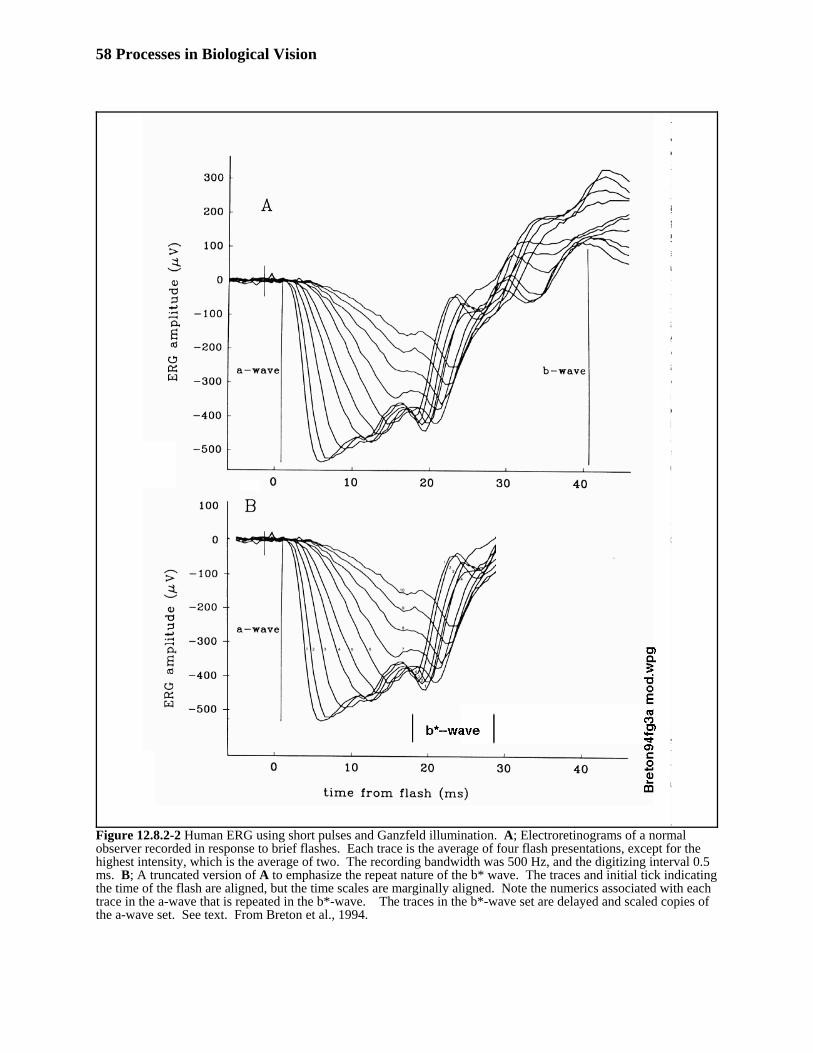
58 Processes in Biological Vision
Figure 12.8.2-2 Human ERG using short pulses and Ganzfeld illumination. A; Electroretinograms of a normalobserver recorded in response to brief flashes. Each trace is the average of four flash presentations, except for thehighest intensity, which is the average of two. The recording bandwidth was 500 Hz, and the digitizing interval 0.5ms. B; A truncated version of A to emphasize the repeat nature of the b* wave. The traces and initial tick indicatingthe time of the flash are aligned, but the time scales are marginally aligned. Note the numerics associated with eachtrace in the a-wave that is repeated in the b*-wave. The traces in the b*-wave set are delayed and scaled copies ofthe a-wave set. See text. From Breton et al., 1994.
Primary Signal Processing 12- 59
49Bornschein, H. & Gunter, R. (1964) the Double-flash Erg in Retinal Ischemia Vision Res vol 4, pp 423-432.50Schneeweis, D. & Schnapf, J. (1999) The photovoltage of macaque cone photoreceptors: adaptation, noise andkinetics J Neurosci vol. 19(4), pp 1203-1216
12.8.2.1.2 Double pulse ERG exploring rabbits–Bornschein, 19641884
Bornschein & Gunter49 provided useful test data that can be used to quantify the P/D Equation in that species and1885potentially disentangle the short term and longer term effects and parameters discussed in Section 12.7.1. Their 501886msec pulses of light were effective in emulating an impulse and resulting in a P/D impulse response. The voltage1887calibration in figure 3 indicates clearly that their probe was not equalized adequately for their purpose, and suggests1888their waveforms need to be corrected for droop in their test configuration.1889
12.8.2.2 Comparing probe data from Chordata and other Orders1890
When probe data is examined, the same confusion is found as in the ERG data. However, another variable1891associated with technique appears; during the period prior to the 1970’s, the probes used to measure waveforms in1892the retina were grossly larger than the individual cells. This led to confusion between extracellular and intracellular1893waveforms and also confusion as to whether the cell contacted was in the Outer Nuclear Layer (a true photoreceptor1894cell) or the Inner Nuclear Layer (most likely a horizontal or amercine cell). In more recent time, the probes have1895become much smaller and the technique of sucking a single photoreceptor cell into a pipette has raised the precision1896of the experiments immensely.1897
In 1962, Hagins provided some excellent data concerning the P/D process in squid for a temperature of 5-10C. He1898measured the potential of the inter-photoreceptor matrix at different locations relative to a very small illuminated1899area. The results were complimentary to the suction technique of Baylor at a later time. However, Hagins’ figure 81900used a very poor scaling technique. By ignoring the variable delay and variable slope of the P/D process as a1901function of illumination, and re-scaling the measured waveforms individually to align their rising phases, the figure1902suggests that lower illumination levels produce higher sustained output voltages. Re-plotting this data, or reviewing1903the original data shows that the squid photoreceptor cell employs the same P/D process as do chordates and other1904animals.1905
In 1983, Ottoson attempted to put the question of polarity at the electrical probe level to rest by publishing side by1906side figures attributed to an invertebrate and a vertebrate. Unfortunately, this presentation is not satisfying for a1907number of reasons;1908
+ he attributes the left hand figure to the horseshoe crab which can be confusing to the student1909since the waveform is not from the crab family of zoology but from Limulus, a member of a1910virtually extinct and separate family, Xiphosura polyphemus of Arthropoda, Chelicerata.1911
1912+ the left hand figure is not in the paper to which it is attributed. The right hand figure is a highly1913stylized version of the original, apparently for the purposes of a textbook.1914
1915+ the left hand figure has been redrawn from the original with the voltage scale changed implying1916that the pulses crossed the zero level. In the original, the baseline was labeled zero and there was1917no guarantee by the original author that the baseline was at -50 mV.1918
1919+ the figure on the left is the response to a finite duration pulse and on the right is the response to1920a shorter impulse.1921
1922+ the use of probe data from the unusual eccentric cell from Limulus to represent all invertebrates1923is open to question. It leaves the impression that the photoreceptor cell in Arthropoda generates1924pulses, a function usually found in the ganglion cells of Chordata. A better interpretation would1925be that the left figure represents a ganglion cell of the type found in Limulus.1926
1927+ other authors report electrotonic waveforms in eyes of Arthropoda distal to the eccentric cell1928which more likely relate to the invertebrate photoreceptor cell.1929 1930
Schneeweis & Schnapf provided good data on the photoreceptor responses of macaque monkey50. Some of their1931photoreceptor outer segments were illuminated axially. Others were illuminated transversely. They provided both1932voltage and current waveforms under patch clamp conditions. Their figure 1 stresses the difference in the1933
60 Processes in Biological Vision
51Shaw, S. (1968) Organization of the locust retina. in Invertebrate receptors. Carthy, J. & Newell, G.editors. London: The Zoological Society of London by Academic Press pg. 14952Trujillo-Cenoz, O. (1965) Some aspects of the structural organization of the arthropod eye. Cold SpringHarbor, NY:Cold Spring Harbor Biological Laboratory vol. 30, pp. 371-38253Meinertzhagen, J. (1977) Development of neuronal circuitry in the insect optic lob. in Soc. for Neurosci.Symp. II. (Cowan, W. & Ferrendilli, J. eds.) Bethesda, MD: Soc. for Neurosci., pp. 92-11954Laughlin, S. (1981) Neural principles in the visual system. In Handbook of Sensory Physiology, Vol.7/6B, (Autrum, H. ed.) NY: Springer-Verlag. pp. 133-280; pg 262
waveforms to be expected under these different conditions. In their discussion of figure 1, they appear unaware that1934the voltage waveform represents the derivative of the current waveform. Both waveforms show the same delay1935following the stimulus. However, the voltage waveform, being a derivative, necessarily reaches its peak before the1936current waveform. Saturation plays a major role in their current waveforms as a function of stimulus level. 1937Comparing their voltage waveforms of figure 2 with the current waveforms of figure 4 is quite instructive. Note1938their responses were recorded using amplifiers with passbands extending down to DC. They did not describe their1939criteria when they noted, “Responses of red and green cones were indistinguishable.” It would be expected that the1940responses would be different in amplitude for the same axial stimulus level in accordance with the absorption1941characteristic of each photoreceptor. For transverse stimulation, they might easily be indistinguishable. The1942sentence appears in a paragraph unrelated to their chromatic tests. 1943
12.8.2.3 Probe data for non-chordates1944
Looking at more general data for the protostomic group of animals, Shaw51 indicates the scope of the difficulty in1945specifying the nature of the initial response. His Figure 10 for the Locust, shows initially positive going waveforms1946from a retinula on the left and initially negative going waveforms from a lamina cell on the right; both responding to1947a pulse over roughly 5 orders of magnitude. The left hand figure shows definite signs of temporal band limiting by1948the impedances involved--and may not represent a true intracellular signal. His Figure 15 provides a similar dual1949picture for the same animal and without any obvious bandlimiting. Which structure corresponds to the1950photoreceptor cell of the deuterostomic eye?1951
Zuker in 1996 [[check his ref 21 before adding this reference. he was working in chemistry ]]shows initially1952downward going current waveforms in his Figure 3 for the “photoreceptor cells” of the compound eye of1953Drosophila. These waveforms are very clean and correspond in shape very well to the P/D Equation of this work. 1954However, in the text, he says “(Drosophila photoreceptors, like most invertebrates, depolarize as opposed to1955hyperpolarize in response to light)” Whether his drawings conform to the normal convention of negativity being1956indicated in the lower portion of a graph and his words are a cop-out OR Vice Versa is hard to confirm. He does not1957specifically indicate the polarity of his data.1958
Trujillo-Cenoz52 shows a different set of circumstances and uses different notation in examining the unicorneal1959(simple) eye of the spider, Lycosa, and the compound eyes of two flies, Sarcophaga and Lucilia. Meinertzhagen531960provides a further description of the visual pathways of the insect as does Laughlin54. 1961
By combining their notation and pictures, from both conventional and electron microscopes to develop a closer1962parallel to the deuterostomic eye. From his discussion, it is possible to draw up a correlation list;1963
Arthropoda Chordata1964
Rhabdom Retina1965Rhabdomere Outer Segment1966 Microvilli Discs1967Photoreceptor Cell (Retinula) Photoreceptor Cell (Inner Segment in this work)1968Monopolar Cell Bipolar Cell1969Eccentric Cell Horizontal (or Amercine) Cell1970Lamina1971Medulla (retinula #1-6) Magnocellular region (luminance signals)1972Medulla (other levels for retinula #7-8) parvocellular (chrominance signals)1973
This list can be expanded to include Mollusca and Insecta but the variety of eye configurations becomes1974unmanageable. 1975
Primary Signal Processing 12- 61
55Goldsmith, T. (1959) Wavelength discrimination in eye of honeybee. in Sensory Communication,Rosenblith, W. ed. Cambridge, MA: MIT Press pg. 366 (similarly in many other papers)
Some authors speak of a laminal cell in the protostomic eye, others appear to consider it part of the brain. The1976distinction is trivial for the purpose at hand. In several cases, they speak of laminal cells as of opposite polarity to1977more distal cells which would indicate they involve signal inversion as in the case of horizontal and amercine cells. 1978Whether inversion is involved brings us to the crucial question, is the output of the retinula cell of opposite polarity1979to that of the photoreceptor of the deuterostomic eye?1980
It is absolutely mandatory to go back to primary sources to answer this question. Many authors of secondary1981material, textbooks, reviews and articles in related disciplines, generally quote material at hand on this question--and1982without attribution. Furthermore, many of these secondary authors speak of a signal as depolarizing synonymously1983with a positive going leading edge. It is important to note that in all cases reviewed, there was no quiescent value1984given for the waveform that would indicate a negative resting potential.1985
Figure 12.8.2-3 from Laughlin, although quite obsolete, particularly with regard to the outer segments (his retinula1986and cone), can be instructive. With modification, it provides the answer to the question of polarity. Frames (b) and1987(c) are taken directly from his paper except for the dotted line in the upper probe of (b). As indicated below, it can1988be argued that the probe tip was actually extracellular when the waveforms were recorded. It is proposed here that1989the probe tip was extracellular in (b) and further, the waveform recorded from a retinula depends on where it is1990probed. The cartoon in frame (a) has been added to provide another perspective. In this case, the probe is shown1991near the proximal end of the retinula and the recorded waveform is shown with a negative going leading edge. There1992is significant laboratory work reported in the literature that says the output waveform from the insect eye is1993hyperpolarizing and the resting potential is given. Goldsmith55, working with the compound eye of the worker1994honeybee presents his data with the summarizing statement: “When light strikes the compound eye of a worker bee,1995an electrode in the superficial layers of the retinula records a monophasic, negative retinal action potential.” In the1996caption to Figure 4 of his paper, he specifies for both the compound eye and the ocelli: “an upward deflection1997signifies negativity of the electrode in the illuminated eye.” 1998
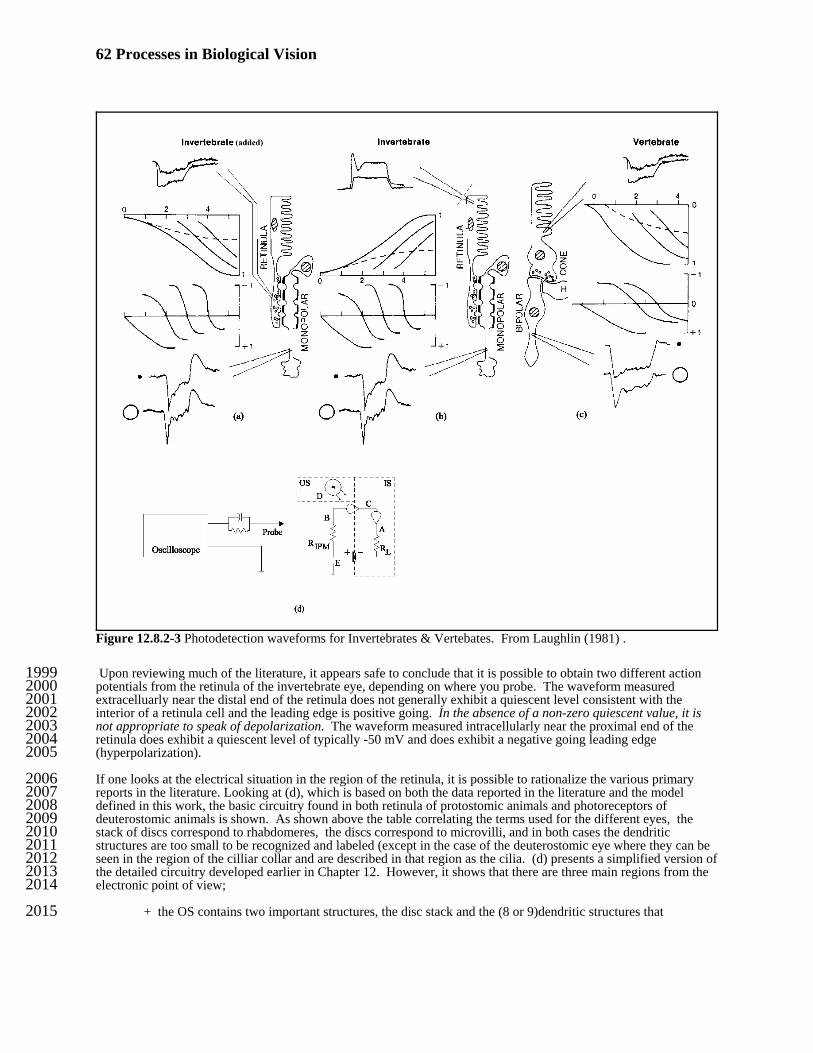
62 Processes in Biological Vision
Figure 12.8.2-3 Photodetection waveforms for Invertebrates & Vertebates. From Laughlin (1981) .
Upon reviewing much of the literature, it appears safe to conclude that it is possible to obtain two different action1999potentials from the retinula of the invertebrate eye, depending on where you probe. The waveform measured2000extracelluarly near the distal end of the retinula does not generally exhibit a quiescent level consistent with the2001interior of a retinula cell and the leading edge is positive going. In the absence of a non-zero quiescent value, it is2002not appropriate to speak of depolarization. The waveform measured intracellularly near the proximal end of the2003retinula does exhibit a quiescent level of typically -50 mV and does exhibit a negative going leading edge2004(hyperpolarization).2005
If one looks at the electrical situation in the region of the retinula, it is possible to rationalize the various primary2006reports in the literature. Looking at (d), which is based on both the data reported in the literature and the model2007defined in this work, the basic circuitry found in both retinula of protostomic animals and photoreceptors of2008deuterostomic animals is shown. As shown above the table correlating the terms used for the different eyes, the2009stack of discs correspond to rhabdomeres, the discs correspond to microvilli, and in both cases the dendritic2010structures are too small to be recognized and labeled (except in the case of the deuterostomic eye where they can be2011seen in the region of the cilliar collar and are described in that region as the cilia. (d) presents a simplified version of2012the detailed circuitry developed earlier in Chapter 12. However, it shows that there are three main regions from the2013electronic point of view; 2014
+ the OS contains two important structures, the disc stack and the (8 or 9)dendritic structures that2015
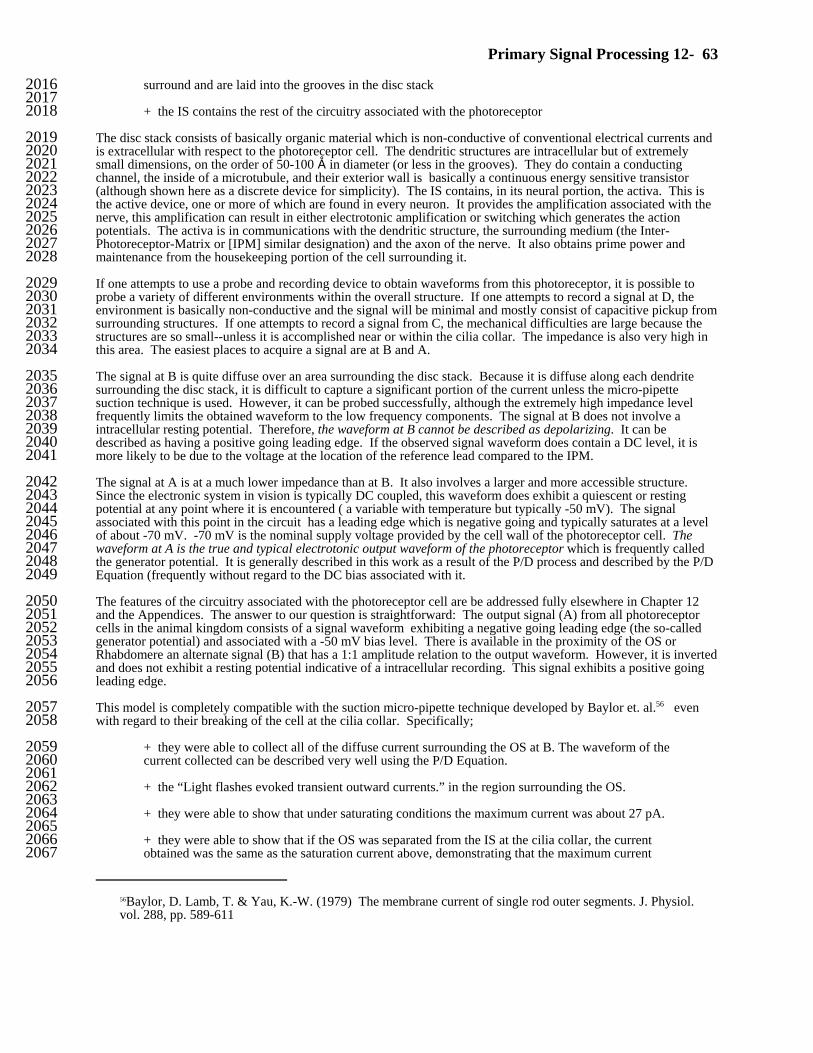
Primary Signal Processing 12- 63
56Baylor, D. Lamb, T. & Yau, K.-W. (1979) The membrane current of single rod outer segments. J. Physiol.vol. 288, pp. 589-611
surround and are laid into the grooves in the disc stack20162017
+ the IS contains the rest of the circuitry associated with the photoreceptor2018
The disc stack consists of basically organic material which is non-conductive of conventional electrical currents and2019is extracellular with respect to the photoreceptor cell. The dendritic structures are intracellular but of extremely2020small dimensions, on the order of 50-100 D in diameter (or less in the grooves). They do contain a conducting2021channel, the inside of a microtubule, and their exterior wall is basically a continuous energy sensitive transistor2022(although shown here as a discrete device for simplicity). The IS contains, in its neural portion, the activa. This is2023the active device, one or more of which are found in every neuron. It provides the amplification associated with the2024nerve, this amplification can result in either electrotonic amplification or switching which generates the action2025potentials. The activa is in communications with the dendritic structure, the surrounding medium (the Inter-2026Photoreceptor-Matrix or [IPM] similar designation) and the axon of the nerve. It also obtains prime power and2027maintenance from the housekeeping portion of the cell surrounding it.2028
If one attempts to use a probe and recording device to obtain waveforms from this photoreceptor, it is possible to2029probe a variety of different environments within the overall structure. If one attempts to record a signal at D, the2030environment is basically non-conductive and the signal will be minimal and mostly consist of capacitive pickup from2031surrounding structures. If one attempts to record a signal from C, the mechanical difficulties are large because the2032structures are so small--unless it is accomplished near or within the cilia collar. The impedance is also very high in2033this area. The easiest places to acquire a signal are at B and A. 2034
The signal at B is quite diffuse over an area surrounding the disc stack. Because it is diffuse along each dendrite2035surrounding the disc stack, it is difficult to capture a significant portion of the current unless the micro-pipette2036suction technique is used. However, it can be probed successfully, although the extremely high impedance level2037frequently limits the obtained waveform to the low frequency components. The signal at B does not involve a2038intracellular resting potential. Therefore, the waveform at B cannot be described as depolarizing. It can be2039described as having a positive going leading edge. If the observed signal waveform does contain a DC level, it is2040more likely to be due to the voltage at the location of the reference lead compared to the IPM.2041
The signal at A is at a much lower impedance than at B. It also involves a larger and more accessible structure. 2042Since the electronic system in vision is typically DC coupled, this waveform does exhibit a quiescent or resting2043potential at any point where it is encountered ( a variable with temperature but typically -50 mV). The signal2044associated with this point in the circuit has a leading edge which is negative going and typically saturates at a level2045of about -70 mV. -70 mV is the nominal supply voltage provided by the cell wall of the photoreceptor cell. The2046waveform at A is the true and typical electrotonic output waveform of the photoreceptor which is frequently called2047the generator potential. It is generally described in this work as a result of the P/D process and described by the P/D2048Equation (frequently without regard to the DC bias associated with it.2049
The features of the circuitry associated with the photoreceptor cell are be addressed fully elsewhere in Chapter 122050and the Appendices. The answer to our question is straightforward: The output signal (A) from all photoreceptor2051cells in the animal kingdom consists of a signal waveform exhibiting a negative going leading edge (the so-called2052generator potential) and associated with a -50 mV bias level. There is available in the proximity of the OS or2053Rhabdomere an alternate signal (B) that has a 1:1 amplitude relation to the output waveform. However, it is inverted2054and does not exhibit a resting potential indicative of a intracellular recording. This signal exhibits a positive going2055leading edge.2056
This model is completely compatible with the suction micro-pipette technique developed by Baylor et. al.56 even2057with regard to their breaking of the cell at the cilia collar. Specifically;2058
+ they were able to collect all of the diffuse current surrounding the OS at B. The waveform of the 2059current collected can be described very well using the P/D Equation. 2060
2061+ the “Light flashes evoked transient outward currents.” in the region surrounding the OS.2062
2063+ they were able to show that under saturating conditions the maximum current was about 27 pA.2064
2065+ they were able to show that if the OS was separated from the IS at the cilia collar, the current2066obtained was the same as the saturation current above, demonstrating that the maximum current2067

64 Processes in Biological Vision
57Davson, H. ( 1990 ) Physiology of the eye, 5th ed. NY: Pergamon Press pg. 28058Behrens, & Wulff (1965)
59Hagins, W. (1965) Electrical signs of information flow in photoreceptors In — Sensory Receptors. Cold SpringHarbor Laboratory on Quantitative Biology vol XXX, pp 403-418
available was given by the fraction, ED/RD, in the model (by collecting essentially all of the current2068at C, the impedance of the IPM was not involved).2069
2070+ they also showed that the peak current went up in a linear manner as more of the OS was moved2071into the micro-pipette, indicating the combined optical absorption (photoexcitation) and de-2072excitation profile was quite uniform over the length of the OS.2073
2074+ they showed that the current profile decreased uniformly with distance after the cilia collar was2075moved into the micro-pipette--indicating that the current passing through the battery ED and the2076resistor RD was obtained over a continuous region of the IS cell wall.2077
They also calculated the current emanating from a one micron circular ring of the OS of 0.75 pA/:. Thus a probe in2078this area with a 1.0 : collecting area would only pick up a small fraction of this total current around the ring. This is2079why the measurements at point B are usually low pass limited. The impedance is extremely high and the current is2080extremely low. The overall probe circuit exhibits a low pass characteristic under these conditions. The impedance2081of the IPM in series with the capacitance shunting the probe contact (or compensation circuit) limits the frequency2082sensed to below2083 1/(C * RIPM) hertz. It is difficult to observe system noise under these conditions and the reported waveforms are2084usually smooth as in Laughlin’s figure for the waveform at B in the invertebrate.2085
In this case, as in the ERG case, Limulus represents a special case. Davson57 indicates that the retinula cells each2086have a fiber emanating from them but these fibers do not exhibit action potentials and they may or may not be nerve2087fibers in fact. He indicates that the eccentric cell may be regarded as the true neural pathway from the ommatidium2088and that the structure passing up through the central axle of the rhabdom is the dendrite of this eccentric cell. The2089axon of this eccentric cell does exhibit action potential impulses. {His words clearly reflect the time period of their2090original preparation, when electrotonic signals were not recognized as true signal waveforms in the retina.} No2091lamina cell is indicated in his discussion of the Limulus. Behrens & Wulff58 obtained electrical signals from both2092retinula and eccentric cells in Limulus. [[ need this paper ]] They report a electrotonic wave with small spikes2093associated with the retinula cells and a slow wave with large spikes associated with the eccentric cell. This would2094appear to define the retinula output as that of the photoreceptor and the eccentric cell as a (nearly) conventional2095ganglion cell. If this is correct, the initial output of the photoreceptor cell upon irradiance in Limulus is { +/- 2096}going .2097
The data related to the electrical response of the photoreceptors in deuterostomic animals is immense and quite2098compelling, especially the data of the last 20 years. It invariably shows an initially negative going voltage response2099at the output of the photoreceptor cell; and this applies to both warm blooded and cold blooded members of this2100group. See any of the papers in this time period from Hodgkin, Baylor, Fuortes, Lamb, Etc.2101
12.8.3 Earliest descriptions leading to the P/D Equation of photoreceptors–Hagens, 19652102
Hagins59 provided carefully calibrated transient response of squid photoreceptor outer segments using the2103instrumentation of the period. Figure 12.8.3-1 shows his data. The instrumentation was not adequate to capture the2104actual rise times of these traces or the initial delay predicted by the P/D Equation, and actually measured in2105subsequent experiments. He also made a number of unsubstantiated assumptions. 2106
Primary Signal Processing 12- 65
1. He assumed the rise time of the responses were all the same regardless of stimulus intensity.21072. He assumed the delay of the responses after stimulation were the same regardless of stimulus intensity.2108
3. He assumed that the rising portion of the response never overshot the mid pulse response.21094. He chose to normalize the waveforms relative to their peak overshoot.2110
However, an experienced observer, discerns the features introduced by the P/D Equation in Hagen’s plots.2111
12.9 Summary2112
The success of the P/D equation and the overall model of the photodetection function of the photoreceptor cell in2113describing the measured performance of the eye in a variety of animals is remarkable. It’s ability to predict2114completely the details of the test data of Baylor, Torre and Breton demonstrates its correctness. More will be said2115concerning the data of Breton in the next chapter. Briefly, this model allows one to explain the difference between2116the a-wave and the b-wave of the ERG. As will be seen later, it does even more than this; it suggests and helps2117prove that the β-wave consists of more than one signal--quite possibly an early β-wave related to the circuitry in the2118
Figure 12.8.3-1 Transient response of dark adapted squid photoreceptors to 500 nm light. The curves requiresignificant interpretation. The individual responses have been normalized to show the similar rising characteristicswhen they are significantly different. The curves have also been normalized as to start time when in fact the initialdelay after stimulation is an inverse function of the stimulus intensity. See text. From Hagins, 1965.

66 Processes in Biological Vision
Inner Nuclear Layer (INL) and a later β-wave related to subsequent circuitry; which may also be in the INL or may2119consist of the low passed signals related to the ganglion cells in the Outer Nuclear Layer (ONL). 2120
This success clearly indicates it ranks ahead of other models of the photoreception process. It indicates the “photo-2121electronic” detection theory is far superior and more accurate than the “photo-isomerization” theory in describing the2122vision process. Specifically, it is compatible with the excitation/de-excitation process restoring the individual2123chromophoric molecules to their original state in less than 1 milli-second under most radiance conditions and2124requires no transport of a molecular species to the RPE for reconstitution. It also eliminates any need for “dark2125processes” as usually inferred to satisfy the photo-isomerization theory.2126
The model does not require the physical transport of any ions through a cell wall surrounding the discs; in fact, it2127does not require any cell wall to surround the discs. 2128
The model does not require any flow of chromophoric molecules in or out of the OS except for normal growth at the2129end near the IS. For those that do flow into the discs, there is no need to pass through a cell membrane to reach the2130discs; and it appears there may be physical openings in the collar of the IS to facilitate the flow of chromophoric2131molecules in that area.2132
The explanation of the “hyperpolarization” of the photoreceptor cell due to photoexcitation is completely explained2133by this theory. The output signal consists of a quantity of electrons which is numerically related to the photon flux2134and there is no inversion in the neural amplifiers of the photoreceptor neuron. 2135
The description of a biological transistor as described above may be a bit difficult for some biologists to accept, and2136its detailed elucidation may require considerable analysis. However, the structures available in a biological2137membrane are very comparable with the “back to back diode” description of a semiconductor transistor of a non-2138biological type. 2139
Employment of an ion transport related mechanism to generate a current in a biological transistor located on the OS2140side of the OS/IS interface would require transport of ions from the IS to the OS (or the dendritic structure) in large2141numbers, at high rates and high ion current densities to accommodate a 30 pA current within a very small diameter2142structure. This appears unlikely at first glance. It is more likely that the walls of the dendritic structure (possibly in2143conjunction with the membranes of the discs) are acting as a biological transistor based entirely on electron charge2144transport--the only ionic motion would be that of a standing wave type, as in ocean waves.2145
It would be extremely interesting to see the results of Baylor’s and Lamb’s work repeated for light in the vicinity of 21460.64 microns. Such data would determine the characteristic of the “exciton” to electron transducer if it is in fact2147related to the energy of the incident photons. [See Kraft, et. al. 1990]2148
It should be noted that so far, no distinction has been made in this chapter between the different types of2149photoreceptors. Whether they were sensitive in the long, medium, short or UV spectrum has not been of concern. 2150Up to this point, they all operate alike. Each photoreceptor operates in a quantum-mechanical mode and can detect2151and report the absorption of a single photon at a signal level that can be processed by the follow-on signaling stages. 2152Their instantaneous dynamic range is logarithmic and controlled by the input characteristic of the dendritic tissue of2153the photoreceptor neuron.2154
The adaptation mechanism is virtually instantaneous with rising stimulation but is slow to recover after the cessation2155of stimulation. The more important property is the ability of the adaptation mechanism to maintain a constant signal2156output from the OS to the IS by maintaining the product of the stimulus intensity and the absorption coefficient a2157constant over many orders of magnitude of stimulation intensity.2158
Primary Signal Processing 12- 67
TABLE OF CONTENTS 7/4/192159
12 Primary Signal Processing--Signal Detection . . . . . . . . . . . . . . . . . . . . . . . . . . . . . . . . . . . . . . . . . . . . . . . . . . . . 3216012.1 Introduction . . . . . . . . . . . . . . . . . . . . . . . . . . . . . . . . . . . . . . . . . . . . . . . . . . . . . . . . . . . . . . . . . . . . . 32161
12.1.1 Glossary . . . . . . . . . . . . . . . . . . . . . . . . . . . . . . . . . . . . . . . . . . . . . . . . . . . . . . . . . . . . . . . 3216212.1.2 Background . . . . . . . . . . . . . . . . . . . . . . . . . . . . . . . . . . . . . . . . . . . . . . . . . . . . . . . . . . . . . 42163
12.1.2.1 Relative Physics . . . . . . . . . . . . . . . . . . . . . . . . . . . . . . . . . . . . . . . . . . . . . . . . 4216412.1.2.2 Common wisdom of the past . . . . . . . . . . . . . . . . . . . . . . . . . . . . . . . . . . . . . . . 5216512.1.2.3 Framework of this theory . . . . . . . . . . . . . . . . . . . . . . . . . . . . . . . . . . . . . . . . . . 62166
12.1.2.3.1 Architecture & integration of the visual system . . . . . . . . . . . . . . . . 7216712.1.3 Definition of the cytological situation . . . . . . . . . . . . . . . . . . . . . . . . . . . . . . . . . . . . . . . . 7216812.1.4 Derivation of the Circuit Analog . . . . . . . . . . . . . . . . . . . . . . . . . . . . . . . . . . . . . . . . . . . . 8216912.1.5 Falsification of “rods & cones” concept . . . . . . . . . . . . . . . . . . . . . . . . . . . . . . . . . . . . . . 102170
12.2 The physiological character of the stage 1 photoreceptors . . . . . . . . . . . . . . . . . . . . . . . . . . . . . . . . . 10217112.2.1 The cytological character of a generic neuron . . . . . . . . . . . . . . . . . . . . . . . . . . . . . . . . . 10217212.2.2 The morphological character of a photoreceptor neuron . . . . . . . . . . . . . . . . . . . . . . . . . 112173
12.3 Mechanism of the photodetection process . . . . . . . . . . . . . . . . . . . . . . . . . . . . . . . . . . . . . . . . . . . . . 13217412.3.1 Electronic Characteristics of the Chromophores . . . . . . . . . . . . . . . . . . . . . . . . . . . . . . . . 132175
12.3.1.1 The Photo-Electron Excitation Process . . . . . . . . . . . . . . . . . . . . . . . . . . . . . . 13217612.3.1.2 The Electron-Neural De-excitation Process . . . . . . . . . . . . . . . . . . . . . . . . . . . 152177
12.4 Earlier conception of the amplification process in neurons . . . . . . . . . . . . . . . . . . . . . . . . . . . . . . . . 15217812.5 The Complete Stage 1 Photo Detection Process . . . . . . . . . . . . . . . . . . . . . . . . . . . . . . . . . . . . . . . . 162179
12.5.1 The Transduction Block in vision . . . . . . . . . . . . . . . . . . . . . . . . . . . . . . . . . . . . . . . . . . . 20218012.5.1.1 Fundamentals of biological transduction in vision . . . . . . . . . . . . . . . . . . . . . 20218112.5.1.2 Fundamental quantum-mechanics of biological transduction in vision . . . . . . 212182
12.5.1.2.1 Quiescent operation . . . . . . . . . . . . . . . . . . . . . . . . . . . . . . . . . . . . 22218312.5.1.2.2 Operation with illumination . . . . . . . . . . . . . . . . . . . . . . . . . . . . . 22218412.5.1.2.3 Transient operation . . . . . . . . . . . . . . . . . . . . . . . . . . . . . . . . . . . . 232185
12.5.1.3 The quasi-static transduction process . . . . . . . . . . . . . . . . . . . . . . . . . . . . . . . 23218612.5.2 The Transduction and Translation blocks of the photoreceptor neuron . . . . . . . . . . . . . . 262187
12.5.2.1 Histology and electrical schematic of photoreceptor neuron outer segment . . 26218812.5.2.1.1 Histology of the outer segment . . . . . . . . . . . . . . . . . . . . . . . . . . . . 26218912.5.2.1.2 Schematic of the outer segment . . . . . . . . . . . . . . . . . . . . . . . . . . . 282190
12.5.2.2 Polarity, signal amplitude & Impedance of the photoreceptor amplifiers . . . . 30219112.5.2.3 The photoreceptor neuron from a different physiological perspective . . . . . . 30219212.5.2.4 The special case of the long wavelength visual channel(s)–a 2-exciton process2193
. . . . . . . . . . . . . . . . . . . . . . . . . . . . . . . . . . . . . . . . . . . . . . . . . . . . . . . . . . . . 32219412.5.2.5 The general case of multiple spectral channels affected by temperature–a 2-2195
exciton process . . . . . . . . . . . . . . . . . . . . . . . . . . . . . . . . . . . . . . . . . . . . . . . . 35219612.5.2.5.1 The UV & mid-wavelength visual channels in an exotherm–Limulus2197
. . . . . . . . . . . . . . . . . . . . . . . . . . . . . . . . . . . . . . . . . . . . . . . . . . . . . 35219812.5.2.5.2 The proposed band gap of liquid-crystalline water versus temperature2199
. . . . . . . . . . . . . . . . . . . . . . . . . . . . . . . . . . . . . . . . . . . . . . . . . . . . . 36220012.5.2.5.3 The impact on visual discrimination of the 2-exciton mode of2201
photodetection . . . . . . . . . . . . . . . . . . . . . . . . . . . . . . . . . . . . . . . . . . 36220212.5.2.5.4 The impact on the P/D Equation of the 2-exciton mode of2203
photodetection . . . . . . . . . . . . . . . . . . . . . . . . . . . . . . . . . . . . . . . . . . 36220412.5.2.5.5 Potential impact on the sensory modalities of exothermic animals2205
. . . . . . . . . . . . . . . . . . . . . . . . . . . . . . . . . . . . . . . . . . . . . . . . . . . . . 37220612.5.3 CRUCIAL MECHANISM: Adaptation of the outer segment–the phenomenon of bleaching2207
. . . . . . . . . . . . . . . . . . . . . . . . . . . . . . . . . . . . . . . . . . . . . . . . . . . . . . . . . . . . . . . . . . . . 38220812.5.4 Effect of dis-assembly in the laboratory . . . . . . . . . . . . . . . . . . . . . . . . . . . . . . . . . . . . . 392209
12.5.4.1 Probing . . . . . . . . . . . . . . . . . . . . . . . . . . . . . . . . . . . . . . . . . . . . . . . . . . . . . . 39221012.5.4.2 Dissection . . . . . . . . . . . . . . . . . . . . . . . . . . . . . . . . . . . . . . . . . . . . . . . . . . . . 40221112.5.4.3 Extraction of the chromophores of vision–the Rhodonines . . . . . . . . . . . . . . . 402212
12.6 (Reserved) . . . . . . . . . . . . . . . . . . . . . . . . . . . . . . . . . . . . . . . . . . . . . . . . . . . . . . . . . . . . . . . . . . . . . 41221312.7 The Transfer Functions of Stage 1–Based on the P/D Equation . . . . . . . . . . . . . . . . . . . . . . . . . . . . 412214
12.7.1 The Large Signal Model . . . . . . . . . . . . . . . . . . . . . . . . . . . . . . . . . . . . . . . . . . . . . . . . . 41221512.7.1.1 Short term large signal model– milliseconds duration . . . . . . . . . . . . . . . . . . . 43221612.7.1.2 Longer term large signal model– seconds or longer duration . . . . . . . . . . . . . 432217
12.7.2 The Small Signal Model . . . . . . . . . . . . . . . . . . . . . . . . . . . . . . . . . . . . . . . . . . . . . . . . . 44221812.7.4 The transient state transfer function EMPTY . . . . . . . . . . . . . . . . . . . . . . . . . . . . . . . . . . 442219
12.8 Comparison with data in the Literature . . . . . . . . . . . . . . . . . . . . . . . . . . . . . . . . . . . . . . . . . . . . . . . 452220
68 Processes in Biological Vision
12.8.1 The outer segment and the suction pipette technique . . . . . . . . . . . . . . . . . . . . . . . . . . . . 45222112.8.1.1 The Class C voltage waveform at the outer segment . . . . . . . . . . . . . 46222212.8.1.2 The Class C current waveform at the outer segment . . . . . . . . . . . . . 48222312.8.1.3 The Response of the OS according to Schnapf et al.–Inadequate2224
protocol . . . . . . . . . . . . . . . . . . . . . . . . . . . . . . . . . . . . . . . . . . . . . . . 51222512.8.1.3 The peak Class C waveform at different positions along the outer2226
segment . . . . . . . . . . . . . . . . . . . . . . . . . . . . . . . . . . . . . . . . . . . . . . . 53222712.8.2 ERG compared to inter-neuron-probe data of the photoreceptor output . . . . . . . . . . . . . . 542228
12.8.2.1 ERG data–An inverted summation of the P/D response + delayed copies . . . 54222912.8.2.1.1 The ERG based on Ganzfeld illumination of Breton et al.–1994 . . 56223012.8.2.1.2 Double pulse ERG exploring rabbits–Bornschein, 1964 . . . . . . . . 592231
12.8.2.2 Comparing probe data from Chordata and other Orders . . . . . . . . . . . . . . . . . 59223212.8.2.3 Probe data for non-chordates . . . . . . . . . . . . . . . . . . . . . . . . . . . . . . . . . . . . . 602233
12.8.3 Earliest descriptions leading to the P/D Equation of photoreceptors–Hagens, 1965 . . . . 64223412.9 Summary . . . . . . . . . . . . . . . . . . . . . . . . . . . . . . . . . . . . . . . . . . . . . . . . . . . . . . . . . . . . . . . . . . . . . . 652235
Primary Signal Processing 12- 69
Chapter 12 List of Figures 7/4/192236
Figure 12.1.4-1 Block Diagram of Outer Segment and the translation function . . . . . . . . . . . . . . . . . . . . . . . . . . . . 92237Figure 12.1.4-2 The fundamental electrolytic circuit of the photoreceptor cell . . . . . . . . . . . . . . . . . . . . . . . . . . . 102238Figure 12.2.1-1 A more fully elaborated cytological schematic of a fundamental neuron . . . . . . . . . . . . . . . . . . . 112239Figure 12.2.1-2 An exploded histological view of the baseline photoreceptor cell . . . . . . . . . . . . . . . . . . . . . . . . . 122240Figure 12.5.1-1 Nomenclature, block diagram and overall circuit for Stage 1 . . . . . . . . . . . . . . . . . . . . . . . . . . . . 182241Figure 12.5.1-2 The quantum mechanical interface ADD . . . . . . . . . . . . . . . . . . . . . . . . . . . . . . . . . . . . . . . . . . . . 222242Figure 12.5.1-3 The quasi-static transduction transfer function . . . . . . . . . . . . . . . . . . . . . . . . . . . . . . . . . . . . . . . 252243Figure 12.5.2-1 Graphic details of the photo-detection mechanism of stage 1 . . . . . . . . . . . . . . . . . . . . . . . . . . . . 272244Figure 12.5.2-2 Alternate quantum-electrical schematic of the stage 1 photoreceptor neuron . . . . . . . . . . . . . . . . 312245Figure 12.5.2-3 Conceptual probabilities of translation from exciton to free electron . . . . . . . . . . . . . . . . . . . . . . 332246Figure 12.5.2-4 Data suggesting a 2-exciton mechanism in the Limulus . . . . . . . . . . . . . . . . . . . . . . . . . . . . . . . . 352247Figure 12.5.2-5 Estimate: Band gap of liquid crystalline water . . . . . . . . . . . . . . . . . . . . . . . . . . . . . . . . . . . . . . . 362248Figure 12.5.3-1 CRUCIAL CONCEPT: Adaptation & the constant signal output of discs of photoreceptors . . . 382249Figure 12.7.1-1 Proposed template for the perceived visual brightness as a function of luminance intensity in2250
humans ADD . . . . . . . . . . . . . . . . . . . . . . . . . . . . . . . . . . . . . . . . . . . . . . . . . . . . . . . . . . . . . . . . . . . . . . . 422251Figure 12.8.1-1 Waveforms associated with the photoreceptor cell . . . . . . . . . . . . . . . . . . . . . . . . . . . . . . . . . . . . 452252Figure 12.8.1-2 Comparison of P/D Equation with the potential measured by probing. . . . . . . . . . . . . . . . . . . . . 472253Figure 12.8.1-3 Comparison of P/D Equation with current collected by a Faraday cage . . . . . . . . . . . . . . . . . . . . 482254Figure 12.8.1-4 The Class C current waveform using suction pipette techniques . . . . . . . . . . . . . . . . . . . . . . . . . . 502255Figure 12.8.1-5 Comparison of the P/D Equation and a delayed & inverted copy with published measurements . 522256Figure 12.8.1-6 Current captured by a Faraday Cage surrounding the Outer Segment . . . . . . . . . . . . . . . . . . . . . 542257Figure 12.8.2-1 ERG showing a pure photoexcitation/de-excitation response to a step . . . . . . . . . . . . . . . . . . . . . 552258Figure 12.8.2-2 Human ERG using short pulses and Ganzfeld illumination. . . . . . . . . . . . . . . . . . . . . . . . . . . . . . 582259Figure 12.8.2-3 Photodetection waveforms for Invertebrates & Vertebates. From Laughlin (1981) . . . . . . . . . . . 622260Figure 12.8.3-1 Transient response of dark adapted squid photoreceptors to 500 nm light . . . . . . . . . . . . . . . . . . 652261
70 Processes in Biological Vision
2262SUBJECT INDEX (using advanced indexing option)2263
1010 . . . . . . . . . . . . . . . . . . . . . . . . . . . . . . . . . . . . . . . . . . . . . . . . . . . . . . . . . . . . . . . . . . . . . . . . . . . . . . . . . . . . . 2422642-exciton . . . . . . . . . . . . . . . . . . . . . . . . . . . . . . . . . . . . . . . . . . . . . . . . . . . . . . . . . . . . . . . . . . . . . . . . . . . . . . 1, 32-3722652-photon . . . . . . . . . . . . . . . . . . . . . . . . . . . . . . . . . . . . . . . . . . . . . . . . . . . . . . . . . . . . . . . . . . . . . . . . . . . . . . . . . . 332266action potential . . . . . . . . . . . . . . . . . . . . . . . . . . . . . . . . . . . . . . . . . . . . . . . . . . . . . . . . . . . . . . . . . . . . . . . . 5, 61, 642267Activa . . . . . . . . . . . . . . . . . . . . . . . . . . . . . . 1, 8, 9, 11-13, 15, 17-19, 21, 23, 24, 26-33, 35-39, 43-46, 49-51, 57, 632268adaptation . . . . . . . . . . . . . . . . . . . . 1, 3, 6-10, 12, 16, 17, 19, 24-26, 28, 29, 32, 36, 38, 39, 41-47, 51, 53, 55, 59, 662269adaptation amplifier . . . . . . . . . . . . . . . . . . . . . . . . . . . . . . . . . . . . . 3, 9, 10, 12, 17, 19, 25, 28, 29, 32, 36, 43, 45-472270amplification . . . . . . . . . . . . . . . . . . . . . . . . . . . . . . . . . . . . . . . . . . . . . . . . . . . . . . . 15-17, 24, 25, 29, 39, 55-57, 632271anisotropic . . . . . . . . . . . . . . . . . . . . . . . . . . . . . . . . . . . . . . . . . . . . . . . . . . . . . . . . . . . . . . . 20, 21, 26, 28, 41, 46, 542272attention . . . . . . . . . . . . . . . . . . . . . . . . . . . . . . . . . . . . . . . . . . . . . . . . . . . . . . . . . . . . . . . . . . . . . . . . . . . . . . . 40, 562273axoplasm . . . . . . . . . . . . . . . . . . . . . . . . . . . . . . . . . . . . . . . . . . . . . . . . . . . . . . . . . . . . . . . . . . . . . . . . . . . . . . 19, 462274a-wave . . . . . . . . . . . . . . . . . . . . . . . . . . . . . . . . . . . . . . . . . . . . . . . . . . . . . . . . . . . . . . . . . . . . . . . . . . . . . . 53-58, 652275band gap . . . . . . . . . . . . . . . . . . . . . . . . . . . . . . . . . . . . . . . . . . . . . . . . . . . . . . . . . . . . . . . . . . . . . . . . . . . . . 22, 32-372276bipolar . . . . . . . . . . . . . . . . . . . . . . . . . . . . . . . . . . . . . . . . . . . . . . . . . . . . . . . . . . . . . . . . . . . . . . . . . . 39, 51, 57, 602277bleach . . . . . . . . . . . . . . . . . . . . . . . . . . . . . . . . . . . . . . . . . . . . . . . . . . . . . . . . . . . . . . . . . . . . . . . . . . . . . . . . . 15, 242278bleaching . . . . . . . . . . . . . . . . . . . . . . . . . . . . . . . . . . . . . . . . . . . . . . . . . . . . . . . . . . . . . . . . . . . . . . 8, 16, 25, 26, 382279boundary layer . . . . . . . . . . . . . . . . . . . . . . . . . . . . . . . . . . . . . . . . . . . . . . . . . . . . . . . . . . . . . . . . . . . . . . . . . . . . . 322280broadband . . . . . . . . . . . . . . . . . . . . . . . . . . . . . . . . . . . . . . . . . . . . . . . . . . . . . . . . . . . . . . . . . . . . . . . . . . . . . . . . . 362281b-wave . . . . . . . . . . . . . . . . . . . . . . . . . . . . . . . . . . . . . . . . . . . . . . . . . . . . . . . . . . . . . . . . . . . . . . . . . . . 53-57, 65, 662282calibration . . . . . . . . . . . . . . . . . . . . . . . . . . . . . . . . . . . . . . . . . . . . . . . . . . . . . . . . . . . . . . . . . . . . . . . . . . . . . . . . . 592283carboxylic acid system . . . . . . . . . . . . . . . . . . . . . . . . . . . . . . . . . . . . . . . . . . . . . . . . . . . . . . . . . . . . . . . . . . . . . 1, 412284cGMP . . . . . . . . . . . . . . . . . . . . . . . . . . . . . . . . . . . . . . . . . . . . . . . . . . . . . . . . . . . . . . . . . . . . . . . . . . . . . . . . . . 6, 562285class A . . . . . . . . . . . . . . . . . . . . . . . . . . . . . . . . . . . . . . . . . . . . . . . . . . . . . . . . . . . . . . . . . . . . . . . . . . . . . . . . 45, 512286class B . . . . . . . . . . . . . . . . . . . . . . . . . . . . . . . . . . . . . . . . . . . . . . . . . . . . . . . . . . . . . . . . . . . . . . . . . . . . . . . . 45, 462287common-emitter . . . . . . . . . . . . . . . . . . . . . . . . . . . . . . . . . . . . . . . . . . . . . . . . . . . . . . . . . . . . . . . . . . . . . . . . . . . . 292288compensation . . . . . . . . . . . . . . . . . . . . . . . . . . . . . . . . . . . . . . . . . . . . . . . . . . . . . . . . . . . . . . . . . . . . . . . . . . . . . . 642289compound eye . . . . . . . . . . . . . . . . . . . . . . . . . . . . . . . . . . . . . . . . . . . . . . . . . . . . . . . . . . . . . . . . . . . . . . . 55, 60, 612290cross section . . . . . . . . . . . . . . . . . . . . . . . . . . . . . . . . . . . . . . . . . . . . . . . . . . . . . . . . . . . . . . . . . . . . 13, 26, 31, 41-432291cross-section . . . . . . . . . . . . . . . . . . . . . . . . . . . . . . . . . . . . . . . . . . . . . . . . . . . . . . . . . . . . . . . . . . . . . . 13, 15, 20, 252292cut-in . . . . . . . . . . . . . . . . . . . . . . . . . . . . . . . . . . . . . . . . . . . . . . . . . . . . . . . . . . . . . . . . . . . . . . . . . . . . . . . . . . . . 422293dark adaptation . . . . . . . . . . . . . . . . . . . . . . . . . . . . . . . . . . . . . . . . . . . . . . . . . . . . . . . . . . . . . . . 7, 17, 24, 38, 42, 462294diode . . . . . . . . . . . . . . . . . . . . . . . . . . . . . . . . . . . . . . . . . . . . . . . . . . . . . . . . . . . . . . . . . 17, 19, 26, 27, 30, 31, 44, 662295dopamine . . . . . . . . . . . . . . . . . . . . . . . . . . . . . . . . . . . . . . . . . . . . . . . . . . . . . . . . . . . . . . . . . . . . . . . . . . . . . . . . . 452296double layer . . . . . . . . . . . . . . . . . . . . . . . . . . . . . . . . . . . . . . . . . . . . . . . . . . . . . . . . . . . . . . . . . . . . . . . . . . . . . . . 322297dynamic range . . . . . . . . . . . . . . . . . . . . . . . . . . . . . . . . . . . . . . . . . . . . . . . . . . . . . . . . . . . . 10, 16, 38, 41, 43, 44, 662298E/D . . . . . . . . . . . . . . . . . . . . . . . . . . . . . . . . . . . . . . . . . . . . . . . . . . . . . . . . . . . . . . . . . . . . . . . . . . . . . . . . . . . 38, 412299eccentric cell . . . . . . . . . . . . . . . . . . . . . . . . . . . . . . . . . . . . . . . . . . . . . . . . . . . . . . . . . . . . . . . . . . . . . . 45, 59, 60, 642300Electrolytic Theory of the Neuron . . . . . . . . . . . . . . . . . . . . . . . . . . . . . . . . . . . . . . . . . . . . . . . . . . . . . . . . . 1, 30, 562301electrostenolytics . . . . . . . . . . . . . . . . . . . . . . . . . . . . . . . . . . . . . . . . . . . . . . . . . . . . . . . . . . . . . . . . . . . . . . . . . 1, 452302endothermic animals . . . . . . . . . . . . . . . . . . . . . . . . . . . . . . . . . . . . . . . . . . . . . . . . . . . . . . . . . . . . . . . . . . . . . . 35, 362303ERG . . . . . . . . . . . . . . . . . . . . . . . . . . . . . . . . . . . . . . . . . . . . . . . . . . . . . . . . . . . . . . . . . . . . 17, 19, 35, 53-59, 64, 652304exocrine . . . . . . . . . . . . . . . . . . . . . . . . . . . . . . . . . . . . . . . . . . . . . . . . . . . . . . . . . . . . . . . . . . . . . . . . . . . . . . . . . . . 72305exothermic animals . . . . . . . . . . . . . . . . . . . . . . . . . . . . . . . . . . . . . . . . . . . . . . . . . . . . . . . . . . . . . . . . . . . . . . . 36, 372306expanded . . . . . . . . . . . . . . . . . . . . . . . . . . . . . . . . . . . . . . . . . . . . . . . . . . . . . . . . . . . . . . . . . . . . . . 8, 13, 27, 30, 602307external feedback . . . . . . . . . . . . . . . . . . . . . . . . . . . . . . . . . . . . . . . . . . . . . . . . . . . . . . . . . . . . . . . . . . . . . . . . . . . 162308feedback . . . . . . . . . . . . . . . . . . . . . . . . . . . . . . . . . . . . . . . . . . . . . . . . . . . . . . . . . . . . . . . . . . . . . . . . . . . . 16, 42, 462309GABA . . . . . . . . . . . . . . . . . . . . . . . . . . . . . . . . . . . . . . . . . . . . . . . . . . . . . . . . . . . . . . . . . . . . . . . . . . . . . . . . . . . 452310Gaussian . . . . . . . . . . . . . . . . . . . . . . . . . . . . . . . . . . . . . . . . . . . . . . . . . . . . . . . . . . . . . . . . . . . . . . . . . . . . . . . . . . 562311glance . . . . . . . . . . . . . . . . . . . . . . . . . . . . . . . . . . . . . . . . . . . . . . . . . . . . . . . . . . . . . . . . . . . . . . . . . . . . . . . . . . . . 662312glutamate . . . . . . . . . . . . . . . . . . . . . . . . . . . . . . . . . . . . . . . . . . . . . . . . . . . . . . . . . . . . . . . . . . . . . . . . . . . 16, 45, 532313g-protein . . . . . . . . . . . . . . . . . . . . . . . . . . . . . . . . . . . . . . . . . . . . . . . . . . . . . . . . . . . . . . . . . . . . . . . . . . . . . . . 55, 562314Helmholtz double layer . . . . . . . . . . . . . . . . . . . . . . . . . . . . . . . . . . . . . . . . . . . . . . . . . . . . . . . . . . . . . . . . . . . . . . 322315Hodgkin Condition . . . . . . . . . . . . . . . . . . . . . . . . . . . . . . . . . . . . . . . . . . . . . . . . . . . . . . . . . . . . . . . . . . . . . . . . . . . 12316hole . . . . . . . . . . . . . . . . . . . . . . . . . . . . . . . . . . . . . . . . . . . . . . . . . . . . . . . . . . . . . . . . . . . . . . . . . . . . 4, 9, 15, 19, 232317hydronium . . . . . . . . . . . . . . . . . . . . . . . . . . . . . . . . . . . . . . . . . . . . . . . . . . . . . . . . . . . . . . . . . . . . . . . . . . . 9, 29, 322318ice . . . . . . . . . . . . . . . . . . . . . . . . . . . . . . . . . . . . . . . . . . . . . . . . . . . . . . . . . . . . . . . . . . . . . . . . . . . . . . . . . . . . 32, 362319index of refraction . . . . . . . . . . . . . . . . . . . . . . . . . . . . . . . . . . . . . . . . . . . . . . . . . . . . . . . . . . . . . . . . . . . . . . . 14, 272320
Primary Signal Processing 12- 71
internal feedback . . . . . . . . . . . . . . . . . . . . . . . . . . . . . . . . . . . . . . . . . . . . . . . . . . . . . . . . . . . . . . . . . . . . . . . . . . . 162321in-vitro . . . . . . . . . . . . . . . . . . . . . . . . . . . . . . . . . . . . . . . . . . . . . . . . . . . . . . . . . . . . . . . . . . . . . . . . . . . . . 15, 51, 522322in-vivo . . . . . . . . . . . . . . . . . . . . . . . . . . . . . . . . . . . . . . . . . . . . . . . . . . . . . . . . . . . . . . . . . . . . . . . . . . . . . . 5, 19, 532323light adaptation . . . . . . . . . . . . . . . . . . . . . . . . . . . . . . . . . . . . . . . . . . . . . . . . . . . . . . . . . . . . . . . . . . . . . . . . . . 17, 462324Limulus . . . . . . . . . . . . . . . . . . . . . . . . . . . . . . . . . . . . . . . . . . . . . . . . . . . . . . . . . . . . . . . . . . 6, 34-36, 45, 55, 59, 642325liquid-crystal . . . . . . . . . . . . . . . . . . . . . . . . . . . . . . . . . . . . . . . . . . . . . . . . . . . . . . . . . . . . . . . . . . . . . . . . . . . . 1, 202326liquid-crystalline . . . . . . . . . . . . . . . . . . . . . . . . . . . . . . . . . . . . . . . . . . . . . . . . . . . . . . . 1, 9, 24, 31, 36, 37, 40, 41, 452327LOT . . . . . . . . . . . . . . . . . . . . . . . . . . . . . . . . . . . . . . . . . . . . . . . . . . . . . . . . . . . . . . . . . . . . . . . . . . . . . . . . . . . . . 552328Medulla . . . . . . . . . . . . . . . . . . . . . . . . . . . . . . . . . . . . . . . . . . . . . . . . . . . . . . . . . . . . . . . . . . . . . . . . . . . . . . . . . . 602329mesotopic . . . . . . . . . . . . . . . . . . . . . . . . . . . . . . . . . . . . . . . . . . . . . . . . . . . . . . . . . . . . . . . . . . . . . . . . . . . . . . . . . 252330microtubule . . . . . . . . . . . . . . . . . . . . . . . . . . . . . . . . . . . . . . . . . . . . . . . . . . . . . . . . . . 7, 9, 21-23, 27-29, 31, 32, 632331microvilli . . . . . . . . . . . . . . . . . . . . . . . . . . . . . . . . . . . . . . . . . . . . . . . . . . . . . . . . . . . . . . . . . . . . . . . . . . . . . . 60, 622332modulation . . . . . . . . . . . . . . . . . . . . . . . . . . . . . . . . . . . . . . . . . . . . . . . . . . . . . . . . . . . . . . . . . . . . . . . . . . . . . . . . . 52333monopolar . . . . . . . . . . . . . . . . . . . . . . . . . . . . . . . . . . . . . . . . . . . . . . . . . . . . . . . . . . . . . . . . . . . . . . . . . . . . . 51, 602334morphogenesis . . . . . . . . . . . . . . . . . . . . . . . . . . . . . . . . . . . . . . . . . . . . . . . . . . . . . . . . . . . . . . . . . . . . . . . . . . . . . . 72335narrow band . . . . . . . . . . . . . . . . . . . . . . . . . . . . . . . . . . . . . . . . . . . . . . . . . . . . . . . . . . . . . . . . . . . . . . . . . . . . . . . 472336navigation . . . . . . . . . . . . . . . . . . . . . . . . . . . . . . . . . . . . . . . . . . . . . . . . . . . . . . . . . . . . . . . . . . . . . . . . . . . . . . . . . . 12337neurites . . . . . . . . . . . . . . . . . . . . . . . . . . . . . . . . . . . . . . . . . . . . . . . . . . . . . . . . . . . . . . . . . . . . . . . . . . . . . . . . 24, 292338night blindness . . . . . . . . . . . . . . . . . . . . . . . . . . . . . . . . . . . . . . . . . . . . . . . . . . . . . . . . . . . . . . . . . . . . . . . . . . . . . 552339noise . . . . . . . . . . . . . . . . . . . . . . . . . . . . . . . . . . . . . . . . . . . . . . . . . . . . . . . . . . . . . . . . . . . . . . . . . . . . 46, 53, 59, 642340n- . . . . . . . . . . . . . . . . . . . . . . . . . . . . . . . . . . . . . . . . . . . . . . . . . . . . . . . . . 6, 9, 13-15, 17, 18, 31, 32, 34, 36, 37, 442341n-type . . . . . . . . . . . . . . . . . . . . . . . . . . . . . . . . . . . . . . . . . . . . . . . . . . . . . . . . . . . . . . . . . . . . . . . . 17, 31, 32, 36, 372342orbitals . . . . . . . . . . . . . . . . . . . . . . . . . . . . . . . . . . . . . . . . . . . . . . . . . . . . . . . . . . . . . . . . . . . . . . . . . . . . . . . . 24, 252343P/D equation . . . . . . . . . . . . . . . . . . . . . . . . . . . . . . . . . 1, 3, 7, 20, 31, 36, 37, 41, 44-48, 51-54, 56, 57, 59, 60, 63-652344pain . . . . . . . . . . . . . . . . . . . . . . . . . . . . . . . . . . . . . . . . . . . . . . . . . . . . . . . . . . . . . . . . . . . . . . . . . . . . . . . . . . . 26, 432345parametric . . . . . . . . . . . . . . . . . . . . . . . . . . . . . . . . . . . . . . . . . . . . . . . . . . . . . . . . . . . . . . . . . . . . . . . . . . . . . . . . . 252346parvocellular . . . . . . . . . . . . . . . . . . . . . . . . . . . . . . . . . . . . . . . . . . . . . . . . . . . . . . . . . . . . . . . . . . . . . . . . . . . . . . . 602347Pauli exclusion principle . . . . . . . . . . . . . . . . . . . . . . . . . . . . . . . . . . . . . . . . . . . . . . . . . . . . . . . . . . . . . . 1, 4, 29, 412348pnp . . . . . . . . . . . . . . . . . . . . . . . . . . . . . . . . . . . . . . . . . . . . . . . . . . . . . . . . . . . . . . . . . . . . . . . . . . . . . . . 1, 28-30, 362349podites . . . . . . . . . . . . . . . . . . . . . . . . . . . . . . . . . . . . . . . . . . . . . . . . . . . . . . . . . . . . . . . . . . . . . . . . . . . . . . . . . . . 132350poditic . . . . . . . . . . . . . . . . . . . . . . . . . . . . . . . . . . . . . . . . . . . . . . . . . . . . . . . . . . . . . . . . . . . . . . . . . . . . . . . . . . . . 192351probabilistic . . . . . . . . . . . . . . . . . . . . . . . . . . . . . . . . . . . . . . . . . . . . . . . . . . . . . . . . . . . . . . . . . . . . . . . . . . . . 32, 402352propagation velocity . . . . . . . . . . . . . . . . . . . . . . . . . . . . . . . . . . . . . . . . . . . . . . . . . . . . . . . . . . . . . . . . . . . . . . . . . 152353protocol . . . . . . . . . . . . . . . . . . . . . . . . . . . . . . . . . . . . . . . . . . . . . . . . . . . . . . . . . . . . . . . . . . . . . . . . . . . . . . . . . . 512354quantum-mechanical . . . . . . . . . . . . . . . . . . . . . . . . . . . . . . . . . . . . . . . . . . . . . . . 1, 3-5, 7, 24, 26-29, 31, 32, 37, 662355reading . . . . . . . . . . . . . . . . . . . . . . . . . . . . . . . . . . . . . . . . . . . . . . . . . . . . . . . . . . . . . . . . . . . . . . . . . . . . . . . . . 8, 492356rectifier . . . . . . . . . . . . . . . . . . . . . . . . . . . . . . . . . . . . . . . . . . . . . . . . . . . . . . . . . . . . . . . . . . . . . . . . . . . . . . . . . . . 512357residue . . . . . . . . . . . . . . . . . . . . . . . . . . . . . . . . . . . . . . . . . . . . . . . . . . . . . . . . . . . . . . . . . . . . . . . . . . . . . . . . . . . 412358resonance . . . . . . . . . . . . . . . . . . . . . . . . . . . . . . . . . . . . . . . . . . . . . . . . . . . . . . . . . . . . . . . . . . . . . . . . . . . 20, 21, 402359rhabdom . . . . . . . . . . . . . . . . . . . . . . . . . . . . . . . . . . . . . . . . . . . . . . . . . . . . . . . . . . . . . . . . . . . . . . . . . . . . . . . 60, 642360rhabdomere . . . . . . . . . . . . . . . . . . . . . . . . . . . . . . . . . . . . . . . . . . . . . . . . . . . . . . . . . . . . . . . . . . . . . . . . . . . . . 60, 632361roadmap . . . . . . . . . . . . . . . . . . . . . . . . . . . . . . . . . . . . . . . . . . . . . . . . . . . . . . . . . . . . . . . . . . . . . . . . . . . . . . . . . . . 32362saccule . . . . . . . . . . . . . . . . . . . . . . . . . . . . . . . . . . . . . . . . . . . . . . . . . . . . . . . . . . . . . . . . . . . . . . . . . . . . . . . . . . . 162363slow wave . . . . . . . . . . . . . . . . . . . . . . . . . . . . . . . . . . . . . . . . . . . . . . . . . . . . . . . . . . . . . . . . . . . . . . . . . . . 14, 20, 642364square law . . . . . . . . . . . . . . . . . . . . . . . . . . . . . . . . . . . . . . . . . . . . . . . . . . . . . . . . . . . . . . . . . . . . . . . . . . . . . . . . 332365stage 1 . . . . . . . . . . . . . . . . . . . . . . . . . . . . . . . . . . . . . . . . . . . . . . . . . . . 3, 7, 9, 10, 16-18, 27, 30-32, 39, 41, 51, 572366stage 2 . . . . . . . . . . . . . . . . . . . . . . . . . . . . . . . . . . . . . . . . . . . . . . . . . . . . . . . . . . . . . . . . . . 29, 30, 32, 40, 51, 56, 572367stage 4 . . . . . . . . . . . . . . . . . . . . . . . . . . . . . . . . . . . . . . . . . . . . . . . . . . . . . . . . . . . . . . . . . . . . . . . . . . . . . 39, 40, 442368stage 5 . . . . . . . . . . . . . . . . . . . . . . . . . . . . . . . . . . . . . . . . . . . . . . . . . . . . . . . . . . . . . . . . . . . . . . . . . . . . . . . . . . . 442369synapse . . . . . . . . . . . . . . . . . . . . . . . . . . . . . . . . . . . . . . . . . . . . . . . . . . . . . . . . . . . . . . . . . . . . . . . . . . . . . . . . . . . . 52370threshold . . . . . . . . . . . . . . . . . . . . . . . . . . . . . . . . . . . . . . . . . . . . . . . . . . . . . . . . . . . . . . . . . . . . . . 15, 31, 32, 34, 572371transduction . . . . . . . . . . . . . . . . . . . . . . . . . . . . . . . . . . . . . . . . . . . . . 1, 4, 6-8, 17, 20, 21, 23, 25, 26, 28, 30, 38, 562372transistor action . . . . . . . . . . . . . . . . . . . . . . . . . . . . . . . . . . . . . . . . . . . . . . . . . . . . . . . . . . . . . . . . . . . . . . . . . . . . 492373translation . . . . . . . . . . . . . . . . . . . . . . . . . . . . . . . . . . . . . . . . . . . . . . . . . . . . . . . . . . . . . . . 7-9, 17, 23, 26, 32-34, 362374Verhoeff’s . . . . . . . . . . . . . . . . . . . . . . . . . . . . . . . . . . . . . . . . . . . . . . . . . . . . . . . . . . . . . . . . . . . . . . . . . . . . . . . . 452375verification . . . . . . . . . . . . . . . . . . . . . . . . . . . . . . . . . . . . . . . . . . . . . . . . . . . . . . . . . . . . . . . . . . . . . . . . . . . . . . . . 292376waveguide . . . . . . . . . . . . . . . . . . . . . . . . . . . . . . . . . . . . . . . . . . . . . . . . . . . . . . . . . . . . . . . . . . . . . . . . . . . . . . . . 272377xxx . . . . . . . . . . . . . . . . . . . . . . . . . . . . . . . . . . . . . . . . . . . . . . . . . . . . . . . . . . . . . . . . . . . . . . . . . . . . 1, 6, 44, 53, 642378