Embed Size (px)
Citation preview
ISSN 1018-5593
Commission of the European Communities
SUMMARY REPORTS OF THE R&D PROGRAMME
Primary raw materials (1986-89)
VOLUME 2
Report EUR 13647/11 EN


J
Commission of the European Communities
Summary reports of the R&D programme:
Primary raw materials (1986-89) Volume II
Edited by: M. Donato
Commission of the European Communities 200 rue de la Loi B-1049 Brussels
Summary reports
Directorate-General Science, Research and Development
1992
PARL. CUROP. Biblloth.
MCEUR 13647/11 EN |

Published by the COMMISSION OF THE EUROPEAN COMMUNITIES
Directorate-General Telecommunications, Information Industries and Innovation
L-2920 Luxembourg
LEGAL NOTICE Neither the Commission of the European Communities nor any person acting
on behalf of the Commission is responsible for the use which might be made of the following information
This document has been reproduced from the best original available
ISBN 92-826-3793-X (volumes 1-3)
Cataloguing data can be found at the end of this publication
Luxembourg: Office for Official Publications of the European Communities, 1992
ISBN 92-826-3795-6
c ECSC-EEC-EAEC, Brussels • Luxembourg, 1992
Printed in Belgium
SUGARY REPORTS OF THE R & D PROGRAMME; PRIMARY RAW MATERIALS (1986-1989)
VOLUME 2. MINING TECHNOLOGY
TABLE OF CONTENTS
RESEARCH AREA 2.1 : ROCK FRACTUR I NG 291
Contract MA1M-0054-C The influence of rock properties on the efficiency of mechanized mining with reference to hard rock cutting 293 Contract MA1M-0073-F Fractured rock mechanics and the stablI ity of mines 307 Contract MA1M-0076-C Cut-and-fI I I mining in hard rock without the use of explosives 315
RESEARCH AREA 2.2 : ROCK MECHANICS AND STABILITY SUPPORT SYSTEMS.. 327
Contract MA1M-0018-NL CatacIastic-pIasto-eIastic equilibria in brittle rock under triaxlal differential loading conditions 329 Contract MA1M-0048-C Setting up of a checking system of the underground cavern evolution In mines exploited by solution technique and numerical modelling of the said process 345 Contract MA1M-0055 Stability and reinforcement of mine workings. Development of dimensioning methods based on geostatistIcaI studies of fracturing and the key-block method. Application to cable-bolting 361


Contract MA1M-0067-I Optimization of cemented backfill 375
RESEARCH AREA 2.3 & 2.4 : APPLICATION OF ROBOTICS IN MINES 401
Contract MA1M-0016-C Automation of trucks used In underground and open cast m i nes 403 Contract MA1M-0053-C Robotics of mining machines of the road-header type to obtain selective automatic cutt i ng 415
RESEARCH AREA 2.5 : MODELLING AND SIMULATION METHODS IN MINING OPERATION 431
Contract MA1M-0019-C Support calculation in highly jointed rock masses 433 Contract MA1M-0022-C Simulations of morphologies of tectonIsed depos its 443 Contract MA1M-0024-C New features of a software for simulating mining operations In open pit and development towards mining control and planning.. 451 Contract MA1M-0025-C Optimization of the exploitation of thin vein polymetallic sulphide deposits through mathematical modelling and rock mechanics; an application to the MoIaol mine 459 Contract MA1M-0026-D Computer aided design of underground metalliferous mining layouts 475 Contract MA1M-0060-C Computer aided selective production planning for complex orebodles 487
- v


Contract MA1M-0063-C Computer aided planning of underground mining exploitations 503
RESEARCH AREA 2.6 : PROBLEMS ASSOCIATED WITH SMALL-SIZE MINES 515
Contract MA1M-0050-D Fundamental analysis and development of small scale mining methods for in-the-ore development of small barite and fluorspar lode deposits situated near to the surface with special regard to the application of open pit mining methods with later transition to underground mining 517
Contract MA1M-0056-C Realization of an expert software prototype on a micro-computer for the optimisation of small scale mining 535
Contract MA1M-0065-C What equipment to develop for European small scale mines? State of the art, proposal and study of the micro-Jumbo 545
VII

2. MINING TECHNOLOGY

RESEARCH AREA 5.1
ROCK FRACTURING

THE INFLUENCE OF ROCK PROPERTIES ON THE EFFICIENCY OF MECHANIZED MINING WITH
REFERENCE TO HARD ROCK CUTTING
P r o j e c t Leade r : H. SELLAMI Paris School of Mines, Franco
J.A. Hudson Imperial College of Science and Technology, London, United Kingdom
Contract number: MA1M-0054-C(CD)
1. INTRODUCTION
Since their Introduction in mining and tunnelling operations, cutting machines have undergone considerable improvement. The machines of today have considerably more power but their efficiency does not appear to have improved in the same proportion. Thereby, it appears necessary to adapt this type of equipment to hard or abrasive environments. This can be done by the development of new concepts for the cutting tools, for their fixing on the cutting head, for their lacing (I.e. the arrangement of the tools on the cutting head), and for the specifications of the mach i ne ItseIf.
The optimization of all these parameters and, therefore, the success of machine cutting are Intimately connected with the sustained effectiveness of the cutting process at the tool tip.
The research program of the present EEC project associating the Paris School of Mines (PSM) and the Imperial College of London (ICL) deals with these problems. The aim of the work Is to provide a sound basis for the app I Icatlon of current knowledge and practice to mechanized tunnelling In hard rock .
2. METHODOLOGY OF STUDY The methodology of study defined by the two partners Is based on two fundamental points:
i) the knowledge of the laws governing the tool-rock i nteractI on,
II) the modelling of the cutting head.
293 -
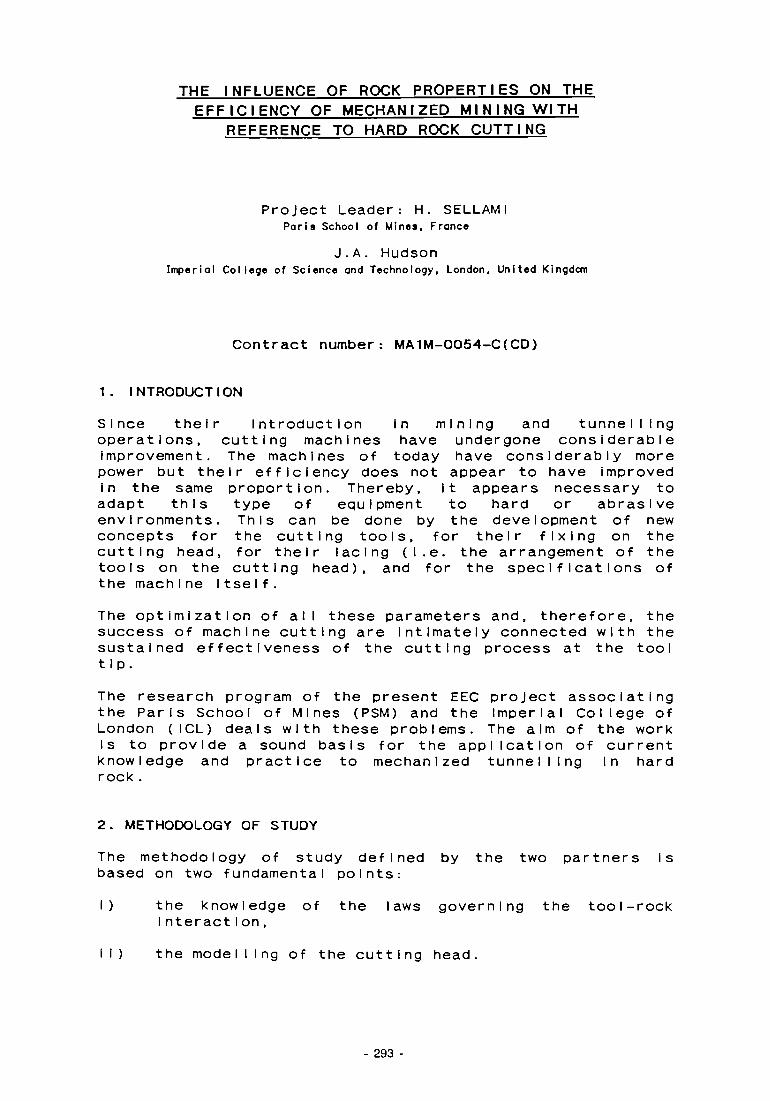
This methodology, Illustrated In figure 1, allows the evaluation of the cutting machine operation from the available thrust/power and the laws governing the forces equIIibrlum on the machine.
Alternatively, if a value of advance speed is fixed, then the value of the thrust force and the power are derived by the model, hence the maximum machine specifications, necessary to achieve the desired production rate, are found.
According to this methodology, the work has been divided into five tasks listed below:
i) Rock selection and characterization
I I) Break i ng mode
ill) Interaction between tools
Iv) Laboratory and full scale testing v) Computer modelling of tunnelling machine behaviour.
3. ROCK SELECTION AND CHARACTERIZATION Ten different rocks have been selected to give a satisfactory range of material characteristics. These rocks Include four sandstones, five limestones and one shistous clay. The uniaxial compressive strength of the selected rocks varies between 20 and 123 MPa. An effort has been made to standardize the testing of the properties of the selected rocks. A chart has been designed according to the International Society of Rock Mechanics (figure 2); It includes rock Identification, petrographicaI , mineraIogIcaI and geomechanIcaI analysis. The petrographlcal analysis Included preparation and examination of thin sections of rock. This is done in order to analyse the texture of the material being cut and to compare the photos obtained with the SEM micrographs of rock after being cut with a view for observing the damages In the material caused by the cutting tool action. The SEM observations of rock specimen (figure 3) allowed good understanding of the microscopic failure mechanisms. The analysis conducted showed that the rock chips are always created by cracks progagatlon In a tens I le mode. In sandstones, cracks are Initiated In a crushed zone at the tool-rock contact and propagate preferentially along grain boundaries. In limestones, the Intense stress field localized at the vicinity of the tool-rock contact induces a fractures zone In which microcracks are Initiated, mainly along crystal boundaries or cleavage planes of crystals.
294

4. LABORATORY TESTING DEVICES 4.1 THE PSM TESTING DEVICES In order to carry out the laboratory picks cutting tests, the existing rigs have been adapted to the hard rock cutting experiments and new testing devices have been built. Figure 4 Illustrates the modified rig designed in order to test roadheaders and continuous miners. The head or the drum is set at the end of a rigid shaft, so that It is possible to Investigate both axial and transversal penetrations. Exact replicas of real heads and a head with various geometry have been designed to give a wide range of head characteristics (figure 5). The pick-holders mounted on the head can move freely along special grooves, therefore being possible to change pick lacing along the spiral lines with an adjustable geometry.
In addition, a clearance ring of continuous miner has been built In order to evaluate the energy consumed by this particular part of the continuous miner during cutting. Since the most part of the picks of roadheaders and continuous miners clearance rings are laterally inclined, it is then necessary to understand and to be able to predict the behaviour of such picks. However, as far as we know, no research has taken place In model I I ng such cutting conditions; this Is why a reduced scale rig has been built to test Inclined pick. The Inclination angle Is obtained by inclining the table on which the rock is fixed. Otherwise, a special pick-holder has been built and fixed on the full scale linear rig of the Charbonnage de France (CdF).
4.2 THE ICL LINEAR RIG The Imperial College equipments used In this project consists of a linear rig devoted to test disc cutters.
5. EXPERIMENTAL RESULTS 5.1 CUTTING TOOLS Numerous comparisons between various tools In various rocks are obtained. For instance, the comparison of the two most used picks In practice, the point attack pick and the V-shaped pick, indicates that In hard rock, the forces required by the first pick to cut the rock are 100% higher than those required by the second one. The difference between the two tools decreases with the depth of cut. For soft and medium hard rocks, there is no major difference in the forces required by the two picks considered.
295

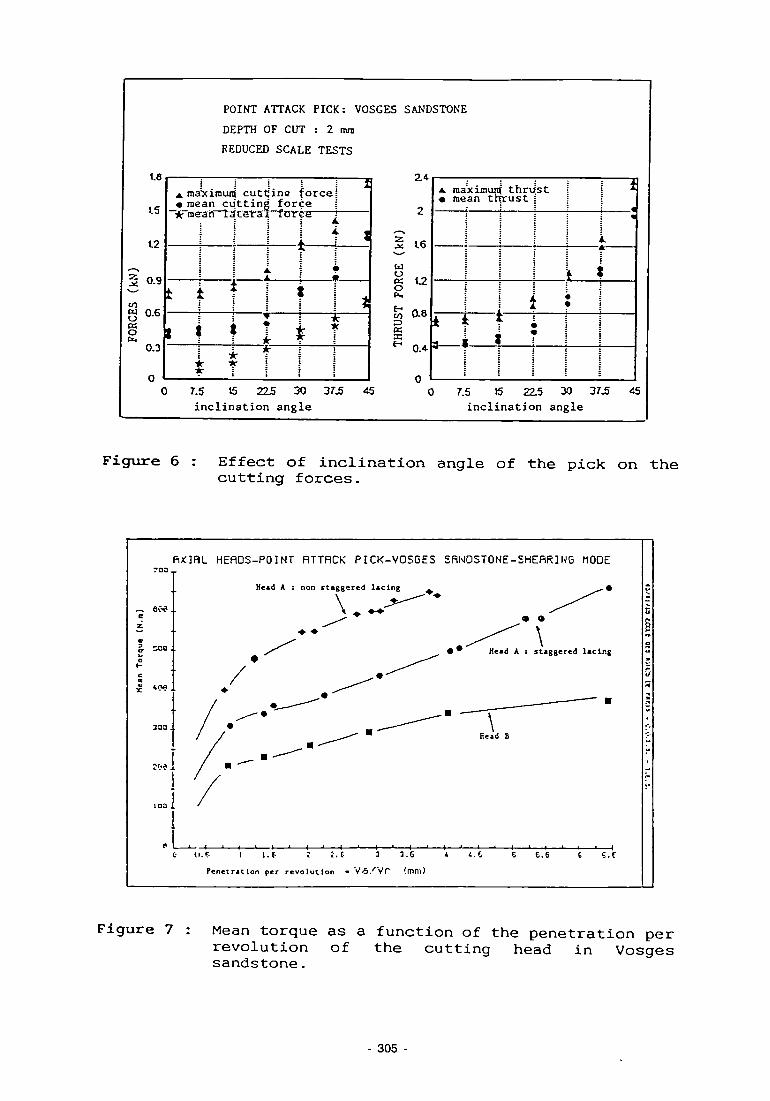
For the laterally Inclined picks cutting In hard rocks, the thrust force at 45° Inclination angle Is found more than three times the value obtained with vertical pick (figure 6). These results Indicate that the Inclination angle Is a very important parameter In the design of picks bearing tunnel I Ing machines. Moreover, the optimum spacing between tools is determined for the selected rocks. The results indicate that, for the hard rocks selected, the spacing between tools has to be less than three times the depth of cut for interaction to occur, otherwise, the cut Is not relieved and the ridge of rocks does not break away. This Is of great Importance for head design and for the choice of the lacing of the tools. Finally, tests with reduced scale disc cutters have been carried out at the ICL. Some comparisons between disc cutters and picks showed that the disc requires ten to fifteen times as much forces as the pick but the number of experiments with disc Is still too limited to make an accurate comparison between the two types of tools.
5.2 CUTTING HEADS Numerous results have been obtained using the reduced scale rig designed at the PSM. The results provide many interesting points such as the advantage of staggered lacing compared to non staggered one and the superiority of a small axial head in hard rocks. Figure 7 illustrates an example of evolution of the torque on the head as a function of the penetration per revolution In the rock of the head; we can note the advantage of staggered lacing for head A, and the good performances of head B; head A corresponds to a conical cutting head of 1 meter maximum diameter and head B Is a tronquated cone of 0.6 meter maximum diameter. Several criteria have been evaluated from the reduced scale experiments such as the rotation speed, the geometry of the head, the picks lacing, the type of pick and its state of wear .
6. TOOL-ROCK INTERACTION MODELLING AND COMPUTER SIMULATION OF CUTTING MACHINES
A theoretical approach has been developed at the PSM to predict the forces required by the tool to cut a hard rock. This approach assumes that the cutting action requires the creation of a crushed zone of rock around the tool tip. Using a simplified fracture mechanic approach, equations have been obtained for the forces exerted by the tool. The rock Is characterized essentially by the fracture toughness in tensl le mode. An acceptable agreement has been obtained with the experimental results.
296

This approach has been extended to the different cutting modes by means of experimental coefficients that allow the calculation of forces on the tool when general conditions are known.
The next step of the work consists In the evaluation of the performances of a given cutting machine. This Is done through detailed analysis of the tool kinematics during a head revolution. The analytical assessment of a cutting head appears to be very difficult especially In the case of complex pick lacing such as staggered spirals or variable spaclngs between cutting lines. It has been decided, therefore, that the best way to handle the mass of equations obtained Is by mean of a computer program.
The program developed at the PSM Is divided Into three steps:
- data management, senarIos calculations and output of results.
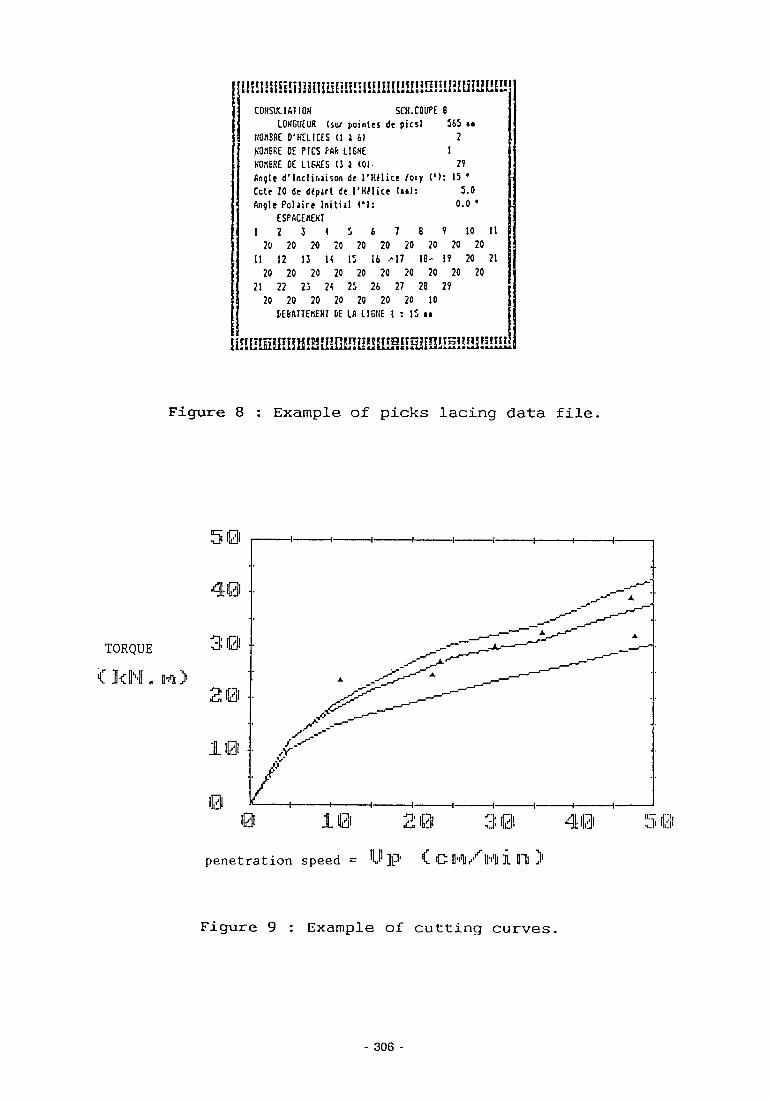
An example of data file Is shown In figure 8 for the pick IacIng.
The second step of the program consists in putting data files together In order to create a senario. Before calculations, the program determines the pick parameters and visualizes the head design.
The main results of the calculations are the variations of torque and forces with the advance speed. The curves obtained are shown In figure 9 and they are called cutting curves.
The predictions of the program have been compared to the experimental data obtained. In many cases, the calculations allow predictions of the machine behaviour, albeit somewhat qualitatively and further research must be focused on a detailed analysis of the tools on the noze section of the roadheaders and on appraisal of wear.
As far as head design or selection is concerned, several factors appears to play an important role; the effect of these factors have been evaluated from laboratory tests and computer simulations such as:
PICKS LACING
This factor affects considerably the vibrations on the head. The superiority of staggered lacing observed during the reduced scale experiments Is confirmed by the computer
- 297

simulations. Moreover, the spacing between tools must be chosen so as to optimize the interaction between neighbouring cuts. The tests carried out in hard rocks Indicate that the point attack pick, for Instance, requires about three tons force to penetrate a rock of 100 MPa uniaxial compressive strength; this implies that the depth of cut of each pick during a head revolution is generally small In strong rocks. The design of the cutting head must take Into account this phenomena and the distance between neighbouring picks must be reduced In hard rocks to Insure Interaction and to avoid the deepening cutting mode.
CUTTING TOOLS In aggressive grounds, it seems that there Is interest In using forward pick; the forces on this pick are found to be the half of those corresponding to point attack pick which Is now the most used pick In practice in hard rocks.
ROTATION SPEED The effect of the rotation speed depends on the factor limiting the machine (power or thrust). The tunnelling machines are generally thrust limited and In this case both the advance speed and the wear on the tools increase with the rotation speed; so there Is no Interest in Increasing the rotation speed as It would cause an increased wear rate and the short term advantage would quickly be offset.
7. CONCLUSION The results obtained show that rock cutting tests on a small cutter head coupled with computer simulations provide a reliable means of Investigation Into the cuttabillty of rocks for tunnelling applications. An Important data base has been obtained from laboratory testing using appropriate devices and carried out on ten rocks (essentially limestones and sandstones). These rocks are characterized by experimental standard procedures. This data base should be completed by other types of rocks and by in situ tests In conditions near to those of a real machine. Once this data base Is completed, It will be possible to give an estimation of the cuttabillty of a given rock by comparing Its standard characteristics to those of the selected reference rocks.
8. ACKNOWLEDGEMENTS This work was made possible through the financial support of the European Community. The Paris School of Mines and the Imperial Col lege of London wish to express their grateful acknowledgement for this essential help.
298
9. REFERENCES B.K. ATKINSON et V. AVDIS (1980): "Fracture mechanics parameters of some rock forming minerals determined using an indentation technique", Int. J. Rock Mech. Min. ScI. (Technical Note), Vol. 17, pp. 383-386. PH. CORDELIER (1989): "Modelisation du travail des machines a attaque ponctuelle; Evolution vers les creusements en roche dure", These de doctorat, ENSMP, edlte par E. DELIAC, publle par ENSMP/CMI, Par Is/FontainebIeau, 58 p. E. DELIAC et H. SELLAMI (1984): "Une nouvelle approche du travail d'un pic dans une roche", Comptes-rendus du seminal re "Theorle et Pratique de I 'abattage mechanlque en France", 30-31 Oct. 1984, Fontalnebleau, edite par E. DELIAC, publle par ENSMP/CMI , Par Is/FontainebIeau, 58 p. E. DELIAC (1986): "Optimisation des machines d'abattage a pics", These de Doctorat es Sciences Physiques, Universlte de Paris VI, edlte par ENSMP/CMI, Par Is/Fontaineb Ieau (France, 503 p. I. EVANS (1965): "The Force required to cut coal with blunt wedges", Int.J. Rock Mech. Mln. ScI. Vol. 2, pp. 1-12. C.E. FAIRHURST (1987): "Contribution a ('amelioration de I 'abattage mechanlque de roches agresslves: le pic asslste et le pic vibrant", These de Docteur de I'EcoIe Nationale Superieure des Mines de Paris, specialite: Techniques et Economie de I'Entreprlse Mlniere, edite par le Centre Mines Infrastructures de I'ENSMP, Oct. 1987, 221 p.
M. KADIU (1987): "Etude du travail du pic incline", memolre de Dlplome d'Etudes ApprofondIes, Ref . TEM/DEA 87/3, éditépar ENSMP/CGES, Par Is/FontaI neb Ieau . M. KADIU (1988): "Etude du schema de roulllure des machines d'abattage mechanlque equIpées de pics", rapport Interne, Ref. TEM/RAP 88/9, edlte par ENSMP/CGES, Par Is/FontainebIeau. M. LEBRUN (1978): "Etude theorlque et expérimentaIe de I 'abattage mechanlque; application a la conception de machines d'abattage et de creusement", These de docteur-IngenIeur, ENSMP, édité par ENSMP/CMI, Par Is/Fontainebleau (France), 143 p.
- 299

Y. NISHIMATSU (1972): "The mechanics of rock cutting", Sci., Vol. 9, pp 261-270.
Int Rock . Mech. M I n
F. OUCHTERLONY (1988): "Fracture toughness testing of rock with core based speciment", presented at the International conference on Fracture and Damage of Concrete and Rock, TU-Wlen, W l e n , July 4-6 1988.
W.W. ROEPKE, B.D. HANSON, C.E. LONGFELLOW (1983): "Drag bit cutting characteristics using sintered diamond Inserts", Bureau of Mines R.I. 8802, Twin Cities Research Center, Minneapolis (Minnesota, USA), 30 p.
F.F. ROXBOROUGH et H.R. PHILLIPS (1975) "Rock excavation by disc cutter", Int. Scl., Vol. 12, pp 361-366.
Rock Mech. Min
H.P. SANIO (1985) "Prediction of an IsotropIcrock", 153-161.
the performance of disc cutters In Int. J. Rock. Mech. Mln. ScI., Vol. 22, pp
H. SELLAMI et E. DELIAC (1987): "Essals d'abattage mechanlque avec pics dlamantes". Rev. ind. Mln., Vol. 69, Les Techniques 8-87, oct. 1987, pp 265-273.
H. SELLAMI (1987): "Etude du travail des pics uses; application aux machines d'abattage a pics", These de doctorat, ENSMP, édité par ENSMP/CGES, Paris/FontainebIeau.
M.V. SWAIN et B.R. LAWN (1976): "Indentation fracture In brittle rocks and ROck. Mech. Mln. Sci., Vol. 13, pp 311-319
gIasses' Int. J.
300
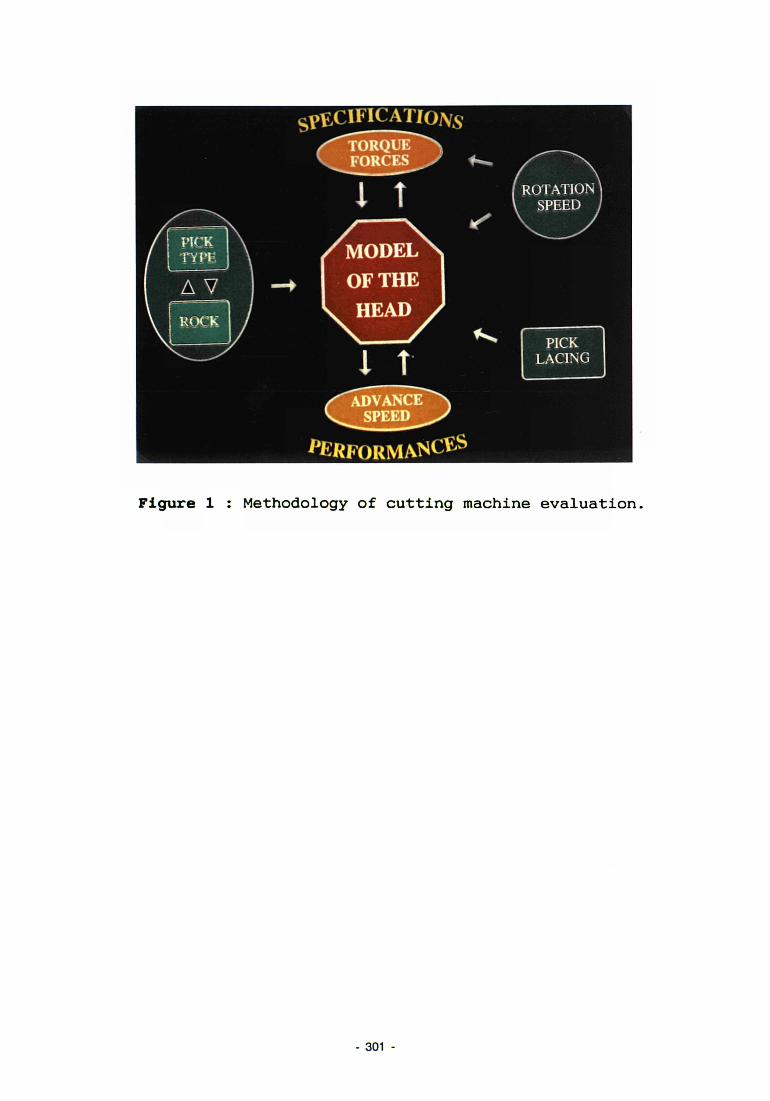
Figure 1 : Methodology of cutting machine evaluation.
- 301 -
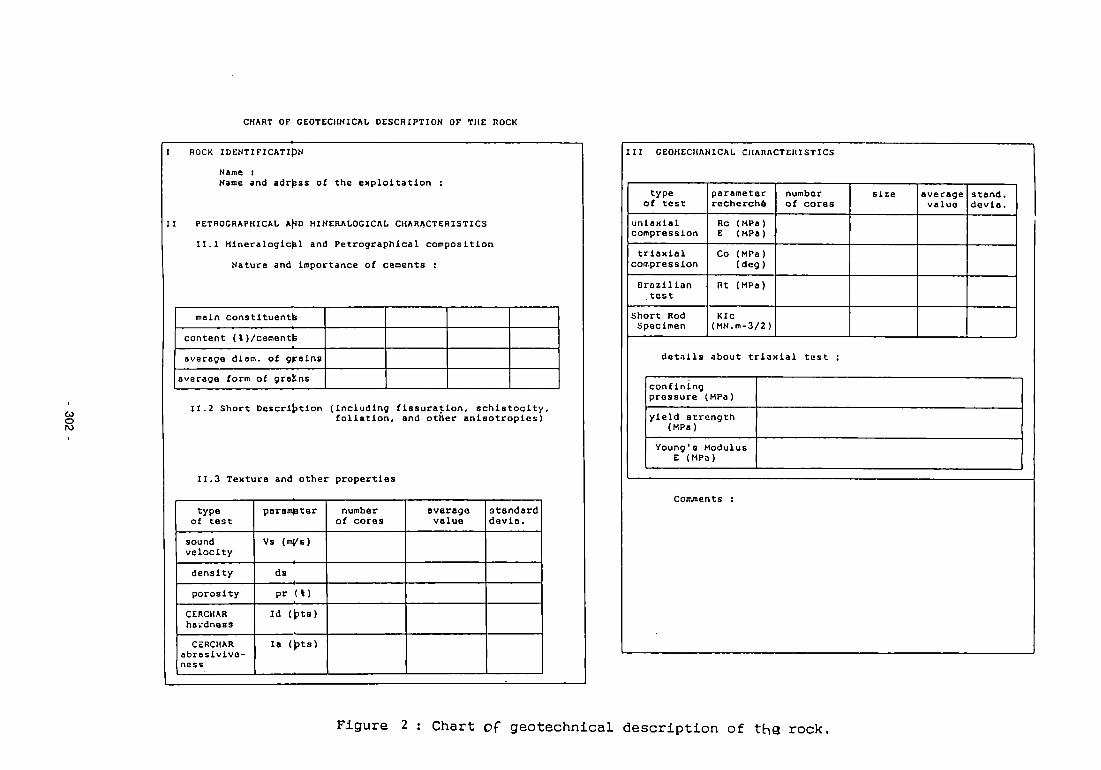
CHART OF CEOTECHNICAL DESCRIPTION OF THE ROCK
U O
I ROCK IDENTIFICATIpN Name : Name and adr^ss of the exploitation
II PETROGRAPHICAL AND MINERALOGICAL CHARACTERISTICS II.1 Mineralogical and Petrographical composition Nature and importance of cements :
main constltuentfe content (t)/cementfc average diam. of grains
average form of grains
II.2 Short Description (including fissuration, schistocity, foliation, and other anisotropics)
II.3 Texture and other properties
type of test sound velocity density porosity
CERCHAR hardness CERCHAR
abraslvlve-ness
parameter
Vs (m/s)
ds pr (%)
Id (t>ts)
la (bts)
number of cores
average value
standard devia.
Ill CEOHECHANICAL CHARACTERISTICS
type of test
uniaxial compression triaxial
compression Brazilian test
Short Rod Specimen
parameter recherche Re (MPa) E (MPa) Co (MPa)
(deg) Rt (MPa)
KIc (MN.m-3/2)
number of cores
size
details about triaxial test
Comments
average value
stand, devla.
confining pressure (MPa) yield strength
(MPa) Young's Modulus
E (MPa)
Figure 2 : Chart of geotechnical description of the rock.
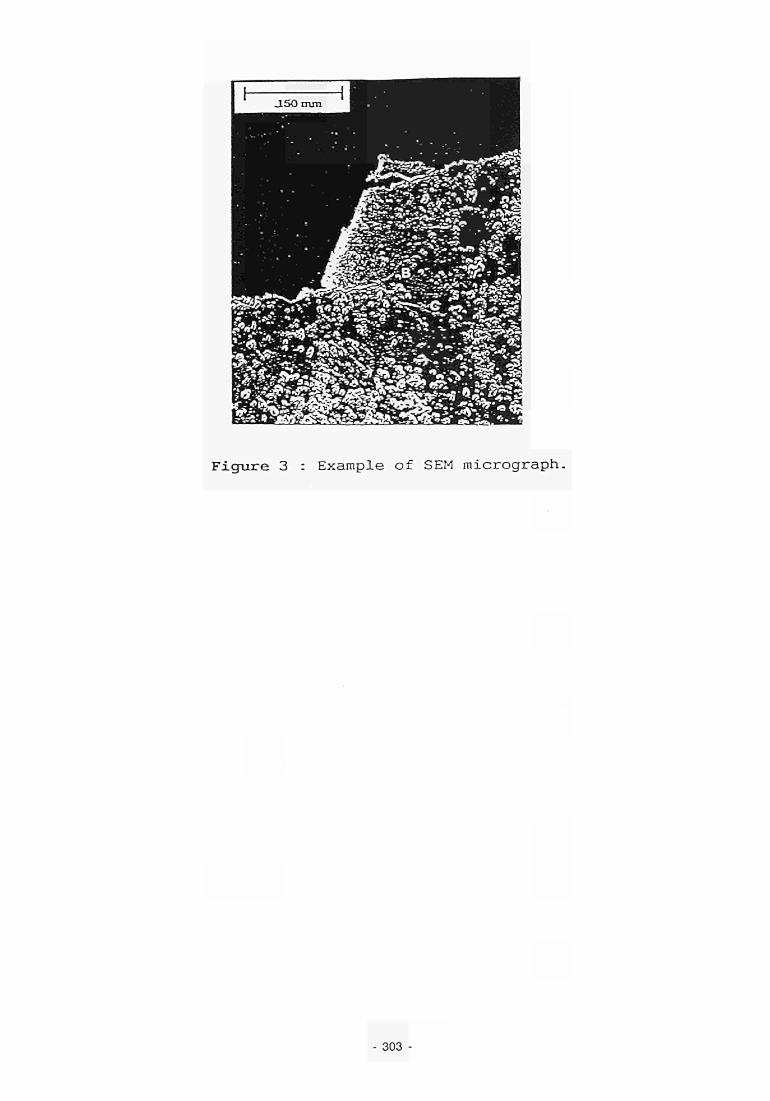
Figure 3 : Example of SEM micrograph.
- 303 -

Figure 4 : PSM's rig for picks cutting head (scale factor 1/4 to 1/6).
Figure 5 : Reduced scale cutting head with various geometry.
- 304 -
15
12
2 0-9 CO
« 0.6
POINT ATTACK PICK: VOSGES SANDSTONE
DEPTH OF CUT : 2 mra
REDUCED SCALE TESTS
2.4
0.3
A raa'ximun • mean cu
—*Trae-a"irtJ
t i \
I % \
cuttiine force t t i n g foree ceral
2
t lorce ■
! 1 t « A. i.
L
• •
X t
* * t *
7.5 15 225 30 37.5 i nc l ina t ion angle
45
w « o
CO
a:
t6
t2
a*
*. raa'ximunj t h rus t « mean t h r u s t i
i
i
I ? 1 * * * ; 3 * t T
7.5 15 22.5 30 37.5 i nc l ina t ion angle
45
Figure 6 : Effect of inclination angle of the pick on the cutting forces.
RXlf lL HEADS-POINT RTTRCK PICK-V0SGES SflNOSTONE-SHEfiRlHG MODE
Head A : non staggered lacing
~ CM .. \ . ~ -
-♦♦
- > — i — i — i — > — >-
• » Head A : staggered lacing
Read B
I I. (• : i. C 3 3.6 Penetration per revolution - V o / V r (mm)
6 6.6 t S.f
F i g u r e 7 : Mean torque as a function of the penetration per revolution of the cutting head in Vosges sandstone.
305
HHIHHmiHJHUKKHIHlHUmiifiHiniHmmU 1
COKSUUAHOH SCH.COVPE 8 LONGUEUR (sur pointes dc pics ) 545 i t
MWBRE D'HELICES ( 1 1 4 ) 2 KOflBRE DE PICS PAR 1.1 EKE 1 NO.IBRE DE LISKES (3 i <OI- 2? Angle d' lndir .a i son it r m i i c e / o i y <'): 15 ' Cote 20 dc depart de l 'HMice ( • • ) : 5.0 Angle P ola i re Ini t ia l C I : 0.0 •
ESPACEKEHT I 2 J 1 5 4 7 8 1 10 11
20 20 20 20 20 20 20 20 20 20 II 12 13 H 15 It -17 18- H 20 21
20 20 20 20 20 20 20 20 20 20 21 22 23 H 25 24 27 28 2?
20 20 20 20 20 20 20 10 \ CERATTEnEKI [>E LA UGNE I : 15 i t
HKismnBmiiiiimiiJiamHiiiisiigiJiiiJiiiiii
Figure 8 : Example of picks lacing data file.
TORQUE
■CkMI. IhO
58
30
10
H 1 1 1 1 1 1 1 1-
H H H 1 1 1 1 1-
0 10 20 30 40 5GI
penetration speed = U p C C IMl/lKll i DTl >
F i g u r e 9 : Example of c u t t i n g c u r v e s .
- 306

FRACTURED ROCK MECHANICS AND THE STABILITY OF MINES
P r o j e c t L e a d e r s : J . P . PIGUET and F. HOMAND I n s t i t u t Polytechnique de Lorraine ( INPL) , School of Mines and School of Geology. France
P. GUSSMANN University of S t u t t g a r t , I n s t i t u t fur Geotechnic. Germany
Contract MA1M-0073-F
1. PURPOSE OF THE RESEARCH
The purpose of this research is the evaluation and development of specific methods of analysis of stability's conditions in fractured rock masses surrounding mine work i ngs.
Furthermore, we are concerned by model I ing methods for jointed rock masses, either affected by natural fracturatI on, or by mining induced fracturation .
2. PROGRESS OF THE RESEARCH
The research has been carried on In the following d i rect i ons:
Achievement of a complete critical bibliographic inquiry and analysis of existing methods (softwares) dealing with "block modeling".
Development of specific tools suited for the purposes of this research and Improvement of existing methods.
Field and laboratory experimentations for collecting data useful for modelling and for model validation.
Application of the previous methodology to industrial s I tes.
A summary of the most significant up-to-date results, concerning each aspects Is following.
3. BIBLIOGRAPHICAL INQUIRY
A clear distinction soon appeared among the preexisting approaches of the problem, I. e
307 -

Methods for static analysis of stability concerning a single block (or very few blocks). Analysis of the behaviour of a blocky system.
In any cases, the necessity of a preliminary geometrical mode I IzatI on ("geo-modeI") emerged. After detailed tests of different available methods (Key Block Theory, Discrete Element Methods...), conclusions were:
to develop our own method and softwares for both "geomodeI IzatIon" and stability of single block using the 3D block generator "RESOBLOK" (HELIOT, 1988) as the starting point. to consider "Distinct Elements Methods" and UDEC software as the most efficient and suitable method for analysis of blocky system. to follow up on the theoretical reflexion and on the adaptation of the "Klnematlcal Element Method, KEM" (P. GUSSMANN) as an Intermediate solution for 2D/3D analysis of several blocks' behavior.
4. DEVELOPMENT OF SPECIFIC METHODS 1. The basis for the development of specific tools, for
single block's stability analysis Is the block generator RESOBLOK. RESOBLOCK Is an Integrated tool for modeling discontinuous rock masses, which reconstructs the three dimensional block structure (written in C language, In UNIX system). The preparation of the Input file enables to record all the geometric characteristics of the rock mass studied (Introduced In a data-processing language specially created for this purpose : the BGL Ianguage).
An Important Innovation of RESOBLOK Is the possibility of 3D reconstruction of a discontinuities network, In relation with the geological sets, or scenarios, for a gIven sIte. The discontinuities may be Introduced In a deterministic or statistical manner. The statistical laws recently Introduced concern the distribution of spacing between fractures and their orientations. According to the choice of the user, the programmed laws, for the spacings, are :
308

- normal law - unI form I aw - exponent I a I I aw - lognormal law.
The statistical law adopted for orientations LANGEVIN-FISHER one.
A special command : Block Stability Analysis (BSA) has been developped In order to detect the removable blocks and their corresponding safety factors.
Confining stresses can be taken into account as well as bolting strenghts.
2. Concerning the behaviour of a blocky system, the choice of Distinct Elements Method has been made after a careful comparison with alternative solutions. (Like a finite element formulation proposed in Australia FEBLK Method).
3. Concerning the Kinematic Element Method, developed by Pr. GUSSMANN (partner In this contract), we had to face difficulties due to the fact that the method has been initially conceived and used for soil mechanics problems. The adaptation to rocks mechanics has been achieved for 2D problems (K2 ROCK software) and compared with other approaches (SARMA).
Some major problems remained, such as traction behaviour of Joints. A 3D version is presently working for soil mechanics and has to be adapted, In the same way, for rock mechanics.
5. DATA COLLECTION AND VALIDATION
Data collection In discontinuous rock masses problems, Is largely determinated by the ability of users to gather geometrical characteristics. This task will be tackled In the frame, of a future contract.
During this research, the characterization of Joints properties to be Introduced In the models has been emphasized. A methodology derived from BARTON'S laws and empirical approaches has been established and led to the determination of shear and normal stiffness of Joints, as well as dilation values.
The validation of these methods has been undertaken, by mean of stress measurements which appeared to be In good accordance with UDEC calculations [see attached pub I I cat Ions].
309 -

6. APPLICATION ON SITES
The fields for applications of these concerned methodologies are up to now :
Under-mined cliffs, along Loire River, An open pit uranium mine, In Massif central (Bertholene, Total Compagnle Mlniere).
Distinct Element Method has been used In the first case and RESOBLOCK + BSA in the second site, always with the perspective of a stability diagnosis.
It can be emphasized that such a methodology can be implemented, for Instance, as a help to choose the best orientation of benches in an open pit, with respect to the natural fracturation.
7. CONCLUSION We can conclude that the research allowed a significant step for the study of fractured rock masses In Mining Industry. Main modelling methods have been Investigated, evaluated, and after conceptual choices, efficient software has been deveIopped.
On the other hand, problems of geometrical and geomechanIcaI data collection has been clearly Identified and an appropriate methodology has been elaborated and tested.
Further developments could be :
Concerning data collection, improvement of the proposed methodology, In order to make it quicker and cheaper (without reducing the reliability).
About model I ing, the progresses to be real I zed concern an introduction of reinforcement with bolts (in particular cable bolts).
8. REFERENCES 1. ASOF M.
"Etude du comportement mecanI que des massifs rocheux fractures en blocs (methode a I 'equl I Ibre I Imlte) realisation et applications" These INPL Nancy, 1991.
310 -

2. BAND IS S.C. "Scale effects In the strength and deformabiIity of rocks and rock Joints. Scale effects In rock masses" Pinto da Cunha ed. , Balkema, Rotterdam, pp. 59-76, 1990.
3. BAROUDI H., PIGUET J.P. & ASOF M. "Utilization of the block generator RESOBLOK to complex geologic conditions In an open pit mine, mechanics of Jointed and faulted rock" Rossmanith ed., Balkema, Rotterdam, 1990.
A . BARTON N.R. & BAND IS S.C. "Review of predictive capabilities of JRC-JCS model In engineering practice" Barton & Stephansson ed., Balkema, Rotterdam, pp. 603-610, 1990.
5. BRADY B.H.G. & BROWN E.T. "Rock mechanics for underground mining" Ed. G. Allen & Unwin, London, 1985.
6. CACHET I. "Mode I I sat ion discontinue des terrains. Amelioration et application du loglclel RESOBLOK" DEA Genie Geologlque et Minier INPL Nancy, Octobre 1988.
7. CUNDALL P.A. "Generalised distinct element program for modelling Jointed rock" Final Tech. Rep. to European Research Office, 1980.
8. GOODMAN R.E., SHI G.H. "Block theory and Its application to rock engineering" Prentice Hall, Inc., Englewood Cliffs, New Jersey, 1985.
9. GUSSMANN P. "Kern in geomechanIcs" Numerical methods in geomechanics (Innsbruck), Ed.Balkema, Rotterdam, 1988.
10. HOEK E., BROWN T., "Empirical strength criterion for rock masses" J. of geotechnlcal engineering division, vol. 106 n° GT 9, sept., pp. 1013-1035, 1980.
11. HOEK E., BROWN E.T. "Underground excavation in rock" Institution of mining and metallurgy, London, 1980.
311 -

12. KABBAJ R. "Traitement statistique de la fracturation. Etude bibIiographique" Rapport Interne CERCHAR-Nancy 89(1)31.71.1111 n°5, 1989.
13. LILL IE F. "Bertholene-gisement des Balaures, princlpales structures et compartimentages des tranches superleures (mco-nlv. 710)" Doc TCM, 1987.
14. RODE "CaractérIsatIon et modélisatlon des massifs rocheux fractures en blocs" These INPL Nancy en Génie Civil et Mlnler. Mai 1991.
15. SOULEY M. "Morphologie des Joints, model isatlon par elements distincts" D.E.A., INPL Nancy, p 118, 1990.
16. STENGER B. "Adaption de la methode KEM aux massifs rocheux" DEA INPL, 1989.
17. V INCHES M. "Application de I'analyse structurale, de la geostat I st I que et de la theorle des blocs c I es a I'etude de la stablllte de massifs rocheux fractures" These Doctorat de I'EcoIe de Mines de Paris, 1988.
18. WARBURTON P.M. "Implications of keystone action for rock bolt support and block theory" Int. Journal of Rock Mechanics, vol 24, n°5 1987.
312
slope
slope
b - Actived blocks
6m
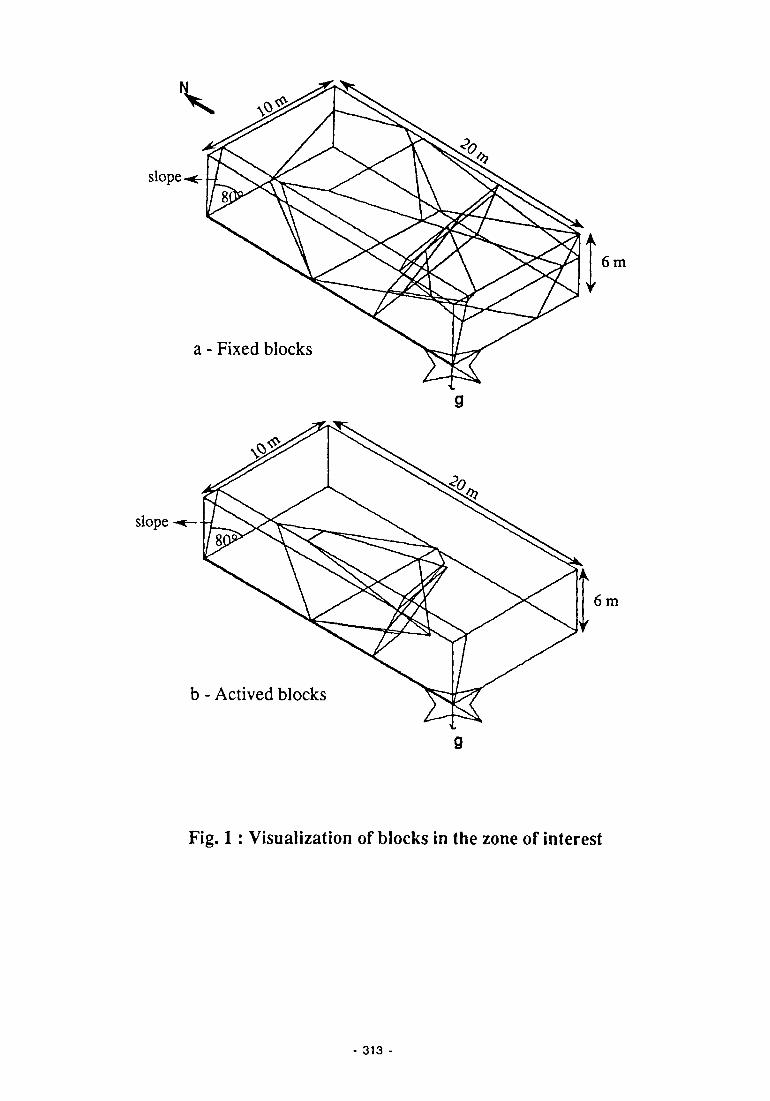
Fig. 1 : Visualization of blocks in the zone of interest
313 -

Dimensions of the bench lenght = 40 m width = 19 m height = 20 m
verage volume (m3)
80
60
40
20
60
ja az. = 40° ->> az. - 50°
S* az. = 60°
70 80 Pendage du gradin (°)
90
Fig. 2 : Average volume of instable blocks as a function of dip and orientation
314

CUT-AND F I L L MINING IN HARD ROCK WITHOUT THE USE OF EXPLOSIVES
P r o j e c t Leade r : C .T . SHAW Imperial College of Science, Technology and Medicine, London,
Department of Mineral Resources Engineering, Royal School of Mines, United Kingdom
S. Durucan Imperial College of Science, Technology and Medicine, London,
Department of Mineral Resources Engineering, Royal School of Mines, United Kingdom
F.L. Wllke, J. Skrzyppek Technische Universität Berlin, Institut far Bergbauwissenschaften II, Germany
J.G. Kelly Ennex International pic. Dublin, Ulster Minerals Ltd., Gortin, Ireland
Contract MA1M-0076-C(H)
1. INTRODUCTION Mechanised mining of underground mineral deposits has had a significant impact on productivity and it has improved the economic viability of many marginal deposits. Total mechanisation of hard rock mines has proved extremely difficult to achieve especially In the field of rock breaking at production stopes. A great deal of emphasis has been given to the development of rock breaking machinery In order to overcome problems of Increasing labour costs and limitations imposed on blasting In environmentally and/or politically sensitive areas.
This report describes the development of mining systems for the recovery of minerals from narrow vein deposits In hard rock without the use of explosives. The research project was Jointly carried out by the Department of Mineral Resources Engineering at Imperial College, London, the Mining Engineering Department at the Technical University of Berlin and the staff of Ennex International (Eire) at Curraghinalt Mine In Northern Ireland.
2. OBJECTIVES The primary objective of this research project was to identify potential rock breaking systems and to develop a stoping method, specifically a cut-and-fI I I method, which could be used to mine hard rock without the use of explosives. Underground trials of proposed rock breaking systems were carried out In the test mine at Curraghinalt.
315 -

The following areas of research were carried out by the research partners:
Identification of rock breaking systems Mining machine trials at Curraghlnalt Correlation of machine performance and rock mass propertIes Investigation of fill materials and fill systems Development of computer models for the analysis of cut-and-fI I I stope stability and economic analysis of the stop Ing operations.
3. POTENTIAL ROCK BREAKING SYSTEMS AND UNDERGROUND TRIALS
A major literature study was completed and this identified the systems felt to have the potential for this research project. The systems Identified for further study and site trials were:
The roadheader - The ralseborer
The Impact ripper Gaseous and chemical breakers such as Cardox and Fosroc
Mine development and stop Ing trials using the above rock breaking systems were carried out at Curraghlnalt during the research period.
3.1 ROADHEADER DEVELOPMENT The Dosco SL120 roadheader which was on the Curraghlnalt mine on a trial basis in 1987 was employed full time for development from March 1988. During the adit development the rock types varied from very soft graphitic pellte (UCS = 13.5 MPa) to extremely hard competent psammlte (UCS = 150 MPa). Advance rates and pick consumption varied accordingly. Best result was 16 metres advanced in one day and no picks changed In 21 metres In the pellte and the worst was 0.5 metres advanced in one day with 70 picks changed in the psammite. Tests were carried out to find the optimum cutting head and cutting pick design; new types of Sandvlk picks, 3 types of Boart picks and a Boart cutting head, Marwln picks and Kennametal picks were tried. Fifty KennametaI U47HD-I00HP picks were tested and these outperformed their closest rivals, the Sandvik W47 4"/64, by 62%.
The total development using the roadheader was: Access Adit 411 metres Drift along the Sheepdlp Structure 23 metres Drift along the T17 Structure 210 metres Drift along the Number 1 Structure 97 metres
TOTAL LEVEL DEVELOPMENT 741 metres
- 316

There was thus access and sufficient tunnel on each of the three structures Intersected for preliminary trial stop Ing tests to be carried out. Statistics for roadheader development for the adit T17 vein, collected on the mine, were as follows:
and the
Adit (2.75m x 2.75m section); Average advance per day Average pick consumption
or 3.82 metres 5.44 picks/metre 0.72 picks/m3
T17 Vein Development (3.0m x 3 Average advance per day Average pick consumption
or
0m sect I on); 1.20 metres 50.0 picks/metre 5.56 plcks/m3
3.2 RAISEBORING RESEARCH
3.3 IMPACT RIPPER TESTS A preliminary stoplng machine trial was carried out using a Rammer S26 rock hammer/Impact ripper mounted on a Bobcat. The Rammer was tested on the Sheepdlp and T17 quartz vein structures and also on the adit face. It proved to be very successful In breaking down the back of the Sheepdlp drift, and It also broke well parts of the quartz vein and wallrock on the T17 structure. However, In the rich sulphide sections of the T17, the point of the hammer drilled holes In the soft material, without breaking the material out. The trial proved that In order to be successful, the hammer should have more energy per blow and should be mounted on a heavier carrIer.
The final stoplng trials were carried out using an 18 tonne WEBSTER In-Seam Series 2000 universal mining machine equipped with a heavy duty Krupp HM550 Hydraulic Hammer. This Impact ripper achieved production rates of up to 8 tonnes/hour In heavily fractured ground and production rates as low as 1.5 tonnes/hour was recorded In non-fractured ground. The Initial stoplng trials using the Webster machine proved uneconomical In non-fractured ground, however, it is be I Ieved that this machine can prove economical If a second free face was created by kerf cutting
317
3.4 CARDOX SHELLS & FOSROC ROCKSPLITTER
These were tested In order to pre-fracture the rock In the adit face, however, neither of these products had any effect on the hard psammlte.
CORRELATION OF MACHINE MATERIAL DATA
PERFORMANCE AND ROCK MASS AND
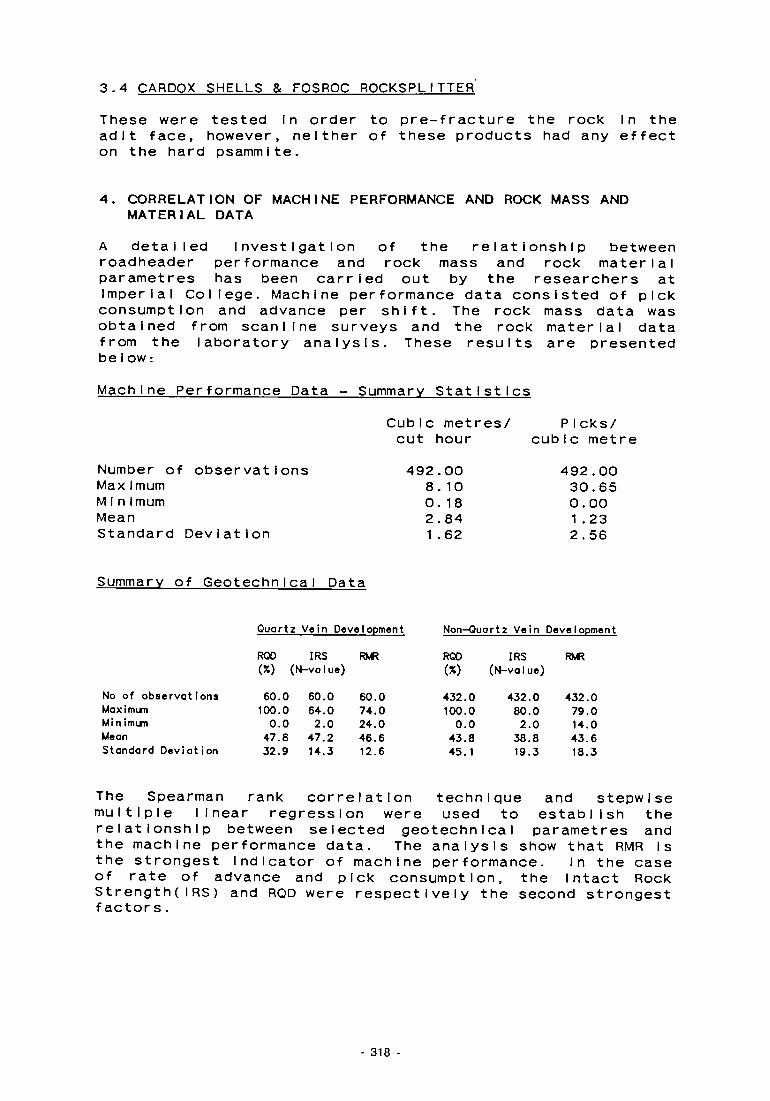
A detailed Investigation of the relationship between roadheader performance and rock mass and rock material parametres has been carried out by the researchers at Imperial College. Machine performance data consisted of pick consumption and advance per shift. The rock mass data was obtained from scanline surveys and the rock material data from the laboratory analysis. These results are presented be Iow:
Machine Performance Data - Summary Statistics
Cubic metres/ Picks/ cut hour cubic metre
Number of observations Maximum MInImum Mean Standard Deviation
492.00 8. 10 0. 18 2.84 1 .62
492.00 30.65 0.00 1 .23 2.56
Summary of Geotechnlcal Data
Quortz Vein Development Non-Quortz Vein Development
No of observations Maximum Minimum Mean Standard Deviation
ROD IRS (%) (N-vaIue)
60.0 100.0 0.0 47.8 32.9
60.0 64.0 2.0 47.2 14.3
RMR
60.0 74.0 24.0 46.6 12.6
ROD <*) 432.0 100.0 0.0 43.8 45.1
IRS (N-value)
432.0 80.0 2.0 38.8 19.3
RMR
432.0 79.0 14.0 43.6 18.3
The Spearman rank correlation technique and stepwise multiple linear regression were used to establish the relationship between selected geotechnlcal parametres and the machine performance data. The analysis show that RMR Is the strongest Indicator of machine performance. In the case of rate of advance and pick consumption, the Intact Rock Strength(IRS) and RQD were respectively the second strongest factors.
- 318

The equations which may be used to predict roadheader performance with the greatest accuracy are:
Ln(cublc metres/cutting hour) - -0.02(RVR) - 0.01 (IRS) + 1 .94 Eqn. 1 Ln(picks/cubic metres) - 0.09(RMR) + 0.02(ROD) -4.69 Eqn. 2
Site Investigations and laboratory testing of samples were extended to ENNEX's Cononish mine in Scotland which Is located In a similar geotechnical setting to Curraghinalt mine at Gortin. In both cases the country rock Is composed of Dalradlan (Southern Highlands Group) metasediments essentially psammltes and semi-pel Ites with quartz vein hosted mineralisation. The results of scan I Ine surveys and laboratory tests are presented below :
Rock Mass Data From Cononlsh Mine RMR IRS RQD
Psammlte 54 44 57 Pel Ite 49 32 45 Quartz vein structure 51 54 50
Summary of Laboratory Test Results (Cononlsh Mine) U.C.S.(IMPO) Issn(KPo) Vp(m/s) Qtz Content (X)
Psommite 79 43 4222 76 Pelite 59 2.9 4353 42 Quartz vein structure 107 5.8 3161 90
Based on the rock mass data from the Cononlsh Mine, the following performance figures are predicted using equations 1 and 2.
Cubic metres/ Picks/ Cutting hour Cubic metre
Psammlte 1.52 3.7 Quartz veln 1.46 2.45 Pel Ite 1.90 1.85
These values are not unreasonable given the rock mass data for these rock types.
319 -

5. BACKFILL TEST RESULTS
A comprehensive series of undralned multistage trlaxial tests were carried out to determine the mechanical properties of classified cemented tailings (-150 /zm. ) and rockflll (-25 mm) for the design of backfill in cut-and-fI I I stopes. The main aim of these tests were to Investigate the effects of cement content (OPC) and curing time on strength characteristics of backfill materials.
Table 1 Young's Modulus, Cohesion and Internal Friction Angle for cemented backfiII materials.
Material Type
Mill taiIings —150/jn w/s=0.40
Rockfill -25mm w/s=0.15
OPC [x] 5 7 10 15 5 7 10
Curi ng [Days]
7 28 7 28 7 28 7 28 7 28 7 28 7 28
Young's Modulus [*Po]
52 63 145 186 200 255 360 400 262 285 340 540 740 985
Cohesion [MPa]
0.40 0.44 0.42 0.52 0.51 0.64 0.88 1.17 2.62 2.80 3.22 3.38 3.35 3.72
Internal Friction Angle [Degrees]
6.2 7.14 6.38 8.27 6.67 8.77 7.60 9.10 7.12 8.10 9.59 12.40 18.55 28.12
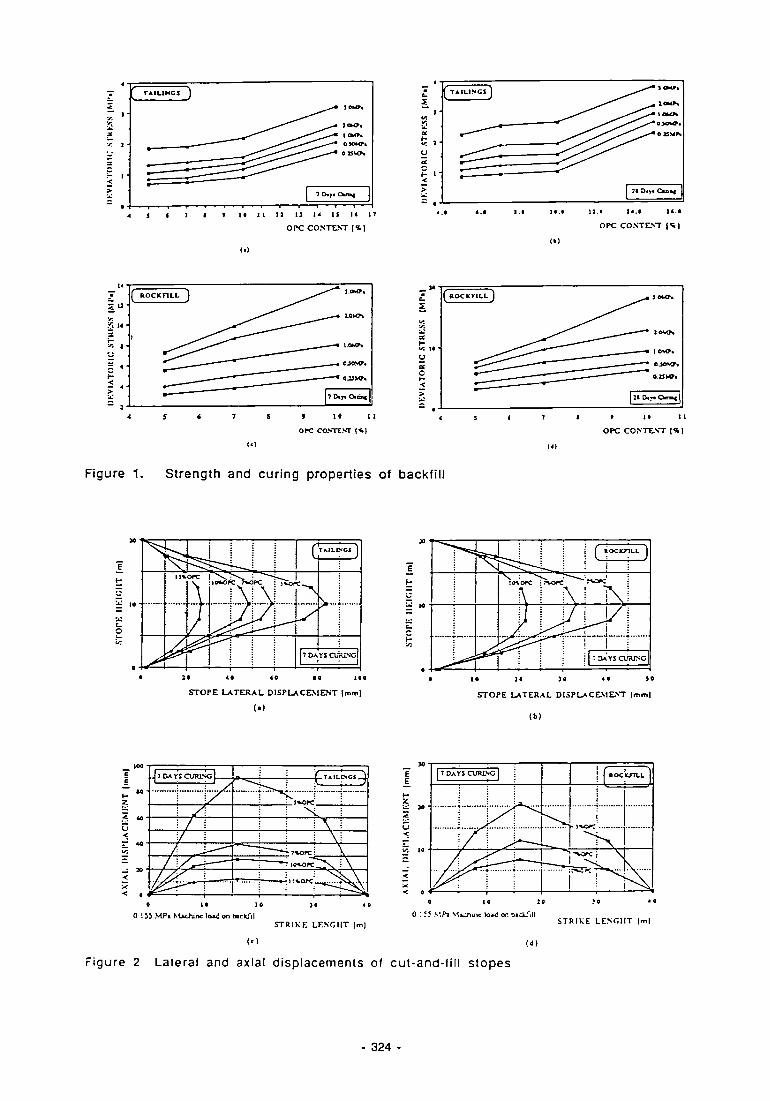
Figures 1(a) to 1(d) show devlatoric stress ( (y1 -| - o~3) versus OPC content at different confining stresses and curing times for the tailings and rockflll. The strength of cemented rockfllls are nearly an order of magnitude higher than those of cemented tailings.
Table 1 shows Young's Modulus, cohesion and angle of internal friction values for various backfill materials at two different curing times. The results Illustrate that as the percentage of cement and curing time of the backf I I I material Increases the young's modulus, cohesion and angle of Internal friction Increases too. In the case of cemented rockfllls, these properties are higher than those of cemented tailings. These investigation has shown that the desired backfill strength of 1.5 to 2.0 MPa can be achieved by using either (I)10%0PC with tailings, (li) 5%0PC with rockflll or (III) a combination of (I) and (II) at 7 days cur Ing time.
- 320
6. EVALUATION OF THE STABILITY AND SUPPORT CHARACTERISTICS OF BACKFILL IN CUT-AND-FILL STOPES
Stability and support performance of the backfill materials In the stopes were analysed using a computer model based on the Finite Element Method(FEM).The capability of the original code developed by Goodman (JETTY) was extended by additional modules developed at Imperial College (TWOFFIL) In order to meet the specific requirements of cut-and-fI I I applications at CurraghinaIt.
The analysis of lateral and axial displacements and the stresses on the backfill In cut-and-f I I I stopes using the Finite Element code showed that 10% and 15% OPC with taiIings and 5%, 7% and 10% OPC wlth rockf ill are all stable backfill materials In terms of stope displacements and the allowable stresses. Therefore, 10%OPC with tailings and 5%0PC with rockfill were chosen as the most economical backfill materials. Figures 2 (a) to (d) present the findings of the Finite Element analysis.
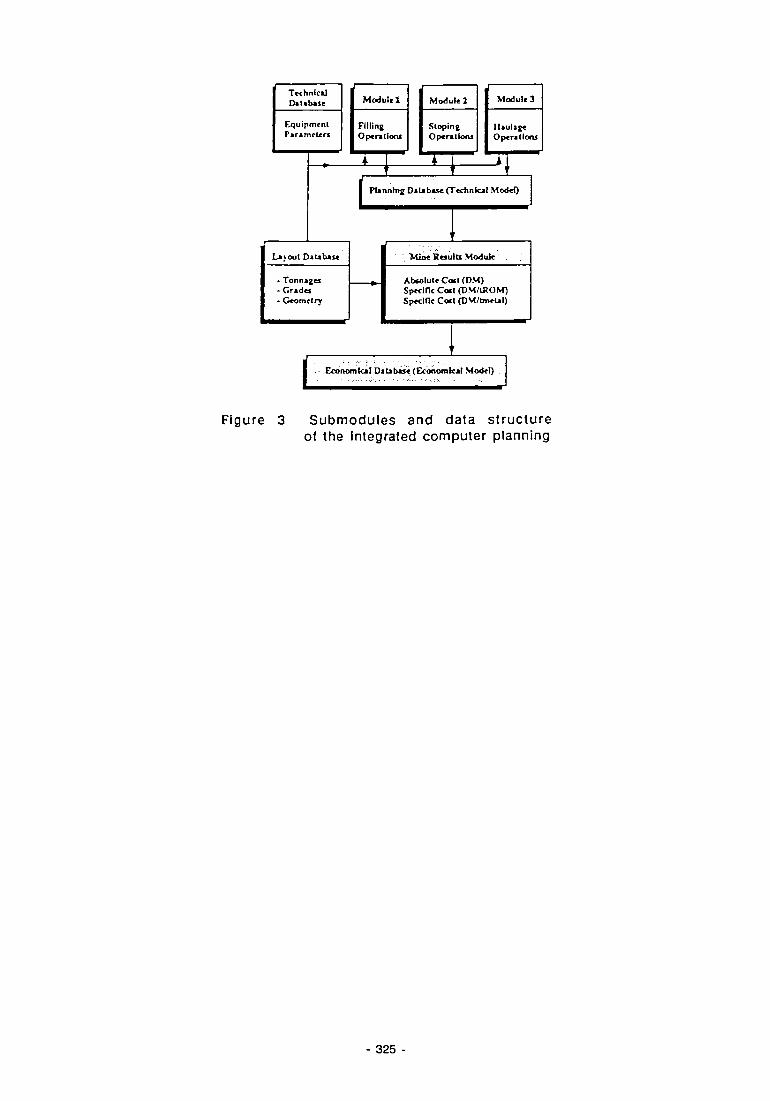
7. SELECTION OF AN OPTIMAL MINING SYSTEM
Economic analysis of the mining layout and stoping, hauling and backfilling for mechanised cut-and-fiII operations were conducted using an integrated computer based planning system developed by the Technical University of Berlin. The modular structure of the computer program Is shown In Figure 3. Economic analysis have shown that a combination of mechanical and hydraulic systems for transporting and emplaclng the rockfill and the tailings would yield the optimum production conditions together with the selected stope layouts and mining techniques at Curraghinalt mine.
8. CONCLUSION In-sltu trials of different rock breaking systems and research carried out on the relationship between machine performance and rock mass and rock material parametres has shown that It Is possible to develop an equation to predict machine performance from standard rock mass measurements. These equations were applied to the rock mass data from Cononlsh mine and machine performance was predicted. This suggests that the scheme can be app I led to other mines in the future.
The Investigation Into mechanical properties of backfill materials has shown that cemented tailings (-150 fim. ) and rockfill (-25mm) can successfully be used as stable backfill materials at Curraghinalt Mine. Computer models of the Cut-and-FIII stope layouts and mine planning systems were
321 -

developed at Imperial College and Technical University of Berlin. The stability of backfilled stopes were analysed and optimum mining, fill transport and emplacement techniques were selected for the test mine at CurraghInaIt.
In-sltu stoplng trials with the WEBSTER Impact ripper showed that a combination of an Impact ripper and a kerf cutting machine (probably a diamond wire saw) can be an economical method for the mechanical mining of hard rock.
9. BIBLIOGRAPHY Backfill In South African Mines - The South African Institute of Mining and Metallurgy, Special Publications Serles SP", 1988
Bien IawskI, Z.T., Engineering rock mass classification, John Wl I ley &sons,1989.
Clarke, I.H., Numerical modelling as a basis for evaluating the effectiveness of backfill as local support in deep mines , 4th. Int. Symp. on mining with Backfill, MontreaI,1989
Durucan, S. Cut-and-fI I I mining In hard rock without the use of explosives. 2nd Seminar on Mining Technology, Santiago de Compostela, Spain, CEC DGXI I , October 1990.
Gerstein, D., Herrmann, M. and Wllke, F. L., Planung von abbauverfahren und abbaureIhenfoIge fur den metaI IerztIefbau mit CAD, XXII Internationales Symposium APCOM, 1990, Berlin, Band II, S. 39-50.
Gerstein, D., Computer aided design fur grubenbetrIebe des metaIlerztlefbaus - Erzmetall 43, Nr. 4, 1990, S. 162-167.
Goodman, R.E., Methods of geological engineering in discontinuous rocks, West publishing company, St.Paul, New York, Los Angeles, San Francisco, 1979
HarnIschmacher, K Nelles, P.-L., Bessere ausnutzung von vorraten durch anwendung von magerbetonversatz In flacher, genelgter und steiler lagerung auf den gruben der "Sachtleben" Bergbau GmbH, Erzmetall 38, Nr. 9, 1985, S.411-418.
Helms W., Einflusse auf die festlgkelt- von felnkornlgem versatz mlt bIndemItteIzugabe - Unter- suchungen und ergebnlsse des auslanischen erzbergbaus. Erzmetall 35, Nr. 5, 1982, S. 26 - 271.
Helms W., Preparation and transportation systems for cemented backfill - IV Mining Science and Technology 7, Elsevier Science Publishers B.V., Amsterdam, 1988, pp. 183-193 .
322

I.S.R.M. Suggested methods, Rock characterisation testing and monitoring , Editor Brown, E.T. Koch, G.and Fink, R., Statistical analysis of geological data , Dover, New York, 1980 Lange, J., Die vorbereltung elnes wasserarmen versatzgutes aus schwlmmbergen und fIotatIonsabgangen fur das pumpversatzverfahren - Erzmetall 35, Nr. 3, 1982, S 117-124. Lerche, R. & Reneteder, H., Die entwlcklung des pumpversatverfahrens fur das erzbergwerk grund - Erzmetall 37, Nr. 10, 5, 1984, 494-501. Mining with Backfill - Proceedings of the International Symposium on Mining with Backfill / Lulea / 7-9 June 1983, A.A. Balkema Rotterdam, 1983 Pickering, R.and Haase, H., Non-Explosive mining for South African gold mines, Chamber of Mines of South Africa Research Organisation, 387, GS3M, January 1987. Rohlflng, J., Versatzverfahren Im deutschen metaI Ierzbergbau - ErmetalI 39, Nr. 11, 1986, S.541- 546. Shaw, C. T. Future developments in stop Ing methods with special reference to non-explosive methods of mining underground. Leobener Bergmannstag, Sept. 1987. Shaw, C. T. Cut-and-fI I I mining in hard rock without the use of explosives. 1st Seminar on Mining Technology, Gorlzla, Italy, CEC DGXI I , March 1989. Tesarlk D.R., Seymour J.B., Vlckery J.D. Instrumentation and modelling of the Cannon Mine's B-North ore body, 4th Int., Symp., on Mining with Backfill, Montreal, 1989. Thomas E.G. Fill technology In underground metalliferous mines, International Academic Services Ltd.,KIngston, Ontario, Canada, 1979. Zienklewicz, O.C.The Finite Element Method In Engineering Science , McGraw-Hill Publishing Company Ltd.,1971.
323 -
- I — ■ — I — ■ — r - —i—■—i—■—i r-
4 i < 7 I » II II i : 1J 14 1! U 17
O PC CONTENT 1*1
A •
s 1 '
£ (X
U tx
c < >
{ TAILING] D ^f*-* K M F ,
^*****^ ^m ! • « * * ^***^ ^**\**^* ' *»«*»
^ - ^ * ^ ^ * * ^ ^-
0 iOfcff •
_^****\,<>*^\*^*\^* ° BM
*»
1 :t o*r*CksH j
OPC CONTENT | 1 |
1 4 -
U '
1« '
I -
« .
f ROCKF1LL J ^ ^
) ^******"^^-***~~~'
-**"* l .MTt
._—• 1.0WJS
——■ I.OMPt
. « CSOMJS
• 0J3MP*
1 D*p Cam*
» 10 II ore co.sTt.vr i v
( t tOCKnU. )
» i t u OPC CONTEXT | « ]
Figure 1. Strength and curing properties of backfill
STOPE LATERAL DISPLACEMENT (mm)
(•)
X «
— ! „ . . . . —
Jff%0fC
■y£^*
7 W C
j f tOCKTILL 1
! 1 j
\ ! "A. -\ : t \ -
J | l/i i 1 i j | T a * YS CURING |
. i
■• I f 3« « l SO
STOPE LATERAL DISPLACEMENT l<i"n|
(b)
0 I 55 MPi Ktichinc loxj on bocW.I STRIKE LF.NOIIT |m|
E E ^-2 U 30 '
0 <
< < 0 *
1 7 DAYS CURING 1
- j - !~-~^j*>^
AA^X^
1 1
j
i
1 ROCK/ILL
H ^ " ^
0 1 J 5 V.PJ MiJimc load or. bJd/ill STRIKE LEN011T |m |
<') («) Figure 2 Lateral and axial displacements of cut-and-fill stopes
324 -
Technical Database
Equipment Parameter!
La)out Database
- Grades • Geometry
Module 1
Filling Operations
4
Module 2
Sloping Operation*
i
Module 3
Haulage Operations
k r
1 Planning Database (Technical Model)
*' :; Mine Rejultx Module
Abcolute Cost (DM) Specific Coil (DM/ lKOM) Specific Coil (DM/tmtUi;
Economical Database (Economical Model)
Figure 3 Submodules and data structure of the integrated computer planning
- 325


RESEARCH AREA 5.2
ROCK MECHANICS AND STABILITY SUPPORT SYSTEMS

CATACLASTIC-PLASTO-ELASTIC EQUILIBRIA IN BRITTLE ROCK UNDER TRIAXIAL DIFFERENTIAL
LOADING CONDITIONS
Project Leader: J.P.A. ROEST, W. KAMP H.C. HelIbron
Delft University of Technology, Foculty of Mining ond Petroleum Engineering, Loboratory for Rock-Mechanics, Delft, Netherlands
Houilleres du Bassln du Centre Midi (HBCM), France
Contract number: MA1M-0018-NL(GDF)
1. INTRODUCTION
The research project "CatacIastIc-PIasto-EIastIc equilibria in brittle rock under triaxlal differential loading conditions" was carried out by Delft University of Technology in the Netherlands in cooperation with the coalmine of Houilleres du Bassin du Centre Midi (HBCM) In France with financial support from the European Community in the framework of the program "Primary Raw Materials" during the period from February 1988 to February 1991.
The main topic of this research is the study of fracturing behaviour of rock and rock masses In relation to the stability of mine openings. Material properties are Investigated including the strain softening and volumetric behaviour of rock. Understanding of the occurring deformation mechanisms is Important when translating laboratory data (rock properties) Into In-sItu data (rock mass properties). By Introducing the thus developed stress-strain relations Into finite element or finite difference calculations the forecasting value of numerical simulations concerning the rock around mine openings can be Improved.
The general outline of the research project was as follows: Conventional test series (uniaxial and conventional triaxlal) were carried out to provide a.o. reference data. However, of greater Importance were the sophisticated true triaxlal test series that were carried out to study complex material behaviour including post failure behaviour. Cubes with edges of 105 and 115 mm of different rocks are tested and properties and failure mechanisms are studied under several true triaxlal loading conditions. The samples were deformed far Into the plastic range. The results of the tests are, adapted to rock mass behaviour, Introduced Into numerical simulation calculations In order to verify the applicability of the complicated material behaviour observed In the tests.
329
Also calculations are made concerning the underground situations at HBCM. Here the rock mass properties have to be based on a limited number of tests (the material is not very suitable for testing or poorly accessible) and on Investigation of the deformation mechanisms. The results of these calculations are compared with measurements and observations carried out in this mine.
The main part of the work was carried out In the laboratory for rock mechanics in Delft, using Its testing facilities, Including the true trlaxlal compression machine. The computer facilities of the Delft University were used for the numerical simulations. HBCM provided the Important in situ measurements and observations regarding rock-mechanical conditions of mine openings and the surrounding rock masses to which the numerical simulations were applied.
As can be foreseen, this type of research will be continued by Delft University with other mines In Europe as partners. In this way the research will gradually change from fundamental (university) research to more practical (industrial) applications.
SUMMARY
True triaxial tests. Experiments are carried out with a unique true triaxial compression machine, provided with a very sophisticated measuring system and force control system. Several modifications of this machine and the measurement system have been carried during the course of this project allowing for fully automatic test procedures and Improved quality of these tests. Also greater ease to carry out these tests is realized. Series of tests have been carried out on different materials. Especially the series of tests on Felser sandstone was of Interest where the entire yield envelope was investigated and the post failure behaviour studied with different loading paths Including strong plastic deformatIons.
Numerical simulations. Mainly finite difference calculations have been carried out concerning simulations of rock and rock mass behaviour In different situations: - Sample behaviour under testing conditions.
330 -

The behaviour of severely converging galleries In HBCM. The behaviour of the entire rock mass from surface down to the bottom of a 40 m thick coal layer at 700 m depth In HBCM. A large volume of coal Is extracted causing strong deformations, stress redistributions In the area and surface subsidence.
Measurements and observations In the coalmine of HBCM. To provide Input parameters for the numerical simulations and also to provide verification possibilities to control and adapt the quality of these simulations several measurements and observations are carried out in this mine. Geometrical data: - Maps and cross-sections of the mining area.
Data about excavated volumes.
Geological Information. Convergence measurements In three galleries. Absolute displacement measurements In one gallery. Water Injection measurements In one gallery. Pressure measurements in the support cylinders of a longwall face. Surface subsidence measurements.
Several reports and publications have been written dealing with Information generated during the project. A list is given at the end of this report.
3. LABORATORY EQUIPMENT
For the uniaxial and conventional triaxlal tests several uniaxial compression machines are available in the laboratory as we I I as a modified type of Hoek-cel I . For the true triaxlal tests a unique machine Is available for this type of testing.
During the project several modifications and Improvements have been Implemented In the laboratory facilities, especially for the true triaxlal compression machine. This allowed for sophisticated test procedures and high quality test results.
The improvements of the laboratory facilities consist mainly of the replacement of the force control unit of the true triaxlal compression machine and the Improvements of the equipment that carries out the several measurements during the tests. During the project It became possible to perform fully automatic computer controlled loading sequences Including backfeed from the deformation measurements. Also the measurements of the forces, deformations and acoustic velocities are carried out and registered fully automat IcaI Iy.
331 -

3. 1 GENERAL DESCRIPTION OF THE TRUE TRIAXIAL COMPRESSION MACHINE
The machine consists of three uniaxial compression systems In perpendicular directions so that cubic samples can be compressed. Each of the uniaxial systems consists of a piston with pressure platen at one side and a pressure platen at the other side, connected with four tension bars. The three uniaxial systems can slide relative to each other. In this way friction on the sample surfaces is avoided. During the project spherical seats were constructed at five of the six sides (the bottom side Is fixed). These allow for small rotations of the pressure platens, resulting in a homogeneous stress distribution on the sample surfaces. The samples have to be a few millimetres larger than the pressure platens to avoid touching of the pressure platens of perpendicular directions when the sample deforms. This results in small stress free corners of the cubical samples. The forces In the three directions can be steered Independently with servo-controlled oil pressure In the three cylinders. During the project this system has been fully computerized. Complex loading paths can be programmed and are then followed automatically. SpecifIcatIons: Maximum force: 3500 KN Minimum force: 5 KN Accuracy: 3 KN Maximum sample size: 300 * 300 * 300 mm (maximum stress 39
MPa) used mostly for model tests
Other sample sizes: 115 * 115 * 115 mm (maximum stress 265 MPa) 105 * 105 * 105 mm (maximum stress 317 MPa) 74 * 74 * 74 mm (maximum stress 639
MPa) used mostly for material tests
Force control: Fully computer controlled
3.2 TESTING POSSIBILITIES WITH THE TRUE TRIAXIAL COMPRESSION MACHINE
Mater i a I tests: Elastic moduli, polsson numbers, ultimate strength (yield envelope), non-linear (post failure) behaviour can be analyzed using complex loading paths. Backfeed of the deformation measurements Is possible allowing for strain controI Ied tests.
332
Model tests: Several possibilities exist for model tests Including special measurements like the convergence of a hole through the cube, temperatures etc. Since this has not been relevant for this project It Is not further described.
3.3 MEASUREMENTS Forces. The applied forces on the sample are steered by servo-controlled systems. The actual values are also available for regIstratI on. DeformatIons. The relative displacements of the opposite surfaces of the sample can be measured, after Improvements realized during the project an accuracy of a few microns Is reached. For this purpose a system Is constructed Inside each pressure platen which brings the displacement of the surface of the sample outside the pressure platens without being disturbed by deformation of the platens. Linear voltage displacement transducers are placed between the systems In opposite pressure platens so that deformations of the sample In three directions can be measured. Acoustic velocities. The six pressure platens can contain pIezo-eIectrIc transducers for transmission or detection of acoustic P-waves. The automation of this system has been completed during the project. The system that carries out these measurements Is described In chapter 6.
4. UNIAXIAL AND CONVENTIONAL TRI AXIAL LABORATORY TESTS Throughout the project several tests of these types have been performed for the following purposes:
Supply reference data about cohesion and Internal friction for the true trlaxlal tests. Testing the several measuring techniques (deformation as backfeed for force control, acoustic measurements, etc) . Supply Input data for the numerical simulations (e.g. tests on coal that is not suitable for true triaxial test Ing). Supply Information about the Influence of the shape of the sample on the measured properties.
333

For a large series of tests Felser sandstone samples are used. This highly homogeneous material, which Is available In large quantities, Is moderately brittle and therefore very suitable for this type of research. The strain softening has to be followed by the testing equipment which Is difficult with extremely brittle materials like granite. Tests have been carried out as well on other materials like marble, granite and coal from Blanzy.
Uniaxial tests are performed on samples with several different Length/Diameter (L/D) ratios, to study Its influence on strength and strain-softening behaviour. The tests are necessary to establish a relationship between uniaxial material properties (normally obtained from samples with L/D=2) and those obtained from true trlaxlal tests which can only be performed on cubical samples (L/D=1).
The conventional trlaxlal tests are performed to obtain values for the cohesion and angle of friction. These tests are carried out in a modified type of a Hoek-cell. Because it Is rather laborious to carry out experiments in this apparatus the number of conventional trlaxlal tests is IImlted.
4.1 RESULTS OF UNIAXIAL TESTS ON FELSER SANDSTONE
Uniaxial tests are carried out on samples with a diameter of approx. 40 mm, the length varying between 20 and 200 mm In steps of 20 mm. During the tests data are collected on the longitudinal and transversal deformation and P-wave travel t ime.
- Strength In samples with a L/D ratlo=1, the observed strength is some 15 % higher than with the standard L/D=2 ratio. Softening behaviour Is more gradual with the shorter samples. At low stresses, a typical very low lateral strain is measured.
- P-Wave Measured P-wave velocities at zero stress are around 2700 m/s. The longitudinal velocity Increases significantly to 3500 m/s at 90 % of strength because of compaction. The transversal velocity Is approx. constant to 50 % of strength, after which it decreases due to the development of vertical primary fractures.
- Young's modulus, Poisson ratio, P-wave velocity. From the stress-axial strain and stress-lateral strain curves the deformation modulus and poisson ratio can be determined (9 GPa and 0.1 respectively). When these values are used as the elastic parameters a theoretical acoustic P-wave velocity can be calculated as 2045 m/s. This Is much lower than the velocity
334 -

measured In reality. This can only be explained If It Is assumed that the Felser sandstone shows plastic hardening right from the beginning of the test. In this case there Is a significant difference between Young's modulus and deformation modulus.
By combining the results of the uniaxial tests and the conventional trlaxlal tests, the cohesion and the angle of friction are determined. In two tests multiple loading runs are made under Increasing support pressures. The strength might decrease during each loading run which Is continued to Just over peak strength. The results for cohesion and angle of friction are well In accordance to those with a single loading run. Also the decrease of the peak P-wave velocities with each loading run is clearly visible, supplying Information of the sample's disintegration process. The results from tests on Blanzy coal samples are not representative for the overall rock mass properties because only the stronger samples could be transported and prepared for testing. The angle of friction found In the tests is possibly correct but the cohesion has to be reduced considerably before it can be used as an Input parameter for the numerical simulations.
5. TRUE TRI AXIAL LABORATORY TESTS In an early stage of the project a sma I I series of true trlaxlal tests was carried out. Meanwhile the improvements of the true trlaxlal compression machine were being planned and It was decided to carry out the large series of tests after completion of these improvements. The series of true trlaxlal tests could therefore be completed In a later stage of the project with improved quality.
The improvements also resulted In a greater ease with which the test series can be carried out. In the current situation It Is less laborious to perform a true trlaxlal test than a conventional trlaxlal test in the pressure cell. A moderately brittle material was chosen (Felser sandstone) to carry out a large series of tests and to investigate Its behaviour (elastic, failure and post-failure) under many different circumstances. Each of the tests included three main parts: 1. Elastic behaviour before plastic deformation. 2. Strong plastic deformation. 3. Elastic behaviour after plastic deformation. The elastic behaviour (including anisotropy) Is Investigated before and after plastic deformation by a specially developed series of stress loops (variations of x, y and z). The stress path which Is followed during this procedure
335

remains well within the failure envelope. From the deformations that are automatically measured and registered during this procedure the parameters of the generalized Hooke's law for orthorhomblc anisotropic material can be obtained. See also chapter 6.
After the first series of stress loops the loading condition is brought back to hydrostatic and set to the desired value. Now the system switches automatically from stress controlled to the mode where the strains are used as backfeed. In the ll-plane ( x+ y+ z = constant) z is Increased (softening controlled) with a constant strain rate in this direction. The other two stresses are controlled In such a way that the loading condition remains in the ll-plane under the chosen angle of similarity. In this way the yield point Is found and the deformation Is continued until 5 % linear strain Is reached In one of the directions.
By combining all the tests the entire yield envelope can be constructed, Its shape appears to be In between parabolic Mohr-Coulomb and parabolic Drucker-Prager criteria. Two types of non-associated flow are found during the strong plastic deformations. The volume decreases until the ultimate strength Is reached. During strain softening a volume increase Is found. During further plastic deformation the volume decreases again, this last phenomenon is Influenced by the stress free edges through which material Is lost.
Fracture patterns are also studied In the deformed samples after the tests. During strain softening the sample changes from a homogeneous material into a construction of intact parts and broken (shear) zones.
6. ACOUSTIC P-WAVE VELOCITY MEASUREMENTS DURING TESTS
During most of the tests of all types automatic measurements have been carried out of the travel times of transmitted acoustic P-waves In different directions through the samp Ies. Plezo-electrIc transducers are built In the pressure platens of the uniaxial compression machine, the conventional trlaxlal cell and the true triaxial compression machine. Also transducers can be glued on the sides of cylindrical samples for horizontal velocity measurements, this Is only done In a few tests because the procedure Is rather laborious and the transducers are often lost after the test. After several modifications carried out during the project the set-up of the laboratory equipment for these measurements Is as follows:
336

A PC controlling the system and collecting the measured data. A pulse generator generating electric pulses of a few volts and a few microseconds duration, It Is triggered by the PC. A pulse amplifier to amplify the pulses to 300 volts. A pulse modifier for conditioning the pulses. A remote controlled switch box to select one of the transducers as sender (connected to the pulse) and one as receiver (connected to the amplifiers for further hand I Ing). Amplifiers. The received signals are amplified before they are digitized. The gains are remote controlled by the PC. This can be done when switching the channel selection. Acoustic waves have often different attenuation In different directions, the PC detects this and sets the optimal amplification factor. Digitizer. The received signals are digitized with very high frequency (e.g. 10 MHz) and transferred to the computer.
The PC operates the system and receives the digitized signals. The first arrival of the acoustic wave Is detected with a picking program supplying the travel times. By dividing the measured travel times by the path length (sometimes significantly changing during the test which can be corrected for) the velocity is obtained.
By combining the elastic properties, Including anisotropy In some cases, and the density with the equations of motion, expressions are found for the theoretical acoustic velocities. These values are compared with the actually measured velocities and It Is often found that actual velocities are higher. This difference indicates that plastic deformation already occurs at an early stage before failure. During the failure and strain softening the elastic properties cannot be derived from the stress-strain curves which are dominated by the plastic component of the deformation. However, the acoustic measurements are continued and supply information about the changing elastic properties. The Increase of the velocity observed during loading Indicates that microcracks are closing. Decrease of the velocity In lateral direction at higher loads Indicate the development of new cracks before failure. In true trlaxlal tests Induced anisotropy Is observed during devlatorlc stress, the velocities become equal again (Isotropic) when returning to hydrostatic stress, although the material Is strongly deformed.
7. OBSERVATIONS AND MEASUREMENTS IN LES HOUILLERES DE BLANZY
This mine, partner In this project, carried out many measurements and observations. Some were standard procedures and some were especially carried out for the benefit of this research project.
- 337 -
From the various measurements and observations a selection was made of those data that were of Interest to the project.
Geometrical data: Maps and cross-sections of the mining area. Data about excavated volumes.
Geological Information. Convergence measurements in gal lery Germalne I I . Absolute displacement measurements In gallery Germaine Water Injection measurements In gallery Gilberte II. Observations In panel Amont II.
Convergence measurements In the head and gaIIeries. Pressure measurements In the support cylinders.
Surface subsidence measurements.
I I
ta
The most Important Information that served as Input data for the numerical simulations concern the shape of the excavated area and the geological units situated around It. From the production figures and the surface area of a production panel an average excavated height could be calculated. The measurements of a.o. convergence and pressure, are mainly used to verify the results of the calculations. Directed adjustments of the Input data for the calculations are made, depending on how (well) the calculated behaviour corresponded with the observed underground phenomena. For this purpose the surface subsidence measurements provided reliable data which were used to derive the behaviour of the overburden of which no samples were available for testing.
8. NUMERICAL SIMULATIONS 8.1 NUMERICAL SIMULATIONS OF THE BEHAVIOUR OF ROCK AND ROCK
SAMPLES UNDER TESTING CONDITIONS From the test series (uniaxial and true trlaxlal) on Felser sandstone detailed information Is obtained about the behaviour of this material under various loading conditions including the post- failure behaviour and volumetric strain. The possibilities are Investigated of implementing such material properties in numerical simulations. This is done by simulating the behaviour of a sample during a test. Parameters can partially be derived directly from the test results, partially they are, at first, estimated and later adjusted by trial and error to obtain finally a correct simulation of the material behaviour.
- 338
The finite difference program FLAC has been selected for these simulations because It Is capable to handle very sophisticated material models which Is necessary. The parameters that are used for the simulation of the behaviour of Felser sandstone are: - Young's modulus - Polsson ratio - Cohesion as a function of plastic strain. - AngIe of frlet Ion. - Dilation angle as a function of plastic strain.
* In FLAC the shear modulus and the bulk modulus are used, but these can be expressed In the Young's modulus and the Polsson ratio. The program allows for several other options for material properties but these were not considered relevant In these sImuI at Ions.
8.2 NUMERICAL SIMULATIONS OF EXCAVATIONS AT LES HOULLIERES DE BLANZY
Two types of models have been calculated.
1. The behaviour of severely converging galleries. The strong convergence of galleries Is a serious problem In this mine. The cross section of galleries, entirely surrounded by coal of poor mechanical conditions, reduces to sometimes half of Its original size. Analytical as well as finite difference calculations have been made to simulate this behaviour. 2. The behaviour of the entire rock mass around a long-wall caving panel that Is excavated. A number of calculations are carried out of the stress redistributions and deformations around the excavated panel Amont I. The phenomena observed In the mine that could be used to verify the quality of the numerical simulations are the f oI IowIn g:
In the development galleries of the new panel Amont II, adjacent to the excavated panel Amont I, convergence is monitored. In the tall gallery (Gabln) Immediately adjacent (3-5 m) to the collapsed goaf of Amont I, much less convergence was observed than In the head gallery (Guy) 140 m away. During development of the break-through where the face was to be Installed, rock-burst like phenomena were experienced, Indicating local stress concentrations at some distance from the excavated area. The goaf totally collapses, this Indicates that there are strong deformations In the rock mass overlaying the coal. This finally results In significant surface subsidence which was also measured and compared with the numerical simulations.
339
A total of five models have been Investigated, with stepwise Improvement In matching the observed phenomena In the mine. The models differ In mechanical behaviour of the rock masses, geometry and boundary conditions. Continuously measurements and observations were collected In the mine providing information for updating the models. The latest model, showing the most realistic simulation of the situation Is described below.
The model Is a cross section through the area of panels Amont I and I I, Amont I was excavated with a longwal I caving method and a volume of 1.13 106 m 3 was extracted. The width of panel Amont I (length of the face) was 120 m. The coal layer has a thickness of 40 m of which the upper 32 m Is extracted. The panel Amont II is to be extracted Immediately adjacent to Amont I. The bottom of the coal layer is In fact Irregular but since no significant movements in the floor occurred this could be modeled as horizontal. The rock mass Is modeled entirely from surface down to the bottom of the coal layer at 700 m depth. In this way the deformations of the entire overburden are simulated and surface subsidence Is calculated. The left boundary is a vertical symmetry line through the center of panel Amont I, the horizontal displacements are fixed to zero (ux=0). A displacement boundary condition also applies for the right boundary of the model which Is far away from the excavation (ux=0). The lower side of the model Is fixed to correspond with the strong rock (non-deforming sandstone layers) underlying the coal (u x=u y=0). The model Is 1200 m wide, from the center of panel Amont I. It appeared from preliminary models that this size was necessary to Include an undisturbed area. Based on experience In the mine the Initial opening Is trapezium shaped, base width 120 m, with the sldewalls Inclining 55° (from the horizontal). The excavation Is modeled with a stepwise reduction of pressure on the Inside of the opening until the opening totally collapses. The roof, sidewall and floor of the opening are modeled as Interfaces allowing for a correct simulation of the coI I apse. The initial vertical stresses follow from gravity (g=9.81 m/s 2, density of overburden 2200 kg/m3 and coal 1400 kg/m 3). Initial horizontal stresses are chosen equal to the vertical stresses. Preliminary calculations with lower Initial horizontal stresses (according to the plane strain assumption, ???) appeared unrealistic.
Rock mass properties of the overburden: Young's modulus E=20 GPa, Poisson ratio =0.25. Mohr-Coulomb yield criterion with zero cohesion with an angle of friction of 30°. Non-associated flow rule, angle of dllatIon 10°.
- 340

In fact little was known about the overburden properties, the low strength was based on geological Information and the fact that several excavations took place In the past at shallower depths causing deformations. The measured surface subsidence provided Important Information for adapting the properties until these data were matched.
Rock mass properties of the coal seam: Young's modulus E=4.2 GPa, Polsson ratio =0.29. Mohr-Coulomb yield criterion with strain softening. Cohesion Initially 2.33 MPa, reducing to zero. Angle of friction Initially 40°, reducing to 28°. These parameters correspond with an uniaxial strength of 10 MPa, reducing to zero. Non-associated flow rule, angle of dilation Initially 60° reducing to 0°. This material model Involves strong volume Increase during failure and further plastic deformation without volume change. The properties of the coal are based on laboratory data and also compare with the simulations of converging galleries. Mechanisms of deformation and failure play a role when adapting the model and the material behaviour. These mechanisms are also studied In the laboratory.
Important results of this simulation are: An area of broken (softened) coal adjacent to the excavated panel. This area Is destressed and the tall gallery (Gabln) Is located In this area. This explains that less convergence of this gallery is observed than In galleries In undisturbed areas. A slight, wide spread stress peak In the location of the head gallery (Guy). This explains the very strong convergence that this gallery Is suffering. The result of the simulation corresponds with both the measured surface subsidence and the width of the subsided area. Modelling appears to be a useful tool to obtain better Insight in the mechanical behaviour of the rock masses surrounding the mine openings.
9. CONCLUSIONS
1. All of the topics described In the technical annex are carried out and the project Is completed as planned.
2. Much was and Is still learned from the activities In this project like (true trlaxlal) testing of rock, Implementation of complicated constitutive relations In numerical simulations, comparison of calculation results with underground observations etc.
3. Interesting possibilities exist to assist mine planning with geomechanIcaI numerical simulations. In the long term Improvements can be realized to reach safer and economically more beneficial mining.
341 -
4a. It Is very complicated to set up consistent theories explaining deformations of rock masses around mine openings, based on fundamental fracture mechanical processes,
4b.
10. LIST OF PUBLICATIONS This list Includes the progress reports, papers, Internal reports and theses of students that were produced by people working on the project. It also contains two papers that are to be published later this year.
Kamp, W. and Roest, J.P.A. CataclastIc-Plasto-Elastic equilibria In brittle rock under trlaxial loading conditions. First progress report. Delft, January 1989. Mastrigt, P. van. Implementation of a set-up for ultrasonic monitoring of rock samples under stress. Addendum. Internal report, TUD, January 1989. Kamp, W., Roest, J.P.A. and Cockram, M.J. Summary of the project CPE-equI I IbrI a. Gorizia, March 1989. Kult. C D . Switchbox voor het schakelen van pi zo elektrische transducers. Internal report, TUD, May 1989. Kamp, W., McConnell, A.-M. and Cockram, M.J. Mathematical simulation of the severely converging galleries at "Les Houlllères de Blanzy" (Blanzy Coal Mines). Proceedings of the symposium "Rock at great depth", Pau, August 1989. Volume 3. Houwlnk, H. Static and dynamic measurements of elastic coefficients on cubic and cylindrical rock samples. Delft, February 1990. FInaI thests.
342 -

Kamp. W. and Cockram, M.J. Possibilities of true trlaxlal experiments In the laboratory for rock mechanics of the Delft University of Technology. 6th IAEG congress. Amsterdam, August 1990. ISBN 90 6191 131 1. Balkema. Editor: D.G. Price. Kamp, W., Cockram, M.J. and Roest, J.P.A. CatacIastIc-Plasto-ElastIc equilibria In brittle rock under trlaxlal loading conditions. Second progress report. Delft, May 1990. Kamp, W. and Cockram, M.J. CataclastIc-Plasto-ElastIc equilibria in brittle rock under trlaxlal loading conditions. Summary of the project. Report on the seminar on mining technology. Santiago de Compostela, Spain, October 1990. Kamp, W., Cockram, M.J., Stam, J.L. and Roest, J.P.A. CataclastIc-Plasto-ElastIc equilibria In brittle rock under trlaxlal loading conditions. Third progress report. Delft, October 1990. Kamp, W. and Cockram, M.J. Yield envelope Investigation of FeIser sandstone with true trlaxlal tests Including post failure behaviour. Conference on fracture processes In brittle disordered mater I a Is. NoordwIJk, June 1991. Cockram, M.J. and Kamp. W. True trlaxlal compression experiments on Felser sandstone. IRSM congress. Aachen, August 1991.
343

SETTING UP OF A CHECKING SYSTEM OF THE UNDERGROUND CAVERN EVOLUTION IN MINES EXPLOITED BY SOLUTION
TECHNIQUE AND NUMERICAL MODELLING OF THE SAID PROCESS
P r o j e c t Leade r : L. MUSSO Montedipe (now Montecat in i ) , Milano, I t a l y
M. G u a r a s c l o , L. F l o r e
Mining I t a l i a n o , Rome, I t a l y
G. V o u l I l e ARMIKES, Par is , France
Mr. Veny Sofregaz, Par is , France
Contract MA1M-0048-C(A)
1. OBJECTIVES The aim of this research project was to control the evolution of the cavities formed during the solution mining process of a brlnefield situated near the village of Belvedere Splnello (CaIabrI a-ItaIy).
The research was carried out by the following organizations: MONTEDIPE (owner of the mine) MINING italiana ARMINES SOFREGAZ
The control was achieved by means of a modelIzatlon of the system, that Is of Its geometry, of rocksalt grades and of geotechnlea I, seismic, Theological and leaching parameters.
The simulation of the system allows to design the best method for the exploitation of the brine field and for the verifications of the production rate, of the safety conditions and of the environmental Impact.
to be carried out by each participant are The act Iv11 i es I Isted be Iow : 1. Problem analysis and definition of the model variables
(MONTEDIPE) 2. Sampling of the deposit (MONTEDIPE) 3. Laboratory testing of samples and definition of the
geometrical and grades model (MONTEDIPE)
- 345

4. Laboratory tests, estimate of geomechanicaI parameters and Theological model (ARMINES)
5. Mathematical formalization of the solution mining model (SOFREGAZ)
6. Definition of the geothecnlcal model and study of the state of stresses and deformation of the medium (ARMINES)
7. Adaptation of the software for use In the mine (ARMINES and SOFREGAZ)
8. Definition of the procedures for checking the model (MINING)
9. Design of the mlcroselsmlc monitoring network (MINING) 10. Procedures for calculating hypocentres and making
frequency analyses of signals (MINING) 11. Installation of the control system (MONTEDIPE) 12. Refinement and calibration of the monitoring network
(MINING) 13. Verification of results of the model (MINING) 14. Periodic Inspections of the evolution of mine cavities
(MINING) 15. Correlation of the data (MONTEDIPE)
2. THE DEPOSIT Belvedere Spinello exploits the salt deposits of Timpa del SaI to (Figure 1) which are located In a formation made up of lenses of evaporIte and detrltal rocks belonging to the Upper Miocene period. The deposit comprises four seams of rock salt (No. 3, 2, 1L and 1, from bottom to top) separated by waste strata. The thickness of the three lower seams is extremely irregular, varying from 4 to 24 m on average. Seam No. 1 Is undeniably the largest, having an average thickness of 150 m and a maximum thickness in situ of up to 240 m. Whereas the lower seams are sufficiently uniform In terms of lithologlcal make-up and NaCI content (about 90%), Seam No. 1 is more variable with regard to both characteristics, both horizontally and vertically. Encased In a graben oriented NE-SO, the deposit dips slightly towards the SE. The hanging wall of the deposit, which is Impermeable, is located at a depth of 300-650m and consists in either the overlying evaporite formation or the transgressiveformation (Lower Plelocene) of Spartlzzo marly cI ayes.
3. SAMPLING OF THE DEPOSIT Detal led samp I I ng was performed both of the overburden and the rocksalt layers.
- 346 -

The cores were analysed to determine the geomechanIca I and dissolution parameters.
4. ESTIMATION OF GEOMETRIC AND GRADE PARAMETERS The study of the geometric and grade parameters of the ore body Involved the definition of a three-dimensional model, i.e. the reconstruction of the hanging wall and footwall of the existing salt seams, and of the grade distribution within each one. Only the spatial behaviour of the variable "vertical average grade" of the seam Itself was constructed. The variables to be modelled were:
hanging wall elevation; footwall elevation;
- average grade along the seam thickness. A calculation procedure developed by MINING Italiana was applied to model the chosen variables. In particular, a krlglng was performed with a covarlance K(h) = -|h| that, In the examined case, was shown to be more suitable than the spline method or the linear variogram. Starting from this model, the contour maps of the variables and of seam thickness were prepared. A three-dimensional representation of the thickness is shown in Figure 2.
4. ESTIMATION OF GEOMECHANICAL PARAMETERS Lab tests were carried out on the samples taken from two borehoIes. Uniaxial, trlaxlal compression and extension tests have been carried out on rocksalt and overburden and Intercalated granual samples. Figure 3 shows the results of the laboratory tests in comparison with reference rock salt. The broken I I ne shows the strength to be assumed In the evaluation of the rock mechanical calculations. Creep tests have been also carried out because rocksalt is a non-cohesive, eIasto-vIsco-pIastic material. The Theological model developed by J. Lemaitre creeping obeys a
347

law that depends on the power of time ( exponent) and the deviator (3 exponent). When the constraint and the temperature T are constant, the deformation is:
-6 = 10 (CT/K)^ t^ +CT/E
where E is Young's model . The values of the exponents and G, of Young's model E and the evolution of K as a function of the temperature all depend on the origin of the rocksalt. Figure 4 shows the experimental results (dotted line), the theoretical values of the provisional model (broken line) and the definitive values of the final model (solid line). The following formula is proposed for Belvedere Spinello mIne rocksaIt:
1350(1/T-1/290) K(T) = 1.51 e
5. A PROCEDURE FOR FINITE ELEMENT GEOTECHNICAL MODELLING : VIPLEF
A procedure for finite element geotechnlcal modelling of rock displacements and constraints was Implemented. VIPLEF is a computing procedure of displacements and constraints In elastic, eIasto-visco-pIastIc and elasto-plastic structures. The Finite Elements Method that was used made it possible to simulate small and large deformations. As a consequence of the computing method, the data consisted of thermo-mechanicaI behaviour laws and it was possible to take Into account some different physical phenomena as well: material discontinuity (BecrouIssage), material non I I near Ity, etc. A PC version was installed In the mine. The parameters used by the procedure were determined by means of the above said laboratory tests.
6. MATHEMATICAL FORMALIZATION OF THE LEACHING MODEL The constructed model of the leaching process In rocksalt cavities (INVDIR) Is designed to allow to predict the concentration of NaC I In the brine pumped out of a given borehole and to monitor the final or Intermediate shapes of the cavIty.
348 -

To use the INVDIR model for simulating the leaching operations Involved in rocksalt solution mining, certain data are Indispensable since they have a significant Influence on the results that will be obtained. Essentially these IncIude: a) Initial geometrical shape, b) Injection volumes and grades, depths at which
Injections and outflow occur, c) average content (%) of Insolubles, d) bulk factor of Insolubles, e) sump bulk slope angle, f) dissolution velocity. After some experimental tests It Is possible to conclude that the model is valid when reliable Input parameters are used and that It can be installed In the mine for continuous use by production managers.
7. PERIODIC CHECKING OF EXPLOITATION EVOLUTION DEVELOPMENT WITH A GEOMETRIC MODEL
A geometric model has been developed for cases of single well exploitation. It Is designed on the basis of the data generated during normal production activity and on simple geometrical hypotheses. The simple hypotheses Introduced in the model are as foI Iows: a) The produced cavity Is symmetric with respect to the
vert lea I ax Is). b) The salt dissolution velocity Is not dependent on the
distance of the leaching surface from the water InJectIon poInt.
c) The cavity develops with a dissolution velocity that depends on an elliptic law.
d) At the end of each step, the waste pulled down during the step Is deposited on the bottom of the cavity, forming a surface of plane Interface and horizontal with the rocksalt that covers the remaining upper part of the cavity and continues the leaching only In that area: practically, the mud waterproofs the lower area of the cavity, up to the height reached by Itself.
Furthermore, this programme supplies, step by step, the unique cavity whose volume exactly Justifies the attained NaCI production and that extends vertically up to the elevation Identified as being the dissolution hanging wall. The user can select video visualisation or print out. An example of output Is presented In Figure 5.
349
8. ECHOMETRIC SURVEY OF THE CAVITIES AND COMPARISON WITH THE GEOMETRICAL MODEL
A sonar survey was carried out to measure the shapes and sizes of several voids created by solution mining using s I ng I e wells. Figure 6 shows a vertical section of a cavity. The continuous line represents the result of the geometrical model. It Is seen that the data provided by the measurements and those of the model correspond fairly well.
9. DESIGN OF THE MICRO-SEISMIC MONITORING NETWORK A micro-seismIc monitoring system was designed and Installed In the mining area. It was designed under the hypothesis that the formation of subsurface voids during mining operations and the resulting collapses generate micro-seismic Impulses that can be recorded by a network of sensors placed on the surface. Further, If a sufficiently large number of sensors record a given signal and if the seismic model of the studied zone is known, It is possible to reconstruct the focus of the event and thus keep the evolution of mining operations under constant control. These considerations led to the design of the micro-seismic surveillance network Illustrated In Figure 7. The network consists of twelve peripheral units that are connected by radio with a data concentration unit which Is In turn connected with a computer for the memorization and processing of the collected Information. Each peripheral unit Is equipped with: - a geophone to record micro-seIsmIc Impulses;
a signals amplifier; - a digital analogical converter;
a system for analyzing wave amplitude and frequency; software for control of operations; modem for transmitting the signals; radio system for receiving/transmitting signals; local memory (512 Kbyte).
The data concentrator Is equipped with: a radio system for receiving/transmitting signals; software for control of operations; system for analyzing signals received from the peripheral units;
- system for transmitting data to the computer. The computer carries out the following functions:
memorization of the data received from the concentrator; analysis and visualization of the data; calculation of hypocentres.
350
10. CONCLUSIONS
The practical results of this study are fully exploited during mining operations at Belvedere Spinello, for two main purposes:
starting and control of single well leaching in the "New Mine" situated In the south and south-east zones of the orebody. monitoring of subsidence in the "Old Mine" zone, which was exploited using the multiple well method.
10.1 THE NEW MINE
Leaching cavities have been designed with the aim of leaving a pillar and a slab In the rocksalt so that, having taken the rock's mechanical parameters into account, the stability of the cover of soil is assured.
The shape of the obtained cavities Is calculated and plotted by means of the described procedures, for time Intervals of a month or less.
Using these results, the mine technicians can change the depth of the casing and tubing shoes whenever the cavity diameter reaches its maximum planned value or when the Insolubles rise up to the pipes, risking to obstruct them.
All production data are controlled daily by means of a computerized procedure.
Temperatures, flows, pressures, pumps working times and stocks values collected during the three shifts are recorded In a Data Base. Approximately 600 data iterns are inserted dally Into a personal computer and processed; periodical reports are printed.
This procedure is a very efficient method for controlling quality and quantity of production, single-well cavity Impermeability and NaCI grade of the growing cavities.
10.2 THE OLD MINE
In addition to precision levelling to measure surface subsidence, IncI InometrIc measurements to monitor slope stability, chemical analyses of surface and underground water to control pollution, the mlcroselsmlc monitoring system Is continuously working, and recorded data are processed every three months.
The Interpretation of al I data recorded to the end of June 1989 shows that the specific energy trend has been significantly decreasing.
The complex system under control (the orebody, the covering soils, the cavities created by the leaching process, the
- 351 -

brine still in the underground) Is reaching, with the new exploitation method, a situation of dynamic equilibrium which seems to be stable due to the absence of paroxysmal phenomena. The spatial analysis of the energy measured by the peripheral units of the monitoring system clearly shows that mIcro-seIsmIc signals can be related to exploitation activity. In the north zone, now unexplolted, the energy level Is low and due to local phenomena; In the south zone, the exploited boreholes are well controlled; In the east zone, micro-seIsmIc signals level Is slightly Increased, probably due to the recent development of mineral activity In this zone.
11. REFERENCES CecchI G., Martina E.: Exploitation by dissolution of the Tlmpa del SaIto rock salt deposit (Calabria,Italy) - IXth World Mln. Cong., Ill- 25 -Dusseldorf 1976 GuarascIo M.: Mlcroselsmlc monitoring at Timpa del SaI to brinefield (Southern Italy) - SMRI Meeting 1986 - Amsterdam Martina E., CasatI P., Cita M.B., Gersonde R., D'Onofrio S., Bossio A.: Notes on Messlnian Stratigraphy of the Crotone Basin, Calabria (Italy) - Vilth International Congress on Mediterranean Neogene - Fasc. I I,p.755-765 - Athens 1979 Roda C.: Geologla della tavoletta dl Belvedere SpinelIo - Boll. Soc. Geo I. Ital. vol.84,p1-131 - Roma 1965 K.B.B. : Rock Mechanical Design of Brine Production Cavern in a Cavern Field - commissioned by Montedlpe S.p.A. - June 1988 Guarasclo M., Musso L., Tamburrinl D.: Tecnlca deII ' IdrodIssoIuzione In un giaclmento di saIgemma e impatto ambientale - Convegno Suolo e Sottosuolo Polltecnlco dl Torino - June,1989 Guarasclo M., Musso L., Tamburrinl D.: ReaIizzazione dl cavita' sotterranee control late In un banco di saIgemma e loro success Ivo possibile utlllzzo - Convegno Suolo e Sottosuolo - Polltecnlco dl Torino - June,1989 Flore L., Martina E., Modugno A.: Monltoraggio microsismico dl cavita' sotterranee con ret I dl geofonl in superflcle - Convegno Suolo e Sottosuolo Polltecnlco dl Torino - June,1989
- 352

F i g 1
- 353
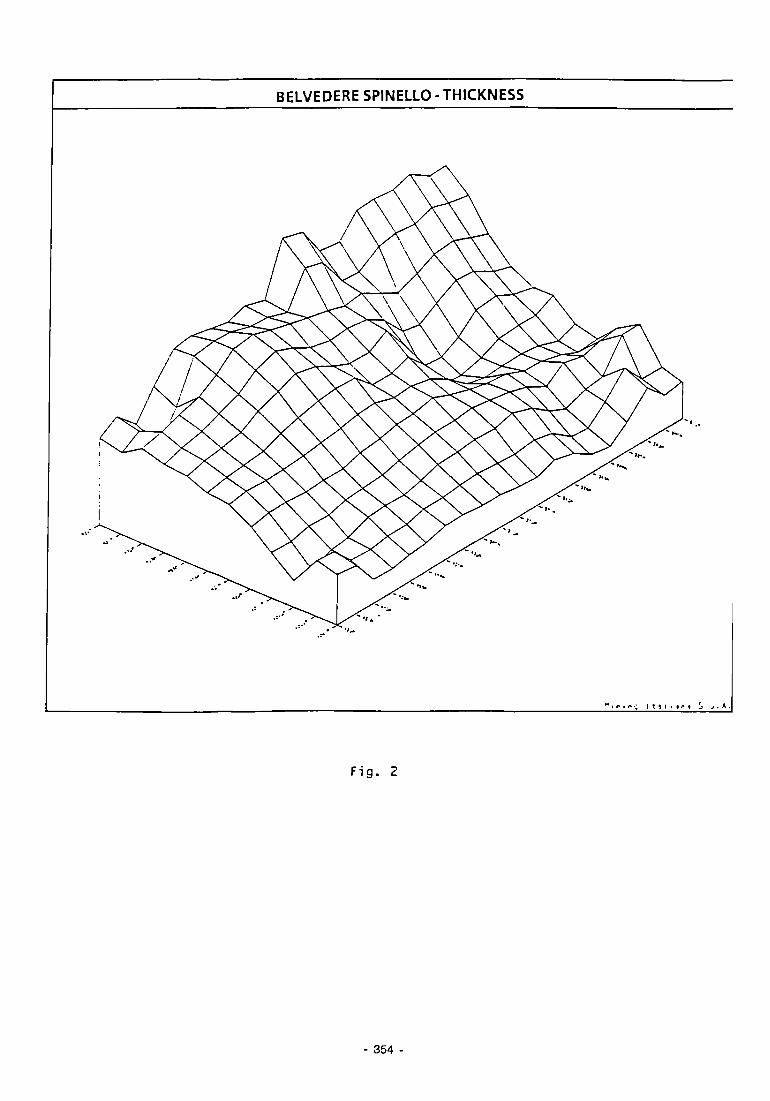
BELVEDERE SPINELLO-THICKNESS
1 i r . r > ; I t 1 I i 4 f* * j j . A .
Fig. 2
354 -
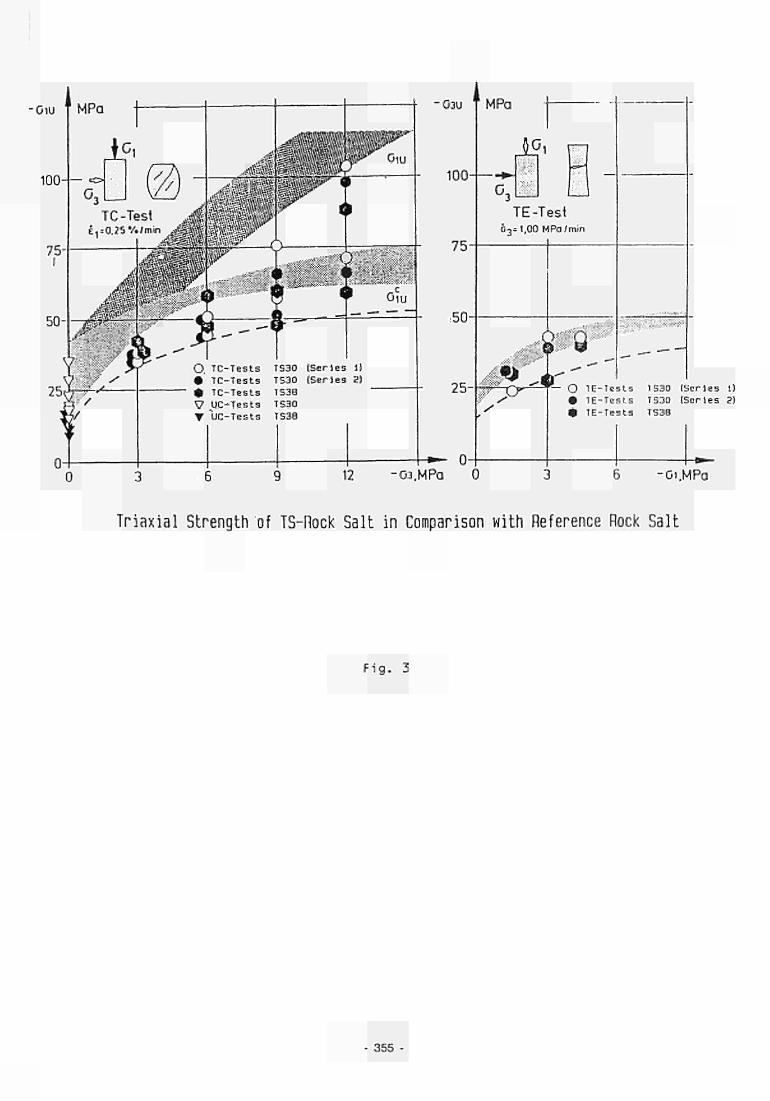
•O lU
100-
03U ' ' MPa
^ 1 ——
_ TE-Test
6 T = 1 , 0 0 MPa/min
O lE-Tcsls 1S30 (Series 1) • IE-Tests TS30 (Series 2) 0 TE-Tests TS3S
■Oi.MPa
Triaxial Strength of TS-Rock Salt in Comparison with Reference Rock Salt
Fig. 3
355 -
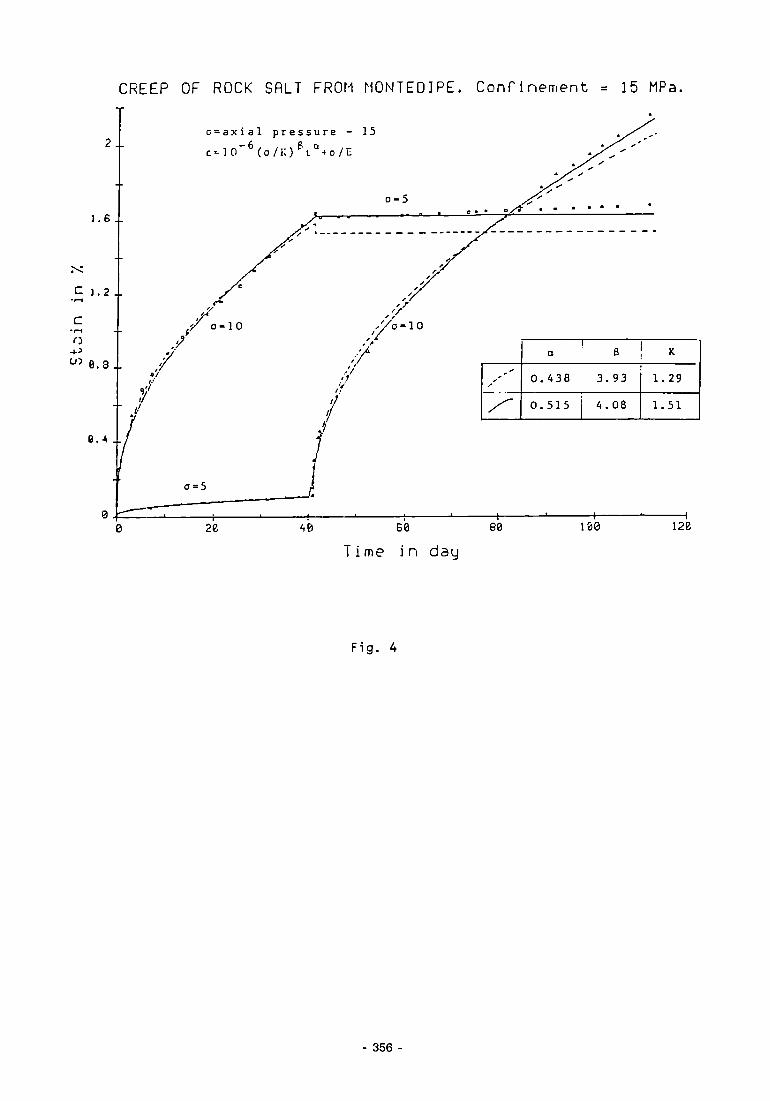
CREEP OF ROCK SALT FROM MONTEDIPE. Confinement = 15 MPa.
c=axial pressure -c-]0 _ 6(o/K) 6L a-.o/E
•
^
a B ! K
0 . 4 3 8 3 . 9 3
0 . 5 1 5 A . 0 8
1 .29
1 .51
Time i n day i2e
Fig. 4
356 -
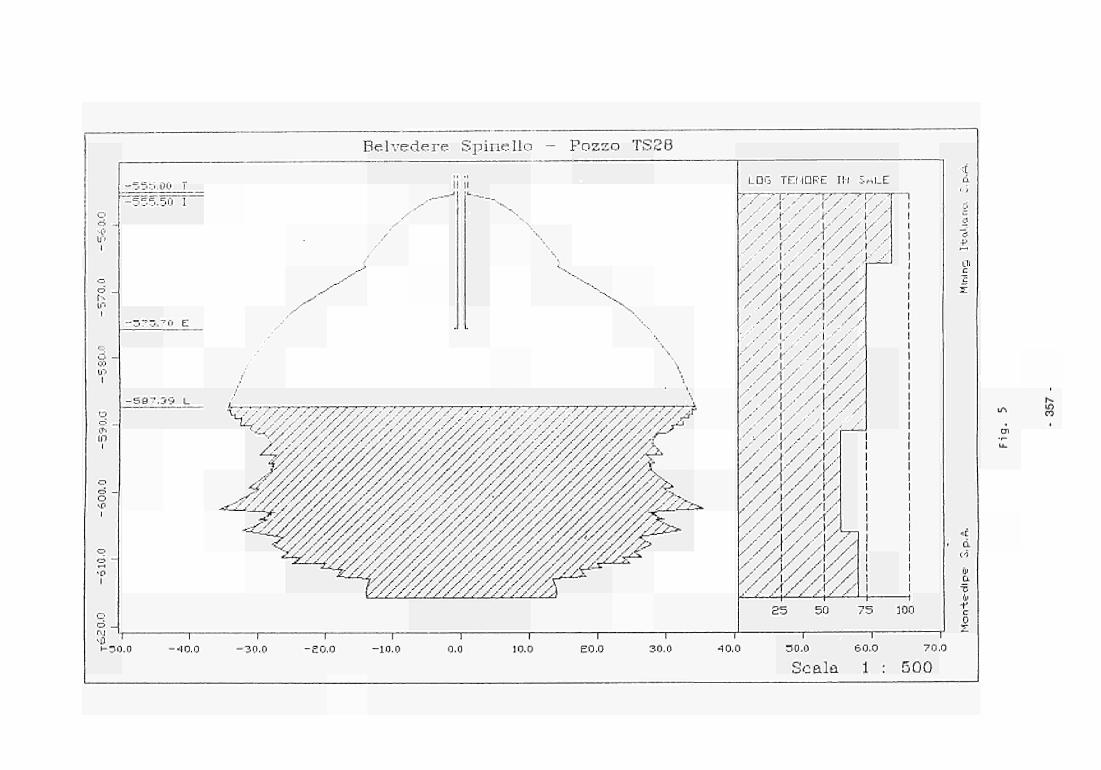
-r-r-'.-.i'ij i_
5 55"! 50 I
r-.
in i
0 E
- 5 8 7 . 3 - 5 L
Belvedere Spinello — Pozzo Tfc!2B
r i j
t -30. i 1
- 4 0 . 0
/////////// <f///////////////////////////////////s
^ ■ ' / V y y x . ' /s s /s ./ / / y y y y \ y y y y y y ////////////// / / / / / / / / / ' / y.y . /
— i — ■£0.0
I -10 .0 0.0 10.0
r~ £0 .0
LDG T E l l D P E I I I i l_E
T- T7' ,• 1 / , ■''AAAAAAA. / x -■■ / .i- .-•■.- )•-
' .-' V / / Y' / / \/ 'A//A//A, ••■' A / -•■" A / / X .--' y ,■-' y K /,--" )■-
■•' y l y ..'■■' - ' - I , - ' r y - V . ' I
r y y y - - K y y / / A / / / y y y y
■- y i- y ..•■■ y y . - • ' i . - ' , • ' , '■ ' I ,
■' A / / A .
i." /
y y y / / / / y.< •-y y J- ' , - ' /Ky y
V/Y//Y//. -■ y y i / y y i y y y y y y .-i y
V/X//X/ / / ,1" . - ' / , ! ,-
// /V/A/ y y y / / A /
y / / y,
i
/ / / / / / / V ] AA AAAA// '/AAA///A Y/A//X// y y / ! / y A/ /
85 50 75
30.0 r
40 .0 1
-o .o
Scala 60.0
1
100
r 70 .0
. 0 0
+■
en
d
G' a
~c-!i>
CO
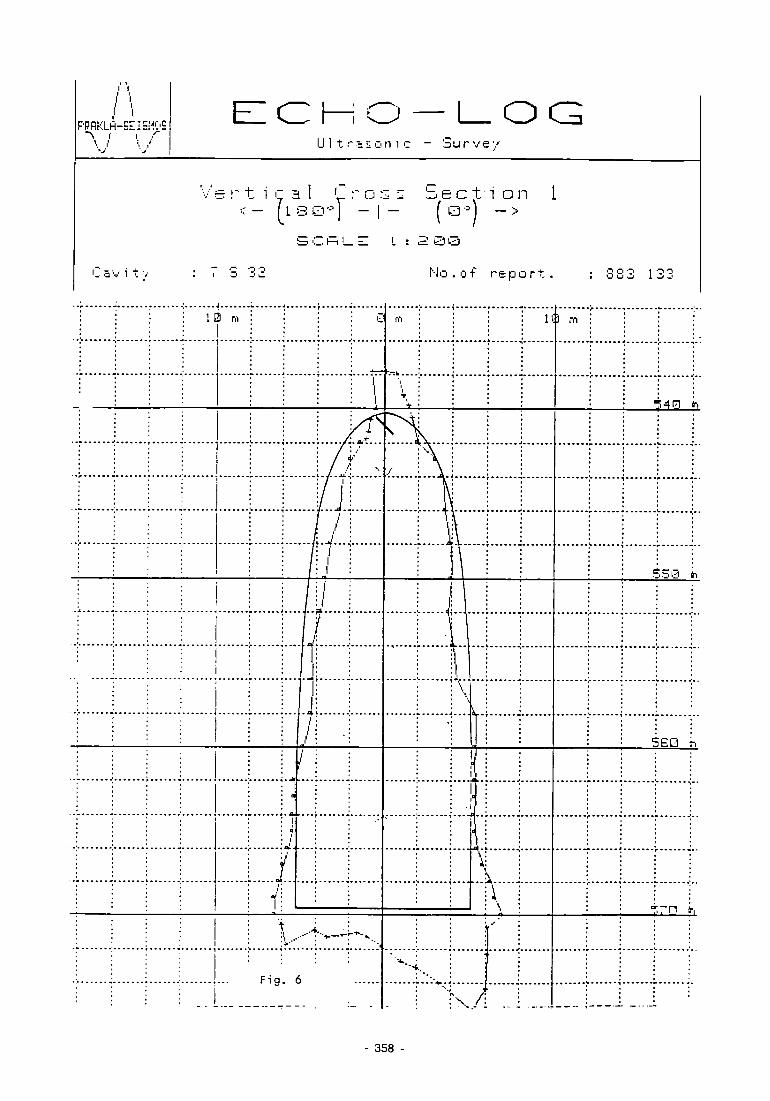
I I I I I I I1 'l
PPRKLH-SIISMOS
L 5 V 1
CHO—LOG i s o n i c - j u r v e v
Ve r t i c a l f r o s :
C R L E ! L
iect i on I (a - ) - >
No . of repo r t . i - | r-l - I 1 ' - l l O U ■-! I -> -J
i j ; : i
! : : :
-r ■: \ '•
j : : :
J m : ; ■ : Z
M ! i 1 ! : : : 1
i ■ ■ / f
1 ' i i ■
• : I ■'' ■
: : / : 1 ;
: : ; 1
:
! ! I i I M III \
: :
i • • : | • : :
■■: -j ■ •
: j i i
.•. ' ; j
\ \" : :
■ !
: : ! ; ; i
; : | '. a
! • i
'. '• >'
i / I i\
- I J
i 1
/ ! ^ J
j i :
■ — ' : - :
: :
: t '■■ 'i--
F i g . ( 5
: j ;■
mi • i i n
T ' | )
+ • ' * :
s *v j 1 i
L A i j I I I !
i t- ;
i l i ! 1 1 ; ii
: :l 1 : : \
. . . . . . . . . . . . j . . . .
! i 1 : : i : ! 1
• : : i
; i
: :
: J
«
■ J
j i
\ ! \ i:
l ■
■ ^
•
;
3 m | : \ \
• • 7 4 H in
: ; S5i~i in
','••;
: | 5GQ r, ■ ■ : :
i I : i " . n 4-i
358
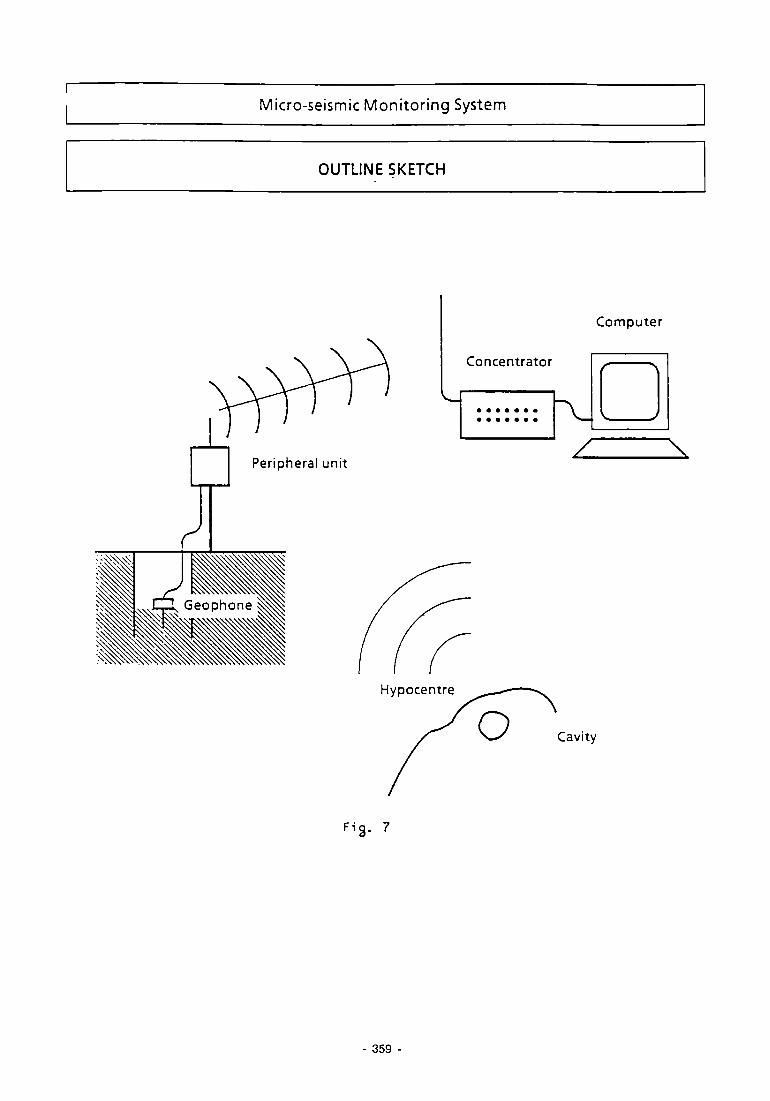
Micro-seismic Monitoring System
OUTLINE SKETCH
Computer
Cavity
F i g . 7
359 -

STABILITY AND REINFORCEMENT OF MINE WORKINGS. DEVELOPMENT OF DIMENSIONING METHODS BASED ON GEOSTATISTICAL STUDIES OF FRACTURING AND THE KEY-BLOCK METHOD. APPLICATION TO CABLE-BOLTING
P r o j e c t Leade r : F. WOJTKOWIAK, Bureau de Recherches Géologiques et Minieres (BRGM), Orleans, France
R . J . P i n e Camborne School of Mines (CSM), United Kingdom
Contract MA1M-0055
1 . OBJECTIVE
The objective of the work was to apply structural analysis, geological mapping, geostatIstics and the key-block method to the study of problems of stability and reinforcement of rock masses in mine workings.
2. STRUCTURE The project was directed by BRGM (France) in association with the Camborne School of Mines (U.K.) and with two subcontractors, the EcoIe Nationale Superleure des Techniques Industrielles et des Mines d'Ales (France) and the Spanish mining company Minas de Almagrera. The period of the contract was from May 1988 to April 1991.
3. SUMMARY OF WORK UNDERTAKEN 3.1 INTRODUCTION Improvement of the methods of assessing the stability of workings In rock and the dimensioning of the support provides a realistic description and geometrical outline of the fracturing of rock masses. With this In mind, BRGM, the Camborne School of Mines and the EcoIe des Mines d'Ales developed a computation code combining geostatisticaI study of the fracturing with stability analysis of the blocks it delimits, based on the theory of key-blocks put forward by Goodman and Shi (1985).
The "stability analysis of blocks" obtained from this computation code was developed particularly by the CSM, which then appI led It to assess the stabl I Ity of open stopes and drifts in the South Crofty tin mine (Cornwall, U.K.), at a depth of about 800 m within the Carnmenellis granite.
- 361
The identification of these key-blocks is fundamental for the definition and dimensioning of the support to be used. Of the different possible support devices, cable-bolting using passive cables with distributed anchorage seems particularly well adapted to this type of problem. However, Improved understanding of the way In which these anchors function and interact with the fractured rock mass Is necessary to optimize the dimensioning of this type of a reinforcement. Within the framework of this project, BRGM and Mlnas de Almagrera have measured the variation and distribution of the stresses exerted on the cables supporting the roof of a mining chamber (cut and fill method) In the Sotlel underground mine (Andalusia - Spain) as mining progressed, using an original device updated by Laval Unlversty In Quebec (Canada). The results made it possible to validate the gauge for measuring the variations in the stresses exerted on the cables, and clearly showed the harmful effect of blasting, as carried out so far, on the stability of the roofs of the stopes.
3.2 DESCRIPTION OF THE CONCEPTUAL MODEL
The various stages of the proposed model are shown In the diagrams in Figure 1 (Vinches, 1988).
3.2.1. Modelling of fracturing by geostatIstIcaI techniques
The complete operation enabling realistic geometrical model I I ng of the fracturing of a rock mass takes place in three principal stages:
(a) The first consists in the collection of basic data on site by means of systematic fracture surveys on the side walls of mines (excavations, trenches, drives) or on outcrops. The measuring stations are several tens of metres long. In addition to the strike and dip of the fractures, factors such as the length, aperture, morphology of the plane, nature of the filling, etc. are also described and codified on a form specially designed for this purpose (STAF).
(b) The second stage of the process, the structural data, determines the principle statistical characteristics of the fracturing, I.e. directional sets, dips, lengths, spacing of fractures, etc. But field Investigations, however detailed they may be, cannot determine the real field of fractures at every point In the rock mass. However, with the help of geostatIstlea I tools It Is possible to establish its degree of structuring in the fractured space.
(c) The third stage Is the actual modelling of the fracturing. This Involves, firstly, the choice of a model (using the Polsson law, or a random burst
362 -

process with or without regionalized density) for the laws of distribution of the different features of the real fracturing. Next, a method of estimating the parameters of the model Is Installed, and finally, a series of tests Is carried out to check that the parameters of the model match the real ones (Massoud, 1987).
3.2.2 Conditional generation of fracture fields
The programmes used for generating simulated fracture fields were developed at the Lawrence Berkeley Laboratory (LBL) In association with BRGM (Chiles, 1987).
In 3D configuration, each fracture, In the form of a disk, Is Identified by Its position (coordinates of the centre of the fracture), Its orientation (strike and dip), its radius and possibly Its aperture. In 2D It Is shown as a straight line segment. In both cases, the fractures are generated In a deterministic or statistical way, set by set, Independently of each other, and then superimposed (Figure 2). This approach Is original In that at the structure of the fracturing determined by geostatIsticaI methods, e.g. variable germ densities; the diversity of the laws of statistical distribution of the radii, spacing and aperture of the simulated fractures (normal, lognormal, exponential or uniform laws) can be introduced at this level.
3.2.3 Determination of blocks defined by the Inter sections of the simulated fractures
This Is based on considerations of combined topology. In 2D, the "Traversee la plus a gauche" (TPG - "Farthest left traverse") in each fracture plane enables definition of the boundaries of any undivided polygon. The generalization of this algorithm In 3D makes It possible to determine all the components of blocks defined In space by the Intersections of 2D surfaces of finite dimensions and unknown position. Thanks to this method, the Information associated with the representation of the polyhedra Is both geometrical (dimensions and position of each component in space) and topological (description of the connections between the different components).
3.2.4 Assessment of the stability of blocks
This assessment Is based on the simulated fracture fields using the "key-block" type of approach, which consists, firstly, of identifying the blocks bounded by free surfaces (underground workings or open pits) and by fractures which traverse the rock mass. This Identification is based solely on geometrical data using the stereograph Ic projection. The stabl I I ty of these blocks Is then assessed using the key-
- 363 -

block theory. This approach enables Identification of the blocks the removal of which would disturb the equilibrium of the rock mass, and which consequently need to be acted on (by bolting, for example), to maintain and safeguard this equilibrium. Among the other possible rules of action, It should be noted that with this method, It Is also possible to visualize the Influence of the orientation of the workings within the rock mass on the risks and types of Instability that fracturing can cause. This enables, If the case arises, the disposition or orientation of these workings to be modified, to minimise their unfavourable effect on stabi IIty.
3.3 APPLICATION TO SOUTH CROFTY MINE (CORNWALL. UK)
The work undertaken at the Camborne School of Mines (CSM) has been centred on excavations in South Crofty tin mine. Both the orebody and the country rock are strong but systematically Jointed.
Local quarries have been used to evaluate certain joint mapping methods including photogrammetry, but no further stability assessment has been undertaken at those sites.
During the academic years 1987-88 and 1988-89, a number of students undertook STAF-type mapping and associated work. An important conclusion from this work was that the STAF approach, although comprehensive, was very time-consuming and could not be applied for routine use In operating mines. However, It could be used to create a sample of rock mass Jointing which might be used more generally with adjustments according to local observations.
In addition to the mapping, Williamson et al. (1990) made an evaluation of the stability of open stope hanglngwalls and footwalls, and footwall drive roofs and sldewalls. This work showed that the key-block theory could be applied at South Crofty. However, only a few possibilities for different key-block types were Identified, based on mean Joint orientation data. An obvious problem for application to real mining situations was the implicit assumption of Infinite Joint continuity and no direct control on Joint spacIng.
Probabilistic distributions were fitted to Joint mapping data obtained from South Crofty. This enabled a simple deterministic model of rock Jointing to be developed. Using this model, key block analysis of the footwall drives of the No. 8 lode was performed using modified versions of Shi & Goodman's deterministic key-block programs. The drives are approximately square In cross-section and have a width of 3 m.
- 364

The limitations In this simplified approach showed the need for a probabilistic approach to key-block formation. The limitations of existing probabilistic methods of analysis were also examined. A new form of probabilistic analysis was developed, which was implemented In program B3LHS. The program was written In ANSI standard FORTRAN to run on PC computers.
B3LHS generates blocks that are bounded by Joints with finite dimensions, which are derived from probabilistic analysis and simulation. A sub-routine of the main program uses Latin Hypercube Sampling (LHS) to create the randomized input data from which potential key-blocks are generated. Each feasible block Is tested geometrically and blocks which may be able to fall Into the excavation are analysed statistically. This method does not suffer from some of the Inadequacies associated with other methods of probabilistic analysis. A flow chart for B3LHS Is shown In Figure 3.
A comparison was made between the results from B3LHS and deterministic key-block analysis. It was found that this new model predicted the formation of more key-block types than could be generated using the deterministic model. The probability of key-block formation, calculated from B3LHS, Is expressed as a function of tunnel width. The output does not show where blocks will form or how many per unit tunnel length, but various threshold probabilistic values have been suggested which link support requirements to the probability of key-block formation.
Geometrical output from B3LHS was analysed statistically. Lognormal distributions were found to fit block apex height, block width, face area, block length and volume. A method of factored risk was developed, which allows the calculation of rock block apex height at different levels of factored risk. Thus rockbolt lengths can be calculated. Rock block heights can be calculated at different levels of risk. This allows for the calculation of rockbolt lengths in both the roof and sidewaI Is of drives.
A typical design equation for drive roofs developed from the modelling In typical geology at South Crofty Is:
Ht = 1.23 - In(R) + 0.3 1 .71
where Ht Is the required bolt length (m) , and R Is the % level of risk of bolt length being exceeded by any block apex height. The constant 0.3 (m) allows for a minimum bolt anchorage length above the block apex. For a risk level of 0.3%, Ht Is 1.7m.
- 365

In comparison with empirical methods, B3LHS indicates similar levels of support In roofs but, for correct geological reasons (steeply dipping Joints), lower levels of support In the s I dewa I I s. This Is In close agreement with actual bolting requirements In the South Crofty drives.
The size and prevalence of each block type was not found to Increase once the drive width had exceded a critical value, beyond which the rockbolt length required to stabilise key-blocks need not be Increased. This result Is in marked contrast with the empirical methods of support design, which suggest a continued Increase In rockbolt length with Increasing excavation dimensions. The critical width was found to be dependent upon the geometry of both the drive and the Joints.
Validation of B3LHS showed that In the 380 m footwaI I drive at South Crofty there Is a good correlation between predicted and observed block geometries.
The work Is being extended in Ph.D studies (Tyler et al., 1991) to address the behaviour of the larger stopes. Results to date indicate that for typical Joint continuities, excavation width does not exert an Important influence on required bolt lengths. If continuities are artificially lengthened then excavation affects the prevalence and size of blocks. However, a critical excavation width exists beyond which there Is no further effect. Equations have been developed to summarise this behavlour.
3.4 INSTRUMENTATION AND BEHAVIOUR OF THE ANCHORAGE CABLES IN MINES
Cable-bolting Is still used in a very empirical way and would probably gain from being rationalized. With a view to elucidating the mechanical behaviour of the cables, Laval University In Quebec (Canada) has developed a device for measuring the traction forces exerted on the cables (Choquet and Miller 1988). This has been used in the Sotiel mine In Andalusia (Spain), about fifty km north-northeast of Huelva, where Mlnas de Almagrera SA Is mining a polymetalllc sulphide deposit 4 m thick by the cut and fill method.
- 366
The risk of large blocks of several tens of cubic metres falling, owing to the fracturing of the mineralized zone, was underlined from the start of the geotechnlcal studies. A serious accident In 1985 led the company to use roof support by distributed anchorage cables throughout. The cables are wire ropes with a diameter of 15.2 mm, comprising seven 5 mm diameter threads, placed In pairs In vertical holes 20 m long and 51 mm In diameter. They are sealed throughout their length with cement grout. The supporting capacity of each cable is approximately 250 kN. The density of the bolting Is currently calculated on the basis of a systematic survey of the fracturing In the mine roof after each round Is blasted.
The Information thus acquired enables the volume and weight of the blocks requiring support to be determined from purely geometrical factors, on the assumption that the fractures have zero resistance to shearing. The density of the bolting is therefore calculated on the assumption that a pair of cables have a supporting capacity of 500 kN, which generally corresponds to one pair of cables per 5 to 6 m2, distributed on a regular grid (Alvarez, 1988).
For the progressive dimensioning of the cable-bolting, BRGM and Minas de Almagrera decided to collate the results from the process described above, with the forces acting on the cables In real mining conditions. We therefore used the measuring device mentioned above, which comprises a four-ply wire strain-gauge, 70 cm long, with a nominal resistance of 70 ohms, composed of a wire mounted between two anchorage shells. The resistant wire is carefully wound around the cable and the gauge Is fixed to the cable by glueing on the shells. Ten support cables were equipped with three gauges each, all connected to multiple transmission and measuring boxes using a "quarter bridge" setup (Choquet and Wojtkowlak, 1990). All the devices were linked to a measurement and automatic data acquisition computer (Figure 4 ) . This Instrumentation was Installed In December 1988, but production demands and numerous problems, such as the accidental severing of the electric cables, greatly hindered the normal running of the experiment. The first measurements were not effectively made until 1990 and are currently going on.
These measurements (figure 5) show that the behaviour of each cable depends on Its position In the stope (In the middle of a crossing, between two pillars, etc.), on the fracturing of the roof, and on whether or not marked lithologlcal heterogeneities (schist zones) are present In the Immediate vicinity.
The distribution of forces along a single cable Is far from uniform, especially In areas which are stressed little If at all, either In traction or in compression.
- 367 -

The mechanical behaviour differs from one cable to another. Some are stressed very little throughout the measuring and locally undergo relatively constant traction forces of between 10 and 30 kN. Other cables, however, are much more stressed and undergo cycles of loading and unloading of variable degree and duration. The loading of the cables generally follows blasting In or In close proximity to the stope.
These observations clearly show that the roof of the stope behaves as an assemblage of blocks bounded by major planes of discontinuity. After each round of blasting in the stope, movement of these blocks, linked to displacement along the planes, readjusts their position in relation to each other, until a new equilibrium Is obtained. This causes significant variations In the forces working on one cable compared with another, and even along a single cable. The relatively unstressed cables were anchored In the areas which were Initially most stable and which have remained so throughout this experiment. The more stressed cables, which locally undergo cycles of extreme loading and unloading, cross the active planes of discontinuity, I.e. those along which displacement occurs, which subjects the cable to stress. If this displacement Is large or If the weight of the block requiring support Is greater than the maximum admissible load of the cable, partial or total rupture of the cable and/or the gauge may occur.
4. CONCLUSIONS
The model presented enables any structuring, in the geostatIstlea I sense of the word, of the natural fracturing of rock masses to be taken Into account, and the stab I I Ity of the rocks, bounded by fractures of finite dimensions and Intersected by underground workings or open pits, to be identified and assessed. It Is therefore easier to define and dimension the means of support to be used, such as cable-bolting, to ensure the safety of the working.
In particular, the program B3LHS, developed on this project, enables a more realistic simulation of support requirements than deterministic and previous probabilistic key-block methods. The results of the modelling developed on this project and applied at the South Crofty Mine Indicate considerable scope for rationalizing support requirements (bolts/cables) in blocky rock. The method should be applied to other mines In different geological settings. This will require a high standard of discontinuity mapping to suitable format. The result of this work may be a generally acceptable set of probabilistic equations for block size and frequency and for support requirements.
368

The development and proving in different workings, in the Sotlel mine In particular, of a device for the point measurement of the forces working on support cables undoubtedly contribute to an Improved understanding of the Interactions between the rock mass and the support. These experiments must go hand In hand with the development of new approaches modelling the geometry and mechanical behaviour of fractured rock masses, such as models of blocks. In fact, It is essential to be able to check at any moment whether or not the behaviour of the rock mass Is In accordance with the predictions of the model, and to check the efficiency of the support Installed, or even, if the case arises, to adapt it to the real behaviour of the mine work Ing.
5. REFERENCES Goodman R.E., G.H. SHI 1985. Block theory and Its applications to rock engineering - W.J. Hall Editor 1987. Massoud H. 1987. Model isatlon de la petite fracturatlon par Ies techniques de la geostatIstI que. These de doct. E.N.S. Mines de Paris - 189 p. Chiles J.P. 1987. Three dimensional geometric modelling of fracture network. DOE/AECL'87 conf., San Fransisco, sept. 15-17. Vlnches M. 1988. Application de I'analyse structurale, de la geostatIstI que et de la theorie des blocs-cles a I 'etude de stablllte des massifs rocheux fractures. These de doct. E.N.S. Mines de Paris - 176 p. Williamson S., Pine R.J. et Wojtkowiak F. 1990. Stablllte et confortement d'ouvrages minlers. Rapport d'avancement des travaux pour la per lode du 1er Mai au 31 decembre 1989. (Contrat CEE MA1M-0055-C). Rapport BRGM R 30645, mars 1990. Tyler D., Pine R.J. et Wojtkowiak F. 1990. Stablllte et confortement d'ouvrages minlers. Rapport d'avancement des travaux pour la per lode du 1er Mai au 31 decembre 1989. (Contrat CEE MA1M-0055-C). Rapport BRGM R 32318, fevrler 1991 . Alvarez C.J. 1988. Sostem i n I ento con cables en la mlna de Sotlel de Mlnas de Almagrera S.A. VI I I erne congr. Int. de la mine et de la metallurgle. OvIedo - Espagne, octobre 1988. Choquet P. et Miller F. 1988. Development and field testing of a tension measuring gauge for cable bolts used as ground support - CIM Bulletin, vol. 81, no. 919, p. 53-59. Choquet P. et Wojtkowiak F. 1990. Le boulonnage par cables d'anchrage des excavations mlnleres en massif rocheux fracture. Revue Industrie Mlnerale, Mines et Carrieres, P; 2-7, JuI I let 1990.
369

KEY-BLOCK THEORY STRUCTURAL
ANALYSIS
AND
GEOSTATISTICS
FRACTURE NETWORK SIMULATIONS
BLOCK GENERATOR
DETERMINATION
OF KEY-BLOCKS
RULES FOR ACTION :
- ORENTATION AND
GEOMETRY OF THE EXCAVATION
- SUPPORT
- REINFORCEMENT
Figure 1. Flow chart of the conceptual model for the processing of data on the fracturing of rock masses.
- 370

Figure 2. Example of the generation of fracture sets.
a. fractures positioned deterministically b. addition of a set created statistically c. superimposition of a set created statistically
371

Input distribution and excavation geometry
Latin hypercube sampling of continuous distributions for dip, dip direction, spacing £ continuity for each joint set
Input into key block generation sub-routines
Can block form ? Repeat 10 times
yes
±s block kinematically unstable ?
1 no
next iteration
yes
next iteration next iteration
Produce ASCII output of block data, i.e. volume, face area, apex height etc
Statistical analysis of results
Figure 3, Flowsheet for program B3LHS.
372 -

electrical Cable 12 conductors
measunnq IMP 9
i$ai system
WU1 IMP
IMP
electrical cable 2 conductors
data acquisition system
-20 m
■16 m
12 m special strain gauge
— 8 m
\ ca ble bolting
THV
4 m
stope r o o f
Figure 4. Diagram illustrating the principle of the instrumentation of anchorage cables in the Sotiel mine.
- 373 -

300
250 -
200 -
150 -\
100 -
50 H
400
Load (kN)
-A A rft |A~
480
F a i l u r e of the cable
A /VIA
560
A I A ,AAA!li A fl-
640 A bl a s t i n g
260
240
220
200
180
160
140
120
100
80
60
40
20
0
_ Load (kN)
o
* * * > oo,
* **$-r* %*r
o 00 o
<*>
o
^^MHHHW-MHMHW-
A AAA [—A ] A—j-& fAAAVA-A p
400 480 560 640
time (days)
Figure 5. Variation with time of the forces working on the distributed anchorage cables (2 to 3 gauges per cable)
- 374 -
OPTIMIZATION OF CEMENTED BACKFILL
P r o j e c t L e a d e r s : G. ROSSI and P. LICHER Societa I t a l i a n a Miniere , Ig les ias , I t a l y
University of Cogliari, Italy
Technical University of Clausthal, Germany
Contract MA1M-0067-I
1 . OBJECTIVE
The primary aim of the project was the development and optimization of cemented backfill stoplng methods in some mines operated by S.I.M. Company which comply with the following requirements :
sufficient strength of the backfill to provide an absolutely safe support to the stope and to prevent any subsidence of the country rock with consequent environmental damage;
formation of the cemented backfill mixes having resort to low-price aggregates and binders;
competItIvity with current stoplng methods.
2. INTRODUCTION
At S. Benedetto and Campo Pisano mines stoplng must be carried out with backfill methods, which comply with the requirements mentioned In "Objective".
The research conducted by Societa Italiana Miniere has been developed according to three main lines :
(I) Identification of the aggregates and binders most suitable for achieving the proposed objectives;
(li) determination of the loads acting on the backfill for the various stoplng geometries;
(III) optimization of the stoplng methods.
Lines (I) and (II) corresponded to tasks entrusted to Societa Italiana Miniere (SIM) and the Mining and Mineral Dressing Department of the University of Cagliari (MMDDUC); line (III) was developed by the Mining Institute of the
- 375

University of Clausthal (MIUC), Germany, whose researchers have worked out suitable fInIts elements models of the mining systems under consideration.
Similar problems had been posed by the Ralbl mine as well : however, owing to the low profitability of the mine caused by low metal prices and inadequate ore reserves, operation as well as research was discontinued one year before contract's end.
3. MINING OPERATION WHERE PROJECT WAS CARRIED OUT
3.1. THE CAMPO PISANO MINE
The Campo Plsano mine Is located In south-western Sardinia (fig. 1 ) , south of the town of IgIesI as. The mine is composed of two massive orebodies, called the Calamine Mass and the Sulphide Mass, both located in the Lower and Middle Cambrian formation, the so-called "Gonnesa formation", comprising three members which are exclusively carbonate: shaded dolomite, grey dolomite and waxy limestone.
The mineralization of the Sulphides Mass, where stop Ing is currently carried out, Is prevalently composed of pyrIte as well as sphalerite and minor amounts of galena. It is often fragile with Inclusions of oxidized parts and sometimes of gray dolomite.
The plan section of the mass reveals an elongated shape, the major axis running In an E-W direction. Its surface area Increases considerably with depth, ranging from about 1,200 m* at the -89 m a.s.l. elevation to about 10,000 m 2 at the -185 m a.s.l. elevation (Fig. 2 and 3 ) .
The mass dips northwards, and dip varies considerably with depth, from sub-vertical In the upper parts, to less than 45° in the lowest parts. The reserves between the elevation -89 and -185 m a.s.l. (the latter being the lowest elevation which can be dewatered by the pumping station) amount to 2,200,000 tons assaying 9% Zn and 0.45 % Pb (In addition to a strong occurrence of pyrlte, estimated at 3 0 % ) .
The water table elevation Is presently -125 m a.s.l. The excavation of the main access ramp, which has now reached the -125 meters level, and stoplng, at -120 metres level, were made possible by a local pumping station which has a flow rate of 0.15 m 3 per second of fresh water. At present, the -200 m level plant pumping station at the nearby Monteponi mine has gone Into operation, and the water table at Campo Plsano Is expected to gradually sink to the -185 m level, with a predicted lowering rate, at the planned production rates, of 20 metres per year.
The country rock strength Is poor, especially at the foot wall, where It contains oxidized matter and grey dolomites that are fractured and Incoherent In the vicinity of the contact.
- 376

3.2 THE SAN BENEDETTO MINE
The San Sard InI a,
Benedetto about 8 km
mine Is also located in south-west north of the town of Igleslas (Fig. 1 ) .
The orebody currently being mined Is massive, enclosed In a carbonate country rock of the basal part of the Metalliferous formation.
The country rock Is predominantly grey, massive dolomite and, towards S-W, shaded dolomite : at Its N-E end, the orebody comes Into contact with the limestones. In all of these rocks fractures, recirculation of water, and karstlc phenomena occur. The dolomite alters to yellow dolomite in a layer some metres thick at the foot wall contact and especially at the hanging wall contact, with a marked decline In mechanical properties.
The mineralization is entirely constituted of oxidized ores, above the 275 m level; below this level the sulphides appear and the oxides decrease downwards. In the zones where stoplng Is presently being carried out, the run-of-mlne ore occurs In the form of massive sulphides with a calamine matrix, originally the filling of karstlc cavities. This mineralized rock exhibits very poor mechanical properties, exerts considerable pressure and does not permit cavities larger than 4 to 5 metres to be opened.
The orebody outcrops at 400 m a.s.l. elevation; it Is well explored down to the depth of +200 m a.s.l. and has been Identified with exploration drillings down to the sea level. The plan section of the orebody Is roughly elliptical: its major axis Is from 100 to 150 m long and runs from NE to SW : Its minor axis is from 20 to 40 m long.
With Increasing depth the major axis tends to rotate on the horizontal plane in a N-S direction and exhibits fringlngs at its southern end. Dip Is N-W, fairly regular and about 60° (Fig. 4 ) .
The mineable reserves amount to about sulphides assayng 9.1% Zn and 0.3% Pb.
900,000 tons of
Drainage water must be pumped out at flowrates ranging from 20 to 40 dm J/s, depending on the season, in order to keep the water table below the elevation of present stopes and to allow the excavation of the access ramp.
3.3. STOPING
The stoplng with ml nor layout, and fill stop Ing
pattern Is basically the same for both mines, differences which do not affect the overall the method can be defined "underhand cut-and-by horizontal slices".
- 377

Stoping is carried out as follows : a drift Is driven from the ramp, from 10 to 20 metres from the orebody, through the country rock, crossing the whole plan section of the orebody (Fig. 5); the cross-cuts, which are In effect the stopes are then driven from the drift at an angle ranging from 60° to 90°. These cross-cuts are 5 m wide and 4 m high and reach the contact of the orebody with the country rock. The height of the stopes Is of course also the thickness of the horizontal si Ice which Is thus generated when al I the stopes are mined out. Their roof is constituted of the cemented backfill empIaced in the overlying slice. The orientation of the cross-cuts In the next, underlying si Ice Is planned In such a way that It forms an angle from 60° to 90° with the direction of the cross-cuts of the overlying slice : hence, at the crossing, the free span ranges from 5 to 10 m (Fig. 6). in this way, the drift of a given slice is parallel to the cross-cuts of the overlying si ice. In order to provide the backf i I I of the overlying slice with suitable support on rock, this drift is driven such that it Is lying on two adjacent cross-cuts. The time sequence and pattern of cross-cut excavation are planned such that a new cross-cut Is only mined adjacent to another already backfilled when the backfill Is sufficiently aged.
The length of the time interval required by the cemented backfill to develop a suitable strength, and the strength thus developed, are critical parameters for the economics of the mining operation.
Their determination for the various mixes has been one of the objectives of the research. The method can be considered as the result of the following steps : - blasting of the ore and haulage of run-of-mine ore;
preparation of backfill mixes; delivery of the mixes from the preparation plant to the underground stopes; emplacement of the backfill into the cavities left by stop Ing.
The optimization of the method as a whole is, therefore the optimization of the Individual component steps and of their correct Integration. The achievement of the general objective has been the result of a process of successive approximations.
378 -

This process has involved the preparation of cohesive cemented backfills whose strength has been designed according to the requirements of orebody and country rock stablIIty.
Figure 7 shows an Isometric view of the stoplng method.
3.4 BACKFILL
3.4.1 The concrete mix and pumping plants
Each mine was provided with Its plant. The sketch of a typical plant Is show In Figure 8.
The plant consists of five bins (1), each of 220 m3 total capacity, where the various aggregate components and fly ash are stored. Each bin is equipped with a feeder that is operated from a control panel.
The feeders deliver the required amounts of size fractions aggregate and binders to a conveyor belt (2) Incorporating a scale whose readings are provided by a dial also located on the control panel.
The thus prepared dry mix Is transferred to a skip (3) which delivers it to the mixer (4) together with the Portland cement coming from silo (5). Water In the prescribed amounts is added to the mixer and, once the desired homogeneity of the concrete mix Is achieved, the latter Is discharged Into the underlying pump sump (6).
The central room, which Is not shown by the sketch, provides the plant operator with all the data concerning the various mix components. In this way the operator can accurately control the mix composition.
3.4.2 Concrete delivery pipeline
The mix Is delivered to the stopes by means of suitable piston pumps and a 5" diameter steel pipeline. One pump Is Installed on the surface, In proximity of the mixing plant; the other Is located underground, near the bottom of the shaft through which the pipeline reaches the stoplng areas.
3.4.3 Cemented backfill characteristics
A compressive strength of 10 MPa was considered an adequate value on the grounds of the experience aqulred until the moment of the beginning of the research.
The philosophy underlying the mix design Is summarized by the flow-chart of Figure 9.
- 379
On the grounds of Investigations carried out by the researchers of the MMDDUC (Manca et al., 1983, 1984) as well as Information provided by manuals (Co I Iepardi , 1980; Thomas et al., 1979) and Simposlum proceedings (Granholm, 1983) part of the cement In the mixes was successful ly replaced with fly ash. In order to achieve the production of concretes complying with the following prerequisites : a) strength values In the same order of magnitude of a
concrete prepared using cement as sole binder and having the same aging time;
b) workability equivalent to that of a mix containing cement as sole binder.
The following composition of a "reference concrete" was calculated according to a procedure that was developed at Glasgow University :
maximum particle size of aggregate : 20 mm workability : 20:24 cm slump water : 230 dm3/m3
average strength 10 MPa Samples of the mixes were taken at regular time Intervals at the surface mixing plants as well as in the stopes, during backfilling. The samples were tested In the laboratories of the Engineering Faculty of the University of Cagliarl and/or at the Strength Testing Laboratory of SIM Company.
4. THE MONITORING SYSTEMS A monitoring system for measuring the stresses within the cemented backfill at points suitable for characterizing the evolution of the loads acting on the backfill was designed in cooperation with the Researchers of the Technical University of Clausthal. With the data provided by this system, the finite elements programs, worked out specifically by the Researchers of the University of Clausthal, are being implemented for Investigating the optimization potentials of the mining methods adopted. The monitoring system consists of two sets of respectively nine and seven total pressure cells type 8-40/40-OS-400-Z4-Rl manufactured by Gloetzl Co. together with the required ancillary equipment. The first set (monitoring system MS1) consists of six cells installed vertically and three horizontally (Fig. 10) In the middle part of the central cross-cut of the seventh slice of Campo Plsano mine, at the -115 m a.s.l. elevation. The other
380
set (monitoring system MS2) Is placed In slice N. 8 five cells are vertical and two cells are horizontal (fig. 11). Figures 12 and 13 show the locations of the two sets In the respective slices.
5. RESULTS AND DISCUSSION
5.1 MIX DESIGN
The standard mix composition adopted is one identified as "B" In Table 1 : It provides a very satisfactory performance with a compressive strength that Is frequently higher than 10 MPa and a workability that ensures a trouble free flow through the delivery pipelines. The regularity of operation of the preparation and emplacement system thus achieved allowed to steadily attain the top emplacement capacity of 200 m 3 per shift with considerable cuts in costs (Table 2) and improvements in stope organization.
5.2 MONITORING OF STRESS EVOLUTION WITHIN EMPLACED CEMENTED BACKFILL
System MS1 was Installed at the end of the first semester of 1990 whereas System MS2 was Installed In July 1991. Hence, at the time this report was compiled data provided by MS1 are available, and are shown In Table 3.
From September 1990 to June 1991, 13 series of data were collected; the time interval between two consecutive series ranges from 3 to 31 days. This variability of the time Interval Is connected with the progress of stop Ing In slice N. 8, that underlies slice N. 7 where MS1 Is placed. Figure 14 and 15 grafically summarize the evolution of stresses shown In Table 3.
Surprisingly enough, following the readings of February 04, 1991, I.e. 139 days after the Installation of M.S.1. no significant variation was recorded.
Hence It seems that neither the setting of the cemented backfill in the depleted stopes of slice N. 7, nor the cavities left by the stopes of slice N. 8, have produced any variations In the stress distribution within the cemented backfiII.
6. CONCLUSIONS
The successful development of a proper mix design and the adequate adjustment of the concrete delivery pipelines geometry has resulted In considerable Improvements In stoplng operations and In the achievement of a constant quality of cemented backfill.
381 -

The regularity In operations, thus achieved, has made the Installation of monitoring system possible.
The observed lack of variations In the stress distribution within the cemented backfill might be an Indication that the backfilling of each slice acts as a self supporting structure, at least for the moment.
However, It Is reasonable to expect that more significant Information will be provided by MS1 as stoplng wiII involve deeper slices together with data contributed by system MS2.
Although, for the Just outlined reasons, the implementation of the models worked out by the University of Clausthal can be considered premature, It can be stated that the project has attained some of Its most Important objectives.
7. REFERENCES
Collepardi, M.,
Sclenza e tecnologla del caIcestruzzo, Hoepli, Milano, 1980, 205, 397.
Manca, P.P., Massacci, G., Massidda, L., Rossi, G.,
Mill tailings and various binder mixtures for cemented backfill : Analysis of properties related to mining probI ems. In Proceedings Interntl. Symposium on mining with backfill, Balkema, Rotterdam, 1983, 39-47.
Manca, P.P., MassaccI, G., Massldda, L., Rossi, G.,
Stabilization of mill tailings for mining backfill with Portland cement and fly ash, Trans. Instn. Mln. Metal I. (Sect. A Mln. Industry), 93. Apr i I 1984, A48-A53.
Mining with backfill, Granholm, S., (ed) Balkem, Rotterdam, 1983.
Thomas, E.G., Nantel, L.h., Not ley, K.r., Fill technology in underground metalliferous mines, International Academic Services Limited, Kingston, Ontario, Canada, 1979.
382
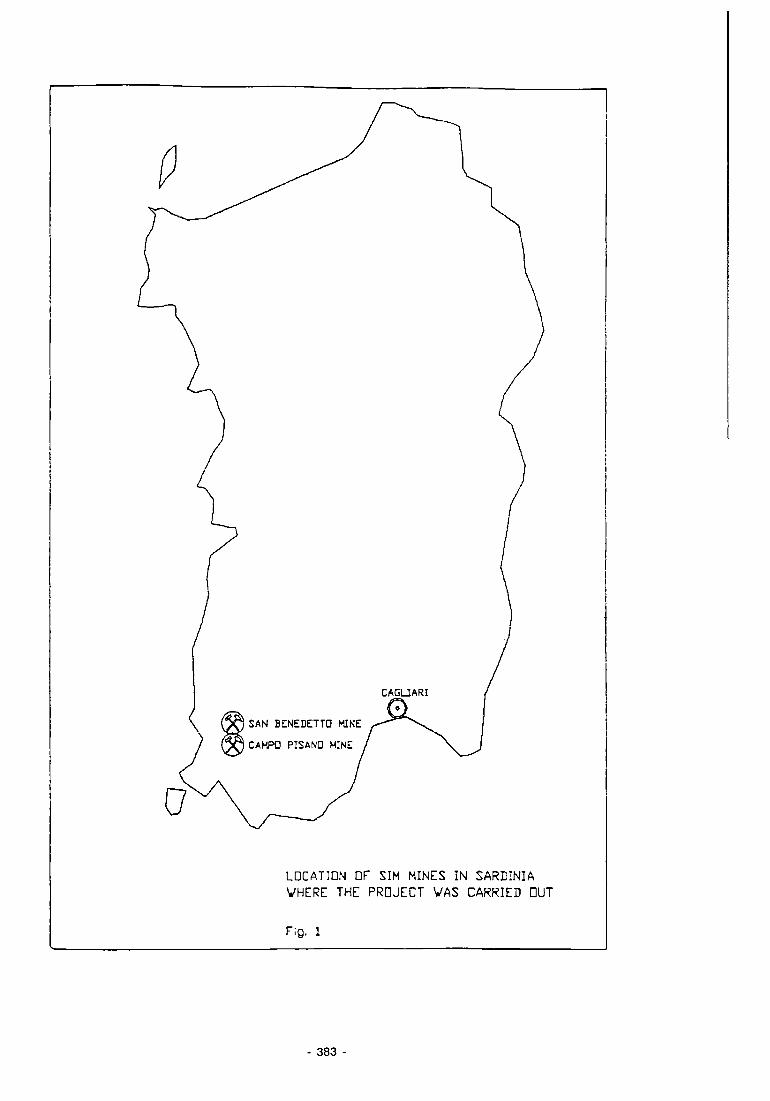
LDCATIDN DF SIM MINES IN SARDINIA VHERE THE PROJECT VAS CARRIED DUT
FiQ. 1
383 -

CO CXI
CAMPD PISAND MINE PLAN VIEW DF 'SULPHIDES' RAMP WITH INDICATION DF MINERALIZED AREAS AT THE VARIOUS STDPING LEVELS
Fig. 2

-89
■100
-140 —
-180 —'
- 2 2 0 -1
- 2 6 0 -
VERTICAL PRDJECTIDN DF CAMPD PISAND DREBDDY AT SECTIDN 1
Fig. 3
385

SAN BENEDETTO DREBODY VERTICAL PRDJECTIDN VEST-EAST
Flo. 4
386 -

CO oo ■vl
CAMPD PISAND MINE
STDPING PATTERN HDRIZHNTAL SLICE N 5
10 20 30 40 50 r>
rig. 5

CAMPQ PISAND MINE PLAN VIEW DF STDPING CRDSS-CUTS
Fig, 6
388
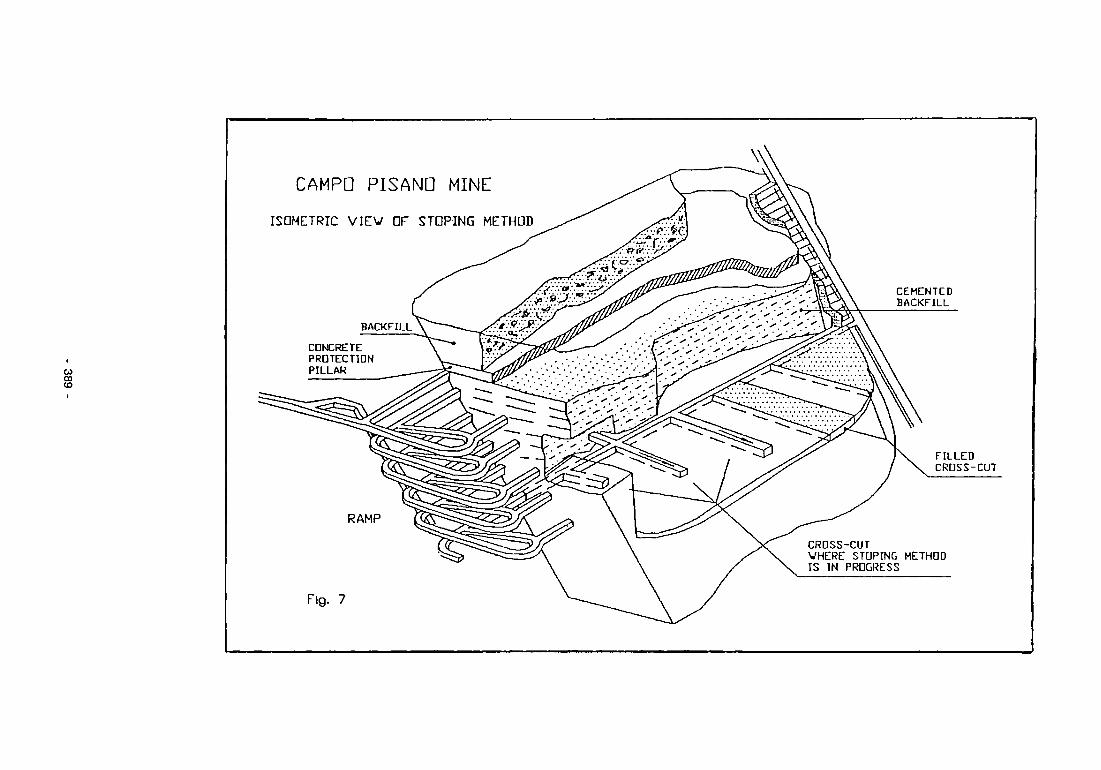
CO CD
CAMPD PISAND MINE
ISOMETRIC VIEV OF STDPING METHOD
RAMP
Fig. 7
CEMENTED BACKFILL
FILLED CROSS-CUT
CROSS-CUT VHERE STUPING METHDD IS IN PRDGRESS

CO to o
/T\

10
AVERAGE STRENGTH
WATER TD CEMENT RATID
DPERATIDN CONDITION
WORKABILITY
TYPE OF .AGGREGATE
WATER FOR THE MIX
CEMENT CONTENT
AGGREGATE TO CEMENT RATIO Fig. 9
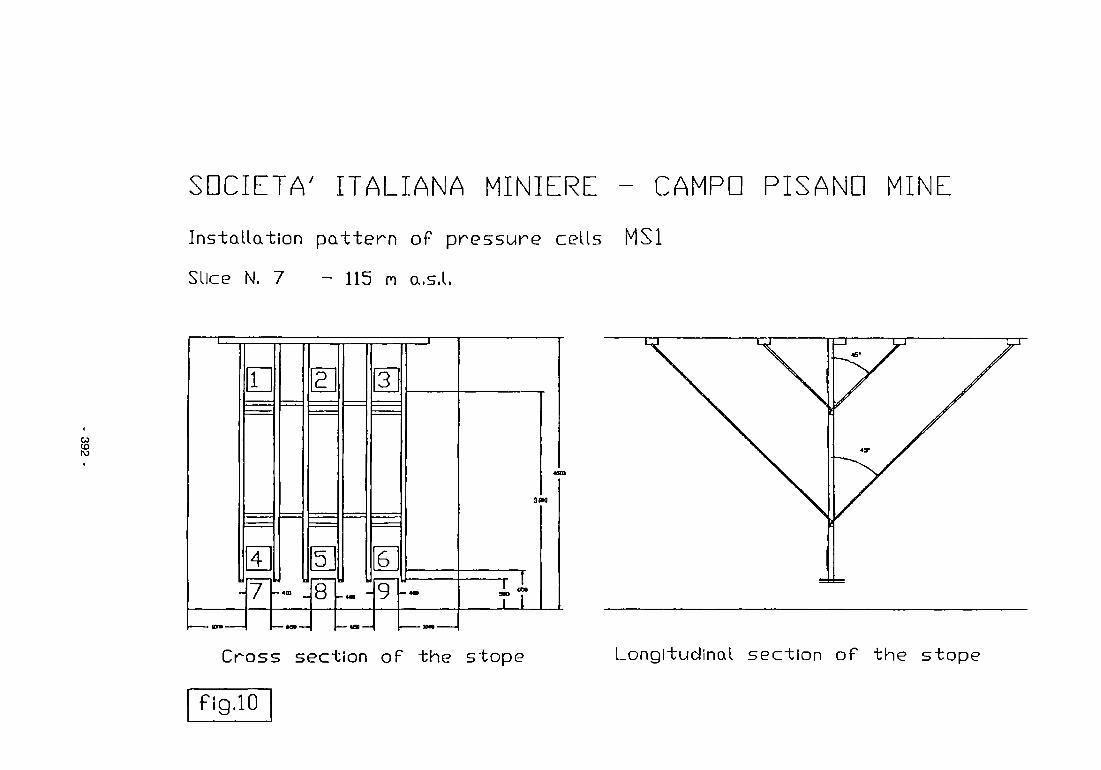
SDCIETA' ITALIANA MINIERE - CAMPD PISAND MINE
Installation p a t t e r n of p r e s s u r e cells MSI
Slice N. 7 - 115 m a.s.l.
CO CO ro
Cross section oF the stope Longitudinal section of the stope
fig.10

SDCIETA' ITALIANA MINIERE - CAMPD PISAND MINE
Ins ta l la t ion p a t t e r n o f p ressu re cel ls MS2
Slice N. 8 - 120 n a.s.l,
w to W
10
12
-14
11
13
15 -« ^16
Cross sect ion o f t he s tope Longitudinal sect ion o f t he s tope
Fig. 11
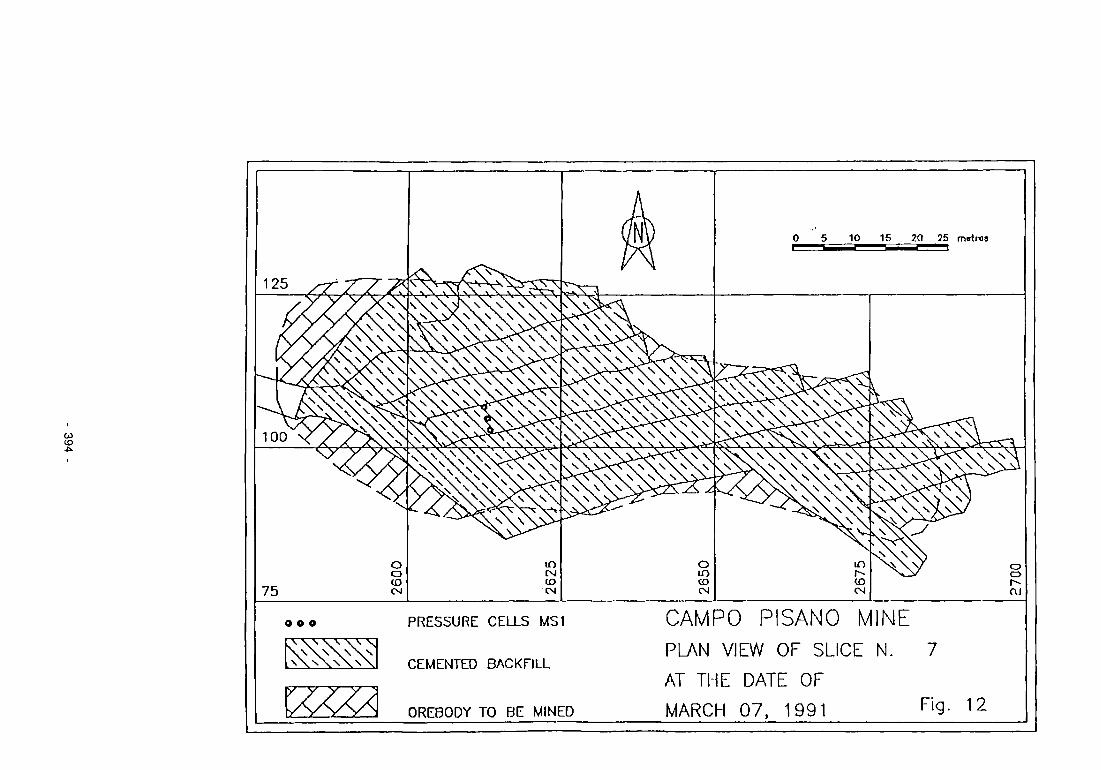
CO CO
125
10 0
75
Y7-TX7*
Y x X xx \Y\Y\XS\ X Y yy\XX SY^Y/C^XA x AxXXX*
X x x \ x \ \ \ x x x
X X X xxx x x \ ^*0^
xX
o o CO CM
O O O
vV \ V \ V \ ^ X X X X \ x \ x X
AXAY,
^ \ / ^ V ^ v -
x \ s X T \ N XN \ N \ s \ V\v\\\v \v\x\> x v O > \ s \ N • x > A V O N X V k \ > \ v \ \ \ \ \ \ \
\ \ \ \ s \ \ \ s \ v c V v V v x w < v \ N \ N
^ x v x x \ j o £ < C x x x \ ^ O c V v V OX x \ s N
V V O x x \ > x> \ N \ N
Y / > L \ ^ O X I > X ^ \ S \ ~-^^sx^\y\>^-
m CN co IN
A OxO^sT^ V > < X V O A
\ \ \ x \ \ > X < P \ Xs \ N \ s x v ^ x ^ ^ x V 0 \ \ \ ^ 0 x ^ \ \ \ ^ v \ x X \ 0 \ \ \ N \ \ \ J O S ^ X C ; 0 V
oi^x<x\oXXxS>-:xX^Nox^^xP\rx \ x x> \xXux^cxv \ x N N v X > 0 x \ > \ s \ x \ x \ v -x *C \ \ Ox Ox ^ x \ x r \ \ > ^ \ \ \ J O X X X ^ C \ N \ \ ^ \ > X - ^ c \ s \ x \ x \ \ > ^ \ \ N \ \ \ x \ \ \ \ V \ \ \ \ \ \ \ \ > r 2 x ~ 2 > x.
o i n CO CN
0 5 10 15 20 25 metres
Sll^x^ V 1 ^ * * \ ^ \ > X s X s X> -\ \ \ \ \ \ \ \ \ \ > C V \ X s \ s V A A V C A N \ > ^ N X X \ N N X N N \ N N X > \ V \
^-~~~Y A V \ \ \ > V , - ^ ^ \ s XVs
in CO CN
OX XY3«—^^XM X v > < x \ \ \ s \ \ k \X \ \ \ \ \ \ \ o t - r r l •\v\S^^C\0\ > J 0 X ^ X ^ O \ \ \ X \ V \ \ \ \ \ v v > < f -^ X s \ v v v XI
s> Xs \ N / 0 x V
* ^ x ' * \ \ N N \ \ \ X X O X y
PRESSURE CELLS MSI CAMPO PISANO MINE PLAN VIEW OF SLICE N. 7
CEMENTED BACKFILL AT THE DATE OF
OREBODY TO BE MINED MARCH 0 7 , 1 9 9 1 F i<3- 1 2
xx\
o o
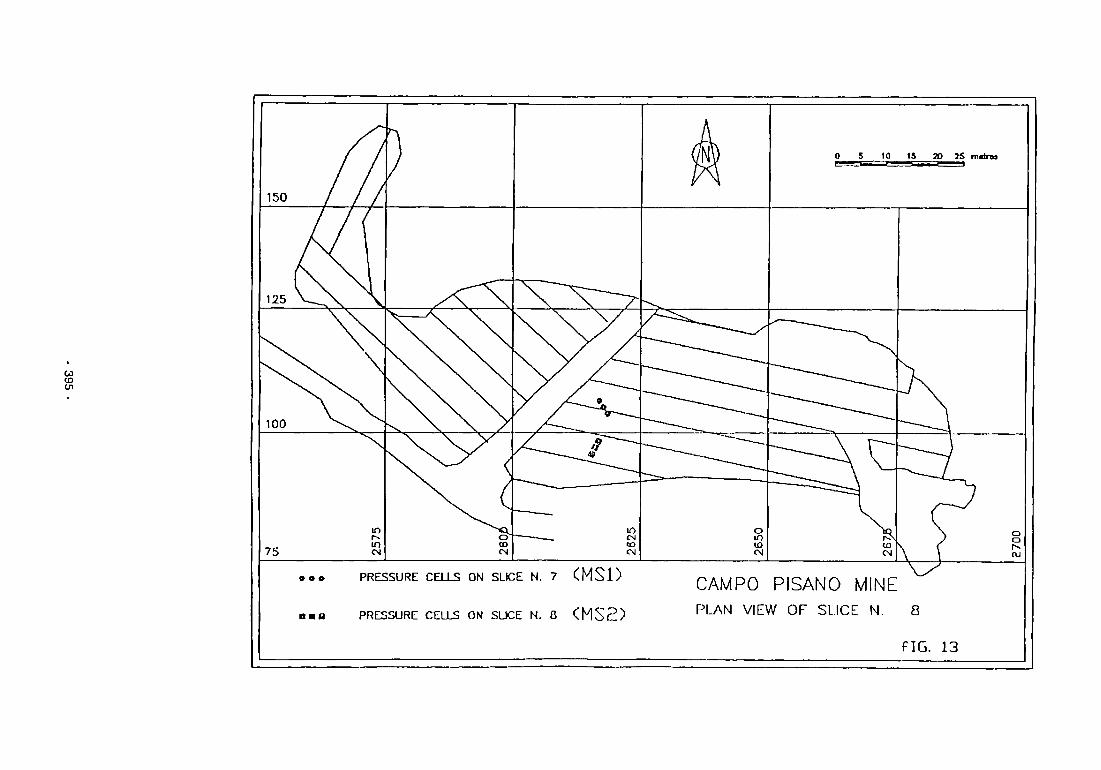
W CD
PRESSURE CELLS ON SLICE N. 7 ( M S I )
I B PRESSURE CELLS ON SLICE N. C < M S 2 )
CAMPO PISANO MINE PLAN VIEW OF SLICE N. Q
fIG. 13

CO CO en
0.2
2 ZJ w I/)
e
Campo Plsano mine Horizontal cells on 7th slice
° i i n i i i i i i i i i 0 25 50
I i I I i I i I i i i i i I i I i i 75 100 125 150
cell N 7
cell N 8
cell N 9
i i i i i i i i i i i i i i i i i i i i i i 175 200 225 250 275
Days from Installation date (90.09.18)
Fin- 14

CO CO
0.18-
0
Campo Pisano Mine Vertical cells on 7th slice
i r i i i i i i i i i i i 0 25 50
I I i I l l I i l I I I l 75 100 125
cell N 1
cell N 2
cell N 3
cell N 4
cell N 5
cell N 6
I I 1 I I I I I ; l I I I I I I 1 I I I I I I I I I [ I 150 175 200 225 250 275
Days from Installation date (90.09.18)
Rg. 15

CO to 03
Cement mix composition tested at S.LM. n
Component (Kg per m ̂ 3 of mix) Baueddu gravel Masua float Sand Fly ash Type 325 pozzolanic cement Water
Table 1 unes
MIX A
1100 764 60
150 180
B 1433
567 100 150 180
C
1500 400 100 150 180
D 1500
400 100 200 200

CO
CO
Table 2 Campo Pisano mine. Technico-economical comparison of cemented backfill operation during three semesters of the project
ITEM Backfill emplaced [Compressed air (*) | Compressed air costs
Units m ~ 3 per man hour
Semester of project i
1.03 m ~ 3 p e r m ~ 3 278 ITL*m~-3 1 3929
2 1.28 216
5132
3 1.32
54 1688
(*) For removing concrete obstructions in the delivering pipeline Expressed as cubic meter free air per cubic meter backfill
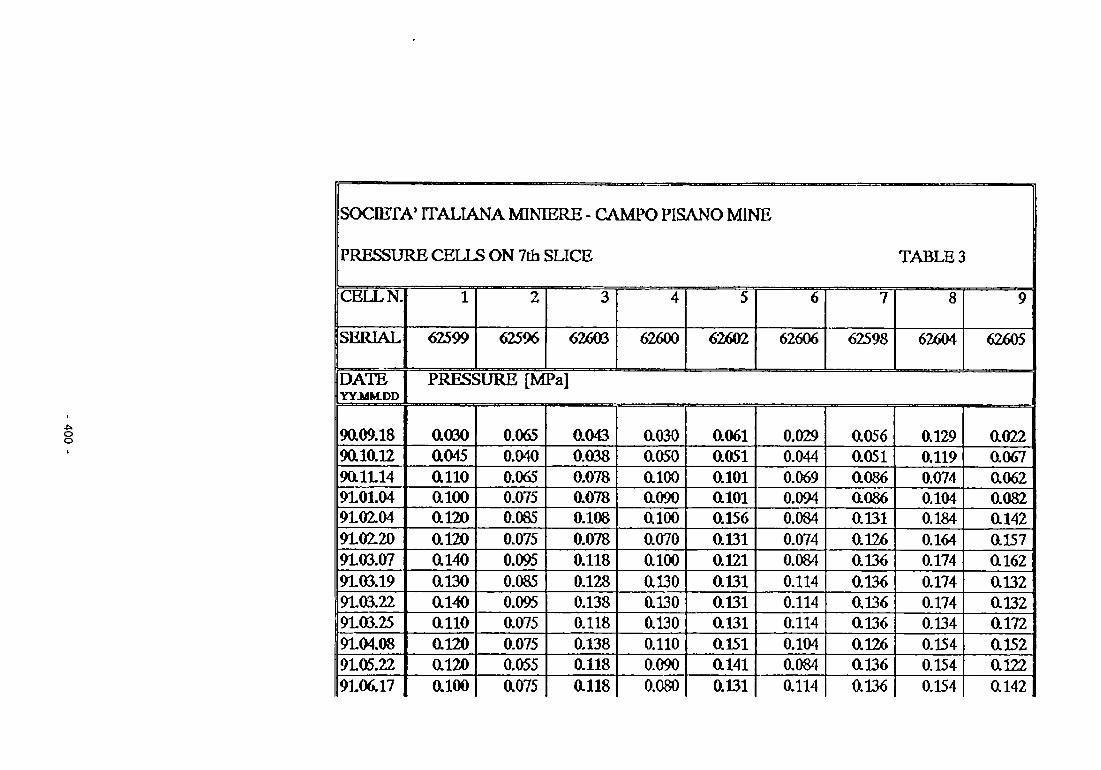
-U o o
socmrrA' ITALIANA MINIERE - C A M P O PISANO MINE
PRESSURE CELLS ON 7th SLICE
CELLN.
SERIAL
DATE YY.MM.DD
9a09.18 90.10.12 9aiL14 9101.04 9102.04 9102.20 9103.07 9103.19 9103.22 9103.25 9104.08 9105.22 9106.17
1
62599
2
62596
3
62603
PRESSURE [MPa]
ao3o a045 a n o aioo 0.120 a n o ai40 ai30 ai40 a n o ai20 ai2o aioo
0.065 0.040 0.065 0.075 0.085 0.075 0.095 0.085 0.095 a075 0.075 0.055 a075
0.043 0.038 0.078 0.078 0.108 0.078 0.118 0.128 0.138 0.118 0.138 0.118 aiis
4
62600
ao30 aoso aioo ao9o aioo ao70 aioo ai30 ai3o ai30 0.110 0.090 0.080
5
62602
ao6i aosi aioi a ioi ai56 a m 0.121 a Bi ai3i a i3i a m a 141 ai3i
6
62606
0.029 0.044 0.069 0.094 0.084 0.074 0.084 0.114 0.114 0.114 0.104 0.084 aii4
7
62598
a056 aosi a086 a086 ai3i ai26 ai36 0.136 ai36 ai36 ai26 ai36 ai36
TABLE 2
8
62604
0.129 0.119 0.074 0.104 0.184 0.164 0.174 0.174 0.174 0.134 0.154 0.154 0.154
1
9
62605
a022 a067 a062 a082 ai42 ai57 a 162 ai32 ai32 a 172 a 152 ai22 a 142
RESEARCH AREAS 5.3 Si S.4
APPLICATION OF ROBOTICS IN MINES

AUTOMATION OF TRUCKS USED IN UNDERGROUND AND OPEN CAST MINES
Project Leader: J. VEDIE Tecminemet, Trappes, France
D . MechIneau Cemagref, Antony, France
C.F . H i g g l n s Nei Victor Mining Equipment L t d . , Tyne and Wear, United Kingdom
C o n t r a c t MA1M-0016-C
1 . OBJECTIVE
1.1. FINAL OBJECTIVE
The final objective for this program was to produce a truck guidance and control system for mining exploitation.
The truck is not an Intelligent device able to find its way on an unknown route, it has to learn a route with a driver on-board and has to drive alone on this route later on.
The learned route is the route between a loading station and an unloading station. At the loading station and discharge point, the truck is guided by an operator under remote control, to the required position.
The on-board truck guidance system, totally self-sufficient, uses only Inactive fixed beacons Iayed on the road sides.
The type of driving fitting best to a mining environment Is the comparison between a learned route, Initially setup, and a recopled route during the exploitation.
Using these trucks In any industrial environment Implies that a central I zed command and control facl I I ty exists as well as an efficient obstacle detection system.
1.2 THE OBJECTIVE OF THE FIRST PHASE
During this first phase, the goal was to prove the feasibility for an automated truck guidance system using ground based Inactive beacons.
403

In order to achieve this goal, the program Included design and Implementation of a lab vehicle allowing easy system deveIopment.
2. INTRODUCTION
2.1 STATE OF THE ART
Vehicle guidance technology has been widely developed for the last ten years during which It was solidly proven that the driving and control of a vehicle in an Industrial environment was possible.
The majority of existing systems uses an electrical wire embedded in the road to guide the vehicle. Some other techniques with fewer success also exist such as optical detection of a continuous guideline, bar code reading and infrared homing.
It is not possible to apply all of these techniques In a mining environment which prohibits many technical choices.
2.2. TECHNOLOGICAL INTEREST
2.2.1 Modular driving system The different parts of the automated vehicle were specially designed to be fully modular. The guidance system based on continuous lateral guidelines on each side of the road Is particularly well adapted for mining atmospheres; using the same vehicle In another context, allows us to extend our research to other type of guidance systems such as embedded wire guidance or radio guI dance.
The driving system that uses the vehicle Internal sensors data such as steering wheel angle sensor or speed value is fully adapted to any guidance system.
2.2.2 GuI dance method The retained guidance system allows to use Inexpensive measuring devices technology for position measurement without renouncing redundancy. The road side equipment made of painted iron sheets Is also fairly inexpensive.
- 404

The guidance method Is really well adapted to a mining context because of the short measurement distances. Those distances correspond more or less to half width of the road, which would still allow the use of optical detection In the dusty mine atmosphere where the detection limit would be short.
2.3 . ECONOMICAL AND SOCIAL INTEREST
2.3.1 Automated driving
Automated driving of a transport truck procure many advantages In various domains :
Completely automated trucks are necessary when the atmosphere Is dangerous to humans.
It is possible to work with automated trucks twenty-four hours a day without losing time to change drI vers.
A human driver may be subject to human problems such as falling asleep or fainting. By continuously monitoring truck parameters It Is possible to generate an emergency stop at any Instant in time when a mechanical problem Is Identified.
With the precision of the guidance system and driving system precision, automated trucks will be able to drive along more precise trajectories than human drIver.
For a complex haulage environment where many trucks have to share the roads, there will be consequently less risks of accidents. It Is a I so a way to Increase rentablllty and to improve truck performance.
2.3.2 Automated trucks In various applications
The whole system is presented as a toolkit including :
A drIvIng too I . A navigation tool to drive along a learned route. A guidance system. A truck and haulage control center.
Each tool Is quite Independent from the others and can be combined In various ways to adapt their performance to the environment where they will be used.
405 -
2.3.3 Mining environment In mining environment, the atmosphere can be dusty, hot, suffocating etc... Mining exploitation needs Important ventilation equipment bringing fresh air or maintaining acceptable temperature In mine tunnels Is a very expensive operation. Automated trucks can drive In tunnels with a very high temperature or with no ventilation where a human driver cannot survive. Mining exploitations use very big trucks In order to limit the number of drivers, to decrease expenses and, therefore, Increase the mine rentablllty. Mines will be able to increase their number of trucks because they wl I I not need drivers. Therefore, trucks could be smaller and less expensive for maintenance. The haulage and truck control center will provide a real time Image of the mine performance depending on the ore evolutI on.
2.3.4 Other contexts As stated before, automated trucks will not be only designed for a mine environment. This project can be directly adapted to various domains such as big civil works projects, and, with a few changes in the guidance system, to transport shuttles in airports or exposition sites etc... The guidance system based on road side barriers is usable In any environment but Is not optimal. It Is particularly well adapted to mines that exclude a lot of other guidance systems which could however be taken into account in other appI ications.
2.3.5 Ma intenance Automated truck control and automated driving necessitates the supervision of main truck parameters such as fuel consumption, oil level, engine temperature etc... Maintenance Is fairly easy because of this supervision. The supervisor could edit a daily maintenance report and drive a deficient truck by remote control to a maintenance shop where It could be repaired.
- 406 -

3. EXECUTED TASKS 3.1 GUIDANCE METHODS Amongst all the guidance techniques possible, we Investigated two of them in depth. 3.1.1 RefIectors Road descrIptI on
Along the way there are static beacons separated by 50 meters. Those beacons are made of a pole supporting two reflectors on the same vertical line.
GuIdance system
Two cameras are fitted on the lab vehicle . Each of them aims at one road side and must see two beacons permanently. The vehicle position is then computed using the angle between the two beacons and the camera.
VaIIdatI on trying out
In order to validate this system, a set of pictures was taken and processed using appropriate software. Those pictures were taken in numerous daylight conditions and the resulting processed pictures gave us a good idea of the performances of this solution. This solution gives an accurate enough position providing a large number of beacons is used In the curves. The distance between two beacons must not exceed fifty meters so that simple Image processing can be used (threshoIdIng) . This study was cancelled because of the processing time needed. Furthermore, the distance between the camera and the sign posts is a potential source of trouble in a dusty mining environment.
3.1.2 LateraI guIdeI Ines Road descrIptI on (figure 1)
A guideline or barrier is to be mounted on each side of the road where the vehicle has to drive. This barrier, made of flat steel or painted wood, runs the full length of the road .
407
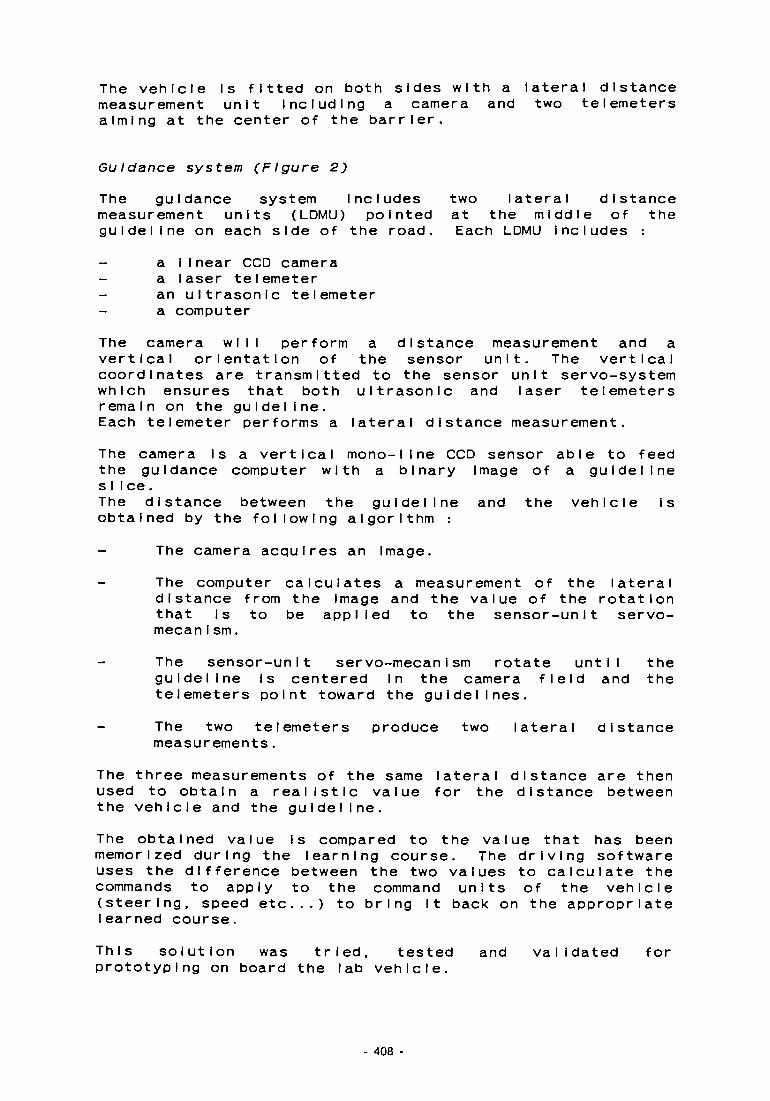
The vehicle Is fitted on both sides with a lateral distance measurement unit Including a camera and two telemeters aiming at the center of the barrier.
Guidance system (Figure 2)
The guidance system Includes two lateral distance measurement units (LDMU) pointed at the middle of the guideline on each side of the road. Each LDMU includes :
a linear CCD camera a laser telemeter an ultrasonic telemeter a computer
The camera will perform a distance measurement and a vertical orientation of the sensor unit. The vertical coordinates are transmitted to the sensor unit servo-system which ensures that both ultrasonic and laser telemeters remain on the guideline. Each telemeter performs a lateral distance measurement.
The camera is a vertical mono-1 I ne CCD sensor able to feed the guidance computer with a binary Image of a guideline si Ice. The distance between the guideline and the vehicle is obtained by the following algorithm :
The camera acquires an Image.
The computer calculates a measurement of the lateral distance from the image and the value of the rotation that Is to be appI led to the sensor-unit servo-mecanIsm.
The sensor-unit servo-mecanIsm rotate until the guideline Is centered In the camera field and the telemeters point toward the guidelines.
The two telemeters produce two lateral distance measurements.
The three measurements of the same lateral distance are then used to obtain a realistic value for the distance between the vehicle and the guideline.
The obtained value Is compared to the value that has been memorized during the learning course. The driving software uses the difference between the two values to calculate the commands to apply to the command units of the vehicle (steering, speed etc...) to bring It back on the appropriate learned course.
This solution was tried, tested and validated for prototyping on board the lab vehicle.
408

3.3 THE LABORATORY VEHICLE In order to have an automated truck without expensive transformations, we needed a vehicle with a continuously variable speed drive we have therefore chosen a small agricultural machine with hydrostatic transmission controlled by solenoid valves and electrically actuated Jacks (the stripper). Controlling the stripper's commands has been also fairly easy because of Its totally hydraulic transmission and steering equipment. We have added sensors to measure the steering wheels angle and to have an odometrlc measurement of the covered dI stance. A magnetic compass and a gyrocompass were selected to furnish a measurement of the vehicle's heading. It was therefore possible at any Instant in time to measure the main driving parameters such as speed and steering angle. A mechanization of the main commands of steering and speed control was added to obtain a total driving automation of this laboratory vehicle. With those equipments and with some software, the vehicle was then able to drive along a route repeating a pre-learned trajectory, using the Internal vehicle parameters, but compIeteIy bIind. This type of automation was not precise enough and has to be improved taking Into account external data to correct internal trajectory data with real data measured along the road. So, a guidance system was added to drive the vehicle using external data such as the position measured by means of physical barriers placed on either side of the road. Then we proceeded to the last phase covering the Integration of all the navigational equipments and the software modifications Implied by the changes In equipment. Due to this new guidance system, the vehicle is now able to take In account external data such as Its absolute position on the road on which its route Is superimposed and to relocate Itself periodically. The lab vehicle realized at this stage allowed us to proceed to numerous trials and tests.
409
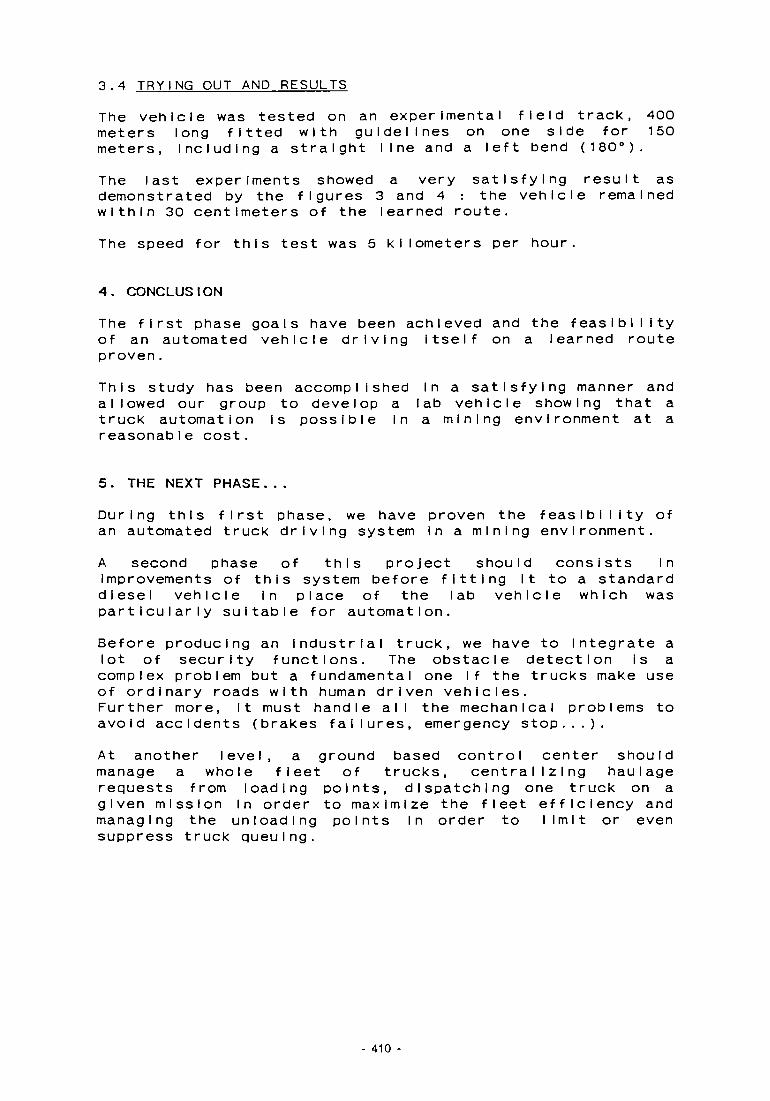
3.4 TRYING OUT AND RESULTS
The vehicle was tested on an experimental field track, 400 meters long fitted with guidelines on one side for 150 meters, Including a straight line and a left bend (180°).
The last experiments showed a very satisfying result as demonstrated by the figures 3 and 4 : the vehicle remained within 30 centimeters of the learned route.
The speed for this test was 5 ki lometers per hour.
4. CONCLUSION
The first phase goals have been achieved and the feasibility of an automated vehicle driving itself on a learned route proven.
This study has been accomplished In a satisfying manner and allowed our group to develop a lab vehicle showing that a truck automation is possible In a mining environment at a reasonable cost.
5. THE NEXT PHASE...
During this first phase, we have proven the feasibility of an automated truck driving system in a mining environment.
A second phase of this project should consists in Improvements of this system before fitting it to a standard dIeseI vehicle in place of the lab vehicle which was particularly suitable for automation.
Before producing an Industrial truck, we have to integrate a lot of security functions. The obstacle detection is a complex problem but a fundamental one if the trucks make use of ordinary roads with human driven vehicles. Further more, It must handle all the mechanical problems to avoid accidents (brakes failures, emergency stop...).
At another level, a ground based control center should manage a whole fleet of trucks, centralizing haulage requests from loading points, dispatching one truck on a given mission In order to maximize the fleet efficiency and managing the unloading points In order to limit or even suppress truck queuing.
410
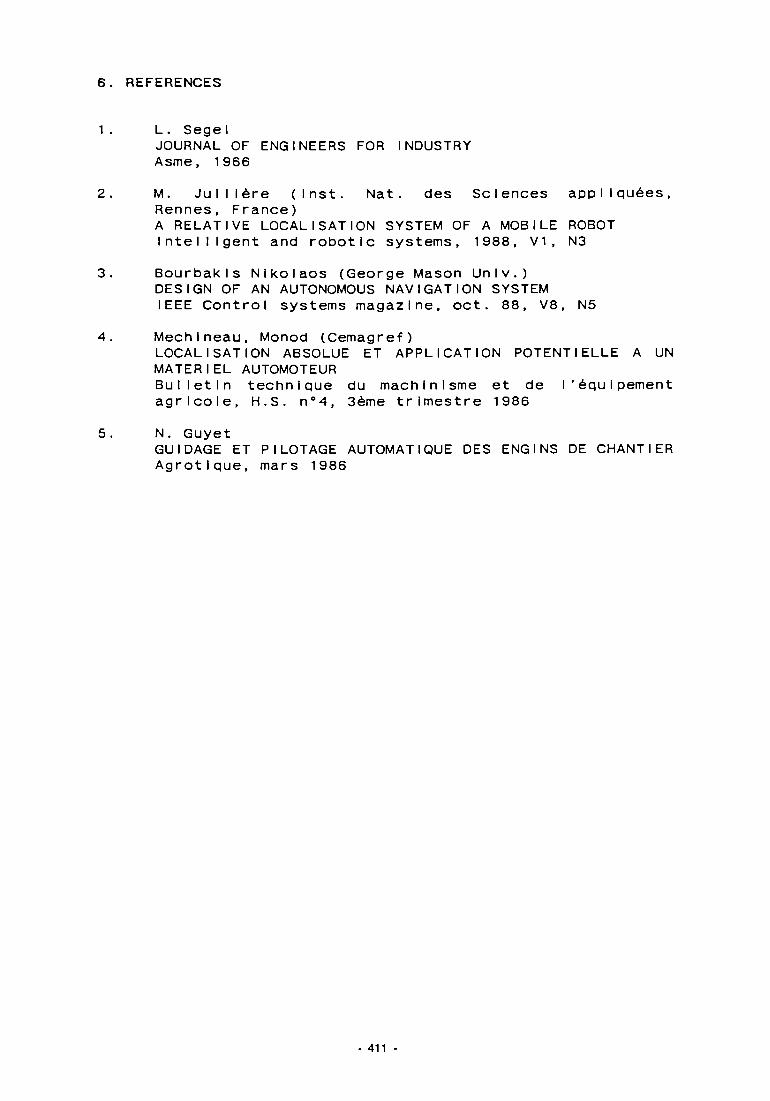
REFERENCES
L. Segel JOURNAL OF ENGINEERS FOR INDUSTRY Asme, 1966 M. Jul Mere (Inst. Nat. des Sciences appI Iquées, Rennes, France) A RELATIVE LOCALISATION SYSTEM OF A MOBILE ROBOT Intelligent and robotic systems, 1988, V1, N3 Bourbakls Nlkolaos (George Mason Univ.) DESIGN OF AN AUTONOMOUS NAVIGATION SYSTEM IEEE Control systems magazine, oct. 88, V8, N5 Mechlneau, Monod (Cemagref) LOCALISATION ABSOLUE ET APPLICATION POTENTIELLE A UN MATERIEL AUTOMOTEUR Bulletin technique du machInIsme et de I'equipement agricole, H.S. n°4, 3eme trimestre 1986 N. Guyet GUIDAGE ET PILOTAGE AUTOMAT I QUE DES ENGINS DE CHANT IER Agrotlque, mars 1986
411 -

Figure 1 : The road is Lined by two barriers on either side
Figure 2 : The sensor unit servo-systen
Figure 3 Figure 4
413

ROBOTICS OF MINING MACHINES OF THE ROADHEADER TYPE TO OBTAIN SELECTIVE AUTOMATIC CUTTING
P r o j e c t Leade r : J . L . FUENTES-CANTILLANA AITEMIN. Madr id , Spain
J.F. Raffoux, Ph. Villeneuve de Janti CERCHAR, Rueil-MaImaison, France
Contract MA1M-0053-C
1. OBJECTIVE
A research project on automation of a roadheader in selective cutting operation has been carried out in collaboration by AITEMIN (Spain), CERCHAR and LAAS (France). It Implies the recognition of minerals and its distribution at the cutting face, as well as automatic generation and execution of adequate cutting trajectories. The case study Is a potash mine In northeastern Spain. Computer vision was selected as the most convenient sensing technique to provide an ore distribution map. A complete system has been developed to perform on-I i ne Image processing and boom control at the face. The project has been partially financed by the Commission of the European Community, through the Raw Materials programme (DG XII).
2. INTRODUCTION
2.1 STATE-OF-THE ART OF AUTOMATION IN ROADHEADERS
Most of the experimental work for roadheaders automation has been centered in the operations which Imply cutting a complete section which has a constant prof I le, or shows only siIght changes, and with an arrangement of the cutting sequence subject basically only to the restrictions arising from the geometrical or geotechnical conditions. Nowadays, the market offers systems able to control automatically the cutting of a fixed profile, which are applied to build roadways or tunnels.
The problem becomes more complex, however, when the distribution of the different ores or rocks at the face has to be taken into account, since the cutting sequence will change according to the geometrical distribution of those materials, specially In Irregular deposits. The foregoing happens, for Instance, in mining operations where ore and waste are found In the face and have to be cut
415

separately to avoid dilution, or If some seams have to be cut before others to Improve the cutting operation efficiency. In these cases, It Is necessary to provide the automatic control system with sensing devices able to detect environment conditions, as well as with a certain level of Intelligence to take appropriate decisions, so that the system can automatically adapt Itself to the natural changes In the geology.
2.2 GOALS OF THE PROJECT
The goal of the project is, basically, to study the feasibility of an automated system able to control the selective cutting operation of a roadheader working In an underground potash mine.
For this purpose, the following specific goals were defined:
a) Evaluation of different techniques suitable for ore Identification at the face in normal operation.
b) Development of data processing tools capable to produce a "face map" representing ore distribution In the face.
c) Development of a cutting plan generator taking into account selectivity, room cross-section, and cutting head dimensions.
d) Design and Implementation of an adequate control system for the roadheader, with all required sensors and actuators.
e) Development of control software to conduct a cutting test.
f) Test of the whole system operation In real conditions under human supervision.
3. DESCRIPTION OF THE TEST SITE
The system has been tested on an Alpine AM-100 roadheader which Is working at present in the Potasas de Llobregat Mine, that exploits an ore body about 50 km 2 large located some 70 km from Barcelona, in the Northeast of Spa i n.
The orebody consists of two sylvlnite seams, rather close to each other, located at 500 m depth. Although thickness values are very variable, average values are shown In figure 1. Each sylvinlte seam actually consists of many alternating sylvlnite and halite seams, a few centimeters thick, with very thin clay seams Intercalated. On the other hand, the overall orebody Is quite undulated and shows a large number of mu I locky areas. Due to the foregoing, the mine profitability is rather tight and so productivity and low ore dilution are of major Importance.
416 -

The operation is Implemented In two successive passes, as shown In figure 1, leaving the carnal lite as roof, and adapting the operation to the changes In thickness and slope of the seams. Selective cut Is performed In every face and, while the ore Is conveyed to the extraction shaft, the salt Is dumped In the nearby mined rooms. The mine Is currently equipped with 13 Alpine AM-100 roadheaders which provide a total output of 270,000 tpy K20. The weight of these machines is 95 tons and cutting motor power is 300 kW.
4. MINERAL RECOGNITION Several techniques to discriminate the different minerals present at the face were tested:
Natural gamma radiation showed poor spatial resolution and difficulties to be Installed In the moving cutting head.
- Microwave absorption was too much dependent on surface conditions such as roughness, water film presence, etc. Vibration and noise analysis did not provide possibilities for discrimination In this case.
Finally, vision was selected as the most convenient technique for this application and so most of the research work was devoted to it.
5. COMPUTER VISION 5.1 SPECTRAL ANALYSIS The feasibility study of vision as sensing technique started with an spectral analysis of the ores present In the mine. The choice of CCD solid state video cameras as sensing devices (for robustness, availability, standard output and cost reasons) restrained the study to the visible and near infrared range of the spectrum, in which those devices are sensitive. A computer-controlled spectrometrIc analysis system was set up to measure, store and process reflectance spectra (between 350 and 1000 nm) from each ore sample In a set of 70 blocks composing the complete stratI graph Ic column of the mine. The study concluded that colour differences among the ores depended on spectrum shape, not on its level. Halite tends to have a higher relative level In the green range than sylvlnlte. Thus, If the spectra are normal I zed at a
417

proper wavelength, ore classification becomes evident. Figure 2 shows average spectra for five minerals after normalization at 525 nm.
In view of the foregoing, it was decided to define a discriminating value, K, as the ratio of:
reflectance at 625 ± 25 nm K =
reflectance at 525 ± 25 nm
Figure 3 shows the values of K computed for all the spectra. The accuracy of such classification Is quite significative although there Is overlapping between some sylvinlte and Intermediate salt samples, and carnal lite cannot be separated.
In order to discriminate the ore distribution In a face it is required to compute the K value at every point. To that end, two monochrome images should be acquired with narrow passband filters centered at 525 and 625 nm, to be then divided point by point. Another possibility that simplifies camera mechanics is the use of a colour camera, as the 525 nm and 625 nm filters can be substituted by the In-built green and red filters, with a small degradation of classification accuracy.
5.2 IMAGE PROCESSING The research on image processing algorithms was based on a set of images recorded on videotape in the mine with a professional colour camera, later decoded to RGB and digitized by the image processor.
The performance of red/green ratio for direct ore classification of Individual pixels was too poor to be effective, because of:
overlapping between K values for the ores, seen in f i gure 3. colour variations in cutting head bit marks on the face. noise Introduced by camera, recorder and decoder.
Thus, a new processing algorithm was devised to perform classification after region segmentation, to compensate for the variations of pixel colour through averaging. It took advantage of a key characteristic of the orebody: seams of sylvinlte, carnal lite and intermediate halite, all of reddish colours, are always flanked by halite or clay seams, of unsaturated colours. Region classification was essayed with several techniques, such as split and merge, frequency domain analysis, saturation, R/G ratio, and discriminant analysis, which gave best results.
418

Image processing algorithm was finally composed of three steps:
Segmentation: the red/green ratio Is combined with a quadratic discriminant function to produce an Image highlighting reddish seams, which Is thresholded and label led.
- Classification: four quadratic discriminant functions are applied to the original Image over the segmented regIons,cI ass IfyIng each of them as carnal lite, A or B sylvlnite, or halite. HomogenIzatI on: regions are merged, their outlines simplified, and very small regions are removed, leaving the main seams.
AlI the above process Is performed by software downloaded on the Image processor and executed by Its own local microprocessor, leaving the main CPU free for other intensive tasks.
Figure 4 Illustrates the typical steps In the process of a face colour Image acquired at the mine.
5.3 IMAGE FUSION
In the roadheader being used, there Is no safe location for the camera which would provide an obstacles-free view of the whole face. Therefore, It was required to sep up two cameras at different locations In such way that they cover areas which complement each other. As a result, the data from two cameras, located at different positions, has to be combined Into a single Image at some stage of image processing.
The problem of images fusion Is solved in two stages:
A calibration of the system composed by cameras, roadheader and face Is initially carried out to determine the conversion equations between their respective reference systems, and to estimate the dlstorslon effects of the wide-angle lenses. Through previous equations, any pair of Images is transferred to the same reference system and the data from both images Is combined In the areas where overlapping exists.
Figure 5 shows an example of Image fusion from two different positions and attitudes, with a plane target sur face.
419 -
5.4 FACE MAPPING Face mapping consists of generating a map of the mineral distribution on a face, In the form of a set of polylines which represent the boundaries between the different seams present in the processed Image.
6. OPERATION PLANNING Once the face map is produced, a software module generates the most adequate cutting trajectory, which Is In principle different for every new cut. This module takes Into account the desired final profile, roadheader operational limitations, and the constraints Imposed by loading procedure, shuttle car capacity, and the mining method ItseIf.
By now, no optimization criteria have been Introduced in the operational planning, although the produced trajectory is Intended to be an "efficient" one. As an example, a face map as shown In figure 6a would be split Into regions as in figure 6b, and cut following the trajectory shown In figure 6c.
7. CONTROL SYSTEM STRUCTURE The control system Is based on a double-computer configuration: a real time control unit located on the roadheader, and a main unit located outside the mine, in communication through a serial link 4 km long, as shown in fIgure 7.
The control unit located at the machine is a diskless VMEbus Industrial computer dedicated to acquisition and process of all data from cameras and sensors, and execution of machine control commands and cutting schedules received from the main unit, through actuators on electric and hydraulic equipment. This unit Incorporates dedicated hardware such as an Image processor and analog/digital I/O and communications boards. The unit is well protected against impacts and vibrations and Is equipped with an uninterrupted power supply and Its own cooling system since the environmental temperature stays around 37°C. The main unit at the surface Is a VMEbus Industrial computer running UNIX dedicated to software development work, remote system monitoring and operation planning and control. To start the system, the main unit downloads the different software modules to the underground unit, until the system Is up and running. In this first test, however, the system was controlled from the man-machine Interface at the underground unit.
420
8. MINE TEST
Conditions In the mine where system test has been conducted were hard, due to the dusty and saline environment, high temperature and distance from the surface. Time available for tests could not be as long as desired, but has been enough to find out the actual possibilities and limitations of the system. The basic problem found in the mine test was the low quality of the Images provided by the video cameras, mainly due to insufficient resolution and poor colour qua I I ty (most seams of the face are very thin compared to pixel size), which could not be properly processed by the vision system. But In the developing Industrial camera market, probably new products will soon appear providing adequate quality at an affordable price. Positive results were obtained with:
Image acquisition: worked well in terms of camera positioning and face coverage, although stronger mechanical protection for cameras and lighting Is requI red. Image processing: full mineral Identification process worked successfully on the onboard computer with videotaped Images. Other programs: camera calibration, image fusion, face mapping and trajectory planning programs were tested on the surface computer at the laboratory. Trajectory execution and control: worked well although horizontal movement needs adjustment due to nonlinear boom hydraulics behaviour. Software structure developed for underground unit based on VERSADOS real-time multitasking kernel operated successfully. System hardware: worked properly without major probI ems,a I though the protection of some sensors should be improved. Communication link between underground and surface computers could not be fully debugged to achieve expected data rate.
9. FUTURE WORK A project has been approved by the Commission of the European Community (DG XII) to develop a second phase of this research project under the Raw Materials 1990-1992 RTD programme. The alms In this new phase are basically to continue with the development, solving the problems found In the previous one and refining the systems and programs produced to make them more robust and less dependent on particular conditions.
- 421

10. REFERENCES 1. BOLDT, H. et Alt. Monitoring, Control and Automation
of Selective Roadheaders, Glückauf, 120 (1984) Nr . 17.
2. WEBER, K.H. and KOGELMANN, W.J. Monitoring and Control of Boom Type Roadheaders. Mining 85 Conference. Brimlngham, U.K. 1985.
3. DOSCO Ltd. Zedmlner Automatic Allgnement and Profile Guidance System for Roadheaders. Novlembre 1988.
4. ANDERSON, D.L. Position and heading determination of a continuous mining machine using an angular position sensing system. U.S. Bureau of Mines Report. 1987.
5. VAGENAS, N. et al. A pa Inted-1 I ne guidance technique for automatic Ioad-hauI-dump vehicles In underground hard rock mines. Mineral Resources Engineering 1988 VoI. 1 No. 4.
6. OLAF, J.H.E. Automation and Remote Monitoring and Control In Mines. Verlag Gluckauf, Essen 1979.
7. WOLFENDEN, J.R. et al. A Collaborative Approach to Automation for Tunelling. 1st IFAC Workshop and Advances in Automation of Underground Hard Rock Mining. VIlle D' Esterel, Quebec, Canada 1988.
8. SAMMARCO, J.J. On-Board Navigation for a Continuous Mining Machine. 3rd Canadian Symposium on Mining Automation. Montreal, Quebec, Canada 1988.
9. FORTNEY, S.J. and LEWIS, J.L. Advanced Mining Machine Automation in Potash. 4th Canadian Symposium on Mining Automation. Saskatoon, Saskatchewan, Canada 1990.
10. SAMMARCO, J.J. Heading Control for a Continuous Wining Machine. 4th Canadian Symposium on Mining Automation. Saskatoon, Saskatchewan, Canada 1990.
11. LATVA-PUKKILA, P. and PULKINNEN, M. Development Trends of Underground Drilling Equipment. 4th Canadian Symposium on Mining Automation. Saskatoon, Saskatchewan, Canada 1990.
12. SCHNAKENBERG, G.H. U.S Bureau of Mines Coal Mining Automation. Research Update. 4th Canadian Symposium on Mining Automation. Saskatoon, Saskatchewan, Canada 1990.
13. ST. AMANT, M. et al. A proposed Optical Guideline for Mine Vehicle Automation. 4th Canadian Symposium on Mining Automation. Saskatoon, Saskatchewan, Canada 1990.
14. WESA, K,G, et al. Clay Seam Sensing In Potash Mines. 4th Canadian Symposium on Mining Automation. Saskatoon, Saskatchewan, Canada 1990.
- 422 -
15. CZAUDERNA, N. Automation at the Cola Faces. Convulsion of the European Communities. Modern Management in Coal Mines. Information Symposium "Improving Productivity through Technology". Luxembourg 1988.
16. WEICHHOLD, W. The Automated Drum Shearer. A module of the Partially Automated Mine. XXII International Symposium APCOM. Berlin 1990.
17. LAURILA, H. and AALTO, M. Automation and Ummaned Operation of LHD Equipment. XXII International Symposium APCOM. Berlin 1990.
18. BRITISH COAL CORPORATION. "Surface Based Supervisory Monitoring and Control System for Coal Faces and Tunnelling Machines". Commission of the European Communities. Directorate General for Energy. Reports on Research Project 7220-AF/827. (Restricted Dlstr ibutIon).
19. BRITISH COAL CORPORATION. "Automatic Control of Drilling Jumbos". Commission of the European Communities. Directorate General Energy Report EUR 12511 EN. Bruselas-Luxemburgo 1990.
20. CERCHAR. "TeIecomnande et Robotisat ion des Haveuses". Rapport final Convention CECA 7220-AD/310. Verneull-en Halatte, 1988.
21. BRITISH COAL CORPORATION. "Development of a plckforce steering system". Commission of the European Communities. Directorate General Energy. Report EUR 12312 EN. BruseIas-Luxemburgo 1989.
22. FUENTES-CANTILLANA, J.L. y CATALINA, J.C. "PosibI I idades de Apllcacl6n de la Rob6tlca en la Industria Minera. VIM Congreso I nternacIonaI de Minerla y Metalurgla. OvIedo 1988.
23. HARTLEY, D. et al. "Development and Application of Monitoring and Control Systems for Coalface Operations". Mining 85 Conference. Birmingham, U.K. 1985.
24. MARTIN, S. "Contribution a I 'automat I sation des haveuses en tallle : Detection robot I see de L'Interface charbon-roche". These de Docteur de L'EcoIe Natlonale Superleure des Mines de Paris. AvrI I 1988. Publiee par L'ENSMP/CMI. Paris. FontaI neb Ieau.
25. MOWREY, G.L. "A new approach to coal interface detection : The I n-seam seismic technique" 5th IEEE Mining Industry Technical Conference. Pittsburgh, Pensylvanla, USA. June 9-11, 1987.
26. SCHULZKE, R. "Die konInuIerI Iche Uberwachung des k20-Gehaltes Im Rohsalz eInes Ka I ibergwerkes zwlschen Abbaufront und Muhle uber Tage". XXII International Symposium APCOM. Berlin, 1990.
- 423 -

27. SIFFERLINGER, N. (VOEST-ALPINE) . Personal CommunI cat Ions.
28. H.A. MARTINS, J.R. BIRK, and R.B. KELLEY. Camera Models Based on Data from Two Calibration Planes. Computer Graphics and Image Processing, 17 (2): 173-180, 1981.
29. A. IZAGUIRRE. Contribution de I ' IntegratI on de la vision a la commande d'un robot. These de trolseme cycle, Laboratolre d'Automat I que et d'Analyse des Systemes (C.N.R.S.), Toulouse (France), December 1983.
30. O.D. FAUGERAS AND G. TOSCANI. Camera calibration for 3D computer vision. In Proc. International Workshop on Machine Vision and Machine Intelligence, Tokyo, February. 1987.
31. F. CHAUMETTE and P. RIVES. ModelIsatlon d'une vision. In AFCET 89, Tome I, pages 527-536. 1989.
32. R.Y. TSAI, Synopsis of Recent Progress on Camera Calibration for 3D Machine Vision. The Robotics Review, 1:147-159, 1989.
33. R.Y. TSAI. An efficient and accurate camera calibration technique for 3D machine vision. In proceedings of the IEE Computer Society Conference on Computer Vision and Pattern Recognition Miami (USA), pages 364-374, June 86.
- 424 -

CAflNAUne
V - IS- I . «,o
INTCRMCDIAIC » A L 1 -
n - • >•'. «,0
"FLOOfl 4AI I •
Figure 1. Stratigraphic column of the deposit
Kcr i tc tane t j p « c t r i b«<w«rn 350.0 ir.J 1688.0 nn
Sp«ctr« NorMAlizcJ At 325 n i
Q-SYLVINI1E i
© - H A i n e
® - CARNAUME
© - STIVINI1E B
© - I N I E R H E D C A I E SALI
Figure 2. Normalized average spectra
425 -
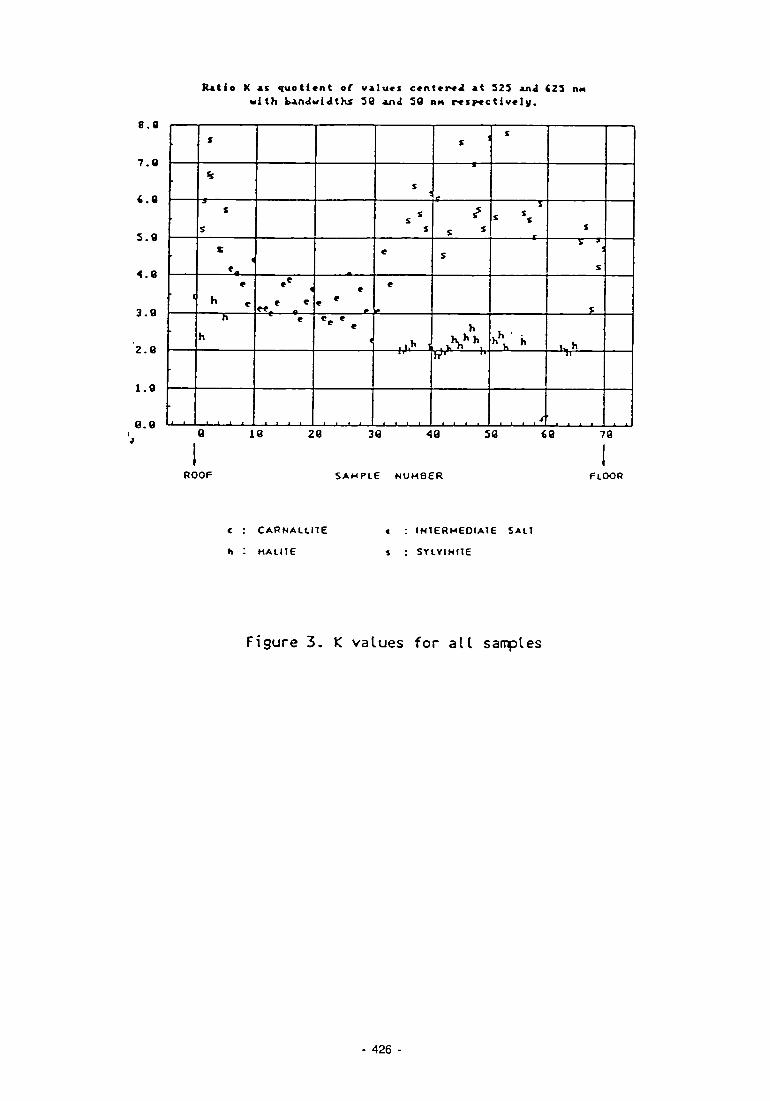
Ratio K as quotient of values centered at 323 and (23 OH with bandwidth^ 30 and 39 nit respectively.
8.0
7.8
(.0
3.S
4.8
3.8
2.8
1.8
8.8
•
•
•
«
•
•
s
%
s
s
<
*
h
h
i I__I i
e «
e
. _!. _1 _1 1
* e «
<
i i i i
s 5
S S
S
«
e
l l-h '
i l l l
s '
s s
s
h h.hh
h»' ''
l l l i
*
5 * *s
X hh H
i i i i
s
! S
s
u ,h ' l l
1 1 1 1
8 18 28 38 48 38 (8 70
I I ROOF SAMPLE NUMBER FLOOR
C : CARNALL1TE
h I HALITE
c : INTERMEDIATE SALT
l : SYLVINITE
Figure 3. K values for all samples
426

Figures 4a-4b. Red and green components of a face image
Figure 4c. Reddish seams highlighted Figure 4d. Segmented image
Figure £e. Classified image Figure if. Homogenized image
427 -
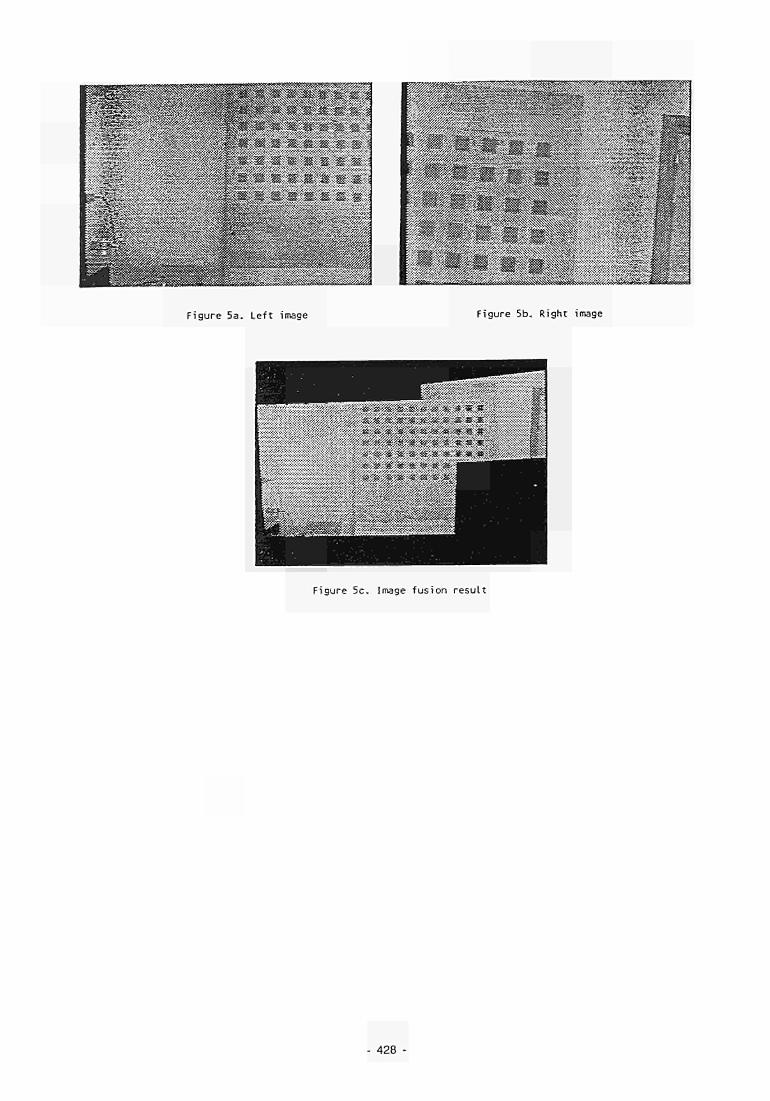
V M M *M aa^ '4AA&>.>*»c <«
Figure 5a. Left image Figure 5b. Right image
Figure 5c. Image fusion result
428
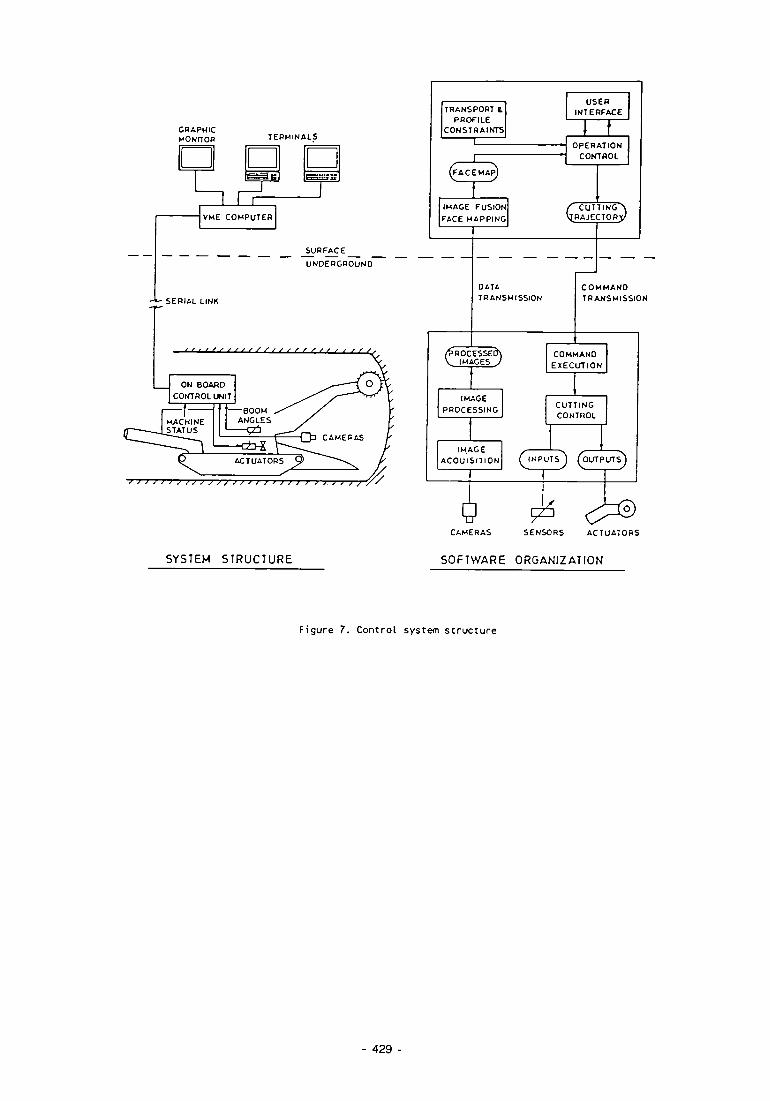
GRAPHIC MONrTOR
| | 1
TERMINALS
| | esae
1 1 ^ s
^ VME COMPUTER
_SURFACE UNDERGROUND
TRANSPORT C PROFILE
CONSTRAINTS L
USER INTERFACE
(FACE MAP)
OPERATION CONTROL
IMAGE FUSION FACE MAPPING
f CUTTINGN VJRAJECTORy/
SERIAL LINK
f , , , / , , , , / / / , , , , , , / , , , , , ,
ON BOARO CONTROL UNIT
ACTUATORS
} > j j > ) / / j / j j s / / } > i i > / t > i >. j / / / y /
SYSTEM STRUCTURE
DATA TRANSMISSION
C ROCESSED\ IMAGES J
COMMAND TRANSMISSION
COMMAND EXECUTION
IMAGE PROCESSING CUTTING
CONTROL
IMAGE ACQUISITION ( INPUTS J (OUTPUTS)
CAMERAS SENSORS ACTUATORS
SOFTWARE ORGANIZATION
Figure 7. Control system structure
429 -

RESEARCH AREA 2.5
MODELLING AND SIMULATION METHODS IN MINING OPERATIONS


SUPPORT CALCULATION IN HIGHLY JOINTED ROCK MASSES
Project Leader: G. VOUILLE Paris School of Mines, Centre de Géotechnique et d'ExpIoration du Sous—sol (CGES), France
University Catholique de Louvain (UCL), Belgium
Contract MA1M-0019-C(CD)
SUMMARY The design of the support systems requires a good knowledge of the behaviour of the Jointed rock mass. A new theory Is proposed to deduce this behaviour from the degree of Joints existing In the mass . A series of experiments has been carried out on concrete semi circular arches of 1 m of internal diameter and 2 m of external diameter with various hand made degrees of Jointing In order to verify the theory. The good agreement between experience and theory proves the validity of the approach of the equivalent continuum for highly Jointed rock masses and enables the design of roof support based on the modelling of the Interaction of the support and the equivalent continuum.
1. OBJECTIVE The final target of the research work was to establ ish a method to calculate the characteristics of the support system required In highly Jointed rock masses. This method have been based on the model I Ing of the Interaction between a support whose mechanical properties are general ly we I I known and a rock mass whose global mechanical behaviour is not easy to quantify, being the result of the combination of the reactions of the matrix and the Joints. The study was Intentionally restricted to the case where, Inside of the rock mass, the spacing between the Joints is smaI I enough, with respect to the dimensions of the openings, to reasonably enable the substitution of an equivalent continuum to the set of blocs limited by Joints that constitute the actual rock mass. In this scope, the more direct purpose of the research work has been the definition of the constitutive law of the equivalent continuum and the experimental determination of Its parameters.
433 -
2. SUMMARY OF THE PREVIOUS WORKS The objective definition of the continuum equivalent to a Jointed rock mass has been for several years one of the main research activity of the Centre de Geotechnlque et d ' Exp I o I tat I on du Sous Sol de I ' Eco I e des Mines de Paris. This research activity should have been devoted to the development of new in situ monitoring devices enabling to Identify experimentally the behaviour of actual rocks masses but we have rapidly given up this Idea since It was obvious that, due to the fact that In situ testing was heavy, expensive and time consuming, Its generalization in the mines would be Impossible.
This experimental in situ approach being abandoned, we have examined In the laboratory, for hand made materials, the influence of the degree of Jointing on the mechanical behaviour and we have been brought to put forward an original theory linking the definition of the equivalent continuum to the more general problem of modelling the post failure behaviour of rocks.
For the last ten years It has been considered that the loss of strength corresponding to the failure may be modelled by a constitutive e I astopIastIc law with strain softening [NGUYEN MINH D. et BEREST P. (1979), SAGHAFI A. (1981)], for a material which Is Initially intact; the softening parameter which defines the strength of the material is the Irreversible equivalent plastic strain. Our laboratory experiments (triaxlal compressive tests) have proved that the mechanical behaviour of an initially cracked material was the same as the behaviour of an Initially Intact material brought to a given state of Irreversible strain (fig.1) (BAHEDI M.L. 1986). We have thus been led to make a further assumption according to which there exists a one-to-one correspondence between the softening parameter and the degree of cracking of the material which has reached the corresponding strain, this degree of cracking or Jointing being defined, for Instance, In terms of Joint area per unit volume of material [BAHEDI M.L (1990)]. In fact we assume that the behaviour of a Jointed material depends only on the behaviour of the matrix and on the degree of Jointing whatever may be the way In which It has been created. Thus to determine the behaviour of a Jointed rock mass It would be enough to get samples of the matrix and, in the laboratory, to carry out post failure trlaxial compressive tests which crack the samples up to the same degree as the actual rock mass and then carry on with the triaxlal tests on this material which could be considered as equivalent to the mass.
- 434 -
3. DETAILED DESCRIPTION OF THE RESEARCH WORK The theory presented In the previous paragraph, however attractive It Is, was only based on the analysis of a few trlaxlal compressive tests, thus the research work carried out together with the Laboratolre du Genie Civil de I'University Catholique de LouvaIn was at first devoted to the experimental validation of this concept of the equivalent continuum In situations more complex than the trlaxlal compressive test which had enabled its definition.
To fulfill this purpose It was necessary to be able to compare the responses to the same efforts of several structures of the same size made of the same material In which only the degree of Jointing was different this was clearly Impossible to do with actual rocks and, due to our previous works and taking Into account the great experience of the L.G.C about the properties of concrete, it was decided to carry out the experimental works on structures made of a reference mortar defined by the L.G.C in such a way to enable Its failure under the loading capabilities of the laboratory. It was possible to vary its degree of Jointing by adding to the mixture of sand cement and water a known amount of sheets of plastic. II was thus possible to make materials with degrees of Jointing of 0, 10 , 20 , 30 and 40 m2/m3.
The loading frames existing In the L.G.C made it possible to test big size structures: During the first step of the research when the composition of the concrete was being defined, three points bending tests have been carried out on beams of 15 x 15 x 200 cm which were simultaneously loaded axia I Iy. As for the following tests, samples of the same concrete were sent to the C.G.E.S and tested in trlaxlal conditions beyond the failure to define the equivalent continuum according to the theory. The comparison of the experimental results with the caculatlons using the finite elements method with the e I astoplastIc behaviour, was satisfactory, the load deflexion curve calculated was very similar to the experimental one, but the beams failed under tensile stress previously to the shear failure Indicated by the caIcuI at Ion .
During the second phase of the research, 10 semi circular arches of 0.5 m of Internal radius, 1 m of external radius and 0.15 m of thickness, simulating the surrounding of a circular gallery, were loaded up to the failure along their external boundary by means of five Jacks: a vertical one with 1000 kN of maximal force and 250 mm of possible displacement, two Inclined ones with 500 kN of maximal force and 250 mm of possible displacement and two horizontal ones with 250 kN of maximum force and 150 mm of possible displacement. The sketch of the experimental device Is represented on the fig 2. The five possible Jointing degrees of 0, 10, 20, 30 and 40 m2/m3 were examined with two arches for each value.
- 435 -

During the tests the displacements and strains of the arch were monitored continuously and It was possible to compare the theoretical and experimental results.
The numerical modelling of the tests was carried out In the C.G.E.S thanks to the Implementation of the code VIPLEF with the new constitutive law derived from the post failure trlaxlal experiments carried out on the samples coming from L.G.C.
The comparison between theory and experience led to a good agreement as far as loads and modes of failure were concerned : the fig.3 shows the good agreement between the plastic zones derived from the calculus and the lines of failure which could be observed experimentally.
At this stage it could be considered that one of the aims of the research was reached and that the model I I ng of the behaviour of a Jointed rock mass by an eIastopIastIc constitutive law with strain softening depending on the degree of Jointing represents correctly the actual behaviour of the mass.
This point being established, since we had In mind to apply the results of the research to actual rock masses, It has been necessary to develop new experimental techniques to measure the parameters of the equivalent continuum. More precisely we needed to know the evolution of the area of cracks during a trlaxlal compressive test after the occurence of the fai lure to get the knowledge of the relationships between crack density and equivalent plastic strain.
It was found that the sound velocity measured during the loading unloading paths (fig.4) could be related to the area of cracks in the sample: It was necessary to make a preliminary calibration of the same material and, after that, the sound velocity at the end of each unloading path could be related quite accurately to the area of the Joints.
A third aspect of the research work was the evaluation of the degree of Jointing of an actual rock mass from the observations which were possible In the mining works : a theoretical study shows that the measurement of the frequency of the Joints along three orthogonal direction A x» ^y> ^ z > enables to bound the actual density by some combination of the two norms ~X x + }\ y + 7\z and
^)AX2 i\y2 + *AZ2 The problem of the design of the support has been dealt with In two different ways the first one Is the experimentation on small scale models, namely new arches with different Jointing degrees (0, 10 and 20 m 2 / m 3 ) with and without small bolts in them. The Interpretation of these results Is not yet finished and It Is thus not possible to comment on I t.
- 436
The second way has been an attempt to apply the results of the research work to the design of the support of the uranium mines of COGEMA (Mine du Fraisse near from LIMOGES and mine de I'Ecarplere In Vendee). The granite of these two mines has been tested In the laboratory and, according to our methodology, a constitutive law has been established for the two rock masses. The roof bolting has two possible parts to play: Either is It bearing or confining, In the first case It acts like a pin into the block which Is ready to fal I , In the second case it app I les to the wa I I of the galleries a supporting pressure which, however small It Is, enables to stop the evolution of a gallery In which the fracturatlon Increases due to an excessive hoop stress with respect to the strength of the mass In Its Initial state.
The modelling technique developed within the frame of this research work deals only with the second part of the supporting system, the confining part, and the calculus carried out in the two mines mentioned hereabove, either with a moderated Jointing ratio (12 m 2/m 3) which corresponds to the galleries driven In the surrounding rock or with a more important Jointing ratio (30 m 2/m 3) corresponding to the galleries driven in the ore, have shown that these galeries should find a state of equilibrium without any support : this proves that in these mines the support plays essentially a bearing part.
It Is not possible in this case to speak of an app I ication of the method since we are not within Its field of application, nevertheless when we continued the analysis for flctlous situations corresponding to more Important depths, the numerical modelling put in evidence the stabilization of the roof due to the bolts and It was established that a criterion for the design of the support is the tensile effort in the bolt which must not overcome 100 kN for each bolt. In the case where this limit is overcome, It Is possible, by Increasing the number of bolts per unit area of roof, to reduce the efforts to acceptable limits and thus to define In an objective way the support needed by the ground.
4. CONCLUSION
The research work achieved In the frame of the contract MA1M-0019-C has enabled to prove that It was possible to substitute to an actual discontinuous rock mass an equivalent eIastopIastIc continuum with strain softening depending on the Jointing ratio of the mass. The small scale experiments carried out in LOUVAIN have enabled to know the limitations of this analogy. The application to uranium mines of COGEMA was not perfectly conclusive due to the shallow depth of this mines.
Nevertheless we think that a useful methodology has been established which will be certainly used In the future for the design of the supporting systems of deep mines.
437 -
5. BIBLIOGRAPHY BAHEDI M.L (1986) Determination de caracteristiques
mecaniques pour les massifs rocheux fissurés. DIpIome d'Etudes Approfondles ENSMP/CGES.
NGUYEN MINH D. & BEREST P. (1979) Etude de la stabiIité des cavltees souterraines avec un mode Ie de comportement éIastopIastique radoucissant. Congres International de Mecanlque des Roches VoI.1 MONTREUX (1979)
SAGHAFI A. (1981) Etude du comportement mecanlque post rupture du mineral de fer. Application au dimensionnement des exploitations mlnleres par llots redults. These de Docteur Ingenleur ENSMP (1981)
BAHEDI M.L (1990) Modélisation par un milieu continu equivalent du comportement mecanlque des massifs rocheux a flssuration diffuse et isotrope. These de Docteur de I 'ENSMP. Special I te: Technique et EconomIe de I'ExpIoitation du Sous So I .
438
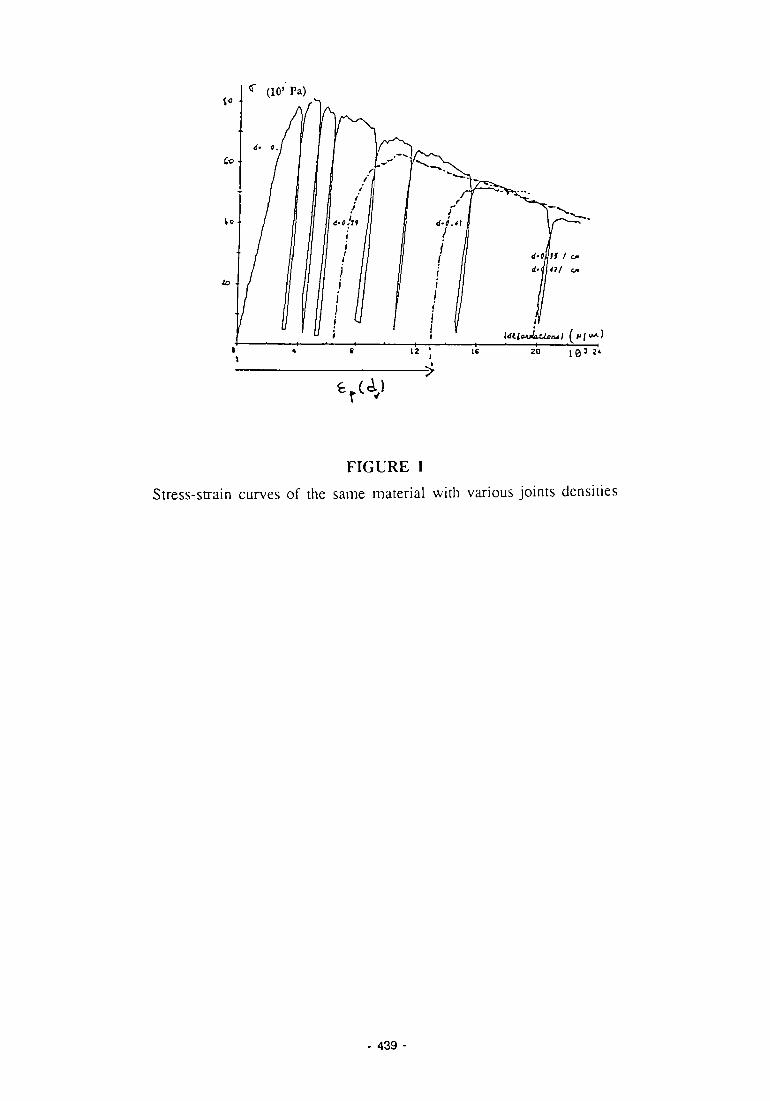
«" (10'Pa)
FIGURE 1 Stress-strain curves of the same material with various joints densities
- 439

• o« cn»'Q«
ColfS en mm
FIGURE 2 Sketch of the loading device
440

FIGURE 3
Contours of the equivalent plastic strain
441

68-r Courbe e f f o r t - d e f o r m a t i o n : mort ter 20 jours i
16 10 20 26 3* 33
deformation en mlcron/reetrei ( x l 03 )
RAPPORT DES VITESSES DU SON V/Vo : MORTIER .
1.2 .
I . l .
I .
o >
> e .9 .
e . s . 8 .7 .
e.e .
y-' .; -• \
/'" / f\... ■' .•;'■' / / j-*.
j
1 1 1 ' 1 ' 1 ■ 1 ■ 1 e 9 !■ IS 28 23 36 3}
deformat ion l ong ! tud ina le (micron/metre) i ( x ! 03
)
FIGURE 4 Comparison between stress-strain and sound velocity-strain curves
- 442 -
SIMULATIONS OF MORPHOLOGIES OF TECTONISED DEPOSITS
P r o j e c t L e a d e r : C. DE FOUQUET R. R o s e n k r a n z , X. F r e u l o n , J . R i v o i r a r d
Ecole des Mines de Par is , Fontainebleau, France
H. M u e l l e r Interplan Uran GmbH, Germany
J. TeIss i e Total Compagnie Miniere, France
Contract number MA1M-0022-C
1. OBJECTIVES
The aim of this research project was to develop a methodology for simulating the morphology of tectonIsed deposits. Often in such cases, the classical gaussian geostatIstlea I methods could not represent the geometry and the relation geometry-grade well enough [1].
Briefly, this present research was to:
describe the geometry and the relation geometry-grade of experimental data; and build models which make it possible to respect this relation, to build simulations, and to condition these simulations to the data.
One deposit was needed as a basis for this research. A second one was to be used to apply and possibly to generalise the method.
2. THE WORK PERFORMED
The first deposit Is Laporte, which has been exploited by Total Compagnie Miniere In France. The second, GrossschIoppen, has been partly mined by Interuran in R.F.A. For both of these uranium deposits, knowing the data was an Important part of the research: data acquisition, and how the different data have been obtained and possibly pretreated, according to the geological conditions and to the development of the exploration or exploitation. This was the object of several exchanges of Information between the partners. Moreover the type of data has proved to have a great Influence on the evolution of the research, opening some doors and closing other ones.
- 443 -
2.1 THE LAPORTE DEPOSIT The first data came from radiometric holes within a separate zone (Laporte Nord). A first contact and first modellings were made [3]. Then we used data from the Laporte open pit itself. They were measures of radlometry, taken at ground level during the exploitation and smoothly drawn by the geologist. The fact that they were split Into 5 classes had suggested using the "discrete Isofactorial models". These models have made it possible to represent the experimental destructuratI on of high grades, I.e. the fact that, the higher the grades, the more erratic their distribution. But we finally were not able to make simulations with these models [4, 1]. Besides, the particular nature and the discretisation in classes compIIcated the comparison between these data and the drI I I ho Ies of the same zone. However, these data, which are probably too smooth and not too reliable, have permitted the most fruitful developments, because we also had the location of the lamprophyres on the same levels of the pits. These veins, although not mineralised in their totality, are a guide to the highest grades. Because of these data, it was possible to build a geometry-grade model, acceptable to the Industrials, and to make the first non conditional simulations [4]. The basis of this model Is given in the next part of this abstract. Lastly, the model I I ng of the holes of the central zone, where the grades had been measured and the lamprophyres Identified, and the conditioning of simulations, could be performed [5, 6, 1].
2.2 THE GROSSSCHLOPPEN DEPOSITS The existence of veins, guiding the mineralisation in Laporte, and supporting it In GrosschIoppen, could, as was expected, make this deposit a good example for testing and possibly generalising the Laporte model. In fact, geology, as we I I as the types of data of Grosssch I oppen, did not perm i t that. Indeed, In GrossschIoppen, the principal veins, although organised in a set, are Individualised. The ore is contained within the veins, In their foot and hanging walls. Ore can be followed along the veins and does not overlap outside. So the relation geometry-grade is different from the Laporte one.
The data, obtained first by Esso during the exploration, then by Interuran, came from surface and underground holes, and from channels across the veins. The original hole data
- 444

had been previously pretreated to make vein crossings, divided Into differently sized and geologically homogeneous parts, Just like channels. This meant that the work had to be carried out separately for each vein. Although not suitable to test the Laporte model, this deposit and these data were Interesting. The Centre de GeostatIstique and Interuran have thought that It was worth working in 2D vein after vein. In any case, the narrowness of the vein (about 2 meters) prevented the mine from taking ore from the foot and the hanging walls without taking the Intermediate material. So we have studied the relation between the geometrical variable, the thickness, and the corresponding grade and metal accumulation. We finally have carried out multivariate simulations of the largest vein, using the classical gausslan transformed method [6, 1].
3. RESULTS 3.1 THE GROSSSCHLOPPEN DEPOSIT As was mentioned, this deposit was finally not suitable to test the model developed on Laporte. So we have oriented the end of reserach work towards a 2D simulation. Each of the 3 principal veins (oriented NNW with a marked dip) has been projected on a NS vertical plan. The statistics have shown: - that the thicknesses were overestimated on the holes,
compared to channels (possibly smudging radiometries); that the channel accumulation could take high values which are not observed on the holes; that the grades are almost independent of the thickness. As this varies relatively little, the variations of grades are linked to those of accumuI at Ions; that the veins had different characteristics.
The heterogeneity between the different veins exists also within a given vein, as Is Indicated by the absence of sill on the varlograms of thickness. The varlograms of accumulation are pure nugget effect, but their gausslan equivalent has an around 5 meter range (possible size of the ore pockets). We have performed a simulation of the largest vein conditioned by its channels. We could have simulated the thickness and the grade Independently, and then deduced the accumulation. But as this is the most Interesting variable, we preferred to obtain it directly by making a Joint simulation of thickness and accumulation. For this, a coregIonaI I sation model had to be adjusted on the gaussian transformed thickness and accumulation.
445
3.2 THE LAPORTE DEPOSIT The most Interesting result of this research Is the geometry-grade model made for Laporte (see [1] the final report, part D [7], for more details). It consists in using two gausslan variables. One is as usual the gausslan transformed grade. The other one is a gausslan variable which, after truncation, generates the I amprophyres. They look like natural forms and were acceptable to the geologists. A positive correlation between the two gausslan variables ensures that the high grades are contained within the I amprophyres. The low grades smudge around the higher ones, overlapping the Iamprophyres. These are only partially mineralised. However the model does not restitute entirely the destructuration of high grades [1]. Lastly, the faults, whose intersections with lamprophyres are genetically linked to the mineralisation, were not taken Into account. Only a few of them were identified on the surveys, and their role was not clear when looking at the distribution of grades.
After this presentation of the model, here are some more practical aspects. The statistics confirm the role of the lamprophyre. The mean grade inside Is more than twice the grade outside. The variograms of the lamprophyre indicator and of the grade show ranges of several meters and anlsotropies (veins are oriented NS vertically). With respect to this model, these variograms must not be directly adjusted. On the contrary one must look for the structure of the gausslan variables which, after transformation, fits these experimental variograms. The lamprophyres gausslan variable is the sum of two anisotropic components. The gausslan transformed grade Is made of the lamprophyre gausslan (In order to respect a correlation estimated to be 0.5) and of an independent residual, which Is Itself the sum of two components. A total of 4 elementary components Is then used to build the model.
Afterwards we have gone on to the simulations: simulation of the grades of a pit level, where lamprophyres are known; 3D simulation of grades and lamprophyres, conditioned by these variables known along the holes.
4. CONCLUSION The modelIsation built for Laporte shows several things. Firstly, It shows that the gausslan models, used for the classical conditional simulations, can now be Interesting for geometries. It Is an Indirect way, compared to the direct one which consists In generating, randomly or not, desired forms (which are sometimes schematic or arbitrary).
446
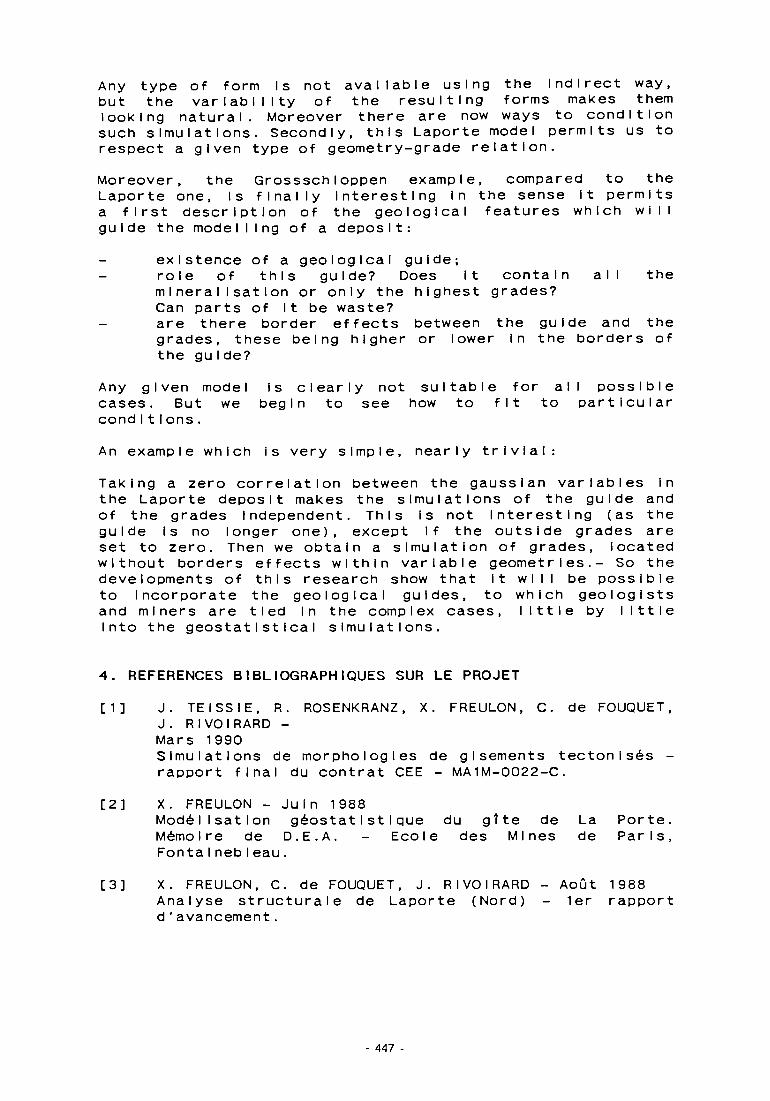
Any type of form Is not available using the Indirect way, but the variability of the resulting forms makes them looking natural. Moreover there are now ways to condition such simulations. Secondly, this Laporte model permits us to respect a given type of geometry-grade relation.
Moreover, the GrossschIoppen example, compared to the Laporte one, Is finally interesting in the sense It permits a first description of the geological features which will guide the modelling of a deposit:
existence of a geological guide; role of this guide? Does it contain all the mineralisation or only the highest grades? Can parts of It be waste? are there border effects between the guide and the grades, these being higher or lower In the borders of the guide?
Any given model is clearly not suitable for all possible cases. But we begin to see how to fit to particular condItIons.
An example which is very simple, nearly trivial:
Taking a zero correlation between the gausslan variables In the Laporte deposit makes the simulations of the guide and of the grades independent. This is not interesting (as the guide Is no longer o n e ) , except If the outside grades are set to zero. Then we obtain a simulation of grades, located without borders effects within variable geometries.- So the developments of this research show that it will be possible to Incorporate the geological guides, to which geologists and miners are tied in the complex cases, I Ittle by I Ittle Into the geostatisticaI simulations.
4. REFERENCES BIBLIOGRAPHIQUES SUR LE PROJET [1] J. TEISSIE, R. ROSENKRANZ, X. FREULON, C. de FOUQUET,
J. RIVOIRARD -Mars 1990 Simulations de morphologies de glsements tectonIses -rapport final du contrat CEE - MA1M-0022-C.
[2] X. FREULON - JuIn 1988 Model Isation géostatistique du gtte de La Porte. Memolre de D.E.A. - EcoIe des Mines de Paris, FontaI nebIeau.
[3] X. FREULON, C. de FOUQUET, J. RIVOIRARD - Aout 1988 Analyse structurale de Laporte (Nord) - 1er rapport d ' avancement.
- 447
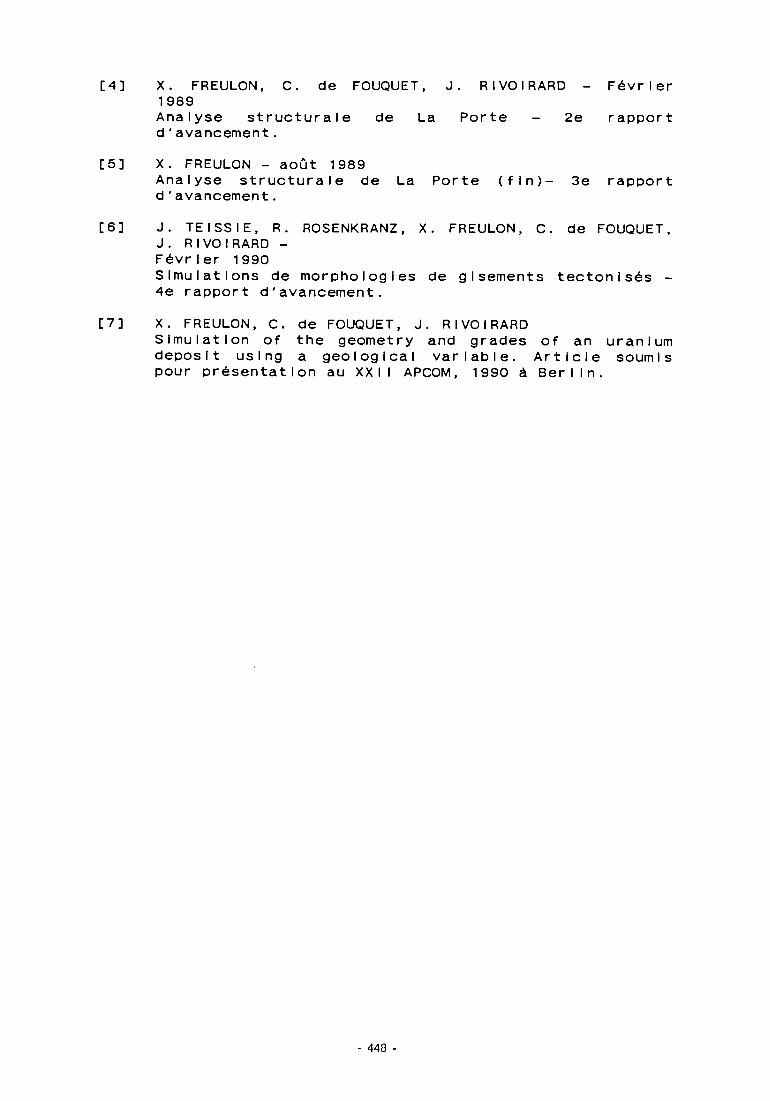
[4] X. FREULON, C. de FOUQUET, J. RIVOIRARD - Fevr I er 1989 Analyse structurale de La Porte - 2e rapport d'avancement.
[5] X. FREULON - aout 1989 Analyse structurale de La Porte (fin)- 3e rapport d'avancement.
[6] J. TEISSIE, R. ROSENKRANZ, X. FREULON, C. de FOUQUET, J. RIVOIRARD -Fevrler 1990 Simulations de morphologies de glsements tectonIses -4e rapport d'avancement.
[7] X. FREULON, C. de FOUQUET, J. RIVOIRARD Simulation of the geometry and grades of an uranium deposit using a geological variable. Article soumis pour presentation au XXII APCOM, 1990 a Berlin.
- 440 -
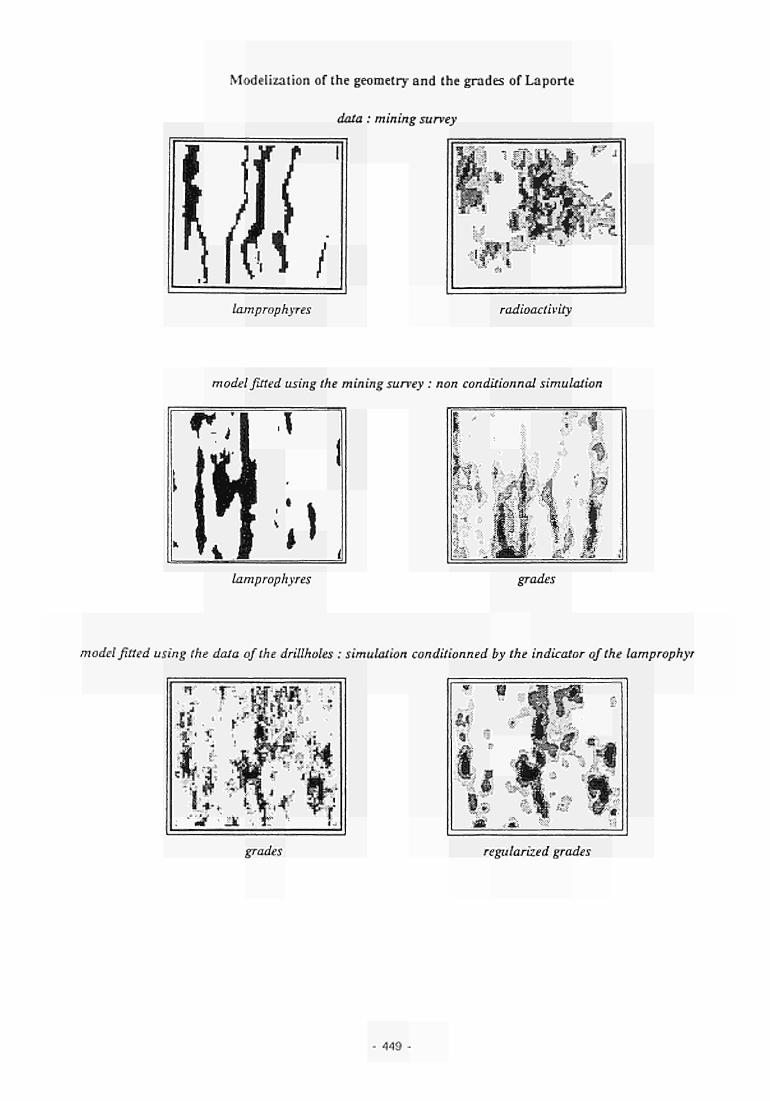
Modelization of the geometry and the grades of Laporte
data : mining survey
Lamprophyres radioactivity
model fitted using the mining survey : non conditionnal simulation
lamprophyres
m f:-!.: 1 14*-' " ■ " • ■ '
: ;•
; :^ $ - *
If: * < t
grades
model fitted using the data of the drillholes : simulation conditionned by the indicator of the lamprophyr
■«r
- * ■ :
it ■*".■ >
grades regularized grades
- 449


NEW FEATURES OF A SOFTWARE FOR SIMULATING MINING OPERATIONS IN OPEN PIT AND DEVELOPMENT TOWARDS MINING
CONTROL AND PLANNING
P r o j e c t Leade r : M. J . DERAISME Geovariances, Avon, France
J . P. RoI ley Armines. Ecole des Mines d'Ales, France
Prof. M. Guarasclo Mining Italiana, Roma, Italia
Contract MA1M-0024-C
1. OBJECTIVES The first topic of the research consists in reinforcing the OP.MINE package for the study of open pit mine project that was developped under contract no MSM 033 F of the previous 82-85 R&D program:
Introduction of mining methods other than by shovels and dumpers. Supplementary functionnaIities for the management of waste dumps and ore stockpiles. Modelling and economic characterization of ore process Ing.
The second topic was to develop a software for recording the production results, short and medium term planning and mining controI. The advantage of such a software Is to improve the decision making on the mine site In order to face problems related to the Imperfect knowledge of the orebody or to the technical Implementation of the mining method.
2. RESULTS 2.1 OP.MINE IMPROVEMENT OP.MINE, as a software for mining feasibility studies, is divided into several modules :
Interactive mine scheduling (OP.Design program).
451
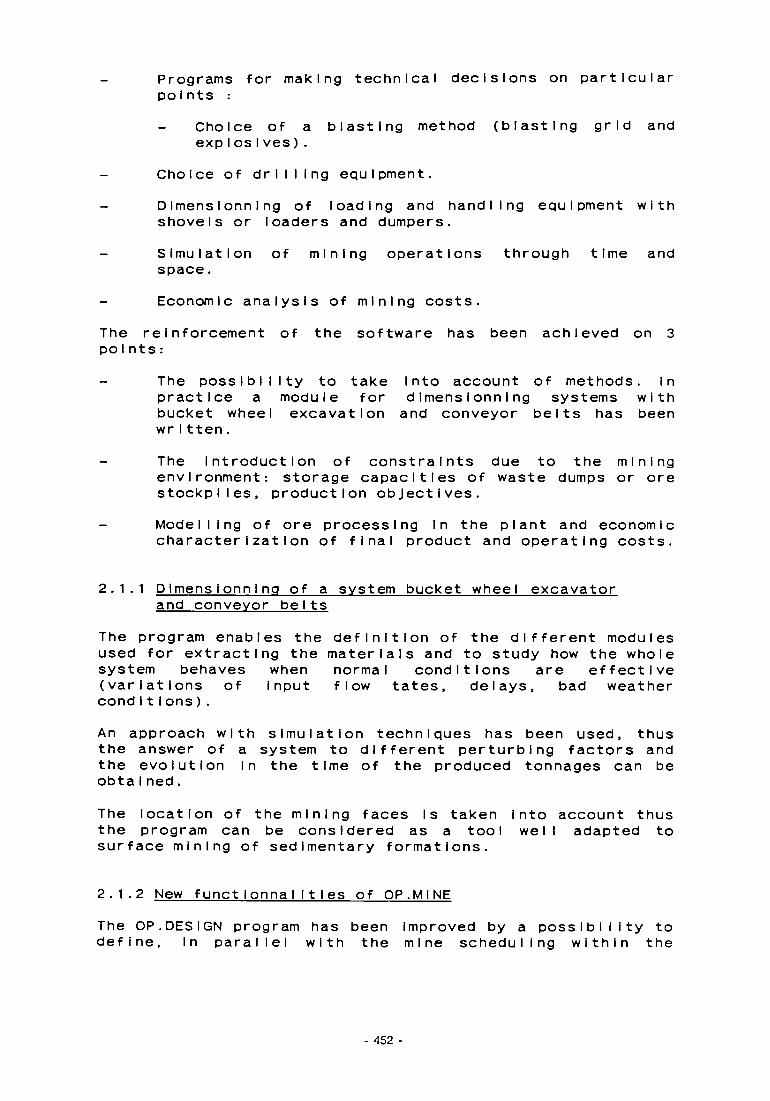
Programs for making technical decisions on particular points
Choice of a blasting method (blasting grid and expIosIves).
Choice of drI I I Ing equipment. DImenslonnIng of loading and handling equipment with shovels or loaders and dumpers.
- Simulation of mining operations through time and space. Economic analysis of mining costs.
The reinforcement of the software has been achieved on 3 points:
The possibility to take Into account of methods. In practice a module for dImensionning systems with bucket wheel excavation and conveyor belts has been wrItten. The Introduction of constraints due to the mining environment: storage capacities of waste dumps or ore stockpiles, production objectives. Modelling of ore processing In the plant and economic characterization of final product and operating costs.
2.1.1 DImensIonnIng of a system bucket wheel excavator and conveyor belts
The program enables the definition of the different modules used for extracting the materials and to study how the whole system behaves when normal conditions are effective (variations of Input flow tates, delays, bad weather condItIons). An approach with simulation techniques has been used, thus the answer of a system to different perturbing factors and the evolution In the time of the produced tonnages can be obtaIned. The location of the mining faces Is taken Into account thus the program can be considered as a tool well adapted to surface mining of sedimentary formations.
2.1.2 New functlonnaIlties of OP.MINE The OP.DESIGN program has been Improved by a possibility to define, In parallel with the mine scheduling within the
452

final pit, the way to store on the dumps the waste contained In the pit.
Thus It Is possible to control the storage capacities and to visualize the evolution of the waste dumps at different stages.
The program OP.SIM for simulating mining operations in open pit has been modified In order to check several mining policies for dispatching the equipment to ore or waste sites. The Idea is to control that the production objectives can be reached and that the plant can be fed regularly In the tIme.
2.1.3 Modelling and economic characterization of ore process ing
An Integrated package performing the both tasks of technical and economic characterization of the concentration plant has been wrItten.
For the technical aspect it Is based on an sequential and modular simulation of flows of materials through all the cells of the Installation.
The feeding flow Is characterized by its distribution of grades and granu I ometr I es. The end user of the package can get the characterization of the output at different points as well as the consumptions (energy and chemical products) by acting on several parameters :
The combination, Interactively defined on the screen, of the elements defining the plant.
- Dimensionning and regulation parameters.
Alternative numeric methods for modelling the physical and chemical processes.
The economic valuation of a simulation can be directly obtained and provides
An analysis of the operating costs.
An evaluation of returns.
Investments costs.
Used as a tool for sensitivity studies, the package enables:
To define the plant flow sheet the best fitted to the characteristics of feed ore.
To forecast the metal recovery and the performance of the pi ant.
- 453

To compare several mining methods producing different flows of ore at the time output, which can be got as a result of the mining simulation by OP.MINE.
2.2 A ID TO PLANNING DEC ISIONS AND MINING CONTROL Mining generally proceeds by assigning objectives at different stages from long term to short term. At the end of a period the production results enable to appreciate the quality of the work. The analysis of the comparison between prevision and actual figures help to Improve the orebody knowledge and consequently the next planning. It contributes also In putting right weaknesses of the mining method. Such analysis involves three tasks of the mining engineer, closely mixed one into the others.
The production recording (quantity and quality of mixed ore, use of production means, evolution of mInIng faces). The planning whose the aim is to decide the zones to be mined, to forecast the production figures, and the allocation of equipment. The control for comparing prevision and actual figures and providing analysis elements of observed devI at Ions.
An integrated package has been developped for achieving these tasks. The great amount of data as we I I as their heterogeneity has led to organize the package around a relational data base. The data that are handled are :
Orebody models (mineralized contours, blocks estimated or simulated by geostatIstIcs). Samples taken at different stages (premining, dumpers, ore stockpI Ies). Geometries (topographies, limits of blasted zones). Technical data (use of equipment).
The access to the data base consists In : Capturing data from the mine. Automatic updating of some fields from other available data .
- 454

Editing of summary reports on temporal or spatial criteria. Choosing a planning and calculating previsions from different available models.
The planning Is defined by Interactive and graphic means :
Representation of top and toe of a given bench with superImposItIon of mineralizations taken out from one or several models contained In the data base.
Digitization of the limits of the zones to be mined starting from the present surface.
Computation of ore and metal content at different cutoff grades with the chosen zones.
Validation of the planning and updating of the previsions In the data base.
When the mining operations are carried out, the data base should be updated to calculate the actual production figures (REALIZATIONS).
In order to compare previsions and realizations a supplementary notion must be introduced the ESTIMATION OF THE REALIZATION.
As a matter of fact only what Is comparable can be compared: as the mined zones do not coincide with planned zones, the estimation provided by the orebody models must be recalculated within the actually mined geometry. The package can calculate three results for making two comparisons :
Comparison FORECASTED / ESTIMATION OF THE REALIZATION, which indicates the gap between the production program and Its carrying out.
Comparison ESTIMATION OF THE REALIZATION / REALIZATION which represents the estimation error since both results are calculated on the same volume.
To get these results some algorithms have been produced
- Calculation of mined geometries obtained as a difference between two topographies.
Calculation of volumes after blasting taking Into account bench slopes and the Irregularity of the bench sur face.
Calculation of the ore / metal content from :
Block models with vertical dimension Independent from the bench height.
455

Horizontal sections containing the geometric description of mineralized lenses.
2.3 EVALUATION OF RESULTS The Initial objectives have been globally reached while on some points the analysis of the problems has led to redefine the research orientations. As an example, one can mention the fact that the simulation of a planning has not been directly connected to the planning software, the reasons are :
The simulation Is based on a probabilistic deposit model. Larger Is the extension of the zones where values are observed, closer Is the model to the reality. One should be careful I In using the simulation on a too little number of blasted zones. The topographies and the digitized zones bench by bench of the planning can be Input in the OP.MINE software which can be run Independently. This has been successfully checked on a yearly mining sequence.
The uranium open pit of Bertholene (TCM-F) has been used for testing the software. Nevertheless, the evaluation of the package can be completed only after It has been used in real conditions on mine site for a long per Iod.
The options that have been chosen when writing the programs led us to be optimistic on these points :
User friendly access to the programs : Interactive definition on the screen of plant fIow-sheet. Interactive generation of the networks of bucket wheel excavator and conveyor belts.
Organization by menus of the planning package. Problems expressed In a way close to the practice of mine planning and final documents directly understandable on the mine site. Graphic control of the decision making :
Visualization support to aid In making decision at the planning stage.
456

Control on the screen of the mined zones at different stages of the simulation with OP.MINE.
3. COMPUTER IMPLEMENTATION Three new packages have been developped, with the following provisional names :
OPCONV : DImensIonning of mining systems with bucket wheel excavator and conveyor belts. The program is written In FORTRAN with the macro-Ianguage SLAM I I .
OP.MILL: Modelling of ore processing. The program Is written in TURBO-C for micro-computer PC MSDOS.
OPPLAN : Production recording, mine planning and control. The software Is written in FORTRAN with two versions :
One for PC /MSDOS using the data base language DBASE M l and a graphic driver for EGA/VGA in extended memory.
One for graphic workstation under UNIX with the data base INGRES.
Potentially the market of those packages and particularly OPPLAN Is wide because It provides an everyday tool for the mining engineers on the mine sites. Moreover the capability of Implementing the software as well on micro-computer PC as on graphic workstation makes the software implementation possible on Important metallic mines and on small quarries.
4. PUBLICATIONS B. Bourgine, J. Deralsme, R. Bruno, H. Fralsse: OP.CONTROL, an Integrated computer system for planning and monitoring In open-pit mines. XXII APCOM, 1990, Berlin.
457

OPTIMIZATION OF THE EXPLOITATION OF THIN VEIN POLYMETALLIC SULPHIDE DEPOSITS THROUGH
MATHEMATICAL MODELLING AND ROCK MECHANICS: AN APPLICATION TO THE MOLAOI MINE
P r o j e c t Leader : A. KONTOPOULOS METBA, Aegean Metallurgical Industries, Athens, Greece
M r . T Z I T Z I R A S Institute for Geology and Mineral Exploration (IGME), Athens, Greece
J . P . G I A N I Departimento di Georisorse e Territorio, Politecnico di Torino, I taly
M r . T S O U T R E L I S Mining Sector, National Technical University of Athens, Greece
C o n t r a c t MA1M-0025-C(TT)
1. OBJECTIVES
The aim of the present R&D work has been the development of the optimal exploitation methodology for thin vein type polymetallic sulphide deposits, with particular application to the MoIaoi orebody.
To achieve this goal geomechanicaI and hydrogeoIogicaI studies have been carried out, a mathematical model of the mine has been constructed, and experimental mining works were developed.
Aim of the geomechanIcaI studies has been the evaluation of the overall behaviour of the rocks surrounding the excavation and the determination of the local stability features, in order to select the optimal exploitation method. This was realized by collecting and evaluating data relevant to the geometrical characteristics of the orebody, rock mass characteristics, rock stability, etc.
Furthermore, scope of hydrogeoIogicaI studies has been the determination of the pumping requirements of the mine, as well as the effect of water on the rock stability.
- 459
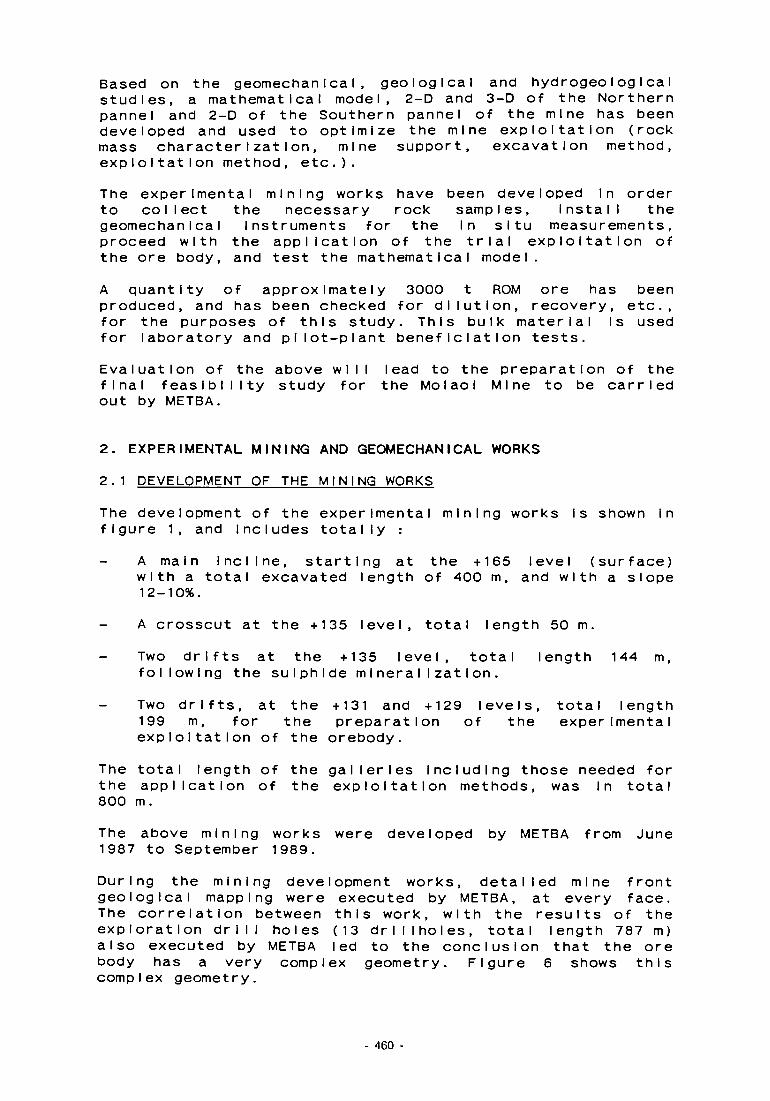
Based on the geomechanIcaI, geological and hydrogeoIogIcaI studies, a mathematical model, 2-D and 3-D of the Northern pannel and 2-D of the Southern pannel of the mine has been developed and used to optimize the mine exploitation (rock mass characterization, mine support, excavation method, exploitation method, etc.). The experimental mining works have been developed In order to col lect the necessary rock samples, I nstall the geomechanIcaI Instruments for the in situ measurements, proceed with the application of the trial exploitation of the ore body, and test the mathematical model. A quantity of approximately 3000 t ROM ore has been produced, and has been checked for dilution, recovery, etc., for the purposes of this study. This bulk material Is used for laboratory and pilot-plant benefIcI at I on tests. Evaluation of the above will lead to the preparation of the final feasibility study for the Mo I ao I Mine to be carried out by METBA.
2. EXPERIMENTAL MINING AND GEOMECHANICAL WORKS 2.1 DEVELOPMENT OF THE MINING WORKS The development of the experimental mining works is shown In figure 1, and Includes totally :
A main Incline, starting at the +165 level (surface) with a total excavated length of 400 m, and with a slope 12-10%. A crosscut at the +135 level, total length 50 m. Two drifts at the +135 level, total length 144 m, following the sulphide mineralization. Two drifts, at the +131 and +129 levels, total length 199 m, for the preparation of the experimental exploitation of the orebody.
The total length of the galleries including those needed for the application of the exploitation methods, was In total 800 m. The above mining works were developed by METBA from June 1987 to September 1989. During the mining development works, detailed mine front geological mapping were executed by METBA, at every face. The correlation between this work, with the results of the exploration drill holes (13 drillholes, total length 787 m) also executed by METBA led to the conclusion that the ore body has a very complex geometry. Figure 6 shows this complex geometry.
460 -
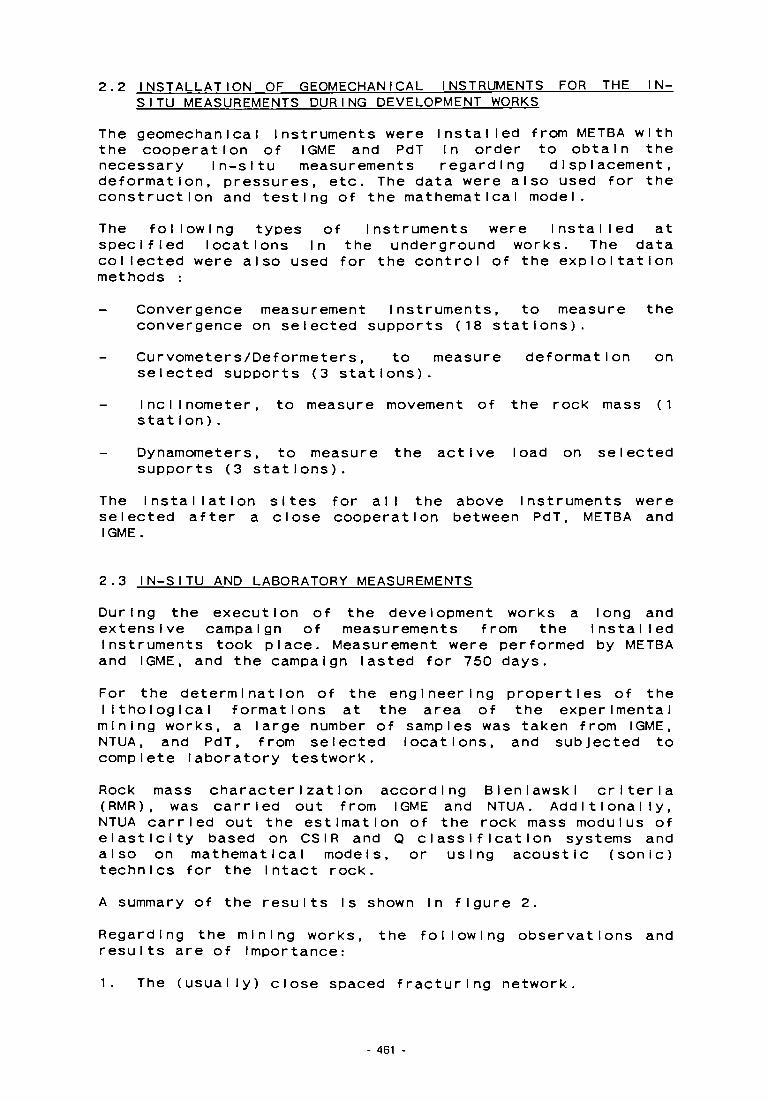
2.2 INSTALLATION OF GEOMECHANICAL INSTRUMENTS FOR THE I NISI TU MEASUREMENTS DURING DEVELOPMENT WORKS
The geomechanIcaI Instruments were Installed from METBA with the cooperation of IGME and PdT In order to obtain the necessary In-sltu measurements regarding displacement, deformation, pressures, etc. The data were also used for the construction and testing of the mathematical model. The following types of Instruments were Installed at specified locations In the underground works. The data collected were also used for the control of the exploitation methods :
Convergence measurement instruments, to measure the convergence on selected supports (18 stations). Curvometers/Deformeters, to measure deformation on selected supports (3 stations). Inclinometer, to measure movement of the rock mass (1 stat ion). Dynamometers, to measure the active load on selected supports (3 stations).
The Installation sites for all the above instruments were selected after a close cooperation between PdT, METBA and IGME.
2.3 IN-SITU AND LABORATORY MEASUREMENTS During the execution of the development works a long and extensive campaign of measurements from the Installed Instruments took place. Measurement were performed by METBA and IGME, and the campaign lasted for 750 days. For the determination of the engineering properties of the llthologlcal formations at the area of the experimental mining works, a large number of samples was taken from IGME, NTUA, and PdT, from selected locations, and subjected to complete laboratory testwork. Rock mass characterization according Blenlawski criteria (RMR), was carried out from IGME and NTUA. Additionally, NTUA carried out the estimation of the rock mass modulus of elasticity based on CSIR and Q classification systems and also on mathematical models, or using acoustic (sonic) technics for the Intact rock. A summary of the results Is shown In figure 2. Regarding the mining works, the following observations and results are of Importance: 1. The (usually) close spaced fracturing network.
461

2. The discontinuity surfaces being filled by siIty sand of low plasticity and very low cohesion.
3. The presence of ground water al I along the i nc I i ne and drifts (water flowing In many places from the roof and the waIIs).
4. Destruction of rock structure observed In several places, due to decrease In rock cohesion, and the presence of a mass of soil-lIke behaviour.
5. The rock mass is characterized after Blenlawski (according to in situ measurements and observations) as "a poor rock". Figure 3 shows the means values of the geomechanicaI classification of the rock mass of the area after BIeniawski.
6. Convergence measurements on the gallery's walls revealed variations in measured values over long periods of time and Independent of the face advance. On the contrary, for the steel supports, stabilization occurs quite shortly (within 1 month). This means that the procedure of load transfer is completed much more rapidly than convergence.
7. From load measurements on steel supports the distance of the influence of the advancing face has been determined.
8. From deformation measurements It has been established that acting pressure is the result of decompression over a I imlted zone of surrounding rock.
The above points proove that the pressure Is of the loosening or creeping type. Typical convergence diagrams on walls and on steel supports, bore hole extensometer diagram and load versus face distance diagram are given in figures 4 and 5.
2.4 HYDROGEOLOGY Plezometric data of 22 wells situated near the mine, referring to the years 1987-1988 have been collected by IGME. The results were used for the construction of a flow direction map. They have also been compared with the available pluvlometric data. Moreover local data of rainfall and temperature have been used. The hydrogeolog lea I study, with the air-photographs of the MoIaoi area were send to the PdT for more detailed study. The hydrogeology group of PdT made a systematic study of the Mo IaoI data, concerning chemical analyses of ions, elaboration and graphic representation of pluvlometric data and perIzometrIc levels and preparation of a hydrogeoIogicaI map of the mIne.
462
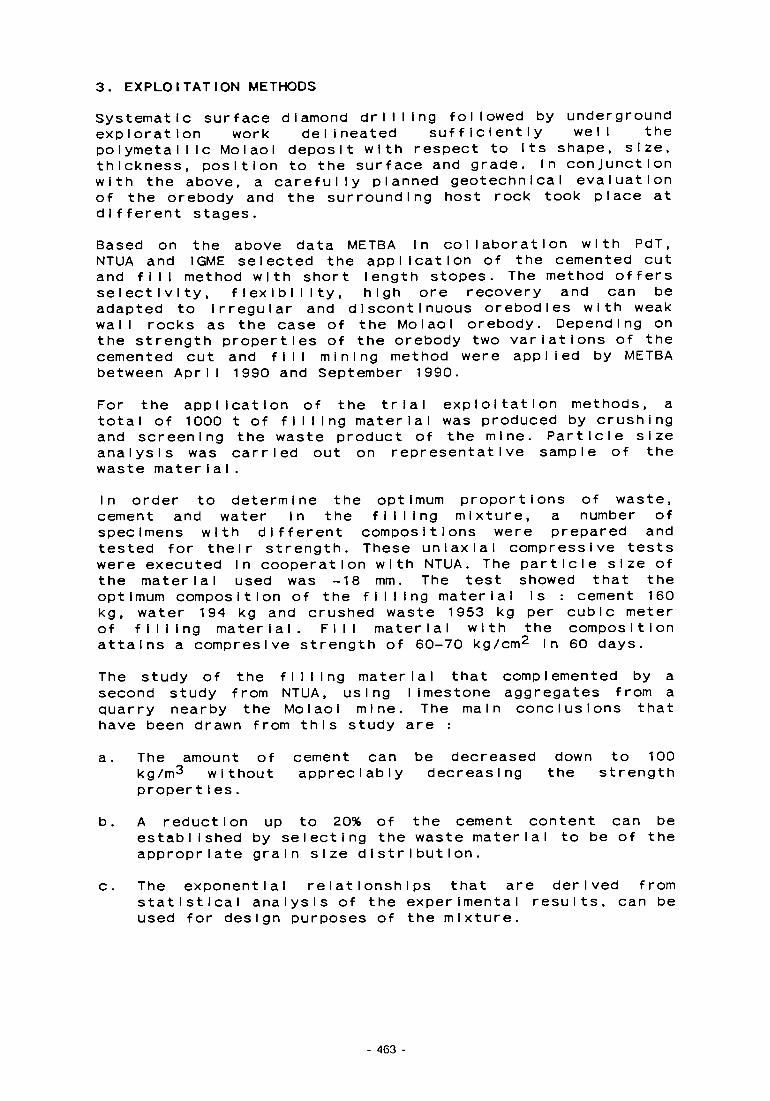
3. EXPLOITATION METHODS Systematic surface diamond drilling followed by underground exploration work delineated sufficiently well the polymetalllc Mo IaoI deposit with respect to Its shape, size, thickness, position to the surface and grade. In conjunction with the above, a carefully planned geotechnlcal evaluation of the orebody and the surrounding host rock took place at different stages. Based on the above data METBA In collaboration with PdT, NTUA and IGME selected the application of the cemented cut and fill method with short length stopes. The method offers selectivity, flexibility, high ore recovery and can be adapted to Irregular and discontinuous orebodles with weak wall rocks as the case of the Mo I ao I orebody. Depending on the strength properties of the orebody two variations of the cemented cut and fill mining method were applied by METBA between April 1990 and September 1990. For the application of the trial exploitation methods, a total of 1000 t of filling material was produced by crushing and screening the waste product of the mine. Particle size analysis was carried out on representative sample of the waste mater I a I . In order to determine the optimum proportions of waste, cement and water in the filling mixture, a number of specimens with different compositions were prepared and tested for their strength. These uniaxial compressive tests were executed In cooperation with NTUA. The particle size of the material used was -18 mm. The test showed that the optimum composition of the filling material Is : cement 160 kg, water 194 kg and crushed waste 1953 kg per cubic meter of filling material. Fill material with the composition attains a compreslve strength of 60-70 kg/cm2 In 60 days. The study of the filling material that complemented by a second study from NTUA, using limestone aggregates from a quarry nearby the Mo Iaoi mine. The main conclusions that have been drawn from this study are : a. The amount of cement can be decreased down to 100
kg/m3 without appreciably decreasing the strength propertIes.
b. A reduction up to 20% of the cement content can be established by selecting the waste material to be of the appropriate grain size distribution.
c. The exponential relationships that are derived from statistical analysis of the experimental results, can be used for design purposes of the mixture.
463 -
3.1 DESCENDING CEMENTED CUT AND FILL This method was applied at an experimental pannel 40 m long In the northern part of the orebody between levels + 135 and +131 m. Certain details of the method are shown In Fig. 7. After mining the ore slice at the +135 level, the entire level was filied with cemented fill which was mixed with cement at the appropriate proportions and transported to the face pneumatically. The required quantity of water was added, and the slurry was set Into place.
3.2 LONG HOLE DRILLING WITH CEMENTED BACKFILLING This method (figure 7) was applied between the drift +135 and the drift +129. From the very beginning important problems were encountered In the application of this method because of roof collapses which made filling procedure extremely difficult up to technically impossible. The resulting caving method showed a hlght dilution factor and small recovery factor. For the above reasons this method was abandoned.
4. F.E.M MODELLING OF THE MINING STOPES During the modelling phase the cooperating partners participated In meetings and discussions, regarding the locations of the mine to be modelled, the input data, the rock mass behaviour law, taking Into account all the restrictions imposed to the actual numerical method in simulation of these types of rock masses, and intermediate mode I I Ing resuIts. Numerical models were set up In order to support mine designs. The Finite Element Method (FEM) was, in particular, applied to the numerical simulation of the mining exploitation In two experimental panels. The principal problems of the FEM application to the MoIaoI mlnedeslgn depend on the necessity to find a reliable schematIzatI on of a close Jointed rock statical behaviour. The FEM modelling was carried out by considering the heavy fractured medium as an equivalent continuous medium and for this purpose the rock mass schematIzatIon required
the rock mass deformation modulus and Polsson ratio; the rock mass strength features; the rock mass plasticity law;
- the rock mass behaviour during water pressure variation.
464

The principal physical phenomena which FEM modelling had to simuIate were :
mining excavation;
rock mass drainage;
- wooden and steel arch support set up.
The principal effects of these phenomena, which were taken Into account, for this numerical simulation were :
- the three dimensional effect of the advancing drift excavation face on the Induced rock mass stress and strain state;
the tranclent flow phenomenon which occurs when underground excavation, below the water table level, causes a lowering of the water present around the excavation face with a consequent increase of the effective stress;
gradual loading action of the plastlcized rock mass on passive excavation face supports.
2- and 3-D FEM models working in eIastopIastIc field were set up In order to simulate the above quoted phenomena. The reliability of the FEM modelling will be calibrated on the basis of back analysis carried out by comparing experimental measurements and numerical results.
The FEM modelling referred to the North and South mine experimental panel and the models prepared for this design purpose are :
- a three dimensional model set up in order to simulate higher drift construction In the Northern panel In order to fit agreement between experimental and numerical results and to support the rock mass characterization;
two two-dimensional models set up in order to simulate all the excavation supports and cemented fill application phases foreseen for the mining panel exploitation.
Rock mass deformabiIity and strength features were assigned In the numerical models according to the RMR Blenlawski cI ass i fIcatIon.
The rock mass stress-strain behaviour was assumed as elastIc-Idea I ly plastic with an associated flow rule according to the FEM model available.
Two different hydraulic flow conditions were examined for both pannels; the first refers to the hypothesis that the water table has a constant level upon the mining underground area, the second refers to the hypothesis that the weathered rock zone, Including the mineralization, constitutes a flow barrier. The depressurIzatI on caused by the mining voids, Includes different pressure gradients for the two flow hypothesIs.
- 465 -
An increase of effective stress corresponds to a decrease of water pressures. An Increment of the gravitational body forces was progressively assigned to those parts of the rock mass drained by the excavation.
In 3-D numerical simulation field the transient flow motion which Interacts with advancing excavation has to be taken into account. This flow motion through the rock mass produces a longer time waI I tunnel convergence stabi I ization with respect to the whole drained rock mass case.
In the 2-D numerical simulation field all the ore body forces corresponding to the steady state flow condition are simultaneously applied and higher convergence values are determined.
5. RECOMMENDATIONS
1. The hydrogeoIoglea I part of this study does not exclude the risk of a high quantity water Inflow connected with the neighbouring limestone formation during the future possible exploitation. It Is suggested that this risk may be further examined and considered In the mine pIannIng.
2. From the geomechan i ca I and the modelling part of the study It Is deduced that there Is a need for further evaluation of the overall stability of the filled stopes.
2.1 With the results obtained up to now it is concluded In general that because of the very bad quality of the rock mass and the ore, the presence of water and the geometry of the ore body, the descending cut-and-flll mining method with cemented back-fill must be selected. The fill will consist of graded aggregates and/or future mine tailings with a cement content of 100 kg/m3 of back fill and a water to cement equal to 2.
2.2 The possibility of applying cut-and-flll mining method, with use of loose filling material or low quality consolidated material, should be Investigated.
3. The preliminary economic evaluation using sensitivity analysis presented hereafter is based on considerations of the above mentioned factors.
6. PRELIMINARY ECONOMIC EVALUATION
For the preliminary economic evaluation, the following assumptions were made :
Operational cost of descending cemented fill : 4500 GRD per t of Run-of-mine.
466 -
Assay of the R-O-M : Zn 5.8 %, Pb 1%, Ag 25 g/t MetaI pr i ces Zn Pb Ag
1550 USD/t 730 USD/t
0.18 USD/g produced bulk concentrate : Zn : 47 %, Pb 4.8 %, Ag 170 g/t BenefIcI at I on ratio Currency equivalent Calculated ore value
1 1% 1 USD=160 GRD 51 USD/t
Beneficiation cost : 2300 GRD/t Development works 18 % of operetional cost;
Investment : 20 % of operational and beneficiation cost;
Reclamation : 3% of operation and beneficiation cost; Overheads 7 % of operational and benefIcI at I on cost.
According to the above assumptions we have : 1. Mining operational cost 2. Beneficiation cost
TOTAL 1 3. Development : 0.18 x 4500 4. Investment : 0.2 x 6800 5. Reclamation : 0.03 x 6800 6. Overheads : 0.07 x 6800
TOTAL 1-6 UNFORESEEN GRAND TOTAL
The Grand total Is 10650 GRD or 67 USD per t of R-O-M. The revenues per t of R-O-M are 51 USD, therefore a loss of 16 USD/t R-O-M is foreseen. Sensitivity analysis has shown that a 20 % reduction of the total exploitation coct causes a reduction 50 % of the estimated loss. Also a 10 % reduction of the benefIcI at I on cost causes a 11.32 % reduction of the estimated loss. With a 30% Increase of the Zn price the estimated loss equals approximately to zero.
GRD/t 4500 2300 6800 810 1360 200 480
9650 1000 0650
USD/t 28 14 42 5 8 1 3
60 6
66
12 37 5 06 5 25
31 25 56
467

7. REFERENCES 1. AndronopouIos B., Tzltzlras A.
REPORT ON GEOTECHNICAL STUDY OF THE GEOMECHANICAL BEHAVIOUR OF THE FORMATION IN MOLAOI MINE AREA (ADIT 165) Report IGME n° 1, 1988.
2. AndronopouIos B., Tzltzlras A., VardakastanIs D. REPORT ON GEOTECHNICAL STUDY OF THE MECHANICAL BEHAVIOUR OF THE FORMATION IN MOLAOI MINE AREA (ADIT 165) Report IGME n° 3, 1988.
3. BleniawskiZ.T. THE GEOMECHANICS CLASSIFICATION IN ROCK ENGINEERING APPLICATIONS Proc. 4th Congr. Int. Soc. Rock Mech., Montreux, Switzerland, Vol. 2, pp. 41-48, 1979.
4. Clvlta M. INTERAZIONI TRA IDROGEOLOGIA E SVILUPPO MINERARIO, CON PARTICOLARE RIGUARDO PER LE SITUAZIONI CO INVOLGENTI LE ROCCE FESSURATE Boll. Ass. Mln. Sub., 17, 2, 396-434, 1980.
5 . Georgo M s J . REPORT OF HYDROGEOLOGICAL STUDY IN THE MOLAOI MINE AREA Inst, of Geol. and Mln. Expl., Branch of Tripolls, 1-9, 1988.
6 . Georgou M s J . HYDROGEOLOGICAL STUDY ON THE MINERALIZATION AREA OF MOLAI - LAKONIA Inst, of Geol. and Mln. Expl., Branch of Tripolls, 1-17, 1988.
7. Hoek E. & Brown E.T. UNDERGROUND EXCAVATIONS IN ROCK I.M.M., London, 1980.
8. Tsoutrells C.E., Exadaktylos G.E., & KapenIs A. ROCK MASS CHARACTERIZATION OF THE MOLAI MINE Technical Report n° 1, Contract n° MA1M-0025-C(TT), 1989.
9. Tsoutrells C.E., KapenIs A.P. DETERMINATION OF CERTAIN MECHANICAL PROPERTIES OF THE ROCK MASS USING DYNAMIC AND STATIC METHODS Technical report n" 2, Contract n° MA1M-0025-C(TT), 1990.
10. Tsoutrells C.E., KapenIs A.P. AN EXPERIMENTAL STUDY ON THE SELECTION OF BACKFILL MATERIAL FOR THE MOLAI MINE Technical Report n° 3, Contract n° MA1M-0025-C(TT), 1990.
468
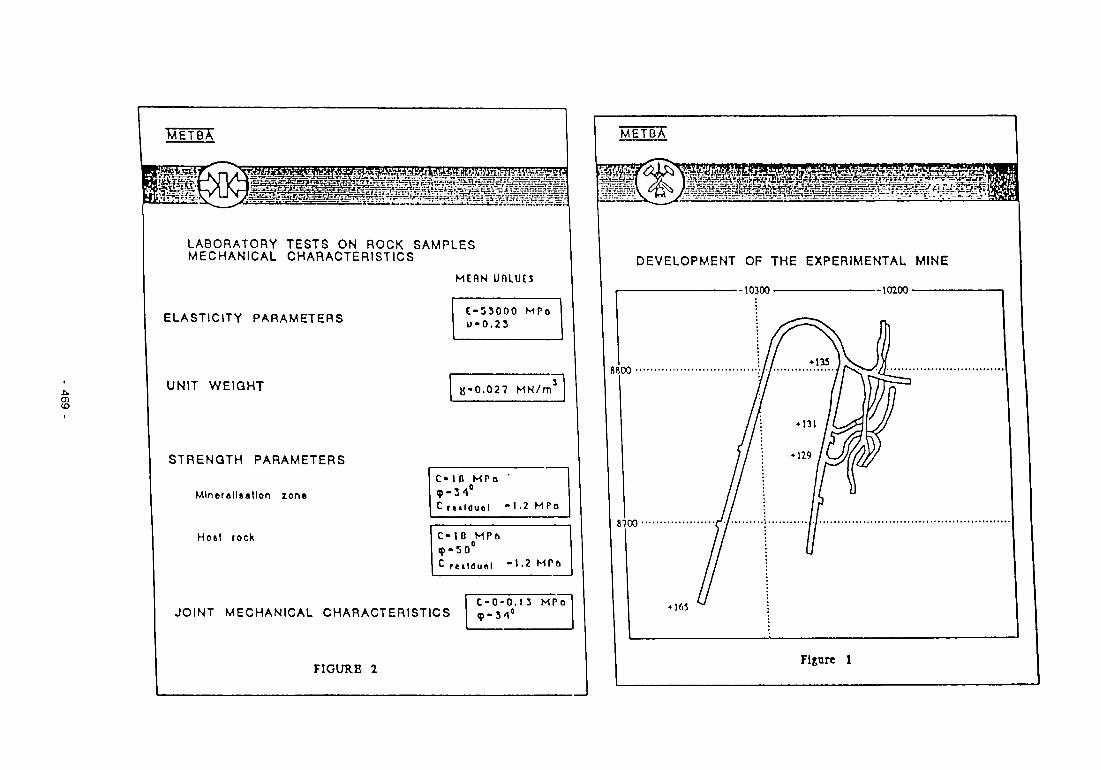
<0
LABORATORY TESTS ON ROCK SAMPLES MECHANICAL CHARACTERISTICS
MEAN UlHUtS
ELASTICITY PARAMETERS
UNIT WEIGHT
STRENGTH PARAMETERS
Mineralisation zone
Ho&l rock
E-53000 MPo u - 0 . 2 3
B-0.027 M N / m
JOINT MECHANICAL CHARACTERISTICS
FIGUR.B 2
C- IB MPn ' <p-3 4° C rtilduel -1 .2 MPa
C-10 MPo
C reilduol -1 .2 MPo
1CS C - 0 - 0 . 1 3 MPo 9 - 3 4 °
DEVELOPMENT OF THE EXPERIMENTAL MINE
■10300 10200-
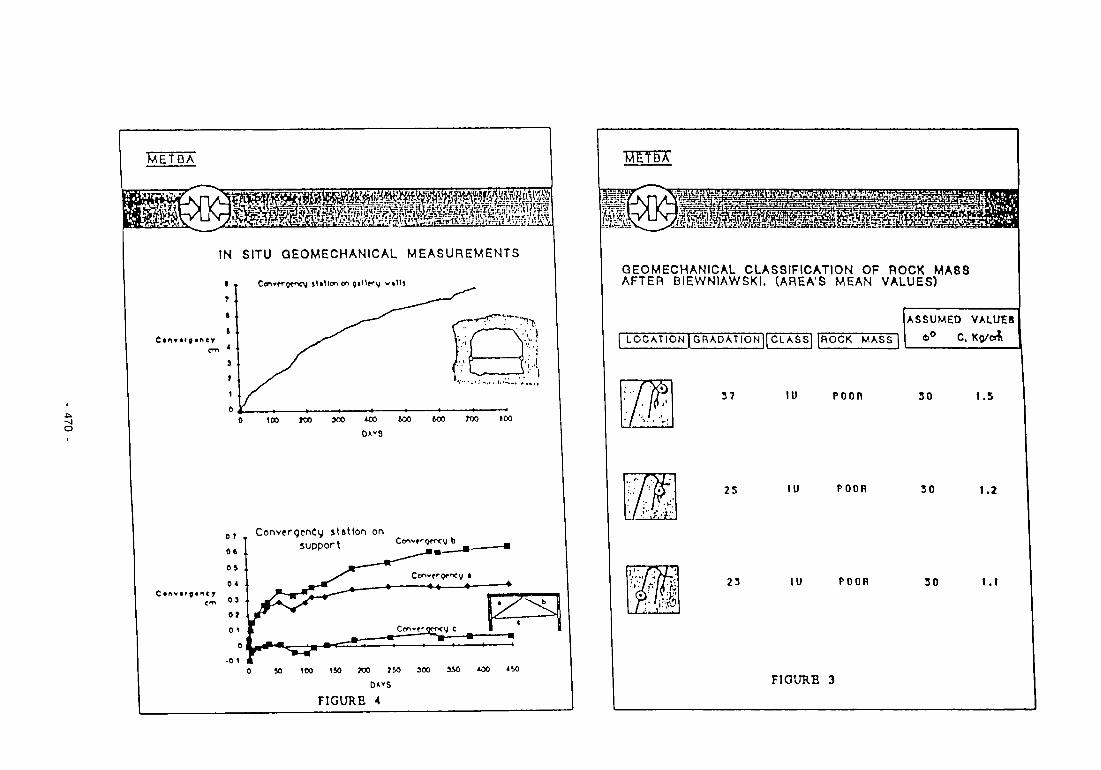
o
IN SITU QEOMECHANICAL MEASUREMENTS
Cenvfrjt^^cj jttt lon tn g t l l K y v»tl»
Certvftf 9»rity cm
cm
M 100 1S0 XX) }SO 300 ISO *00 < H
FIGURE 4
METBA
QEOMECHANICAL CLASSIFICATION OF ROCK MA88 AFTER BIEWNIAWSKI. (AREA'S MEAN VALUES)
| L 0 C A T I 0 N | G R A P A T I 0 N " | | C L A S S | |ROCK MASS~|
ASSUMED VALUES 4>° C. K O A A
37 10 POOR 30 1.5
LiE.
25 ID POOR 30 1.2
23 IU POOR 30 1.1
FIGURE 3
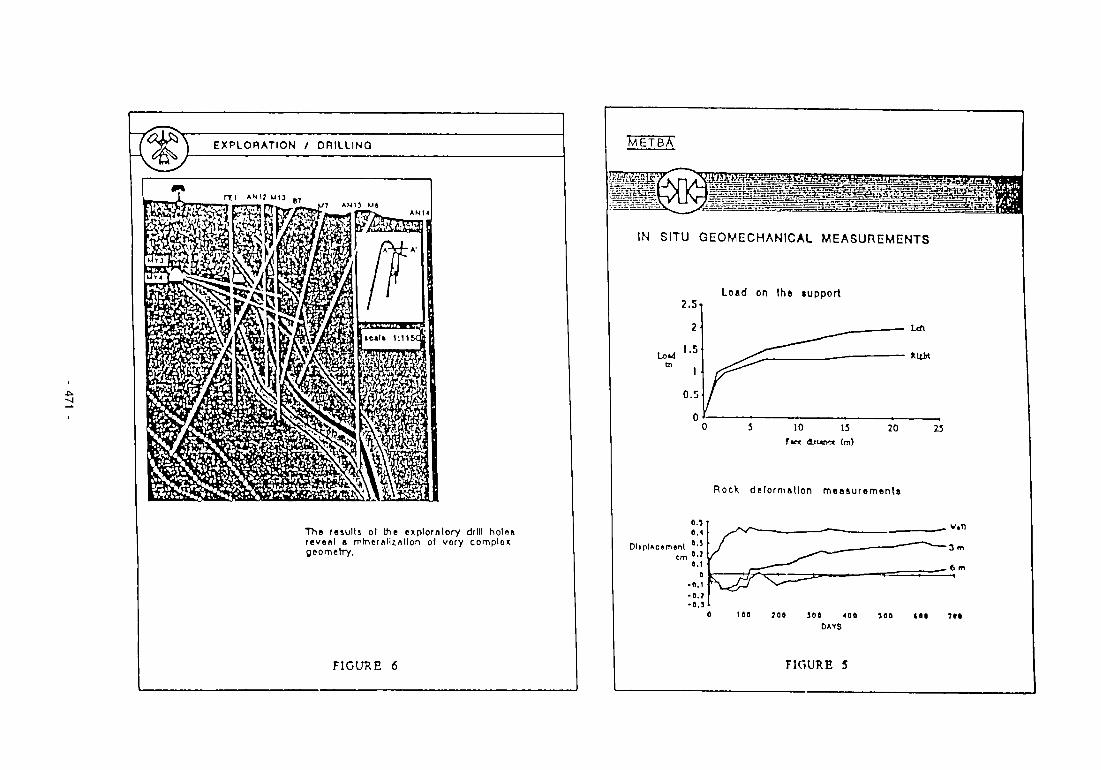
-J
EXPLORATION / DRILLING
The results ol the exploratory drill holes reveal a mrneralizMlon ol vory complox. (jeometry.
FIGURE 6
METBA
IN SITU GEOMECHANICAL MEASUREMENTS
Load on the support
Lo«d
Rock deformation measurements
Dliplncftment cm
FIGURE 5
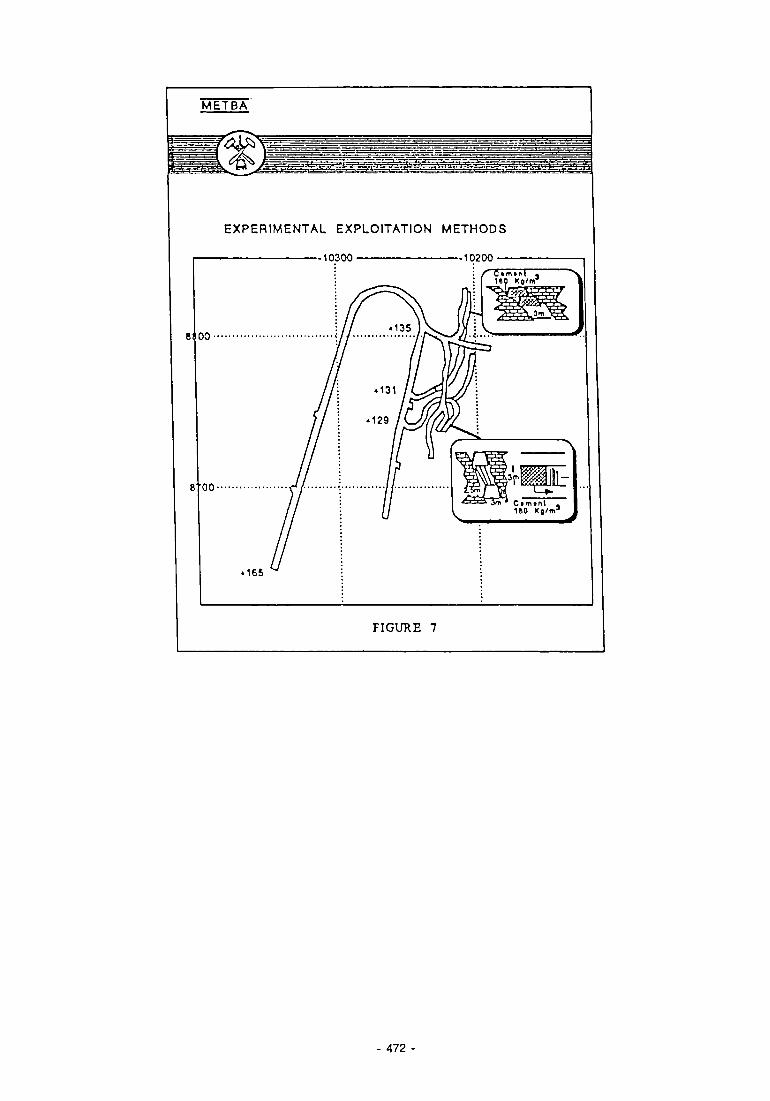
METBA
EXPERIMENTAL EXPLOITATION METHODS
10300 10200 —
472

J?5"v
F igure 8 : FEM model
- 473

Figure 9 : FEM model
474

COMPUTER AIDED DESIGN OF UNDERGROUND METALLIFEROUS MINING LAYOUTS
P r o j e c t Leader : F . L . WILKE Technische Universi taet B e r l i n , Inst i tut fuer Bergbauwissenschaften I I , Germany
W. S k a l a Freie Universitaet Berlin, Institut fuer Mathematische Geologie, Germany
C.T. Shaw Imperial College of Science, Technology and Medicine, Department of
Mineral Resources Engineering, London, United Kingdom
Contract: MA1M-0026-D-(B)
1. INTRODUCTION Decreasing metal deposit conditions and an ever competitive market environment force the European Mining Industry to improve their economic efficiency. Without any doubt the contribution of new and existing computer technology to the mine planning process is of vital importance to the overall economy of developing and subsequently operating underground m i nes.
Therefore, a research project was set up and has been Jointly directed by the mining departments of Imperial College, London (GB), Technische Universitaet Berlin (FRG) and the geological department of Frele Universitaet Berlin (FRG) In close cooperation with the mining operation company Sachtleben Bergbau GmbH (FRG) to develop an Integrated computer planning system built on a modular structure for underground base metal mines. The research and development was carried out under EC-contract Nr . MA1M-0026 D-(B) for a research period from July 1987 to December 1989.
2. OBJECTIVE The primary objective of the project has been the development, Integration and application of a planning software for underground base metal mines in an interactive workstation environment. The system design provides different computer application programmes, hereinafter referred to as "modules", each related to a specific mine planning or modelling function.
475 -

Referring to this function the modules Incorporate basic calculation routines as well as more sophisticated algorithms. Each module forms a semI dependent entity, capable of running as stand alone tool when required. However, to address a problem under study in greater detaII and to extend the reliability and efficiency of the solution process the user can take great advantage from the Interaction structure of the modules. All Information gathered and processed by one of them as we I I as their results are accessible for all related modules within the entire system on user's request.
In order to reflect the complex structure of underground mining the research groups have Identified the following important areas of mine planning and these were developed Into operating modules (Fig. 1): - The Department of Mineral Resources Engineering at
Imperial College, London: - Geometry/Geology Module
Rock Mechanics Module Instltut fuer MathematIsche Geologle at Freie Unlversitaet Berlin:
GeostatIstIcs Module Instltut fuer BergbauwIssenschaften at Technische Unlversitaet Berlin: - Economics Module
Production Scheduling and Sequencing Module The primary Industrial Partner Sachtleben Bergbau GmbH has provided the testbed data mainly from their mine at CayeII (Turkey). Moreover the engineering personnel have been consulted regularly and have provided valuable advice during the development and validation stages of the modules.
3. DEVELOPMENTS AND RESEARCH RESULTS 3.1 GEOMETRY/GEOLOGY MODULE Over the period of the contract, the Computer Aided Design Research Group, at Imperial College, has been Investigating new methods of geological modelling. Research has focussed on the specific areas of boundary representation and linear octree encoding. The geometric modelling system, developed by the CAD Research Group, known as 3D-IGSIS (3D - Integrated GeoscIentIfIc Information System), Integrates a general purpose computer graphics package (MOVIE.BYU) with a
476
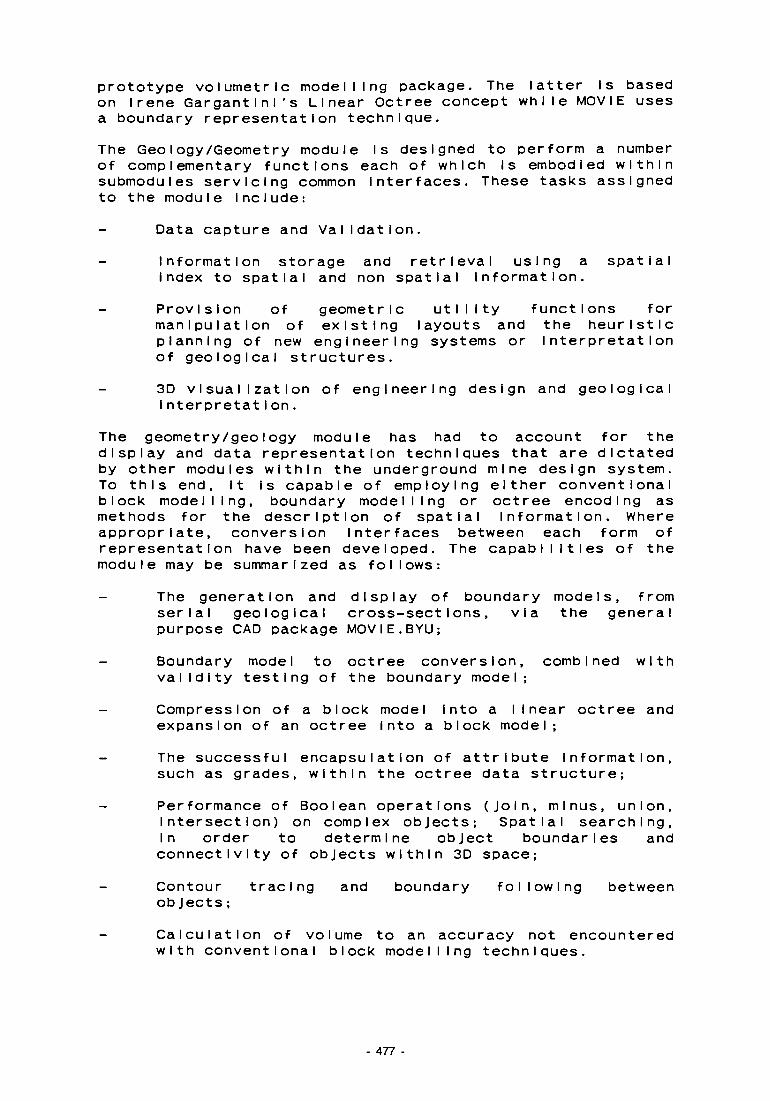
prototype volumetric modelling package. The latter Is based on Irene Gargantlnl's Linear Octree concept while MOVIE uses a boundary representation technique. The Geology/Geometry module Is designed to perform a number of complementary functions each of which Is embodied within submodules servicing common interfaces. These tasks assigned to the module include:
Data capture and Validation. Information storage and retrieval using a spatial Index to spatial and non spatial Information. Provision of geometric utility functions for manipulation of existing layouts and the heuristic planning of new engineering systems or Interpretation of geological structures. 3D visualization of engineering design and geological Interpretat i on.
The geometry/geology module has had to account for the display and data representation techniques that are dictated by other modules within the underground mine design system. To this end, It is capable of employing either conventional block modelling, boundary modelling or octree encoding as methods for the description of spatial Information. Where appropriate, conversion interfaces between each form of representation have been developed. The capabilities of the module may be summarized as follows:
The generation and display of boundary models, from serial geological cross-sections, via the general purpose CAD package MOVIE.BYU;
- Boundary model to octree conversion, combined with validity testing of the boundary model;
- Compression of a block model into a I Inear octree and expansion of an octree Into a block model;
- The successful encapsulation of attribute Information, such as grades, within the octree data structure;
- Performance of Boolean operations (Join, minus, union, Intersection) on complex objects; Spatial searching, In order to determine object boundaries and connectivity of objects within 3D space; Contour tracing and boundary following between objects; Calculation of volume to an accuracy not encountered with conventional block modelling techniques.
- 477
3.2 ROCK MECHANICS MODULE The main objective of the Rock Mechanics Research Group at Imperial College was to develop tools for practicing mining engineers to assess the likely stability of mine openings which they are designing. The main research concerned the use of numerical methods as a predictive tool. The second avenue of research was concerned with the geometry of blocks within a rock mass. This second subject al lowed that assessments of rock masses, containing many discontinuities, be made. Hence, the project has considered the two most likely scenarios which a mining engineer would face. Namely, continuous and discontinuous rock masses.
Numerical analysis plays an Important part In this design process but the majority of engineers have no formal grounding In such techniques. Therefore, the rock mechanics module Is designed in a manner that It employs a Knowledge Based System (KBS) as an Intelligent pre- and post-processor to a suite of numerical programs allowing: a) the right type of program to be used for a particular
prob I em, b) the necessary data to be Input or derived, and c) Intelligent analysis of the output data. The numerical programs Incorporated In the rock mechanics module include:
Structural Controlled Failure Sub-module (SWCFS) Computer programs for Key Block Theory
Stress Controlled Failure Submodule which can access a suite of boundary element programs; a BOUND-program given In Hoek and Brown (1980) b TWOFS-program given In Crouch and Starfleld (1983) c TWODD-program given In Crouch and Starfleld (1983) d MINAP-program given in Crouch (1976) e TAB4-program given In Brady (1979) f MINTAB-program given in Yu, Toefs and Wong (1983)
The output from all the 2D progams has been standardized to that of BOUND, and the Hoek-Brown failure criterion added. The Prototype Knowledge Based System developed during the research period was successfully validated at South Crofty Tin Mine in Cornwall and CayeI i Base Metal Mine In Turkey.
478

3.3 GEOSTATISTICS MODULE In the framework of this project a new approach to modelling of continuous spatial attributes (grades, density etc.) has been developed. It Is based on the recursive subdivision of a cubical model and the use of the linear octree encoding scheme to provide an unequivocal locatlonal key for each Individual block. The block model is defined by a decomposition process which Is guided by the sample density. Any block completely outside the geological body under consideration is removed from the model. Huge blocks can be subdivided to a level suitable for representing fluctuations of a continuous property. The resulting model cuts down storage requirements as well as the processing time for the estimation routines. The user may select one out of several estimation techniques (Inverse squared distance weighting, ordinary and universal kriging of points or blocks with correction for geometrical anisotropies). In literature methods are described to classify reserves calculated for blocks of different sizes. Visualization of the distribution of grades in 3D space is a vital tool, as it enables the mine planner to select a stoplng sequence and layout suitable for the deposit under evaluation. The octree data structure Is equally suitable for modelling the geometry of geological bodies and mining layouts. Therefore, It is possible to combine these models with the attribute models for calculation of grades In mining blocks. In the first contract year, commencing with a comprehensive system analysis, the model conceptions have been outlined. Subsequently the algorithms have been developed and coded In the programming language C. During the last project stage several auxiliary programs for the manipulation of attribute octrees have been elaborated.
3.4 ECONOMICS MODULE Within the research project a computer tool for the geometrical and technical design of mining methods has been developed at TUB. The computer programme Is Integrated Into the workstation concept for base-metal mining operations and forms a basic part of the economics module. The programme Is designed to assist the planning engineer on site In the geometrical layout of a mining operation and In technical planning of the stoplng process. Interactive design of stope boundaries with a computer graphics system, planning of technical operations and cost calculation methods taking Into account operating cost and Including dilution In the evaluation process are major parts of the system. The basic algorithms, fol lowed by an
479

Investigation Into the available graphics software for mine modelling have been done In 1988. The graphics system allows the user to Interactively create a mine layout and to design a Mining Model. The Mining Model can be overlaid onto the geostatIstIcaI model and mining reserves can be estimated. For the selection of an optimal set of equipment for the stoping operations a range of technical planning submodules Is provided. In Interaction with the design of the mine layout different equipment combinations can be evaluated in terms of quality of the run of mine ore, productivity and operatIng cost.
During the last year of the project a decision tree technique has been developed and was Integrated to guide the user towards the optimal geometrical and technical stope layout. A system manager al lows the control I Ing of the complex planning procedures and ensures the userfrI end I I ness of the system. The chosen methods and techniques for geometrical and technical layout of mining methods have been tested when planning the CayeI I base metal mine In Northern Turkey. The results have proved, that the computer programme is applicable and that optimized layout and mine plans can be achieved.
3.5 PRODUCTION SCHEDULING AND SEQUENCING MODULE
During the whole of the contract time, the Research Group at TUB has developed a computer package to aid the planning engineer In (short- to mid) term production scheduling and stope sequencing.
Work has been focused on the development of an Interactive "Trial and Error" approach embedding the planning engineer within the decision process. According to the complex procedure In generating reliable production schedules and sequences of the stopes the module consists of three main Integrated submodules for database operations, mine planning and mill calculations. These modules quickly perform manipulation and modification of data sets according to the user Inputs. The engineer enters via the dialogue mode his mining activities while the computer after each Input carries out the calculations and presents the results directly on the screen or In prints. Emphasized is the balancing of different oretypes to ensure an even mill head grade. The planning windows, Incorporating elements of CAD, allow for a visual interpretation and ease the assessment of the plan under evaluation.
During the first year we have outlined the subsidiary goals, requirements and major planning InterdependencIes to the other modules for the Intended development. After having defined this framework computer coding and subsequently Implementation has been done. Further research In the latter half of the project and industrial experiences obtained from
480 -
the application of the module to the CayeI I deposit In 1989 encouraged us to extent and enhance the planning procedure by the partly application of a Linear Goal Programming Approach subject to linear functions. This concept Is used to support the engineer In selecting the production from the candidate stopes which meets the concentrator and market requirements. The algorithms are embedded Into the Interactive structure of the program.
4. CONCLUSIONS
During the execution of this research project a sound scientific basis has been elaborated and a new prototype-system for mine planning, design and geological interpretation Is available.
The approach Is based on the idea that a better solution and practical implementation of plans can be obtained by addressing each Individual planning task in a planning and engineering cycle, providing the engineer with vital Information from related areas, to tackle the problem under study from different sides. This structure ensures the detailed development and application of the modules as discrete entities. The incorporation of available expertise by the participants is easy possible. It enables also the capture, storage, retrieval and distribution of condensed data for further processing within other modules. This proposed procedure follows the preparation of real plans and schedules at the mine site. But It leaves the engineer and mining geologist more time to spend on creative work.
Major achievements of this two and a half year research project can be summarized as follows:
Modules covering the fields of orebody modelling, rock mechanics, geostatistics, stope layout and scheduling and sequencing as well as mine economics have been deveIoped.
An applied data transfer link from geometrical design to reserve calculation and grade distribution to stope layout has been established.
Research findings to date Indicate that difficulties of Interfacing different modules have been overcome. The adherence to widely used industry standards supports the data transfer.
The engineer is relieved from tedious work and Is able to create more options and to study their various Impacts on related problems.
481
The system has been applied to the CayeI I-depos11 (Turkey) successfully. It can be drawn from this testcase application that the concept applied to the complex mine planning process has proven Its suitability. The contribution of new as well as existing computer tools to underground mining will be of Increasing significance In the future and strengthen the competitiveness of the European Mining Industry. It Is hoped that research work In this field will be continued by further refinement of procedures and wider application at Industrial scale. The sound scientific basis achieved will allow to continue such technology to be researched in the future.
Besides these scientific results achieved other related activities have been launched to offer the full potential of the modular approach to mine planning and disseminate the resuIts.
The departments of the concerned research groups have reinforced their ties with the mining industry. Hence, a better Information exchange and a sustained interest of both academic staff as we I I as engineers In Industry Is available. Strong research activities also enhances teaching of students and graduates. The principal investigators and members of their teams have disseminated the results on fares, In scientific literature and on conferences and meetings. The research groups have successfully performed a joint transnational research project.
5. BIBLIOGRAPHY 1. Bak, P.R.G. and Mill, A.J.B., 1989, Three Dimensional
Representation In a GeoscIentIfIc Resource Management System for the Minerals Industry: Three Dimensional Applications In GIS, edited by J. Raper, pub. Taylor and Francis, p. 155-182.
2. Brady, B.H.G., 1979: "Boundary Element Methods for Mine Design", PhD thesis University of London
3. Crouch, S.L., Starfield A.M.,1983: Boundary Element Methods In solid Mechanics, George Allen & UnwIn, London
4. Dunstan, S.P and Mill, A.J.B., 1989, Spatial Indexing of Geological Information Using Linear Octrees: Computers and GeoscIences, v. 15, no. 8, p. 1291-1301.
482
5. Gargantlnl, I., 1982: Linear Octrees for Fast Processing of three-dimentionaI objects. Computer Graphics and Image Processing, 20, 356-374
6. Gersteln, D., Herrmann, M. und Wilke, F.L., 1990: Planting von Abbauver f ahren und Abbaure I henf o I ge fuer den MetaI Ierzbergbau mlt CAD. Proceedings XXII. APCOM Symposium Berlin, Vol. II, pp. 39-50
7. Harrison, I.W.: Development of a Knowledge Based System for Open Stope Mine Design., Ph.D. Thesis, University of London, Imperial College, Royal School of Mines, 1989
8. Hermann, J.: Entwicklung und Erprobung elnes EDV-Mode I I s fuer die kurz- und m I tte I f r I st I ge ProduktionspIanung und -ueberwachung von MetaI Ierzgruben mlt komplexer Vererzung und kompIizierter geologlscher Struktur ausgefuehrt am Belsplel des Betriebes Song Toh, Thailand. Dissertation Berlin 1989
9. Hoek, E. and Brown, E.T., 1980: Underground Excavations In Rock, IMM, London
10. Ikegawa Y. and Hudson J.A., 1989: A Novel Automatic Identification System for 3-D Multi-Block Systems. 1st. U.S. Conference on Discrete Element Methods, Eds. G.G.W. Mustoe, M. Henriksen, H-P. Huttermaier, CSM Press, Golden CO USA
11. Maw, S.K.: Discriminating and classifying disordered orebodles using fractals, Poster Presentation at APCOM 90 Conference, Berlin, 17th-20th September 1990
12. Maw, S.K.: The Mining expert's perception of a disordered orebody, 20th March, presented at GeoTech89 Conference, Denver Co, 23rd-26th September 1989, organised by Computer Oriented Geological Society, USA; abstract published In COGS Computer Contributions, Vol 5, No 3, December 1989, publication of full paper under review
13 Mill, A.J.B., 1989, Second Generation CAD and IT Systems for Mine Planning: Mining Magazine, V. 160, no. 2, p. 134-137.
14. Prlssang, R. : A Coding Scheme for Directions In Octree : Its Application to Neighbor Finding.- Comp. Graph. Vision and Image Process., Duluth, MN (under rev Iew)
15. Prlssang, R. und Skala, W.,1990: An Octree-Encoded 3D Variable Block Model For the Representation of Grades In Underground Mining.- XXII. APCOM Symposium Berlin, Vol. Ill, pp. 137-148
483

16. Shaw, C.T., Skala, W. and Wllke, F.L., Dec. 1989: Computer Aided Design of Underground Metalliferous Mining Layouts (MA1M 0026 D-(B)), unpublished, Final Report
17. Wllke, F.L., 1987: Recent Methodological Trends In Operations Research and Computing as Applied to Mining Problems, Proceedings, 20th APCOM Symposium, Vol. I, Johannesburg, SAIMM, pp. 109-113
18. Wllke, F.L., 1987: ZweckmaessIge AnwendungsgebIete der EDV, Ihre EInsatzmoegI IchkeI ten und -grenzen. In: EDV-Elnsatz bei der MetaI IgewInnung. Hrsg. GDMB, Welnhelm , S. 325-336
19. Yu, Y.S., Toews, N.A. and Wong, A.S., 1983: MINTA Users Guide - A Mining Simulator For Determining the Elastic Response of Strata Surrounding Tabular Mining Excavations. Mining Research Program. Dlv. Rep MRP/MRL 83-25(TR)
484

ICL - TUB - FUB - SMC
CO
Planning and Engineering Cycle
Institut fur Bergbauwissenschaften . Fachgebiet Bergbaukunde I

COMPUTER AIDED SELECTIVE PRODUCTION PLANNING FOR COMPLEX OREBODIES
Project Leader: J. SCHLEIFER Paris School of Mines, Centre de Géotechnique et d'Exploration du Sous-sol (CGES), France
Institut National Polytechnique de Lorraine (INPL), Nancy, France
La Fundacion Universidad — Empresa, Madrid, Spain
Contract MA1M-0060-C(CD)
1. INTRODUCTION According to the former research work, on the use of computer facilities In the mine planning process, done by all the contractors Involved In the BONANZA project, I.e. ARMINES/CGES In production simulation, ETSIM/DMAMI In optimization techniques and INPL/LIAD in orebody modelling, the object of this R&D project was quite obvious. The complete Justification of the BONANZA approach lies in the tackling of the short term planning problem, considered by some mining people to be very short term (every day or even every shift in a monthly period). Indeed, a preliminary study of this aspect demonstrated an obvious lack of tools and even theoretical elements in the way to handle short term problems. As expected, short term problems are very context dependent, and therefore it was necessary to develop tailored tools to treat the mining aspects of the problem and moreover specific computer tools to Implement the resulting algorithms of this research work. In this way, the project was divided into three parts allocated to the present partners according to their specific abilities as following :
- ARMINES/CGES is treating the underground mining problem
- ETSIM/DMAMI Is treating the open pit mining problem
- INPL/LIAD Is providing the software environment
487 -
In this abstract, a first part Is allocated to deal with the general short term mining problem to explain the differences of short term and medium term planning requirements and which process Is to be Implemented to provide the miner with planning support on an every day basis. The two following parts are then specific to the given mining context, which are underground polymetalllc vein mining and opencast medium-scaled polymetalllc pit mining. The last part describes the computer tools developped to provide a software factory to the possible Implementation of the techniques built In the previous parts.
PART 1 : SHORT TERM PLANNING AND OPERATION CONTROL 1.1. PRINCIPLES The aim of planning and production control In a short term aspect Is to enable a production engineer on the mine to deal for the short term period (1 month) with the following problems :
which objectives must be reached and which areas must be mined to reach these objectives ? how to organize the available production resources (equipment and labour), on a day by day or shift by shift basis, to achieve these objectives ? how to correct this organization to take into account deviations and disturbances between planned operations and actual production ?
Our approach, as shown on figure 1, Is based on process control : build a precise and detailed planning of operation, acquire the most recent data and correct the planning to adapt It to the changing context.
1.2 PLANNING TECHNIQUES The building of the short term planning Is divided into two successive steps :
take into account medium short term constraints to define the geometry to be mined until the end of the perlod,
allocate the resources to achieve the required operations during the period to reach the defined geometry
488
1.2.1. Geometry
The geometry definition Is a common problem In planning process. Various techniques are available to compute the geometry to be mined In one month in order to achieve different technical and economical objectives :
progress the volume to achieve medium term planned geometry,
optimize short term profit,
ensure stability of mining geometry.
Techniques such as rule-controlled combination and optimization are available to solve this type of problem. In this case models of production capacity can be derived from medium term models.
1.2.2 Sequence
The geometry result Is now considered as an objective to reach during the period. This problem Is defined as follows:
list all the production operations required to reach from the starting position the end position defined by the geometry,
allocate the resources to the operations and respect all the mining constraints,
make the best use of the equipment.
The benefit of this operation is double :
give the operating work orders for the next day or shlft,
ensure the feasabillty of achieving the geometry.
To achieve this, we have developped an automatic simulation tool building a sequence of operations under the above mentlonned rules. This tool Is built on queue I ng and graph theory using rules (constraints and heuristics) to work out in path in this graph. It has often be compared to a Critical-Path Method, but Its originality lies in the complete automatic generation of the sequence (path) by simulating all basic production and development operations In the mining method.
This "sequencer" Is built with the available mining rules and contralnts.
489 -

1.3 PLANNING UPDATE In medium term planning, the objective Is to define the feasibility of a major mining phase and to estimate the resources required to achieve It. This planning Is retrieved In case of major hangup.
On a short term basis, the lifetime of the planning Is such that It must be retrieved at a very high frequency. Indeed, If the operations and resource allocation Is to be followed, any deviation (variance between forecast and actual performance) and disturbance (engine breakdown) must be taken Into account. As a result the geometry and the sequence are retrieved to take into account this new context.
In practice, the planning tools will be retrieved with a new starting position and a new forecast of events.
This retrieval is only possible If new data about what is happening In the mine can be captured In time to allow a rerun of the system.
Following Informations must be acquired :
operations performed and actual front position,
resources availability forecast (Including preventive ma Intenance),
front access possibilities.
The quality of the control is directly dependent on the frequency of planning update; the lower this frequency, the more the actual operations will deviate from the plan and the higher the risk of the impossibility of still reaching the objectives.
1.4. BONANZA APPROACH
The fundamental research work done in the BONANZA project has issued a theoretical layout of short term planning and production and operation control In the mine. It can be mentlonned that the above mentionned elements could be considered as a philosophy to be used during the implementation of such a computer system on a specific mine.
The technical work achieved for the planning tools can be considered as a rule-based toolbox to be used during the Imp IementatI on.
- 490
PART 2 : UNDERGROUND MINE TECHNIQUES 2.1. SIMPLE EXAMPLE This simple mining layout was defined to build up the techniques and to undertake a certain number of basic tests on these techniques. It consists of a set of tunnels, symbolically parallel but with the possibility of defining any type of contralnts between them. The quality model of each tunnel Is either continuous and homogenous or dlscretlzed In blocks.
2.1.1. Geometry To define the geometry, it Is necessary to sort out the possslble objectives to be reached with a rule-based system. A second tool is then computing the progress to realize in each tunnel to achieve the different objectives under constraints. The technique of Goal Programming is used to solve this linear programming problem with multiple and conflictual objectives. This technique Is basically considering constraints and objectives as a set of ordered constraints. A rule-based system has been built to order these constraints and compute a level of feasibility of Min-Max Object Ives.
2.1.2 Sequence The sequencing technique has been entirely built on this example. To the geometry layout, we have added a production cycle of 3 operations on each front (drilling, charging and blasting, loading) and a set of equipment and labour. The sequencer Is using either a Potent I a I-Constraint graph or contraint ordered operation and machine queues. Each elementary allocation machine-operation Is done by constraint checking and the use of heuristics representing good mining practice :
First Come First Serve to reduce waiting time, - Most Work Remaining to Improve progress,
Shortest Processing Time to maximize work. Each heuristic has been evaluated and combinations of these heuristics have been implemented.
491
2.1.3. Converging The geometry tool Is using a statistic model to represent production capacity. This model takes Into account the average possibilities of resources knowing that statistically, problems will occur during the month.
The sequencer Is based on each operation and cannot know at which time problems will occur. But It can, by using the best forecast of time-dependent Information, deduce what will IdeaIly happen.
The convergence of the 2 models is done as follows :
- at the beginning of the period, the sequencer result demonstrates some spare time at the end of the period because not knowing problems will occur,
- as period goes on and If problems occur (simulated by
correct Input), the sequencer will tie up the geometry during the allowed time,
- at the end of the period, the geometry model may be too optimistic, and the sequencer will tell how much of the geometry Is feasible.
2.2 REALISTIC EXAMPLE
This example Is representative of vein mining in a multllensed orebody with a downwards method, as shown on f I gure 2.
2.2.1 Geometry
Using the results of the simple example, we have defined a Goal Programming technique considering each individual tunnel to be Independent. The result may not be feasible because of precedence constraints; if so production capacity requirements are reported to the necessary tunnels and the remaining contraints are used to work out the now accessible tunneIs.
This algorithm Is looping until It reaches (the convergence is Insured) a feasible solution. It Is obviously not a optimum solution but can be considered as a good practical so Iut ion.
The alternative technique of using mixed integer (0,1) to handle precedence constraints has not been used because the lack of a Goal Programming algorithm for mixed problems.
492 -

2.2.2 Sequence The adaptation of the Sequencer to this more realistic example proved the good portability of the sequencing technique to a given mining method. Though It Is not completely parametrized, taking into account new rules and constraints has been simplified by the use of formal language (see 4.1). A multitude of outputs are available because the multiplicity of dimensions In this problem (time, space, machines). A possible output Is shown on figure 3. The complete validation of results will only be possible on a real Implemented prototype.
PART 3 : OPEN PIT MINE TECHNIQUES 3.1 REPRESENTATIVE STUDY EXAMPLE The example used to develop short term planning techniques In open pit mines is a convent IonnaI subvertlcal orebody exploited by benches going In depth with a road allowing access to each bench. SubhorIzontaI orebodies exploited by horizontal movement have not been Included In this project. Production method Is the most commonly used shovel+truck method with drilling of blast holes and exploration holes. Methods using draglines or InpIt crushers have not been i ncIuded.
3.2 GEOMETRY In open pit mining the geometry Is the main problem.
3.2.1 Optimization Techniques Classical techniques using optimization have been used on block models, regular or not, In long and medium term planning. A preliminary study has shown the Impossibility of using or adapting these techniques to short term problems for the following reasons :
the difficulty of these techniques to handle such horizontal constraints such as free fronts which are the main core in short term planning, the relative low number of blocks which can be selected In a short per Iod.
- 493 -
3.2.2 O r i e n t e d T e c h n i q u e
The p r o b l e m of mining a given area during a m o n t h Is to sol v e a selection problem under the following c o n s i d e r a t i o n s :
- short term profit,
- medium term pit progress,
low flexibility of mine equipment, and more especially the movement of the shovel which forms the core of the production unit (It Is In fact not possible to move the shovel around the pit so the selection Is committing the shovel nearly during the whole period),
the Interaction between drilling and loading,
the number of possible points which can be selected along the free front on each bench,
the number of possible shapes of the block increment to be cut out on the front (main difference with underground).
The technique developped Is based on combination all possible blocks of a predefined size are generated along the front In width and depth (horizontal dimensions). For each block, evaluation functions are computed (profit, recovery, progress, ... ) .
A rule-based system, taking Into account the above mentlonned considerations and a general "mining scheme", is then allocating the shovel to a set of blocks (figure 4 ) .
By controlling the size of the generated blocks, it is possible to commit more or less the shovel In an area (big blocks) or to allocate several blocks (small blocks) but this will Increase the research alogorlthm in depth.
3.3 SEQUENCER
A specific sequencer has not been developped in this open pit example.
A study on the sequencing problem, using the geometry as a goal to achieve the objectives with the available resources (shovel, trucks, drilling rigs) In the same way as to achieve the progress In underground mines, would be of less difficulty because of the high degree of commitment of the equipment to the areas to be mined.
- 494
PART A : THE SOFTWARE TOOLS
The general environment provided by the UNIX based computer could be sufficient for the development and the Implementation of the techniques required In the BONANZA approach. Nevertheless, two Improvements were necessary to simplify the progress of the project :
- a software plateform to handle formal language,
- a database management system able to handle geometrical objects which are modelling the mining "objects".
4.1 DEVELOPING RULE-BASED SYSTEM 4.1.1 Formal Language Formal language Is commonly used in Artificial Intelligence to represent knowledge In another way than a fixed and rigid a IgorIthm.
If we consider the following examples : [1] Next_Operation( charging ) <- Current_OperatI on (drilling ) Next_Operatlon( charging ) <- Last_OperatIonWas (drilling )
[2] Block_Mlnable( X ) <- HasA_Free_Face( X )
The first example demonstrates the representation of facts (true by definition) which are the basic features of know I edge.
The second example demonstrates the model I Ing of relationship (rule) betweeen block properties.
In this way, the mine production behaviour can be modelled in facts and "mining" rules as follows :
production cycle of a given block,
mining constraints as relations on mining operations In space and time by using rules describing situations which are allowed,
practical mining rules to limit the research space.
- 495
4.1.2 PROLOG Implementation After a formal description of the mine behaviour, It Is necessary to Implement the obtained rules Into an executable code. The PROLOG language Is appropriate to perform this task :
- facts and rules are part of the language syntax, - the solving mecanlsm are part of the language.
As most of the AI languages, PROLOG was rather poor In performing arithmetic tasks, such as : time required for drilling =
F( front parameters, dr Ing rig parameters ) To overcome this problem of simple formal language, the PROLOG interpreter developped for the BONANZA project was built so that it is possible to Interface completely rule-based modules with standard C modules.
4.1.3 Running and Performing On the sequencer, the performing on an UNIX Motorola machine Is slow (45 minutes to sequence a simple example) which cannot be accepted if we consider the on-line aspect of the planning and control BONANZA system. By translating this sequencer Into a C program, running time was brought down to less than 10 minutes. The PROLOG interpreter development.
a tool to be used during
4.2 THE GEOMETRICAL DATABASE MANAGER 4.2.1 Geometrical Objects Graphical representation and geometrical modelling of mine elements are linked features because they are handling the same I terns : geometrical objects. The geometrical 3D object model used In the BONANZA project Is the sur facie model because It is a good compromise between precision and computer bulk. Each object Is modelled by a surface, this surface could be dlscretlsed into a finite set of triangles. A volume Is a closed surface. The developped system, based on this model, provides a complete set of database management functions on the geometrical objects, such as :
496

- graphical representation (drawing, rotating, picking, . . . ) .
- basic management (naming, creating, storing and retrieving, deleting, . . . ) ,
- Information storing qualifying object properties.
To complete Its geometrical core, this database system provides features specific to 3D geometry (3D and 2D Intersection and union of surfaces,computatI on of a volume).
4.2.2 Mining Objects
Using the basic features of the geometrical database system, different mining objects, from simple shapes (benches, roads) to more complex ones (orebody, tunnels and infrastructure) can be represented with surfacic models. Figure 5 Is representing a multllensed orebody; each lens Is obtained by interpolating (3D trianguIation) successive horizontal sections.
Specific mining treatment Is obtained by using the geometrical database management system as a basic Iibrary and adding so a mine meaningful layer In
allocating a meaning to each object a user-definable field Is available In each object record for mining Information (object type, grade, status, . . . ) ,
allocating a meaning to various treatments: Intersecting tunnels with the different parts of an orebody and computing volume of given parts will lead to ore recovery.
In this last part of the project, a certain number of problems have been experienced and solved concerning the modelling of a mining object as a surface; In most cases objects will be considered as a set of surfaces obeying to given relations rather than one whole surface. In doing so, the complexity of the model Is compensated by an Improvement of precision and time performance.
5. CONCLUSION
The BONANZA project has not issued an operational short term planning system on the mines which provided data for the completion of this project, nor has it issued a general tool which could be appIled on al I type of mines.
- 497

Considering the first part of this assertion, this goal was beyond the possibilities of the project. The obvious reason lies In the lack of methods available In the short term process. On this specific aspect, the research work done during the project has enabled to define the following elements :
the short term requirement for production and operation management Is to translate the technIco-economIcaI objectives Into every Instant basic mining operations and by doing so solving the allocation of available resources to the mining process, this task Is achieved In 2 successive steps
obtaining a geometrical layout to be achieved during the period In order to complete the economical objectives assigned to the mine; this problem Is technically difficult In underground mining because of the complexity of the shape of mining infrastructure; because of the freedom of choice of the mining area and the commitment of production equipment to this geometry this problem Is very tricky in opencast mining, the geometrical layout is then considered as an objective to be reached during the period with the available resources (equipment + labour) obeying to the every Instant mining constraints; this is done by allocating resources to each operation using given mining rules (production cycle, mining constraints, heuristics representing how good mine practice would use the resources),
the planning process is very dynamic because its results are to be used on an on-line basis on the production; to keep control on the production by providing an up-to-date plan which can be followed, this planning must be retrieved at a very high frequency to take Into account the latest events and Informations; at the present stage of technology, It is reasonnable to expect a complete data capture session at the end of each shift to retrieve a correct planning for the remaining period.
Considering the second part of the assertion about the results of the BONANZA project, It seems very difficult to build a general computer tool, or even system, which could be Implemented on a mine like the general tools available on the market. The reason for this Is the level of detail required during the planning process : it Is very Important to deal with the specific aspects of the mining method (constraints and behavI our rules).
- 498 -

Therefore the project has Issued the following techniques and basic algorithms :
- a rule-based combination controlling technique for open pit geometrical area selection; because of the multitude of possibilities of choosing areas to be mined during the month, it Is necessary to limit the computation according to priority and profitability ruIes,
a multi-criteria operation research technique to compute the progress In vein mining and a priority definition rule-based system to sort the different confllctual objectives,
a mine operation sequencing tool solving the problem of resources allocation under constraints with use of rule-based heuristics.
These techniques are to be considered as a toolbox. To Implement a short term planning system It would be necessary to capture the rules to be used In each basic tool.
On the software side, It was necessary to provide an appropriate plateform for rule-based systems which constitute the main core of the developped techniques without Inhibiting computation facilities (number-crunshIng and graphics) required during the planning process. To achieve this, the INPL/LIAD has built a PROLOG interpreter completely Interfaced with the standard C language.
This Interpreter Is an excellent tool for development purpose because of the facility to handle the captured ruIes.
The last facility Is to deal with geometry elements which are the basic Items used In mining (orebody, drifts and tunnels, benches and roadways, . . . ) .
The computer system developped for this purpose enables us to treat the graphical aspects and more advanced features on geometrical objects with the vital facility of allocating quality and quantity Information to each object.
Considering the work done on the BONANZA approach, It Is now possible to build a planning tool which could be Implemented on an operational mine by capturing and analyzing mining rules and data. The remaining task will consist In the definition of every Instant data capture facilities and planning retrieval, which will be done In the BONANZA II project on both an underground and an open pit mine.
6. REFERENCES
N.M. CHEIMANOFF, J. SCHLEIFER: Short term scheduling of underground mines with artificial Intelligence. The Bonanza approach. XX I I APCOM, BerI In, 1990.
- 499 -
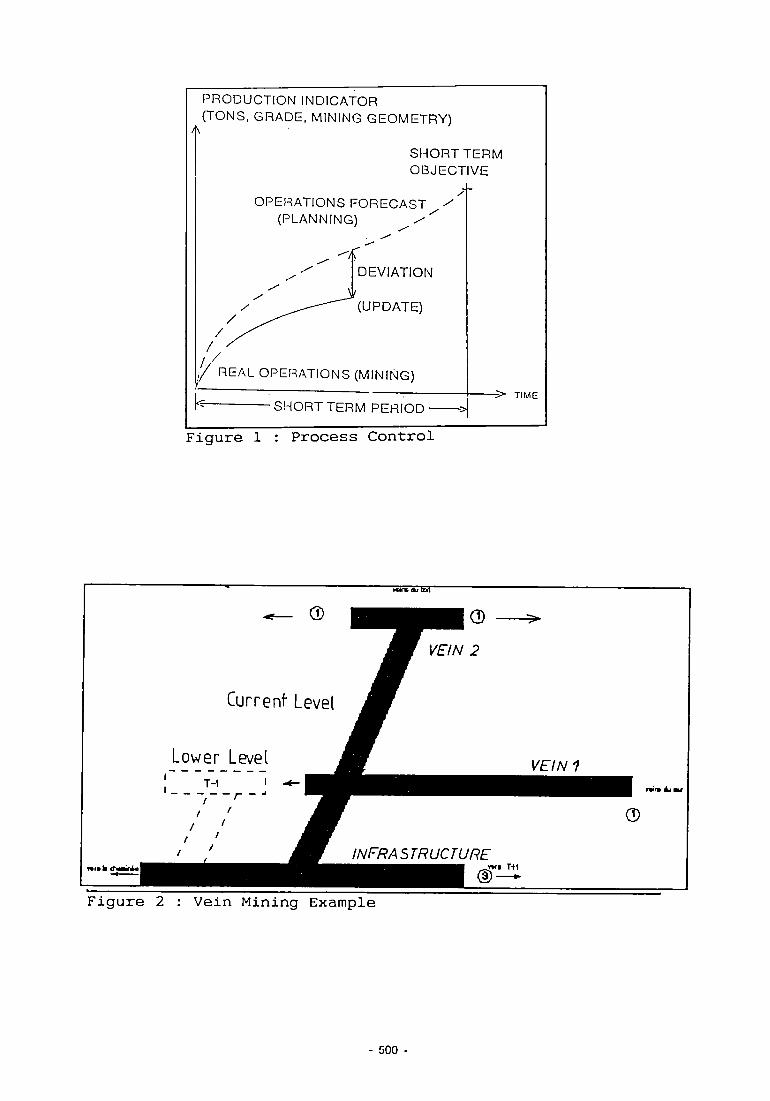
4v
PRODUCTION INDICATOR (TONS, GRADE, MINING GEOMETRY)
SHORT TERM OBJECTIVE
OPERATIONS FORECAST / ' (PLANNING) / ' "
DEVIATION
(UPDATE)
REAL OPERATIONS (MINING)
SHORT TERM PERIOD - > TIME
Figure 1 : Process Control
Figure 2 : Vein Mining Example
500 -

Figure 3 : Sequence Result
A 2 /
A \
A3
— / A1
^>V
\ B1^
\B\ \ \
AREAC
BANCO 1
Figure 4 : Block Selection
- 501

Figure 5 : Multilensed Orebody
502 -

COMPUTER AIDED PLANNING OF UNDERGROUND MINING EXPLOITATIONS
P r o j e c t Leader : J .Q . ROGADO, F. MUGE I n s t i t u t o Superior Teenico/ADIST, Departamento de Engenharia de Minas, Portugal
G. Raspa, R. Bruno Universi ty of Rome "La Sopienza", I t a l y
M. G u a r a s c l o Universi ty of T r i e s t e , I t a l y
Contract MA1M-0063-C(TT)
1. OBJECTIVE The main objective of this research project was to develop software modules enabling the Integrated simulation of the entire mining processes.
The software modules were developed In the frame of the specific case of Neves-Corvo Mine (Portugal), assuming its general characteristics.
The software developed provides simulations of some exploitation processes, taking as Input geostatIsticaI numerical models of the orebody. The outputs of such simulations allow the technical and economical characterization of different alternatives of the ultimate project of the mining method and the short and medium term production planning.
2. INTRODUCTION
During the two years of research, the technical team responsible for the Project conducted the activities following the schedule forecasted for the Implementation of the project, concerning the following main phases presented:
Input Data Preparation Construction of Numerical Models and Models Val Idat ion. Parametrization of Exploitation Methods Modelling of the Production Reporting Medium-Term Planning Short-Term Planning and Production Scheduling Production Reporting Integrated Process Operations.
This report summarizes the work reported In detail In the final report. Part of the work has also been reported eIsewhere.
- 503 -
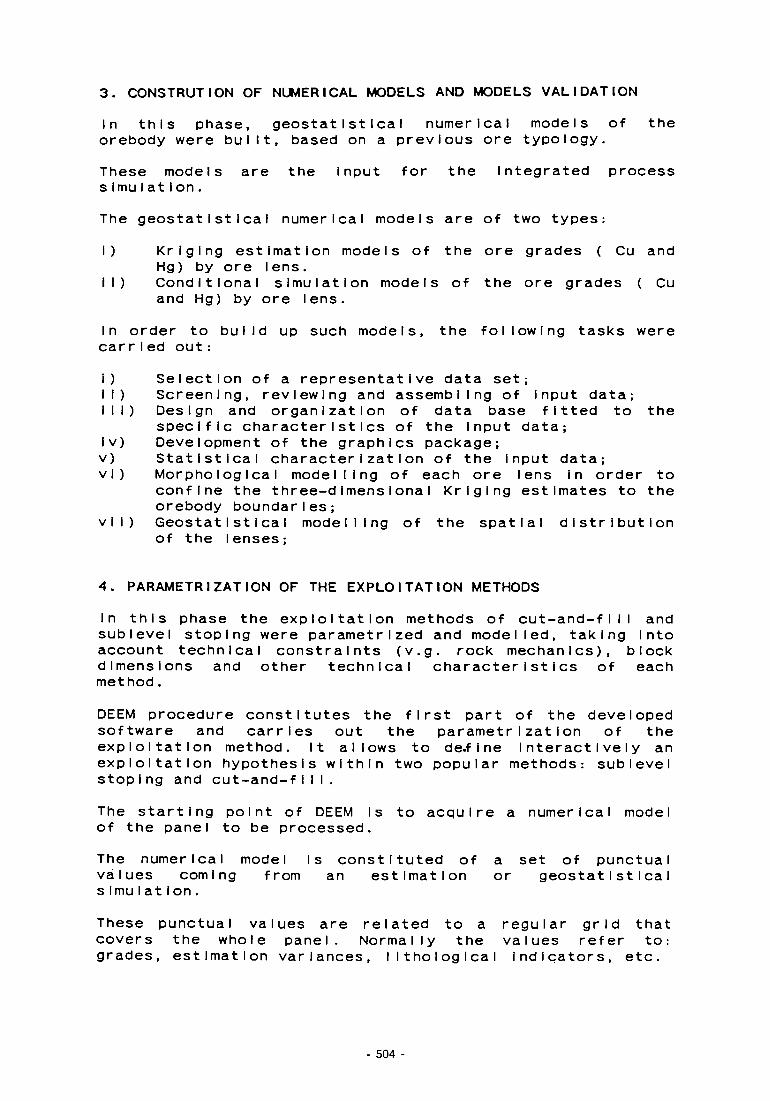
3. CONSTRUTION OF NUMERICAL MODELS AND MODELS VALIDATION
in this phase, geostatisticaI numerical models of the orebody were built, based on a previous ore typology.
These models are the Input for the Integrated process simuIation.
The geostatisticaI numerical models are of two types:
I) Kr i g I ng estimation models of the ore grades ( Cu and Hg) by ore lens.
II) Conditional simulation models of the ore grades ( Cu and Hg) by ore lens.
In order to build up such models, the following tasks were carrIed out:
i) Selection of a representative data set; II) Screening, reviewing and assembling of Input data; III) Design and organization of data base fitted to the
specific characteristics of the Input data; iv) Development of the graphics package; v) Statistical characterization of the input data; vl) Morphological modelling of each ore lens in order to
confine the three-dimensional Kriging estimates to the orebody boundaries;
vii) GeostatIstlea I modelling of the spatial distribution of the lenses;
4. PARAMETRIZATION OF THE EXPLOITATION METHODS
In this phase the exploitation methods of cut-and-f I I I and sublevel stop Ing were parametrized and modelled, taking Into account technical constraints (v.g. rock mechanics), block dimensions and other technical characteristics of each method.
DEEM procedure constitutes the first part of the developed software and carries out the parametrIzation of the exploitation method. It allows to de.f I ne interactively an exploitation hypothesis within two popular methods: sublevel stoping and cut-and-fIII.
The starting point of DEEM is to acquire a numerical model of the panel to be processed.
The numerical model Is constituted of a set of punctual values coming from an estimation or geostatIstIcaI simuIation.
These punctual values are related to a regular grid that covers the whole panel. Normally the values refer to: grades, estimation variances, llthologlcal Indicators, etc.
- 504
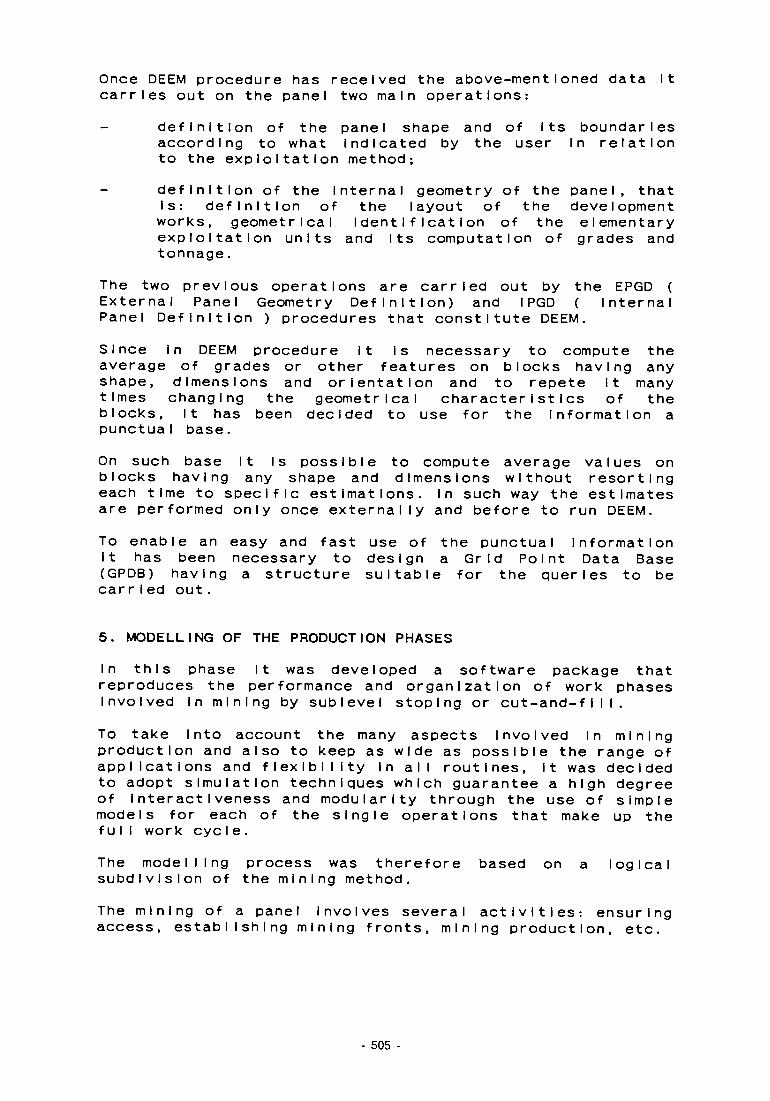
Once DEEM procedure has received the above-mentioned data it carries out on the panel two main operations:
definition of the panel shape and of Its boundaries according to what Indicated by the user In relation to the exploitation method; definition of the internal geometry of the panel, that Is: definition of the layout of the development works, geometrical Identification of the elementary exploitation units and Its computation of grades and tonnage.
The two previous operations are carried out by the EPGD ( External Panel Geometry Definition) and IPGD ( Internal Panel Definition ) procedures that constitute DEEM. Since in DEEM procedure It Is necessary to compute the average of grades or other features on blocks having any shape, dimensions and orientation and to repete It many times changing the geometrical characteristics of the blocks, It has been decided to use for the Information a punctual base. On such base It Is possible to compute average values on blocks having any shape and dimensions without resorting each time to specific estimations. In such way the estimates are performed only once externally and before to run DEEM. To enable an easy and fast use of the punctual information it has been necessary to design a Grid Point Data Base (GPDB) having a structure suitable for the queries to be carrIed out.
5. MODELLING OF THE PRODUCTION PHASES In this phase It was developed a software package that reproduces the performance and organization of work phases Involved In mining by sublevel stoplng or cut-and-fI I I .
To take Into account the many aspects Involved In mining production and also to keep as wide as possible the range of applications and flexibility In all routines, It was decided to adopt simulation techniques which guarantee a high degree of Interactiveness and modularity through the use of simple models for each of the single operations that make up the fuI I work eye Ie.
The modelling process was therefore based on a logical subdivision of the mining method.
The mining of a panel Involves several activities: ensuring access, establishing mining fronts, mining production, etc.
- 505
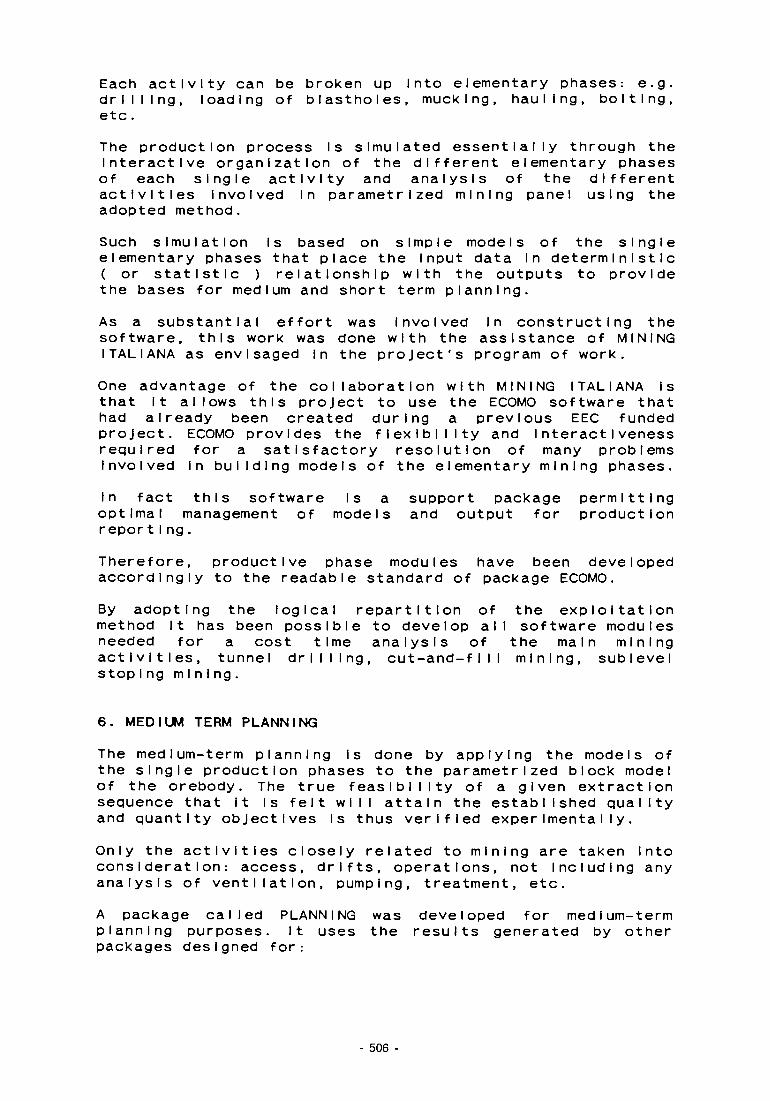
Each activity can be broken up Into elementary phases: e.g. drilling, loading of blastholes, mucking, hauling, bolting, etc.
The production process Is simulated essentially through the Interactive organization of the different elementary phases of each single activity and analysis of the different activities Involved In parametrized mining panel using the adopted method.
Such simulation Is based on simple models of the single elementary phases that place the Input data In deterministic ( or statistic ) relationship with the outputs to provide the bases for medium and short term planning.
As a substantial effort was Involved In constructing the software, this work was done with the assistance of MINING ITALIANA as envisaged In the project's program of work.
One advantage of the collaboration with MINING ITALIANA is that It allows this project to use the ECOMO software that had already been created during a previous EEC funded project. ECOMO provides the flexibility and Interactiveness required for a satisfactory resolution of many problems Involved In building models of the elementary mining phases.
In fact this software is a support package permitting optimal management of models and output for production report Ing.
Therefore, productive phase modules have been developed accordingly to the readable standard of package ECOMO.
By adopting the logical repartition of the exploitation method It has been possible to develop all software modules needed for a cost time analysis of the main mining activities, tunnel drilling, cut-and-fill mining, sublevel stop Ing mInIng.
6. MEDIUM TERM PLANNING
The medium-term planning Is done by applying the models of the single production phases to the parametrized block model of the orebody. The true feasibility of a given extraction sequence that it Is felt will attain the established quality and quantity objectives Is thus verified experimentally.
Only the activities closely related to mining are taken Into consideration: access, drifts, operations, not Including any analysis of ventilation, pumping, treatment, etc.
A package called PLANNING was developed for medium-term planning purposes. It uses the results generated by other packages designed for:
506

- parametrIzatI on of ore reserves parametrIzatIon of mining methods (DEEM package) modelling of Individual production phases (UNOPM package)
The main characteristics and functions of this software are:
building a data-base and classifying ore reserves estimated according to a model based on points, blocks and panels. building a data-base of modules for mining operations simulation of mining panels using the two studied methods: sublevel stoplng and cut-and-fI I I calculation of times, costs and resources used (manpower and machines ) to organize the simulated eye I e verification on the congruence of the operations that were simulated using the pre-selected volumes ore flows simulation from panel stock, mass stock, central stock in terms of volumes and grades, Including updating and building of a data base which Includes all stock status.
7. SHORT TERM PLANNING AND PRODUCTION SCHEDULLING
In this phase, the short term planning is used for accessing specific mining sequences and the production scheduling is performed on the basis of an objective function (e.g. minimization of fluctuation processing plant feed, grade control, etc.) using eventually aditlonal sampling.
Whatever the exploitation method used, it is nowadays common practice, to program the production schedulllng, In order to minimize the grade variability of the mined ore. In this case, the objective of the production scheduling, subjected to the geometric ( mining or geomechanlcs ) constraints of the method, Is to provide the maximum "Internal" blending In order to avoid or minimize blending operations (stockpiling, etc.) before the concentrator.
Once established a certain time basis, to mine an orebody consists on a sequence of exploitation decisions. In this sense, the exploitation procedure can be considered as a discrete Markovlan process and so, the search for optimal policy can be done, with advantage, by Dynamic Programming.
The methodology to apply Dynamic Programming to the definition of optimal mining policy In an underground mine Involves the following steps that have been carried out:
Calculation of the exploitation matrix that allocates a fixed number of blocks ( to exploit in a certain period of time ) to the admissible working faces.
507 -
Modelling of the mining method with definition of the geometric ( mining or geomechanIcs) constraints. Definition of the criterion function to optimize. Conception of the dynamic programming model.
Software modules were developed for each one of the mentioned methodological steps.
8. PRODUCTION REPORTING The reporting on production essentially comprises two phases : 8.1 REPORTING
regrouping of the more significative points of the plan. Introduction of other mining cost I terns and modelling them If necessary. identification of criteria and/or indexes for a technicaI-economIc evaluation of the plan that takes accounting outputs of costs and Investments. illustration of the state of mine (present or foreseeabIe).
8.2 VERIFICATION OF INPUTS AND INPUT/OUTPUT DATA ANALYSIS obtain and analyse information from stockpiles, mills, etc. obtain data on reserves or from the block model ( if updated in a data base ) or from parametrization Identification of the sequence in which the panels are to be mined ( dynamic programming)
Software modules were developed In this phase, handled by the ECOMO procedure.
9. INTEGRATED PROCESS OPERATIONS A simulation of mining operations using the software developed in this research project was performed in order to give an Integrated example of the potential applicabilities of the package dealing with the main phases of a mining project: the ultimate project of the mining method and the production planning.
The operations covered In the simulation procedure are the foIIowing:
Selection of the point-grid model of estimated and simulated copper grades. Definition of the external panel geometry. Definition of the Internal panel geometry. Medium-term planning. Short-term planning. Reporting and production control.
508
The simulation aims to give answer to some relevant problems that arise at project level. The most Important of which Is to predict what will be the consequences In the ore-grade variability when adopting a certain mining method with Its fixed geometric constraints.
When choosing medium-term production zones, the usual criteria Is to maintain certain in situ characteristics of the mined ore constant, like Its tonnage and average grade as well as stabilizing the mining equipment needed to keep the production rate within preestabI I shed limits.
Is It possible, In the short-term level, to maintain these target parameters within an acceptable range, programming the production scheduling In order to minimize the grade variability of mined ore, providing maximum "Internal" blending or is it necessary to perform blending operations (stockpiling, etc..) before the concentrator? In this case what should be the dimensions of the stockpile?
Another significant question, of Important account in mine planning, concerns the so called "Information effect".
In fact, the orebody boundaries definition and the production zones, panels, stopes or mined block selections are based on estimates of ore grades that depend strongly on the existing Information.
In medium-term planning the decisions concerning the selection of production zones (1 to 3 months of production), are taken on average estimates of tonnage and grades.
At this planning stage, the information usually consists on data coming from a regular mesh drilling campaign covering the entire orebody.
This information Is usually sufficient to estimate accuratelly the average value of ore grades within a defined medium-term production zone, but attending to the smoothing effect of the estimation procedure, it Is not enough to give an unbiased picture of the ore grade variability based on a smaller support like the selection block or exploitation unit. This means that the block recovery both In tonnage and In average grade can be strongly biased at this planning stage.
In short-term planning, the decisions are taken concerning a higher density of Information coming from the sampling of the working faces.
In this planning stage the miner usually has, in advance, a much better knowledge of the ore grade distribution In working faces, planning the production scheduling accordingly to the fixed production targets.
509
In order to simulate these situations, during the project phase two Input geostatIstIcaI numerical models were created: an estimated and a simulated point grid model (v.g. chapter 3).
The estimated point grid model is used as Input to define and estimate the exploitation modules (DEEM v.g. chapter 4). This part of CAPUME software package carries out the following operations:
Definition of panel shape and Its boundaries according to the exploitation method. In this phase the selection is based on a block grid model.
Definition of the internal panel geometry, that is:
layout of development works - geometrical Identification of the elementary
exploitation units (block grid model) computation of grades and tonnages
Once defined the exploitation layout and the block grid model, the software is able to simulate the medium-term planning decisions.
In this planning stage the objective is to define a production scheduling based on the Interactive choice of medium-term production zones In order to settle some target parameters like ore tonnage and average grade (v.g. chapter 6).
Here again the estimated block grid model was used to reach the real planning situation at project level.
The next step simulates, in the selected medium-term production zones the short-term planning decisions.
As exposed before, this selection Is based on a higher degree of information. So, In order to reach a better picture of the short-term selection procedure, the simulated block model was used.
In this stage, the usual attitude of the miner consists on programming the production scheduling by maximizing the Internal blending, in order to minimize the ore grade varIab i I Ity.
This situation Is simulated in CAPUME software package by applying dynamic programming algorithms to define short-term mining sequences (v.g. chapter 7).
Finally, an entire mining simulation was performed and the ore flows obtained were used to compare project a IternatIves.
- 510
The simulation of the Integrated process operations was applied to the specific case of Neves-Corvo Mine (Portugal) assuming Its general characteristics (mining method, block definitions, mine layout, etc...). For the simulation procedure, a zone was selected between the mining levels 812m and 832m, corresponding to 5 mining levels of 4 meters high. Simulations of the integrated process operations were performed varying the degree of the medium-term updating procedure of ore grades estimates and the rate of ore product Ion. The results shown by this simulation procedure suggest that stronger effort should be done In the medium-term updating procedure of ore grade estimates. This In, Indeed, the most important controlling factor of the ore grade variability. The real results coming from the mine and corresponding to the same period of production are in accordance with those obtained by the simulation, showing periods of high ore grade variability (dally fluctuations of copper grade, within one month of production, between 20% and 4%). Other output of mining simulation consists on studying the Influence of blending operations (stockpiling) In the ore-grade varIab i I Ity. In the Neves-Corvo mining project, the capacity of the stockpiling Is limited to 2-3 days owing to mined ore ox i datI on. The results show, In general, a clear decrease of about 2% when comparing a 2 days average variance with the Initial da I Iy varIance. A 2 or 3 day stockpiling seams to be enough to absorb the great part of the Initial daily ore-grade variability, but the most Important controlling factor still remains to be the medium-term updating procedure of ore grade estimates.
10. CONCLUSIONS The main objective of the research work, i.e., the development of software modules enabling the integrated simulation of the entire mining process, was fully accompI I shed. The results obtained during the execution of the research project were quite encouraging. In fact, It was possible, by applying the developed software modules, to perform simulations of the mining process operations whose results are In accordance with the actual data coming from the exploitation of Neves-Corvo mine.
511

In particular, the great ore-grade variability found during the first exploitation year of the mine, could have been forecasted, during the project phase, by using adequate modelling and Integration of the various mining processes which constitutes one of the main reasons of this research project.
The several developed software modules are now able to be complemented and integrated Into a complete system for underground mine planning purposes.
In order to accomplish this task, futher research effort should be done in the following areas:
I) Generalization of the software package which Implies the development and testing of new modules adapted to different exploitation methods In order to enlarge Its range of applicability.
II) Setting up mineral processing unit models, followed by simulation of the plant treatment system and respective Integration with the mine exploitation models In order to get an economical assessment of the different medium and short term production planning alternatives. With this procedure It will be possible to compare project alternatives based on economic results obtained through simulations of the entire production cycle.
ili) Development of software modules able to Integrate the Information collected during the execution of the mining works, updating the models developed during the planning stage accordingly. This need of updating Is Indeed one of the main conclusions of this research project and fully Justifies that further research work should be done In this area In order to adapt the mine planning accordingly to the real data coming from the mine. This way the software package can fol low the life of the mining venture becoming a real and operational planning tool.
iv) Software package implementation with the purpose of Its Industrialization. This aspect Justifies the fully Involvement of mining Industries In the continuation of the research project in order to apply, test and adapt the software package to the actual conditions of a mine exploitation.
512 -
11. REFERENCES Rogado J.Q., Muge F. H. , Santos N.,Vlelra J.L., Travassos J.F., 1990 , " Planeamento assltldo por computador de Exploracoes Mineiras Subterraneas", National Congress of Mining Engineers, Oct.1990, Faro, Portugal. Bruno R., Raspa G., Guarasclo M., Muge, F. H., Qulntlno J.Q., Santos, N., 1990, " Computer Aided Planning of Underground Mining Exploitation", XXII APCOM, Berlin, RFA, PP 27. Soares A., GoncaIves A., Almeida J., 1990, " Simulation of Orebody Geometry: Morphological Characterization of a Stratabound Sulphide Deposit", XXII APCOM, Berlin, RFA, pp 613. Soares A., 1989, " Morfologla Geosestatistica de Recursos Minerals", Ph. D. Thesis, Lisbon, 1ST. GoncaIves, A. F., 1989, "Modelagem Numerlca GeoestatIstica do Jazlgo de Corvo", M. Sc. Thesis, LMPM, 1ST, Llsboa. Muge, F. H., Santos, N., 1989, " Application of Dynamic programming to the grade control and schedulling In a cut-and-fill mining method", XXI APCOM, Las Vegas, USA, pp 479-484.
Bellman R. E., 1957 , "Dynamic programmIng",(PrInceton, New Jersey: Princeton University Press, 1957), 342p.
513 -


RESEARCH AREA 5.6
PROBLEMS ASSOCIATED WITH SMALL-SIZE MINES

FUNDAMENTAL ANALYSIS AND DEVELOPMENT OF SMALL SCALE MINING
SMALL NEAR
METHODS BARITE TO THE
AND FOR IN -THE-ORE FLUORSPAR
SURFACE WITH APPLICATION OF OPEN PIT
LODE DEVELOPMENT DEPOSITS
SPECIAL REGARD
OF SITUATED TO
MINING METHODS WITH THE LATER
TRANSITION TO UNDERGROUND MINING
Project Leader: W. KNISSEL Technical Universi ty of Clausthal , Germany
G. B a d l n o Pol i tecnico di Torino, I t a l y
Cont rac t MA1M-0050-D(BA)
1. OBJECTIVE OF THE RESEARCH PROJECT The objective of the research project was the fundamental analysis of the possibilities for the mining of fluorspar and bar Ite lode deposits in the countries of the European Community by small scale mining methods. In the research different mining systems were Investigated permitting the extraction of veins situated near to the surface by open pit mining methods with later transition to underground mining. In order to take Into consideration the growing concern about the environmental impact of mining the question of the Influence of the Environmental Impact Assessment on mining operations is also investigated. Besides a decision method Including economic and ecologlc parameters Into the decision process for transition from open pit to underground mining was developed. Research was carried out in three focal areas of Investigation described In the following.
2. FIELD OF RESEARCH I - FUNDAMENTAL ANALYSIS OF SSM FOR FLUORSPAR AND BARITE LODE DEPOSITS
Investigations of the fIuorspar/barite market In the European Community turned out a situation of increasing dependency of the European countries on Imports from eastern and developing countries. By way of contrast an increase of demand is expected for the next years as a substitution of fluorspar and bar Ite In their applications cannot be realized sufficiently.
517

Concerning fluorspar, demand will Increase due to the substitution of the ozonsphere-damagIng hydrofIuorcarbons which will be substituted by new fluorine chemicals needing five times the amount of fluorine as so far. Bar Ite demand will Increase with Intensification of oil well drilling activities. Therefore markets show good opportunities for fluorspar and barlte.
An analysis of the prices turned out that, after Indexing all prices for the different products, prices generally declined In the last years. Therefore out of economic reasons mining has to be carried out by low cost mining methods.
Research on the question of definition of a small scale mine turned out that a single generally valid definition cannot be found. The actual size of the mines varies in terms of capacity very strongly especially as far as different minerals are concerned.
One definition for the size of SSM's is the definition of J.S. Carman who defines a SSM as one which produces 100,000 t/y or less. Carman also states that worldwide 60 % of the barlte production and 90 % of the fluorspar production are coming from SSM.
An analysis of SSM-defInitIons In the literature turned out that 66 % of the authors defined a SSM as a mine producing 100,000 t/y or less.
The European Communities define a small business as an activity with a balance-sheet value of 1 Mlo. ECU/a, a net turnover of 2 Mlo. ECU/a and a number of employees of less than 50 people.
Number of employees turned out to be no applicable criteria for defining a SSM, as the degree of mechanisation and the method of mining (underground or open pit) Influence the number of employees and the capacity of the mine, see fig. 2.
By analyzing the data of 30 active mines In Europe a correlation between the capacity of the mine and the reserves could be derived according to Taylor's rule with the following formula:
Q = 1.2 R°. 8
with Q annual production In metric tons and R reserves in metric tons, see also fig. 3.
Additionally a calculation method Is presented which allows the definition of the suitable capacity of the SSM when the maximum turnover of a small business Is taken as a criteria for limitation of small size.
518

In the project, capacities between 2,500 t/y and 25,000 t/y are Investigated for the fluorspar and bar Ite mining activities.
By evaluating the deposit data of 112 fluorspar and 90 barlte lode deposits the geometry of the mine model was developed, see fig. 4. Almost all deposits have an apex on the surface which proves that transition from open pit to underground mining can be applied.
Further topics of Investigation In the field of research I are the problems of SSM and the analysis of practical examples of transition from open pit to underground mining which shows that hereby a general criteria for the transition cannot be derived.
3. FIELD OF RESEARCH II - DECISION THEORY FOR THE TRANSITION FROM OPEN PIT TO UNDERGROUND MINING WITH SPECIAL REGARD TO ENVIRONMENTAL ASPECTS
First an effort was undertaken to find an empirical approach for the decision-making for the transition from open pit to underground mining. Unfortunately there was no sufficient data for the empirical analysis of fluorspar and barlte mines available. Therefore the point of transition could be evaluated only for the case of open pit clay mines but with the restriction that the alternative Is here either open pit or underground mining, see fig. 5.
In the Investigations with the computer mine model the point for transition from open pit to underground mining was found by the dynamic Investment appraisal net-present-value (NPV) method. This method is mostly used in the mining Industry for the appraisal of mining projects. In the calculations the NPV for each single useful variant for the transition In different depths is evaluated.
Additionally the variants "mining the deposit only by open pit mining" and "mining the deposit only by underground mining" are Investigated. The variant with the highest NPV Is then chosen for the transition from open pit to underground mining or In the case that one of the latter cases has a higher NPV, either open pit or underground mining Is chosen for mining the whole deposit.
Additionally the Influence of Environmental Impact Assessment on the decision for transition was Investigated. In the cases where EIA Is obligatory the economics of SSM are seriously affected by the costs caused by EIA and by the monetary effects of the delays for approval procedures, see fig. 6. Here the state of realization of EIA Into the national laws of the different European nations was analyzed and the single regulations concerning mining activities were evaIuated.
519
In cases where the application of EIA depends on the reach of a threshold value, like In German mining law where It Is 15 ha for open pit mines It Is often more advantageous out of economical reasons to practice the transition from open pit to underground mining at an earlier time for achieving a higher NPV In the project, see fig. 7. Here diagrams for vein deposits can be derived which show for which geometry the EIA threshold value will be overstepped before the primary economic depth will be reached.
Besides of the purely economically orientated methodology of calculation of the NPV for the transition-decision an objective of the research project was the development of a decision model including both economic and environmental aspects of the project Into the decision-procedure. As economics and environment are often orientated contrarly, here the combination of the two aspects had to be realized. The result of the efforts Is the Net Present Value/Benefit Worth Matrix (NPV/BW-Matrix) , a graphical solution in which the a.m. NPV for economic evaluation and the benefit worth BW for the environmentally orientated approach are combined. The steps for the evaluation of the BW are: Definiton of a system of targets, evaluation of alternatives, definition of criteria for valuation, measurement of target accomplishment, valuation of target accomplishment, weighting of criteria, calculation of partial benefit worthes, addition of partial worthes to overall benefit worth. As a result a method Is now available which Is practically orientated to the economic Investment appraisal methods used in the Industry and allows the consideration of environmental aspects. The application of the NPV/BW-matrix on model mines shows that often, if the decision for transition to underground mining is taken at an earlier stage of operation the environmental Impact of the operation is a lot smaller whereas the economics of the mine are only affected to a little degree, see fig. 8.
4. FIELD OF RESEARCH III - TECHNICAL AND ECONOMICAL INVESTIGATION OF ENVIRONMENTALLY SOUND MINING METHODS FOR LODE DEPOSITS SITUATED NEAR TO THE SURFACE BY OPEN PIT MINING WITH LATER TRANSITION TO UNDERGROUND MINING
Investigations on the field of mining methods are based on the analysis of practical applications. For the Investigation the O.P.I.U.M. computer-simulator (Open Pit with Integrated Unterground Mining) was developed which allows the evaluation of all kinds of deposits with different geometry, geology, organisational and regional situations. The following four open pit mining methods can be applied In the programme:
520
Cave to the surface from an underground opening Surface-bound mining without entering the open pit Not-surface-bound mining with ramp In-the-ore Not-surface-bound mining with ramp ex-the ore
see also fig. 9.
These open pit mining methods can be combined with the following underground mining methods after transition:
Sublevel stoplng with cemented backfill Shrinkage stoplng with backfill Cut and fill mInIng.
Comparing the different methods for open pit mining, In this case always with sublevel stoplng with cemented backfill as the underground mining method It becomes evident that a transition from open pit to underground mining with ramp in-the-ore technique Is the most economic choice but only when the mineral contained In the ramp Is exploited after the transition to underground mining In order to minimize Iosses, see fig. 10.
Results achieved with the programme showed that a SSM can only be performed economically on deposits with high ore contents and thicknesses. The geometry of the deposit should have a great horizontal and a limited vertical extension. In the mine the operation should be preferably carried out with used equipment, transport activities should be carried out by subcontractors In order to minimize costs. Beneficiation is heavily influencing the economics of the whole operation. Own processing plants are only economical for SSM when the deposit has extremely high grades. It is here more economical to use a contractor processing plant but here small distances to the plant are a prerequisite. Due to the benef I c I at I on problem It is also not useful in the case of barlte deposits to produce low quality price products as these do not cover the high costs.
- 521

5. RESULTS AND CONCLUSIONS
Fluorspar and barite are both minerals with good market opportunities for the future and therefore good possibilities for mining activities. Both minerals are mined predominantly In small scale operations. Small scale mining on fluorspar and barite deposits is Investigated for the project by the criteria of capacity for sizes between 2,500 and 25,000 t/y.
Due to high preproductI on Investments in the Industrialized and mechanized countries of the EEC an economic activity can hardly be performed by very small activities with low annual output. i e results can only be reached on surface near deposits with large horizontal dimensions and high ore grades. The combined open pit with following underground mining Is generally the more economic method than single open pit or underground mining. The use of used equipment Is a further criteria for becoming economic, besides transport activities In the mine should be carried out by contractors. Transition from open pit to underground mining produces early cash flows Improving overall economics. Depth of transition is mostly less than 30 m due to Increasing amounts of waste which have to be removed In deeper open pits. In-the ore development techniques with ramp-In-the-ore open pit technology are most valuable for small operations. After transition the ore in the ramp has to be exploited.
Environmental considerations strongly Influence the economics of SSM, here the duration of the permission procedure negatively influences the net present capital value of the project. In countries where the application of EIA Is based on the reach of a threshold value, economics of the operation are directly linked to the depth of transition. Early transition Is here a prerequisite for maximizing economics of the operation.
In order to combine environmental and economic consideration the NPCV/BW-matrix was developed which allows both the maximization of the economics and the inclusion of the consideration environmental Impact of the mine in the decision process for transition from open pit to underground mining. Future research activities must concentrate on questions for further Improvement of Inclusion of environmental considerations In the planning and mining process and on the minimization of preproductI on Investments for small activities.
- 522

6. REFERENCES 1. Weber, L., PIeschIutschnig, I.: We Itbergbau-Daten '88,
Wlen, 1988
2. Coffman, J.S., Kilgore, C.C.: Barite Availability -Market Economy Countries. A Minerals Availability Appraisal, Information Circular 9115, United States Department of the Interior, 1986
3. Taylor, B., Rebolleda, M.: GNP, Third World development and their effect on fluorspar markets, Industrial Minerals, October 1989, P. 57 - 63
4. Carman, J.S.: Sma I I-Sea Ie Mining - Its special characteristics In world mineral production, Workshop on Mineral Policy for Small Scale Mining, November 1984, New DeIhI , Ind la
5. Noetstaller, R.: Sma I I-Sea Ie Mining, a review of the Issues, World Bank Technical Paper No. 75, Washington D.C., 1987
6. Stoppel, D., Gundlach, H. u.a.: Schwerspat- und FIußspatIagerstätten des Siidwestharzes , Geologisches Jahrbuch Reihe D, Heft 54, herausgegeben von der BundesanstaIt für Geowissenschaften und Rohstoffe und den Geologlschen Landesämtern In der BundesrepubI Ik, Hannover, 1983
7. Stoppel, D.: Schwerspat Forschungsprogramm, Lagerstatten-kundI Iche Untersuchung zur Erschließung nlcht Im Abbau stehender SchwerspatIagerstatten In der BundesrepubI Ik Deutschland, RG 8105, Archlv Nr. 97880, BundesanstaIt für Geowissenschaften und Rohstoffe, Hannover, 1985
8. Goergen, H. (Hrsg.): FestgesteInstagebau, Clausthal-Zellerfeld, 1987
9. Redpath, J.S. Ltd. (Ed.): Estimating Preproduction and operating costs of small underground deposits, Ottawa, 1987
- 523
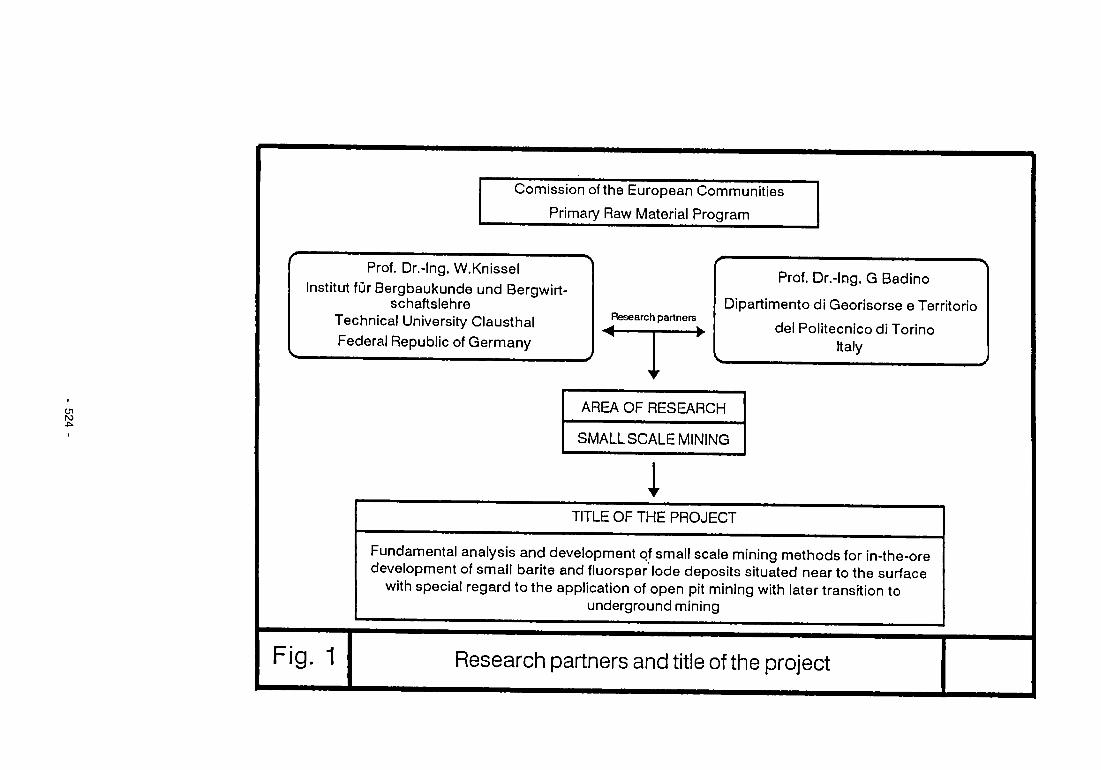
Comission of the European Communities Primary Raw Material Program
Prof. Dr.-lng. W.Knissel Institut fur Bergbaukunde und Bergwirt-
schaftslehre Technical University Clausthal Federal Republic of Germany
in ro
Research partners ■4 1 ►
Fig. 1
Prof. Dr.-lng. G Badino
Dipartimento di Georisorse e Territorio del Politecnico di Torino
Italy
AREA OF RESEARCH
SMALLSCALE MINING
1 TITLE OF THE PROJECT
Fundamental analysis and development of small scale mining methods for in-the-ore development of small barite and fluorspar lode deposits situated near to the surface
with special regard to the application of open pit mining with later transition to underground mining
Research partners and title of the project

Capacity 1000 t/a
en ho tn
Open Pit
350 ^ Mines
■ Underground mine, high mechanisation ▲ Underground mine, low mechanisation • Open Pit
200 250 Employees
Fig. 2 Definition of Small Scale Mining on the basis of the number of employees

en
Annual production [ I0
3metrictons]
1 5 0 .
140 _
Mining Magazine 1988
UN 1972
UN, Ankara 1988
Empirically evaluated size for CaF-andBaSO, Small-Scale-Mines In the EEC
0,8
Fig. 3
1,0 1,2 Reserves [ 10
s metric tons]
Coherence between capacity and reserves of fluorspar and barite mines according to Taylor's rule (♦ fluorspar, ■ barite)
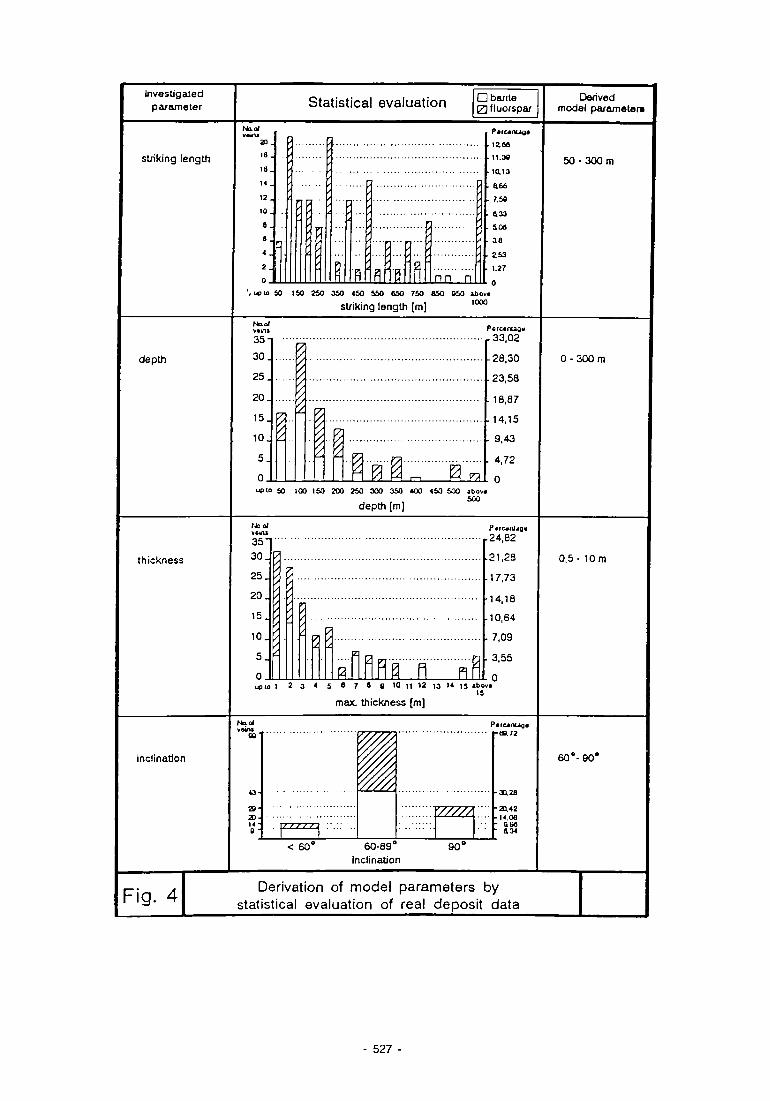
Investigated parameter Statistical evaluation □ ba/ite
0 fluorspar Derived
model parameter*
striking length
No. of VWAS
2 D .
1 8 .
id
14
12
10
a 8
<J 2
0 nn n
P«rc*nUg«
12.6S
. 11.30
■ 10.13
. a 66
7. SO
0.33
. soa ■ 3 8
2 5 3
1.27
0 ' .upliJ SO 150 250 350 4SO 550 650 750 aSO 050 i b o v .
1000 striking length [m]
5 0 - 3 0 0 m
depth
No. of v«tru
35
30
25
2 0 .
15
10
5
^ ^ 0 n.
P«rc4«nug«
r 33,02
28,30
.23,58
18,87
14,15
. 9,43
• 4,72
0 upco 50 100 ISO 200 250 300 350 4O0 450 500 lUov.
500 depth [m
0 - 3 0 0 m
thickness
(tool vsms
35 3 0 .
25
2 0 .
1 5 .
1 0 .
0 UPIO 1
S. Ra n nfl
PtficanUge
r24,82
-21,28
17,73
•14,18
-10,64
- 7,09
3,55
2 3 4 5 0 7 8 9 10 11 12 13 14 i s ibovt IS
max. thickness [m]
0,5- 10 m
inclination
29 2 0 - V7777\
PafCAnuga i-ag. 72
30.28
20.42 14.08
0.68 834
< 60" 60-89 Inclination
90°
6 0 - 9 0 *
Fig. 4 Derivation of model parameters by statistical evaluation of real deposit data
527

oo
0
-10 -
-20 -
- 3 0 -
-40
- 5 0 -
- 6 0 -
- 7 0 -
- 8 0 -
- 9 0 -
depth [m]
Open pit clay mines (No.) 1 2 3 4 5 6 7 8 9 10 11 12 13 14 15 16 17
M
-Jz-
i ^ 1 i ^ I 1 i ^
Open Pit Mining
Transition zone
111 1 ■■.111 18 19
1 i i ill II
^
Underground mining
± ± ± ± ±
8 ±
Underground clay mines (No.)
ESS clay mineral open pit
I | overburden open pit
± depth of underground mine
Fig. 5 Empirical differentiation of the open pit/underground mining zone -representated exemplarily by clay mines in the Federal Republic of Germany.

CO
Net Present Value "1 7 Q (Mio. DM) ' "
16,8.
16,6.
16,4.
16,2.
16,0.
15,8.
15,6.
15,4.
15,2
without EIA
Project delay by EIA (years)
0 1 2 3 4
—I 1 1 1 1 1 1 1 10 15 20 25 30 35 40 45
transition depth (m)
Fig. 6 Effects of EIA on Economics, Case 1 EIA obligatory

en CO o
Net Present Value H -T Q (Mio. DM) ' "
Fig. 7
16,8.
16,6.
16,4.
16,2.
16,0.
15,8.
15,6.
15,4.
15,2. ■ i i i i i
5 10 15 20 25 30 35
^►without EIA
V Project delay S ^ v
by EIA (years)
VV\£0
\ ^ 3 V
1
4 1
40 45 transition depth (m)
Effects of EIA on Economics, Case 2: EIA depending on Threshold Value

Ol CO
Net Present Value (Mio.DM)
10 J
0 1
ANPV
Fig. 8
Total Underground Mining
2 3 4 5 6 7 8 9 10 Benefit Worth (Points)
Net Present Value / Benefit Worth - Matrix

No. aperational
method
Open pit zone
transition open pit/ underground mining unaer-
qroundz.
mining method
development
element
transition develop
ment element
mining method
Environmental impact
Land use
Maximum attainable depth of open pit
Fig. 9
UNDERGROUND MINING
cave to the surface
underground development element
underground development
element
II III IV Open Pit Mining
surface-bound
no development element
drifting of a separate under
ground development element
not surface-bound
open pit development element in-the-ore
1 :from pit bottom without abandonment of the ramp
2:drifting of a separate underground dev elem. with abandonment of ihe ramp
3:not-conventional transition in-the-pit
open pit development element ex-the-ore
1:from pit-bottom
2: drifting of a separate underground development element
3: not-conventional transition in-the-pit
MINING METHODS FOR STEEPLY INCLINED LODE DEPOSITS
CLASSIFICATION OF MINING METHODS FOR OPEN PIT MINING WITH LATER TRANSITION TO UNDERGROUND MINING FOR THE EXPLOITATION OF FLUORSPAR/BARITE LODE DEPOSITS

en w w
Net Present Value (Mio. DM)
2,9 J
0
B = ramp from Pit Bottom C = ramp from Pit Bottom, inclusive exploitation of the ramp
1 1 30 36 Depth (m)
Fig. 10 Transition from Open Pit to Underground Mining ramp In-the-ore, Sublevel Stoping
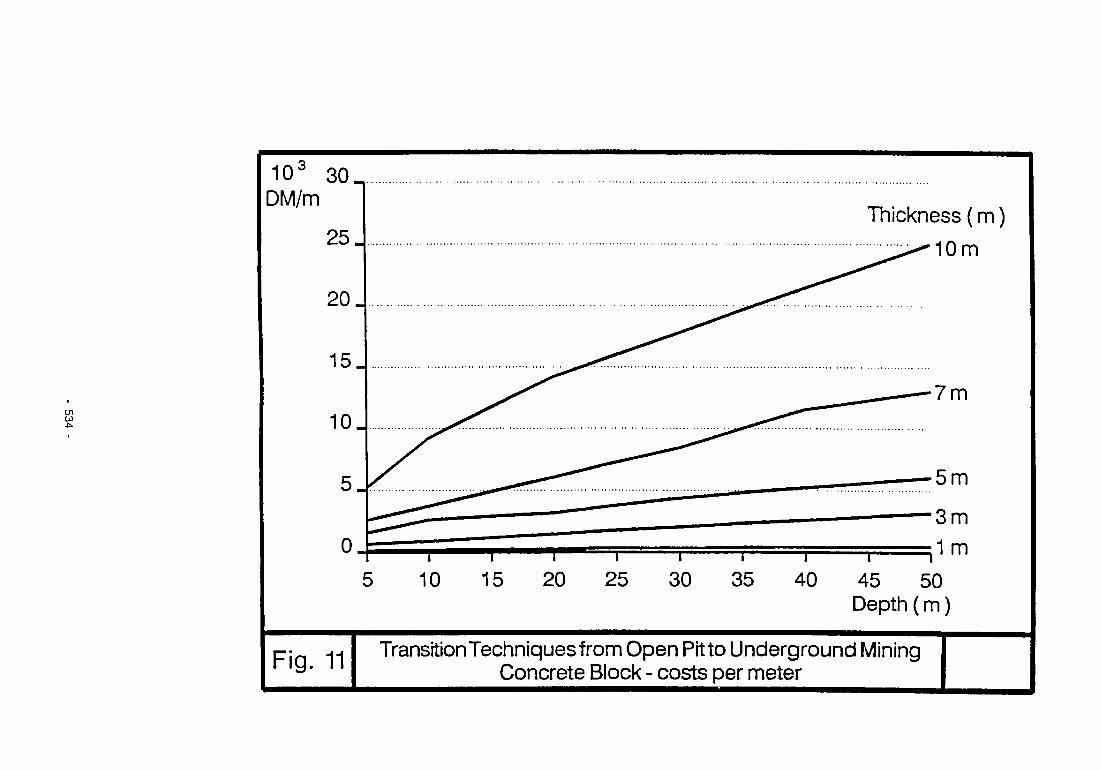
CO
103 30^ DM/m
Thickness (m) 10m
i 1 45 50 Depth (m)
Fig. 11 Transition Techniques from Open Pit to Underground Mining Concrete Block - costs per meter
REALIZATION OF AN EXPERT SOFTWARE PROTOTYPE ON A MICRO-COMPUTER FOR THE OPTIMISATION
OF SMALL SCALE MINING
P r o j e c t l e a d e r : C. SURGET Geosum, Nancy, France
H. Borensztejn Cesmat, Paris, France
P.R. Oyanguren Universidad Politecnica de Madrid, Escuela Tecnica Superior
de Ingeniosos de Minas (ETSIM), Spain
Contract MA1M-0056-C
1. OBJECTIVE OF THE PROJECT If computerisation has reached all large companies, it is having more difficulty in penetrating Into smaller companies. This Is due to the investment costs and training involved. These factors represent more important constraints on smaIler companies than on the larger ones.
Furthermore If the same administrative software can be used by all companies namely for accountancy, management, invoicing; the software relating to the more technical problems relating to a mining concern have yet to be found.
This project has been developed with the aim of finding a solution to the technical problem related to a small scale mining. This work must provide technical assistance to the engineer and reduce the time required to carry out the various tasks which he must perform regularly.
2. STATE OF THE WORKS This project was divided Into two sections, namely:
1 - a general mining section. This corresponds mainly in the identification of a target which In turn determines the software basis and allows further development of a prototype from a model.
2 - a computer section. This consists of creating the data and the realization of the prototype Itself.
- 535

These two operations occur in a chronological order. The bulk of the first section represents the results of the work carried out by the Mining School of Madrid (Universldad politecnica) and CESMAT. The second section is the main work of GEOSUM company. After consultation, we have agreed the choice of a reference mine which Is located in Spain. A small lead mine in Andalouse was chosen. It Is called the CRUZ mine and is located 6 Km to the North of the town of LINARES In the Sierra Morena Plateau. A site visit has proven that this small mine Is of interest for three important reasons :
FirstIy. It Is an underground working in a sub-vertical lode of galene. This lode Is worked by chambers of approximately 60 metres long with an average height of 35 metres. In the first stage, the entire chamber Is pulled down, starting from the lowest to the highest level. During this process, a part of the total is removed from the bottom In order to compensate for the expansion of the ore, which is about 40 % . The complete emptying of the chamber Is done later on, after a waiting period which could be up to several months. This method of working which Is simple and classical in this region, is a good choice, In view of its adaptability to other mines. Secondly. the sma I I size of the mine which employs a total of 205 people of whom 87 work underground. This allows the Director of the mine to have total control of the operation and noteably the control of the various departments and workings. This gives him free choice In operation and exploration coordination. This centralisation of data allows a clear viewpoint of the entire operation and makes possible the management of different parameters. Thirdly. the mine has at Its disposal important records which have been consulted with the full agreement of the Director, who has shown himself to be favourably disposed to the project.
The initial work on this project has consisted of gathering all the available data In the archives of the mine. According to this data, a deep area situated to the North of the shaft one has been defined, encompassing 5 levels of a height of 140 metres end a length of 500 metres. This zone has been completely surveyed by galleries, and Is actually being worked In the two upper galleries.
- 536

The data has been classified In several files, with noteabIy:
- a data file of the galleries ; - a data file of the chambers already worked.
The main file employed for the software, use the gallery data. In this file, a sample Is located by the coordinates In the plan of the lode :
- marked Z for the depth ; - marked X for the distance between a point an the
reference shaft. It Is caracterlsed by the following parameters :
- E - Thickness of the lode at the sample point ; - P - Reduced potential.
This last parameter Is the main element used for the exploration of the lode. It represents the total combined thickness of veins of galene at the sample point and Is expressed In centimetres.
It should be noted that this parameter I.E. the reduced potential Is the only truly geological data used for the exploration and that this reduced potential cannot be measured until after the hewing of the gallery In the lode has taken place.
Actually, It Is the mine engineer who decides the zones and evaluates the location of the chambers, from the reduced potential graphs.
A calculation based on the data from the upper and lower galleries confirms the choice of the hypothetical chamber, with an estimated volume grade ore.
The processing of these calculations must therefore allow :
- Automation of the estimation of the chambers ;
- to make the best choice regarding the zones for exploitation (working) ;
- to carry out a sorting and prioritization of the chambers for working ;
- to obtain almost Immediately the reserves of the m I ne;
- to make Increased savings In time for mine engIneers.
537

The software we have created, functions on the model of this mine from the available data. This available data has been rearranged and formatted In a file called "Primary file". This primary file contains : X-CoordInate: namely the distance In length between the
point and the hoisting shaft; Z-CoordInate: depth in metre of the sample; P-Reduced potential; E-Thlckness of the lode; (A)- Indication of status of this point : being worked, not
yet worked, nonworkable. There is also a second file, this second file contains the data relative to the chamber. A chamber Is considered to be a rectangle of coordinates X1, X2, Z1, Z2 for which different parameters have been calculated.
- Average reduced potential ; - Average thickness of the lode ; - Average grade ore ; - Ore volume ; - Ore tonnage ; - Tonnage of galene ; - Index of the status (parameters defining chamber
state) -already worked ; -being worked ; -In reserve ; -not workable.
The software Is composed of several Independent modules. The following Is the flow diagram.
2.1. DATA ENTRY This module gives direct access to the primary file In order to add, modify or delete parameters or data.
2.2 DATA CONSULTATION MODULE This module Is to be consulted frequently. It simply allows viewing of the different flies either for checking or for work Ing.
- Primary file : Control of the data base. - Secondary file : Consultation of the parameters of each chamber.
538

- Tertiary file : Viewing of the classification of the chambers and the reserves (volume, tonnage, content, etc. . . ) .
2.3 CHAMBER CALCULATION MODULE
This module works from primary data . It can do three th I ngs.
Firstly, It can calculate the volume, tonnage and content parameters of a chamber, from only the data of the exploration galleries.
Secondly, It can define the best extension and the best location for a chamber In a fixed gallery and for a fIxed grade ore.
It can calculate more precisely the volume, tonnage and content parameters of a chamber which has been hewn and for which there Is available complimentary data.
2.3.1 Part one
Part one is the calculation of parameter of a chamber. It Is a simple Interpolation carried out starting with the primary file data.
The calculation of the varlogrammes of different galleries has shown that It has a range of 30 metres. The minimum dimension of a chamber Is 40 metres, it Is therefore possible to use the average reduced potential of the upper and lower galleries.
Otherwise, the use of a krlegange will be necessary If It is required to adapt these calculations for another mine. For this part one, It Is required to make available the coordinates X1, X2, Z1, Z2 of the chamber.
2.3.2 Part two
Part two determines the distance and the position of < chamber.
This part utI I Ises :
- part one of the calculation ; - a decision maker which countains the constraints of
the work Ing.
539
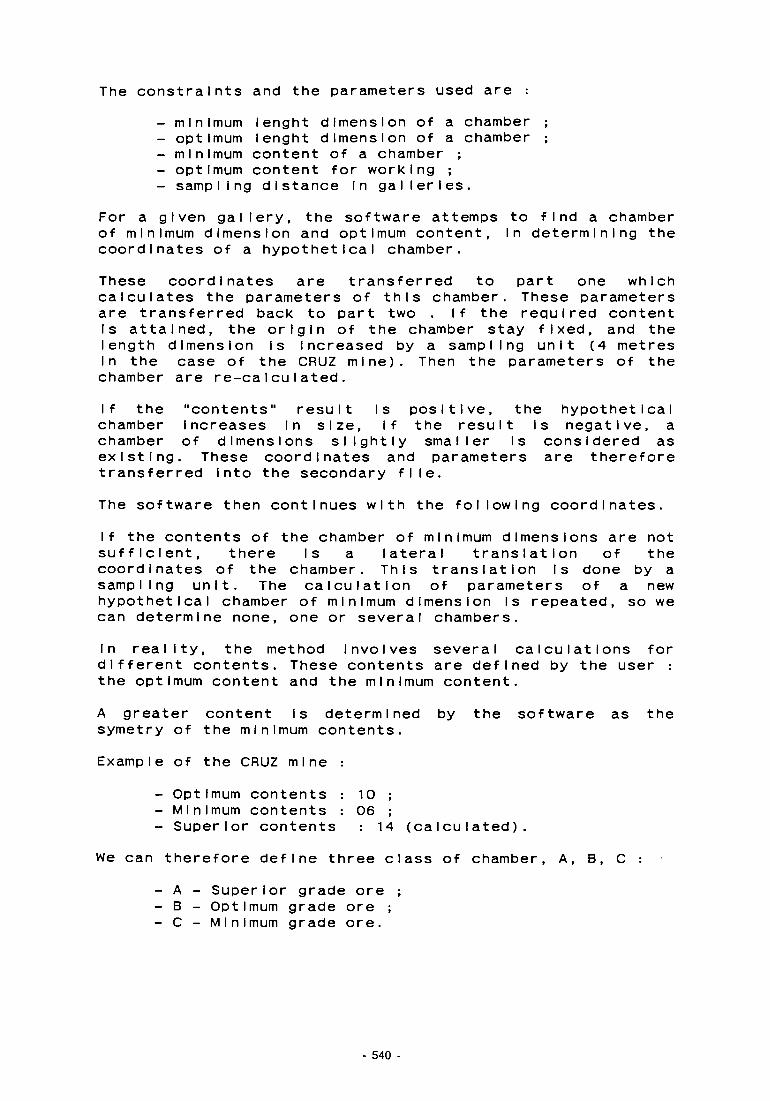
The constraints and the parameters used are : - minimum lenght dimension of a chamber ; - optimum lenght dimension of a chamber ; - minimum content of a chamber ; - optimum content for working ; - sampling distance In galleries.
For a given gallery, the software attemps to find a chamber of minimum dimension and optimum content, In determining the coordinates of a hypothetical chamber. These coordinates are transferred to part one which calculates the parameters of this chamber. These parameters are transferred back to part two . If the required content Is attained, the origin of the chamber stay fixed, and the length dimension is Increased by a sampling unit (4 metres In the case of the CRUZ mine). Then the parameters of the chamber are re-calculated. If the "contents" result is positive, the hypothetical chamber increases in size, if the result is negative, a chamber of dimensions slightly smaller Is considered as existing. These coordinates and parameters are therefore transferred Into the secondary file. The software then continues with the following coordinates. If the contents of the chamber of minimum dimensions are not sufficient, there Is a lateral translation of the coordinates of the chamber. This translation Is done by a sampling unit. The calculation of parameters of a new hypothetical chamber of minimum dimension Is repeated, so we can determine none, one or several chambers. In reality, the method Involves several calculations for different contents. These contents are defined by the user the optimum content and the minimum content. A greater content is determined by the software as the symetry of the minimum contents. Example of the CRUZ mine :
- Optimum contents : 10 ; - Minimum contents : 06 ; - Superior contents : 14 (calculated).
We can therefore define three class of chamber, A, B, C : - A - Superior grade ore ; - B - Optimum grade ore ; - C - Minimum grade ore.
540

In the case of the absence of a chamber greater than 60 metres long, a calculation of a half chamber In the vertical direction Is proposed.
2.3.3 Part three Lastly, the part three of this module Is Independent of the two precedents. It carries out a more precise calculation of volume, tonnage and contents parameters of a chamber, and uses the complementary data obtained during the hewing of a chamber. This part allows a more precise estimation of chambers which are being worked. The calculated parameters are simultaneously stored In the secondary files.
2.4 CHAMBERS PRIORITIZATION The last software module establishes a classification of chambers considered to be in reserve and which have not yet been exploited. The essential constraints depend of the method of working, and more particularly, the position of the workable chambers. The rules permitting the choice and classification of chambers are etabllshed on the bases of the following principal constraints :
- Superior chamber already worked ; - Superior chamber non-workable ; - Lateral chamber already worked ; - Lateral chamber in reserve ; - Lateral chamber non-workable.
Secondary constraints exist in establishing the order of working the chambers :
- Successive chambers, In different galleries ; - succeslve chambers of different contents - Grade ore classification (A, B, C).
Of course, each of these constraints have been expressed by several rules. In the expertise, all the rules have been written In natural language with the aid of an expert system called Intelligent Service II, written by the GSI-TECS I Company (version 2.1). This system uses an Inference motor of 0 + order and it Is re-In111 a I Ised after the closing of each chamber, each being then indexed In ascending order.
541

3. CONCLUSION The created software Is a prototype based on the Cruz mine model but we have tried to Introduce the greatest number of variables. In this way, the sofware uses different and Independent modules which can be easily modified individually On the other hand, the multiplicity of Independent modules Implies the use of Intermediate files which slow down the procedure, and increase the execution time. For instance, the Inference motor of the expert system only accepts up to 20 parameters maximum as variables, In the Input and output, which limits the work and requires frequent exits from the expert system procedures. This modular system drives the software slowly, but must allow changing certain parts without modification of the structure. This can be the case of the parts dedicated to the calculation of reserves, but also and more Importantly of the rules of the expert system. For the moment, this software allows to optimize the exploitation of the mine through the calculation of the reserves, the choice and the prioritization of the different exploitable chambers in the lode. The Integration of a module concerning the pI an IfI cat I on time must allow to give the time of exploitation and to optimize the efficiency. About the price of such a software, three parts can be defIned : - Consultant expert module (GSI royalties) 1200 US$ - Calculation and connection between modules 800 US$ - Adjustement to the mine: (from 2000 US$ to) 6000 US$
Estimated global cost : 8000 US$ For that kind of sofware, a global cost equivalent to the price of a microcomputer with Its peripherals seems to be a reasonable Investment for a small scale mining. AJustment to the model of the mine Is the most Important part of this software. According to mining method, extension of the works, numbers of constraint., the cost of this part could be more or less higher. In fact, the main problem for such a software, Is to know the different parameters It must Include and until what step It can work. Integration of numerous variables cannot give simple software and ends to heavy, hard one. That does not go In the way of help and simplification of the work of the mining engIneers.
- 542
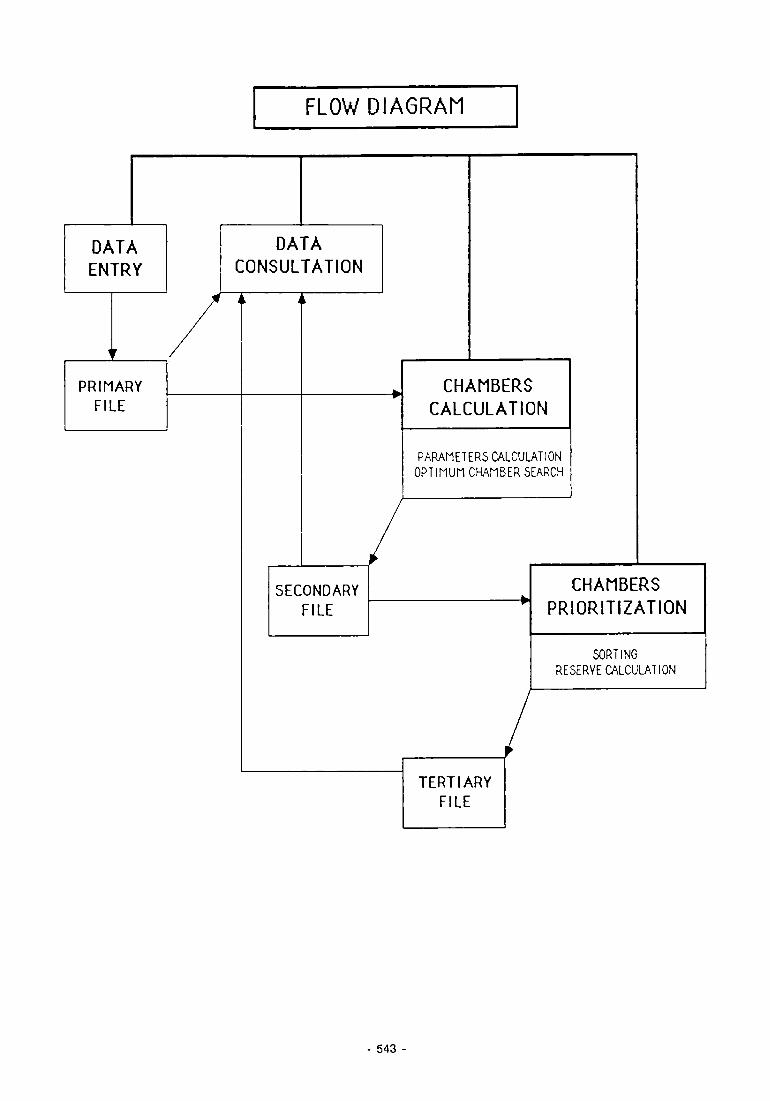
FLOW DIAGRAM
DATA ENTRY
DATA CONSULTATION
PRIMARY FILE
CHAMBERS CALCULATION
PARAMETERS CALCULATION OPTIMUM CHAMBER SEARCH
SECONDARY FILE
CHAMBERS PRIORITIZATION
SORTING RESERYE CALCULATION
TERTIARY FILE
543 -

VUHAT EQUIPMENT TO DEVELOP FOR EUROPEAN SMALL SCALE MINES ? STATE OF THE ART. PROPOSAL
AND STUDY OF THE MICRO-JUMBO
P r o j e c t Leader : N. CHEIMANOFF Paris School of Mines, Centre de Glotechnique et d'Exploration du Sous-sol (CGES), France
Talco e Grafite Val Chisone S.p.A. (TEG) , Italy
Equipement Minier S.A., (EM), France
Contract MA1M-0065-C(CD)
1. INTRODUCTION Even when interest for small scale mining has become obvious for more than ten years, it has appeared that no serious study has been made yet on the european sma I I scale mines equipments. This project then developed first an analysis of the european small mines (considered from the exclusive point of view of sma I I underground stopes of 2 meters or less width), and then focused on the specific equipments which are available at the present time. Demand has to be identified thanks to an enquiry done amongst the european small mines. We tryed to answer to the following questions :
- What kind of mining equipments could be useful or necessary ?
- With what kind of characteristics ? - What performances are really expected ? - What could be the prices of such equipments ?
At the same time, this demand had to be compared with the supply which Is or will be offered soon by equipments manufacturers or on the second hand market. The comparison of both aspects should issue in the development of a new equipment we I I adapted for smaI I underground mines. Anticipating the main results, this new machine appears to be a multipurpose machine which can be described as a micro-carrier with various possibilities of drilling, bolting, scaling, etc...
545

The scope of this study Justifies the composition of the project team : two research centers (CGES and CESMAT), a mining equipments manufacturer (EM) and a mining company (TEG), for conception, design and tests of the new machine. As precised In the technical annex of the CCE Contract, this project has been structured around three tasks The first task Is dedicated to an analysis of small mine equipment. More precisely, we present data obtained on european small scale mining, including Information on geology, mining technics, equipment characteristics, suppliers (part A.1). We then analyse the equipment currently supp I led; that is to say we estab I I sh a kind of state of the art for small mine equipment (part A.2). Finally, we evaluate the needs for specific equipments for small scale mines (part A.3). The second task Is aimed at the study of the structure of the market of equipment, with a special reference to the relationships between suppliers and mining companies and to the second-hand market (part B). The last task concerns the proposal and study of a new multipurpose machine, the Micro-Jumbo (for drilling, bolting, scaling, etc...). In part C.1, we analyse the past difficulties (positive and negative elements of the existing vast Ing devices). In part C.2, we give the technical specification of the micro-Jumbo (referring to the previous analysis and to the results of the two first tasks). We then propose a set of engineering results and tests of the future micro-Jumbo (part C.3). We conclude this project with a first economical analysis of the future market for the micro-Jumbo (part C.4).
PART A : ANALYSIS OF SMALL MINES EQUIPMENT A.1 THE EUROPEAN SMALL SCALE MINES This study has been centred around the european medlteranean small scale mines, with some Interest In Ireland. A special reference has been made upon the Fontane talc mine in Italy, the La Cruz galena mine in Spain, and the Baryt I ne de Challlac mine in France. Different visits of mines and the analysis of monographs, showed us that the constitution of a strong and efficient database supposed a well organized information support. This lead us to create a specific questionnaire that has been sent to a large amount of European sma I I scale mines. More precisely, for each mine, we tried to get information about:
the general structure of the company (visiting card, geographical access constraints, structure of the capital, staff, energy, origin and maintenance of general equipments, etc...);
546
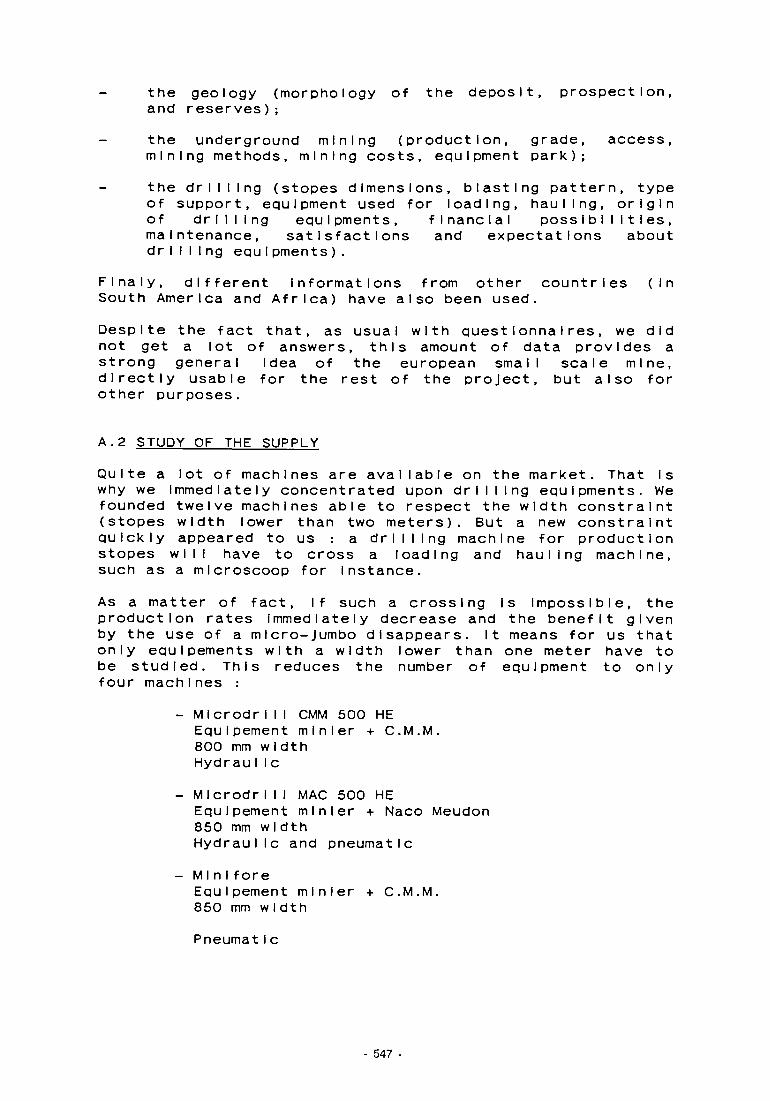
the geology (morphology of the deposit, prospect Ion, and reserves);
- the underground mining (production, grade, access, mining methods, mining costs, equipment park); the drilling (stopes dimensions, blasting pattern, type of support, equipment used for loading, hauling, origin of drilling equipments, financial possibilities, maintenance, satisfactions and expectations about drilling equipments).
Flnaly, different informations from other countries (In South America and Africa) have also been used. Despite the fact that, as usual with questionnaires, we did not get a lot of answers, this amount of data provides a strong general Idea of the european small scale mine, directly usable for the rest of the project, but also for other purposes.
A.2 STUDY OF THE SUPPLY Quite a lot of machines are avallable on the market. That Is why we Immediately concentrated upon drilling equipments. We founded twelve machines able to respect the width constraint (stopes width lower than two meters). But a new constraint quickly appeared to us a drilling machine for production stopes will have to cross a loading and hauling machine, such as a mlcroscoop for instance. As a matter of fact, If such a crossing is Impossible, the production rates Immediately decrease and the benefit given by the use of a micro-Jumbo disappears. It means for us that only equlpements with a width lower than one meter have to be studied. This reduces the number of equipment to only four machines :
- MIcrodrI I I CMM 500 HE Equlpement minier + C.M.M. 800 mm width Hydrau I Ic
- Microdrill MAC 500 HE Equlpement minier + Naco Meudon 850 mm width Hydraulic and pneumatic
- M i n i fore Equlpement minier + C.M.M. 850 mm width
Pneumat i c
- 547

- CTM 10.2F Elmco Secoma 1000 mm width HydrauI Ic
Moreover, during the study of these equipments, the following points have been outlined :
- Equipment costs rise with width and/or hydraulic use.
- Pneumatic, quite cheep, supposes a very heavy Infrastructure, and thus Is not a good solution.
- Electrical drilling, thus attractive, Is not a good solution also, on the technical point of v I ew.
- The B.R.H. (hydraulic rock breaking) and the mechanized scaling are not very frequent underground.
- Pneumatic motorization Induces heavy costs (due to the importance of the Infrastructures then needed and to Its bad productivity).
A.3 STUDY OF THE NEEDS After the different visits above mentlonned, It appears that: - The search for selectivity, common to all sma I I scale
mines, denies some mining methods (skrlnkage, etc...). A selective mining, such as cut and fill, supposes smaller stopes and access and thus smaller equipments. The example of the mlcroscoop Is significant, Increasing production (the use of two mlcroscoops Increased the production In the Fontane mine - Italy -by 2.5) and/or grade of the run-of- mine (La Cruz mine - Spa In - ) . Another problem with selective mining methods and small stopes Is the common necessity of roof support (often very expensive). There Is then a clear need for new small equipment, such as the micro-Jumbo, in order to imagine bolting and scaling together with small stopes and access (this problem Is particularly accurate in the Fontane mine - Italy - ) . In some more particular cases, some mechanical mining In sma I I stopes Is necessary. It Is the case for the small scale mines In Ireland, where the use of explosives Is highly controlled. The example of the Fontane mine, where some mechanical breaking tests have
548

been made (see part C.3), Is also s I gn I f I cant ,mainIy because the geotechnical behavior of a material such as the talc Is obviously perfectly adapted to this method. Flnaly, due to the general cost structures, the small scale mines have to respect "small scales" for almost each of their functions (Barytlne de Cha I I I ac France). As we will see further part dedicated to the structure of the market analysis, small scale mines cannot afford tremendous Investments without good prospects. The need for equipment of low price is then obvious.
PART B : STRUCTURE OF THE MARKET The two fields of Interest for us were on one side the relationships between the mining companies and the manufacturers, and on the other side the state of the second-hand market. Concerning the relationships between mining companies and manufacturers, some principles and constraints have been clearly put Into light
The PRICE of a new equipment should not exceed about 400 000 FF (around 66 000 US$); the main reason for this being that such a new equipment would have to be very quickly beneficial. The new equipment has to be RELIABLE. As a matter of fact, the small scale mines very often saturate their equipment, that Is to say that most of them are used more than reasonnable. Moreover, as, usually, the park Is not very Important, an equipment out of work Induces Important problems and the MAINTENANCE has to be performed correctly (because small scale mines do not have their own maintenance service) ; The sma I I scale miners are very CONSERVATIVE ; as previously said, they are not able to financially support the cost of a mistake In the choice of a new manufacturer. Moreover, the staff training on new machines and concepts supposes Important delays that the mine often cannot afford.
- The QUALITY of the equipment Is very Important. Here again, as their size Is not important, the quality of their production Is a constant objective. To this peculiar point of view, the example of the Fontane mine Is significant. Tremendous efforts are made in this mine In order to protect the talc quality (from the oil of the mlcroscoops hydraulic systems for Instance).
549

Concerning the second-hand market, it appears that the main contacts are made with the professional revues and the manufacturers. The congress and exhibition participation Is low. Due to the conservative approach above mentlonned, the equipments are systematIcaIy replaced by equipments of the same company. Finaly, the choice and availability of secondhand equipments Is quite easy. The conclusions are that this market Is going well by Its own, without need for any particular structuratI on, and that the different informations must be given by the way of professional revues.
PART C : PROPOSAL AND STUDY OF THE MICRO-JUMBO C.1 THE PAST DIFFICULTIES
At the same time, different manufacturers, such as Elmco Secoma with the CTH 10.2F, followed the same way. It Is from the analysis of these existing equipments and of old experiences for new equipments that we concluded that the main difficulty is linked with the carrier module. As a matter of fact, the carrier module Is commonly complex and expensive. If our objective Is to build an equipment whose price is lower than 450 000 FF, this constatatlon condamns the solution of a classical carrier (mlcroscoop for instance) together with a drilling module, either hydraulic, or pneumatIc. Moreover, we realized that the "carrier function" of a mlcro-jumbo does not have to be as sophisticated as for a loading and hauling equipment for instance. This function, which Is the main one for the mlcroscoop, must not be over dimenslonned in the case of a drilling, bolting, scaling, or mechanical breaking equipment. The obvious conclusion of such an analysis Is then that it Is Important to look for a "cheep" carrier, with the minimum viable properties, and, separately, for some different drilling, scaling, mechanical breaking and/or bolting moduIe.
550

C.2 SPECIFICATION OF THE MICRO-JUMBO
The comparison between demand and supply led us to establish the preliminary specifications of a micro-jumbo and multipurpose machine :
- PRICE : lower than 450 000 FF No drilling machine exists for the moment in that range of prices which corresponds more or less to the higher prices small miners would accept to pay for that kind of equipment.
- WIDTH : below 1 meter A mlcroscoop and a micro-Jumbo must be able to cross each other in a stope with a smaI I section. The width could then be of 0.85 meters.
- TOOLS : hydraulic hammer (drilling and bolting), B.R.H. (mechanized mining), and scaling.
MOTORIZATION : electric Diesel could be possible, but as at least 30 kW is needed for drilling, this would Induce dimensions and heat problems.
The result of the specification studies guides us towards the first project described on the figure here after, able to account for vertical drilling and bolting, horizontal drilling, and scaIing.
C.3 CONCEPTION AND TEST OF THE MICRO-JUMBO
C.3.1 Design
We quickly decided to carry on three different versions for the micro-Jumbo, one for the vertical drilling and bolting, one for horizontal drilling, and one for scaling, in order to have a simple carrier together with well-adapted modules.
EquIpement Minier carried on the conception of the carrier and the feeder. Contacts with different european manufacturers have been made. The Boart U.K. Society has been chosen for the boom and the hammer (see also fig. 1).
All the different engineering design have been realized and led us to a micro-Jumbo which main characteristics are, for the carrier : ( see also fig. 2)
- electrical engine 30 kW, 2 speeds - width = 0.85 meters - gravity center = 0.50 meters
551

- length = 2.11 meters - speed = 2.7 km/h - tensll force = 2100 kg - total weight (with drilling module) = 2.5. tonnes - hydraulic capacity = 150 litres of oil - mechanical stabilisation - cooler = 40 kW
and for the drilling module : (see also fig. 3) - hammer (HD 65 rotary or percussion) - hammer speed = 1.5. meters/mn - hammer energy = 170 Joules - hammer frequency = 50 to 65 hits / second - weight (boom, feeder and hammer) = 775 kg - pump for tools = Volvo
Equivalent characteristics have been set for the two other moduIes. This machine has also been designed with some easy-drive constraints that are respected because of aspecific wheel control system associated with a very compact shape. The result of these design appears on the following picture showing (up) the carrier module, and (down) the roof drI I I Ing module of the micro-Jumbo.
C.3.2 Tests While the engineering study of the mlco-Jumbo was led, different test have been made in the Fontane mine (TEG). These tests mainly concern the future possible mechanical breaking of the talc with a micro-Jumbo, and the production rate prevision with both the micro-Jumbo and the mlcroscoop. More precisely, a special gallery has been developped In the gneiss footwaII, In conditions similar to those of an Industrial use of the micro-Jumbo, that Is to say with dimensions of two meters width and two and a half meters high, and on thirty meters length. Such a mining work allows good production tests regarded to the micro-Jumbo and the mlcroscoop crossing for Instance. On the same way, different mechanized mining tests have been led In order to prepare the use of micro-Jumbo for production of ore (with B.R.H. or breaking bars). For these tests, an hydraulic hammer ( INDEGO MES 181) of 85 kg has been used, with both 48 mm diameter pastilles and 100 mm large blade. The pressure given on the tools was of 100 bars. The results were significant. Moreover, they proove, first that the use of a blade is correct in the talc, that no falling blocks appeared, and mainly that an extensive arm would be needed on the mlcrojumbo, in order to stay In contact with the rock.
552

C.4 ECONOMICAL ANALYSIS AND CONCLUSIONS
The results obtained In this research work can be of a great Importance for a small scale mine such as the Fontane mine. In this case such an equipment Is there usable (which Is not obvious In this mine because of hauling problems), the need for bolting (with the new cut and fill method) would be satisfied by the micro-Jumbo. Simple calculations, based on the mlcoscoop experience, show that the productivity would be equivalent, but with much smaller stopes, that is to say with much higher selectivity.
On an other side, It is sure that the security would be higher In conditions using the mlcrojumbo, but obviously such a parameter Is Impossible to predict !
Flnaly, and although the micro-Jumbo Is only a prototype, and has not been tested in real mining conditions, It appears that such an equipment has a good possible economical market, since different small scale mines are still Interested in using such a device.
A first economical analysis of the Industrial building costs showed that It was possible to significantly reduce the cost of each module. Compared for Instance to the Microdrill (which costs about 750 000 FF), it is possible to lower the price to 440 000 FF, gaining mainly on the carrier price and on the boom. A final price of 440 000 FF (about 65 000 Ecus) is quite attractive for potential "customers".
- 553 -

REFERENCES
C. BOUDREAU (1983): "Les petites mines : Int6ret et conditions de developpement", these de Docteur - Ingenleur de I'ENSMP, ENSMP/CGES ed., FontainebIeau (FRANCE), JuIn 1983.
F. BURGER et C. LUCER (1984): "Vers une definition des pet Ites mines", Option de I ' ENSMP, CESMAT et ENSMP/CGES ed . , FontainebIeau (FRANCE), JuiIlet 1984.
R. CALDERON (1983): "Amelioration de la selectiv reserves par I 'utiIIsation du Journal, pp. 36-43, Juln 1983.
te et accroIssement des Mlcroscoop", World Mining
E. DELIAC (1986): "Presentation à I'Association Francalse pour le Developpement des Pet Ites Mines", Congres de I 'Industrie Mlnerale (Toulouse), SIM ed., Paris (FRANCE), Mars 1986.
E. DELIAC et J-C SAMAMA (1983) "Les petltes mines ; enjeu Important pour I'lndustrle Mlnerale, octobre 1983.
une specificite la cooperation et pp. 577-583, SIM
Internationale ; un le developpement de ed. , Par Is (FRANCE)
S. EVEN (1989): "Adaptation d'une mine", Opt ion de JuI I let 1989.
exploitation selective dans une petite I'ENSMP, CESMAT ed., Paris (FRANCE),
F. GARNAUD (1986): "Facteurs de reusslte et de reproductIbIIite d'une petite mine a partlr de I 'experience de KALIMBI (ZaTre)", Diplome d'Etude Approfondie de I 'ENSMP, ENSMP/CGES ed. , FontaI nebleau (FRANCE), septembre 1986.
V. GUELFUCCI et J.P. MUSTIER (1986): "Les idees recentes avec la petite mine rendent-eI Ies vraisemblab Ie la reactivation du district a antimoine de Brioude-Masslac (Auvergne) ?", option de I 'ENSMP, CESMAT et ENSMP/CGES ed., FontaI neb Ieau (FRANCE), Jul I let 1986.
0. JOUY ( 1988) : "Conception du OPT/TEM 88/9, JuiIlet 1988.
porteur d'un mIcro-Jumbo", Option de I'ENSMP, ENSMP/CGES ed . , FontaInebIeau (FRANCE),
B.E. ROBERTSON (1986): "The mechanization of narrow vein mining at Mining magazine, pp 308-317, octobre 1986.
the Dome mine'
554 -

en en
FIRST PROTOTYPE OF THE MICRO-JUMBO FIG. 1

THE MICRO-JUMBO CARRIER
FIG. 2
l̂ eo ie«rvKN6
THE MICRO-JUMBO D R I L L I N G MODULE
FIG. 3 - 556 -


European Communities - Commission
EUR 13647 — Summary reports of the R&D programme : Primary raw materials (1986-89) Volume II
Edited by M. Donato
Luxembourg: Office for Official Publications of the European Communities
1992 - VIII, 256 pp., 4 tab., 84 fig. - 21.0 x 29.7 cm
Resources series
ISBN 92-826-3795-6
Price (excluding VAT) in Luxembourg: ECU 25.50
This document contains the summary reports of cost-sharing R&D contracts funded under the Primary raw materials subprogramme of the Commission of the European Communities. This was part of the R&D programme on raw materials and advanced materials (1986-89).
The main objectives of the Primary raw materials subprogramme were to enhance the competitiveness of the European Community mining and metallurgical industries and to reduce European Community vulnerability for minerals, particularly those of critical or strategic interest.
This was funded with ECU 20 million for the period 1986 to 1989 of which ECU 17 million was allocated to research contracts. The balance was allocated to the management of the programme (staff, organization of contact group meetings, expert meetings, international cooperation and other costs).
The subprogramme comprised three research areas: 1. Research and development exploration Economic geology, methods of geochemical and geophysical prospecting, remote sensing. 2. Mining technology Rock fracturing, rock mechanics, support systems, problems associated with depth, robotics, methods of modelling and simulation, problems of small-size mines. 3. Mineral processing Hydrometallurgy of complex sulphide ores, oxidized ores, refractory ores, mine tailings and metallurgical residues; modelling and control in mineral processing; industrial minerals.
Iron, fossil fuels and building materials were excluded from the programme.

Venta y suscripciones • Salg og abonnement * Verkauf und Abonnement * Πωλήσεις καΙ ΣΥνδρομές Sales and subscriptions • Vente et abonnements • Vendita e abbonamenti
Verkoop en abonnementen * Venda e assinaturas
BELGIQUE / BELGIE FRANCE OSTERREICH CYPRUS
Moniteur beige / Belgisch Staatsblad Rue de Louvain 42 / Leuvenseweg 42 1000 Bruxel les/ 1000 Brussel Tel. (02) 512 00 26 Fax 511 01 84 CCP / Postrekening 000-2005502-27
Autres distr ibutees / Overige verkooppunten Librairie europeenne/ Europese Boekhandel Avenue Albert Jonnart 50 / Albert Jonnartlaan 50 1200 Bruxelles / 1200 Brussel Tel (02) 734 02 81 Fax 735 08 60
Jean De Lannoy Avenue du Roi 202 /Koningslaan 202 1060 Bruxelles / 1060 Brussel Tel. (02) 538 51 69 Telex 63220 UNBOOK B Fax (02) 538 08 41
CREDOC Rue de la Montagne 34 / Bergstraat 34 Bte 11 / Bus 11 1000 Bruxelles / 1000 Brussel
DANMARK
J. H. Schultz Information A/S EF-Publikationer Ottiliavej 18 2500 Valby Tlf. 36 44 22 66 Fax 36 44 01 41 Girokonto 6 00 08 86
BR DEUTSCHLAND
Bundesanzeiger Verlag Breite StraRe Postfach 10 80 06 5000 Kbln 1 Tel. (02 21) 20 29-0 Telex ANZEIGER BONN 8 882 595 Fax 20 29 278
GREECE/EAAAAA
G.C. Eleftheroudakis SA International Bookstore Nikis Street 4 10563 Athens Tel. (01) 322 63 23 Telex 219410 ELEF Fax 323 98 21
Journal official Service des publications des Communautes europeennes 26. rue Desaix 75727 Paris Cedex 15 Tel. (1) 40 58 75 00 Fax (1) 40 58 75 74
IRELAND
Government Supplies Agency 4-5 Harcourt Road Dublin 2 Tel. (1) 61 31 11 Fax (1) 78 06 45
ITALIA
Licosa Spa Via Duca di Calabria. 1/1 Casella postale 552 50125 Firenze Tel. (055) 64 54 1 5 Fax 64 12 57 Telex 570466 LICOSA I CCP 343 509
GRAND-DUCHE DE LUXEMBOURG
Messageries Paul Kraus 11. rue Christophe Plantin 2339 Luxembourg Tel. 499 88 88 Telex 2515 Fax 499 88 84 44 CCP 49242-63
NEDERLAND
SDU Overheids in format ie Externe Fondsen Postbus 20014 2500 EA 's-Gravenhage Tel. (070) 37 89 91 1 Fax (070) 34 75 778
Manz'sche Verlags-und Universitatsbuchhandlung Kohlmarkt 16 1014 Wien Tel. (0222) 531 61-0 Telex 11 25 00 BOX A Fax (0222) 531 61-39
SUOMI
Akateeminen Kirjakauppa Keskuskatu 1 PO Box 128 00101 Helsinki Tel. (0) 121 41 Fax (0) 121 44 41
Narvesen information center Bertrand Narvesens vei 2 PO Box 6125 Etterstad 0602 Oslo 6 Tel. (2) 57 33 00 Telex 79668 NIC N Fax (2) 68 19 01
BTJ Box 200 22100 Lund Tel. (046) 18 00 00 Fax (046) 18 01 25
SCHWEI2 / SUISSE / SVIZZERA
OSEC StampfenbachstraGe 85 8035 Zurich Tel. (01) 365 54 49 Fax (01) 365 54 11
CESKOSLOVENSKO
NIS Havelkova 22 13000 Praha 3 Tel. (02) 235 84 46 Fax 42-2-264775
Cyprus Chamber of Commerce and Industry Chamber Building 38 Grivas Dhigenis Ave 3 Deligiorgis Street PO Box 1455 Nicosia Tel. (2) 449500/462312 Fax (2) 458630
TURKIYE
Pres Gazete Kitap Dergi Pazarlama Dagitim Ticaret ve sanayi AS Narlibahce Sokak N. 15 Istanbul-Cagaloglu Tel. (1) 520 92 96 - 528 55 66 Fax 520 64 57 Telex 23822 DSVO-TR
Renouf Publishing Co. Ltd Mail orders — Head Office: 1294 Algoma Road Ottawa. Ontario K1B 3W8 Tel. (613) 741 43 33 Fax (613) 741 54 39 Telex 0534783
Ottawa Store: 61 Sparks Street Tel. (613) 238 89 85
Toronto Store: 211 Yonge Street Tel. (416) 363 31 71
UNITED STATES OF AMERICA
UNIPUB 4611-F Assembly Drive Lanham, MD 20706-4391 Tel. Toll Free (800) 274 4888 Fax (301) 459 0056
AUSTRALIA
Hunter Publications 58A Gipps Street Coll ingwood Victoria 3066
PORTUGAL
ESPANA
Boletln Oficial del Estado Trafalgar. 27 28010 Madrid Tel. (91) 44 82 135
Mundi-Prensa Llbros, S.A. Castellb. 37 28001 Madrid Tel. (91) 431 33 99 (Libros)
431 32 22 (Suscripciones) 435 36 37 (Direccion)
Telex 49370-MPLI-E Fax (91) 575 39 98
Sucursal: Librerfa Internacional AEDOS Consejo de Ciento. 391 08009 Barcelona Tel. (93) 301 86 15 Fax (93) 317 01 41
Llibreria de la Generalitat de Catalunya Rambla dels Estudis. 118 (Palau Mo|a 08002 Barcelona Tel. (93) 302 68 35
302 64 62 Fax (93) 302 12 99
Imprensa Nacional Casa da Moeda. EP Rua D. Francisco Manuel de Melo. 5 1092 Lisboa Codex Tel. (01) 69 34 14 Distribuidora de Livros Bertrand, Ld." Grupo Bertrand, SA Rua das Terras dos Vales. 4-A Apartado 37 2700 Amadora Codex Tel. (01) 49 59 050 Telex 15798 BERDIS Fax 49 60 255
MAGYARORSZAG
UNITED KINGDOM
HMSO Books (PC 16) HMSO Publications Centre 51 Nine Elms Lane London SW8 5DR Tel. (071) 873 2000 Fax GP3 873 8463 Telex 29 71 138
Euro-lnfo-Servlce Budapest I. Kir. Attila ut 93 1012 Budapest Tel. (1) 56 82 11 Telex (22) 4717 AGINF H-61 Fax (1) 17 59 031
Business Foundation ul. Krucza 38/42 00-512 Warszawa Tel. (22) 21 99 93. 628-28-82 International Fax&Phone
(0-39) 12-00-77
JUGOSLAVIJA
Privredni Vjesnik Bulevar Lenjina 171/XIV 11070 Beograd Tel. (11) 123 23 40
JAPAN
Kinokuniya Company Ltd 17-7 Shinjuku 3-Chome Shinjuku-ku Tokyo 160-91 Tel. (03) 3439-0121
Journal Department PO Box 55 Chitose Tokyo 156 Tel. (03) 3439-0124
AUTRES PAYS OTHER COUNTRIES ANDERE LANDER
Office des publications officielles des Communautes europeennes 2, rue Mercier 2985 Luxembourg Tel. 49 92 81 Telex PUBOF LU 1324 b Fax 48 85 73/48 68 17 CC bancaire BIL 8-109/6003/700
26709
NOTICE TO THE READER
All scientific and technical reports published by the Commission of the European Communities are announced in the monthly periodical 'euro abstracts'. For subscription (1 year: ECU 110) please write to the address below.
n ■ , , ^ WAX* • i K (Volume 2) ECU 25.50 Price (excluding VAT) in Luxembourg: Volumes \_3) E C U 9 0
OFFICE FOR OFFICIAL PUBLICATIONS OF THE EUROPEAN COMMUNITIES
L-2985 Luxembourg