Embed Size (px)
Citation preview
1
PRIMERAS JORNADAS REGIONALES DE ACÚSTICAAdAA 2009 19 y 20 de noviembre de 2009, Rosario, Argentina
AdAA2009-A051R
Noise source identification by beamforming technique
Samir N. Y. Gerges (a) and William D. Fonseca (a)
(a) Laboratory of Noise and Vibration, Mechanical Engineering Department, Federal University of Santa Catarina, Campus Universitário Trindade, Florianópolis, SC, Brazil. Email: [email protected]
Abstract The noise produced by complex systems such as automobiles, airplanes, machines, etc.
contributes to overall noise of an environment. In the way to reduce these levels, the identification of the prominent sources is necessary. In many cases the beamforming technique is capable to carry out this task creating a visual map of the sound source. The goal of this work will be to give a basic understanding of beamforming techniques including software, hardware and to illustrate its wide applicability to common noise control and vibration problems.
Resumo Os ruídos produzidos por sistemas complexos como automóveis, aeronaves, maquinas, etc.
contribuem para o ruído global de um ambiente. De modo a reduzir estes níveis, a identificação das fontes proeminentes se faz necessária. Em muitos casos, a técnica de beamforming é capaz de realizar esta tarefa criando um mapa visual da fonte sonora. Este trabalho objetiva fornecer o entendimento básico sobre a técnica de beamforming, incluindo software, hardware e ilustrando sua ampla aplicação para o controle de ruído.
Primeras Jornadas Regionales de Acústica - AdAA 2009 AdAA2009-A051R
2
1 Introduction Noise generated by consumer products and systems, such as vehicles, airplanes utilities,
etc. have to satisfy government noise limit legislations and also human comfort by the users. Beamforming technique is a powerful tool for noise source identification that can be carried out before a noise control action. In a simple way, as an acoustic imaging technique, Beamforming can “make the sound visible”.
2 Fundamentals of Beamforming
2.1 Time Domain Beamforming Using the time domain beamforming there is a possibility to listen and auralize the data
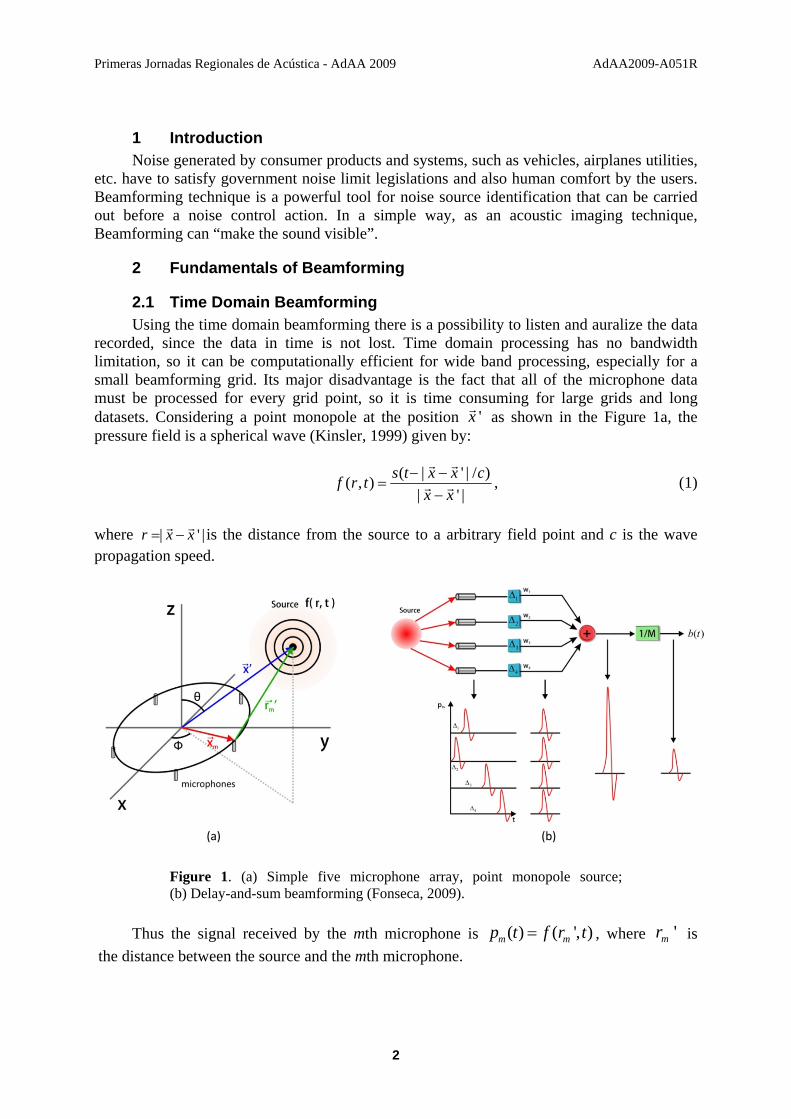
recorded, since the data in time is not lost. Time domain processing has no bandwidth limitation, so it can be computationally efficient for wide band processing, especially for a small beamforming grid. Its major disadvantage is the fact that all of the microphone data must be processed for every grid point, so it is time consuming for large grids and long datasets. Considering a point monopole at the position 'xr as shown in the Figure 1a, the pressure field is a spherical wave (Kinsler, 1999) given by:
( | ' | / )( , )| ' |
s t x x cf r tx x
− −=
−
r r
r r , (1)
where | ' |r x x= −
r r is the distance from the source to a arbitrary field point and c is the wave propagation speed.
Figure 1. (a) Simple five microphone array, point monopole source; (b) Delay-and-sum beamforming (Fonseca, 2009).
Thus the signal received by the mth microphone is ( ) ( ', )m mp t f r t= , where 'mr is
the distance between the source and the mth microphone.
Primeras Jornadas Regionales de Acústica - AdAA 2009 AdAA2009-A051R
3
Considered an array of M microphones whose locations are given by { }, 1,2,...,mx m M=r
, with its center as the origin of coordinates. The classical delay-and-sum beamforming (Johnson and Dudgeon, 1993; Underbrink, 1995) is given by:
1
1( ) ( )M
m m mm
b t w p tM =
= − Δ∑ , (2)
where mw is a weighting, mΔ is the time delay applied to the mth microphone and M is the total of microphones. Setting the time delays equal to the acoustic propagation times produces signal reinforcement as shown in Figure 1b.
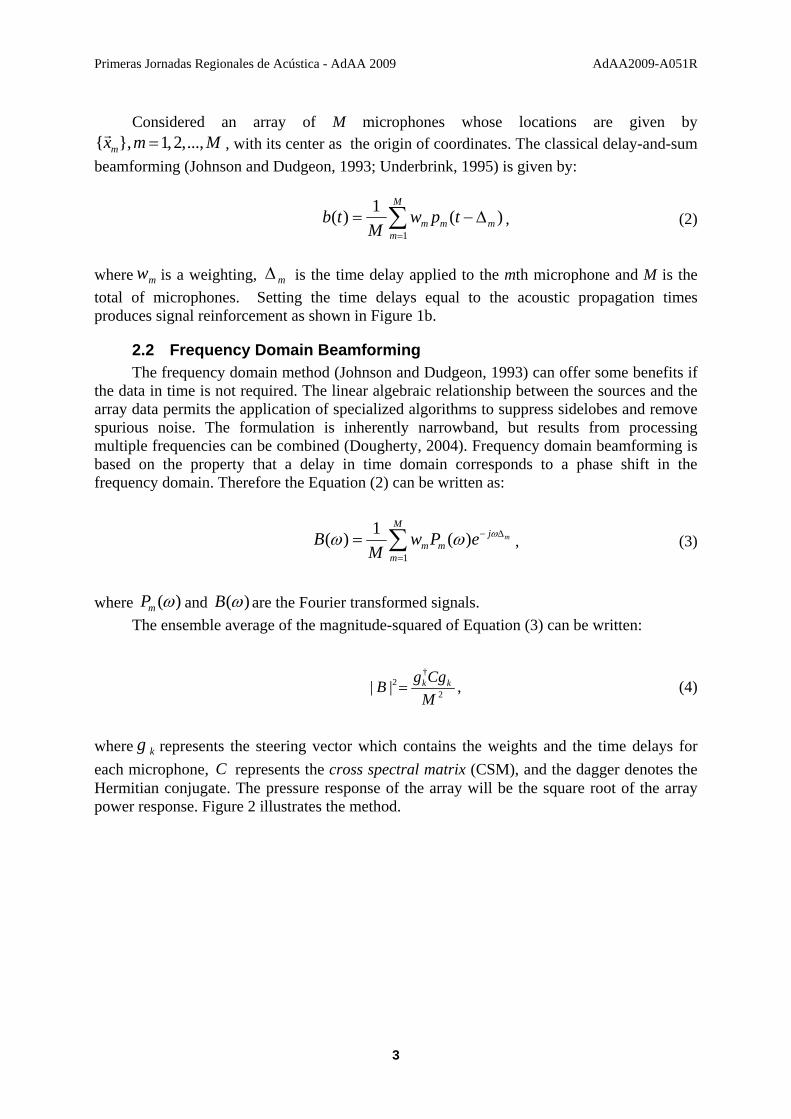
2.2 Frequency Domain Beamforming The frequency domain method (Johnson and Dudgeon, 1993) can offer some benefits if
the data in time is not required. The linear algebraic relationship between the sources and the array data permits the application of specialized algorithms to suppress sidelobes and remove spurious noise. The formulation is inherently narrowband, but results from processing multiple frequencies can be combined (Dougherty, 2004). Frequency domain beamforming is based on the property that a delay in time domain corresponds to a phase shift in the frequency domain. Therefore the Equation (2) can be written as:
1
1( ) ( ) m
Mj
m mm
B w P eM
ωω ω − Δ
=
= ∑ , (3)
where ( )mP ω and ( )B ω are the Fourier transformed signals. The ensemble average of the magnitude-squared of Equation (3) can be written:
†
22| | k kg CgB
M= , (4)
where kg represents the steering vector which contains the weights and the time delays for each microphone, C represents the cross spectral matrix (CSM), and the dagger denotes the Hermitian conjugate. The pressure response of the array will be the square root of the array power response. Figure 2 illustrates the method.
Primeras Jornadas Regionales de Acústica - AdAA 2009 AdAA2009-A051R
4
Figure 2. Frequency domain beamforming method (Fonseca, 2009).
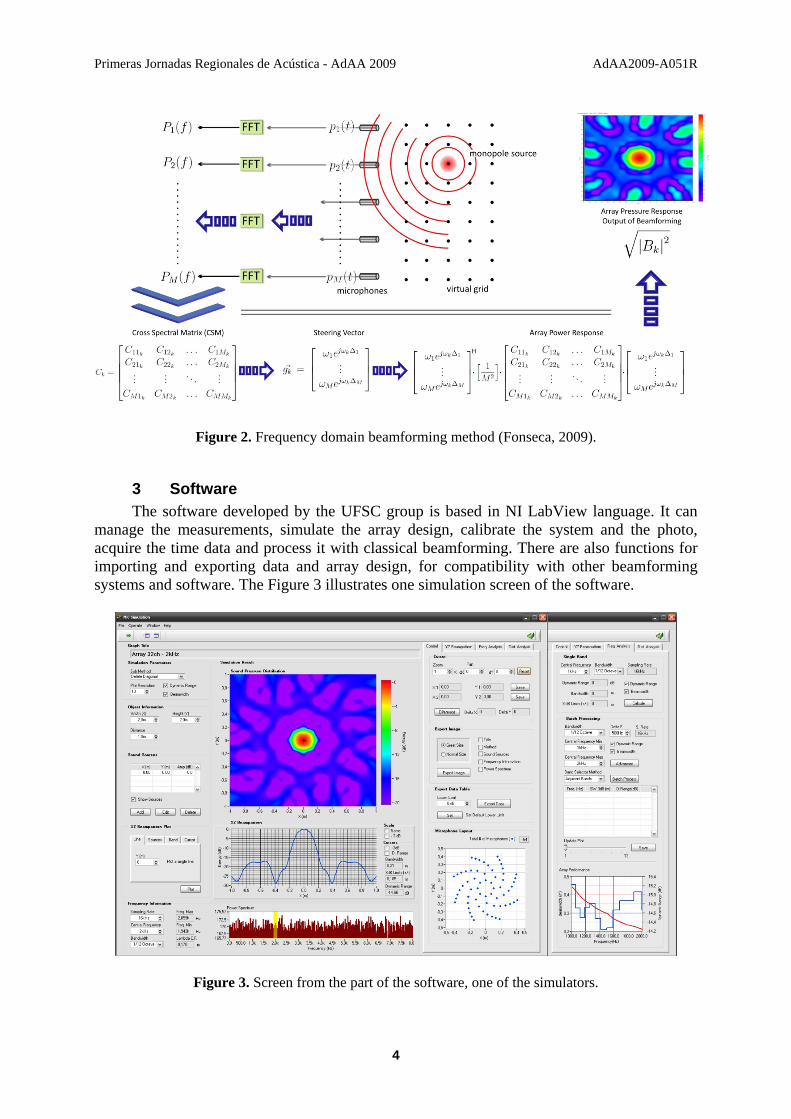
3 Software The software developed by the UFSC group is based in NI LabView language. It can
manage the measurements, simulate the array design, calibrate the system and the photo, acquire the time data and process it with classical beamforming. There are also functions for importing and exporting data and array design, for compatibility with other beamforming systems and software. The Figure 3 illustrates one simulation screen of the software.
Figure 3. Screen from the part of the software, one of the simulators.
Primeras Jornadas Regionales de Acústica - AdAA 2009 AdAA2009-A051R
5
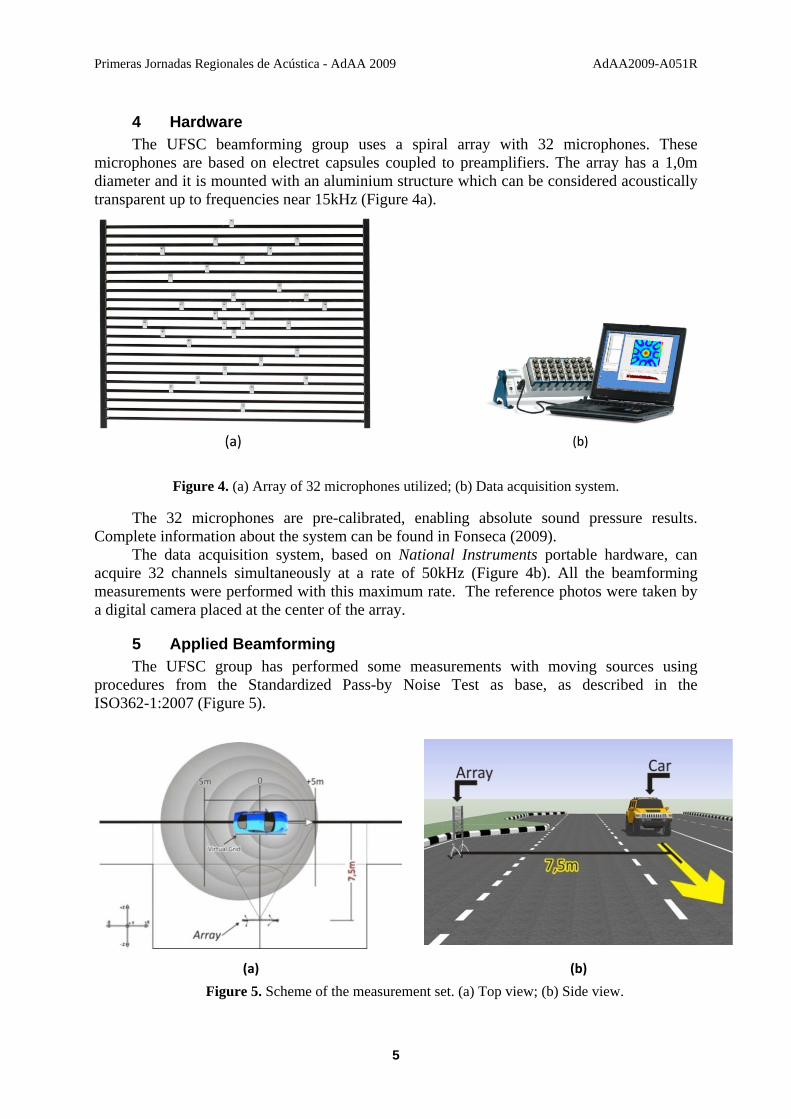
4 Hardware The UFSC beamforming group uses a spiral array with 32 microphones. These
microphones are based on electret capsules coupled to preamplifiers. The array has a 1,0m diameter and it is mounted with an aluminium structure which can be considered acoustically transparent up to frequencies near 15kHz (Figure 4a).
Figure 4. (a) Array of 32 microphones utilized; (b) Data acquisition system.
The 32 microphones are pre-calibrated, enabling absolute sound pressure results. Complete information about the system can be found in Fonseca (2009).
The data acquisition system, based on National Instruments portable hardware, can acquire 32 channels simultaneously at a rate of 50kHz (Figure 4b). All the beamforming measurements were performed with this maximum rate. The reference photos were taken by a digital camera placed at the center of the array.
5 Applied Beamforming The UFSC group has performed some measurements with moving sources using
procedures from the Standardized Pass-by Noise Test as base, as described in the ISO362-1:2007 (Figure 5).
(a) (b)
Figure 5. Scheme of the measurement set. (a) Top view; (b) Side view.
Primeras Jornadas Regionales de Acústica - AdAA 2009 AdAA2009-A051R
6
The procedures of acceleration and displacement were preserved the same as described in the ISO362-1:2007. The array positioning was the same as the single microphone position in the standardized test: 7,5m from the central line of the pass path with the center 1,2m from the ground. The data used in the post processing were cut and de-dopplerized from -5,0m to +5,0m, considering the array´s central line, Figure 5a.
The results shown here reveal acoustically a known problem in the catalytic converter of this car. The catalytic converter is a device which aims to eliminate part of the gas produced by the fuel combustion inside the motor. Its malfunction causes a louder noise that dominates other possible sound sources.
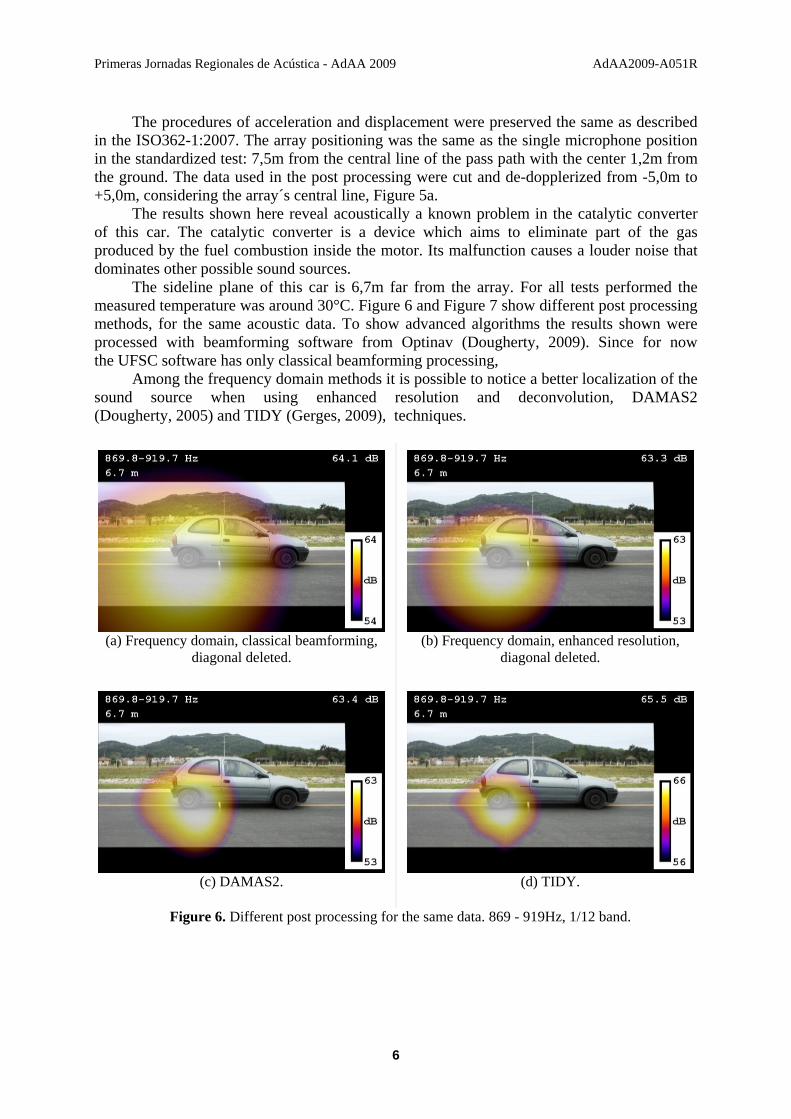
The sideline plane of this car is 6,7m far from the array. For all tests performed the measured temperature was around 30°C. Figure 6 and Figure 7 show different post processing methods, for the same acoustic data. To show advanced algorithms the results shown were processed with beamforming software from Optinav (Dougherty, 2009). Since for now the UFSC software has only classical beamforming processing,
Among the frequency domain methods it is possible to notice a better localization of the sound source when using enhanced resolution and deconvolution, DAMAS2 (Dougherty, 2005) and TIDY (Gerges, 2009), techniques.
(a) Frequency domain, classical beamforming, diagonal deleted.
(b) Frequency domain, enhanced resolution, diagonal deleted.
(c) DAMAS2. (d) TIDY.
Figure 6. Different post processing for the same data. 869 - 919Hz, 1/12 band.
Primeras Jornadas Regionales de Acústica - AdAA 2009 AdAA2009-A051R
7
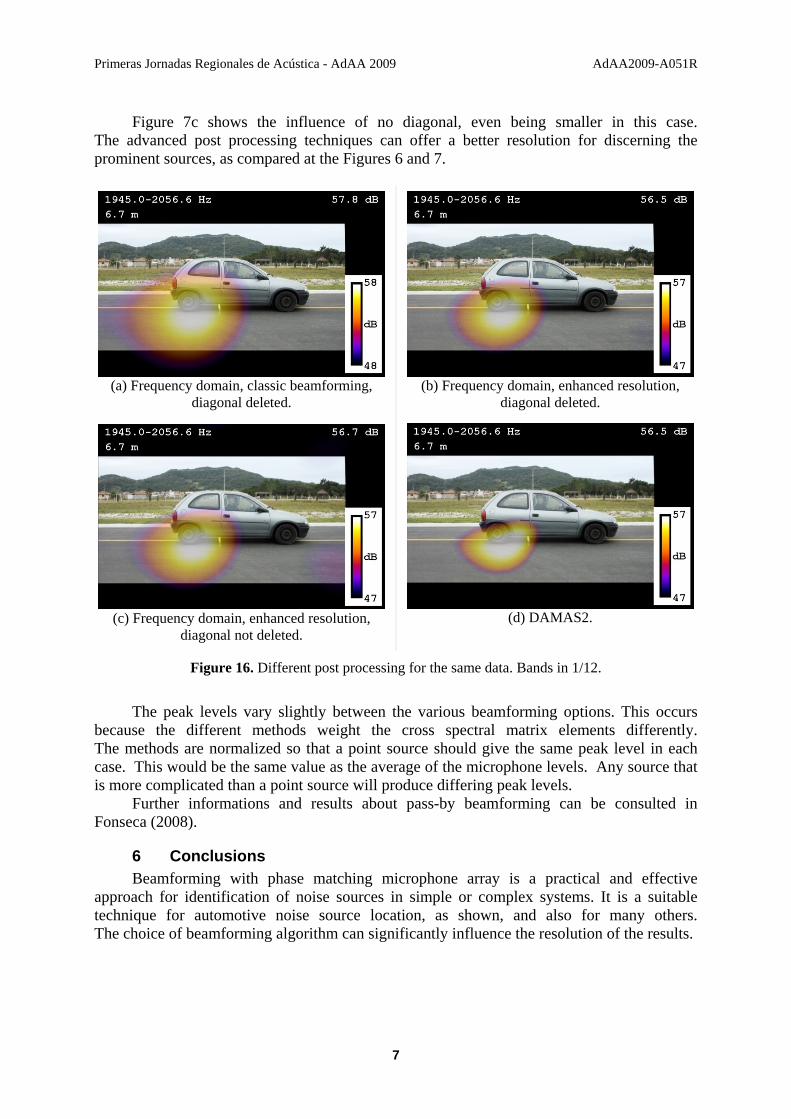
Figure 7c shows the influence of no diagonal, even being smaller in this case. The advanced post processing techniques can offer a better resolution for discerning the prominent sources, as compared at the Figures 6 and 7.
(a) Frequency domain, classic beamforming, diagonal deleted.
(b) Frequency domain, enhanced resolution, diagonal deleted.
(c) Frequency domain, enhanced resolution, diagonal not deleted.
(d) DAMAS2.
Figure 16. Different post processing for the same data. Bands in 1/12.
The peak levels vary slightly between the various beamforming options. This occurs
because the different methods weight the cross spectral matrix elements differently. The methods are normalized so that a point source should give the same peak level in each case. This would be the same value as the average of the microphone levels. Any source that is more complicated than a point source will produce differing peak levels.
Further informations and results about pass-by beamforming can be consulted in Fonseca (2008).
6 Conclusions Beamforming with phase matching microphone array is a practical and effective
approach for identification of noise sources in simple or complex systems. It is a suitable technique for automotive noise source location, as shown, and also for many others. The choice of beamforming algorithm can significantly influence the resolution of the results.
Primeras Jornadas Regionales de Acústica - AdAA 2009 AdAA2009-A051R
8
7 Acknowledgment To CNPQ and CAPES for the financial support of the scholarships. OptiNav Inc. for the support with enhanced beamforming techniques.
References Kinsler, Lawrence E.; Frey, Austin R.; Coppens, Alan B.; Sanders, James V. (1999). “Fundamentals
of Acoustics”. 4th edition, Wiley. Fonseca, William D. (2009). “Development and Application of an Acoustic Imaging System using
Beamforming Technique for Moving Sources (Original: Desenvolvimento e Aplicação de Sistema para Obtenção de Imagens Acústicas pelo Método do Beamforming para Fontes em Movimento)”. Master Thesis, Federal University of Santa Catarina, Florianópolis, Brazil.
Johnson, Don H.; Dudgeon, Dan E. (1993). “Array Signal Processing: Concepts and Techniques”. Prentice Hall PTR.
Underbrink, James R. (1995). “Practical considerations in focused array design for passive broadband source mapping applications”. Master Thesis, Pennsylvavia State University, Pennsylvania, USA.
Dougherty, Robert P. (2004). “Advanced Time-domain Beamforming Techniques”. 10th AIAA/CEAS Aeroacoustics Conference and Exhibit, AIAA 2004-2955, Manchester, United Kingdom.
ISO 362-1:2007, Measurement of noise emitted by accelerating road vehicles - Engineering method. Dougherty, Robert P. (2009). “Acoustic Phased Array Videos from a Large Construction”.
38th International Congress and Exposition on Noise Control Engineering - Internoise 2009, In09_901, Ottawa, Canada.
Dougherty, Robert P. (2005). “Extensions of DAMAS and Benefits and Limitations of Deconvolution in Beamforming”. 11th AIAA/CEAS Aeroacoustics Conference (26th AIAA Aeroacoustics Conference), AIAA-2005-2961, Monterey, California, USA.
Gerges, Samir N. Y.; Fonseca, William D.; Dougherty, Robert P. (2009). “State of the Art Beamforming Software and Hardware for Applications”. The Sixteenth International Congress on Sound and Vibration - ICSV2009. Kraków, Poland.
Fonseca, William D.; Gerges, Samir N. Y.; Dougherty, Robert P. (2008). “Pass-By Noise Measurements Using Beamforming Technique”. 37th International Congress and Exposition on Noise Control Engineering - Internoise 2008, In08_0891, Shanghai, China.


![Acústica acústica - inadbrasil.org · 10 [NOVEMBRO - DEZEMBRO 2012] audiology infos Acústica acústica nossa sensação de volume sonoro é constante, pois ela depende da pressão](https://img.pdfslide.net/doc/110x75/5b09bb5e7f8b9a604c8b4e59/acstica-acstica-novembro-dezembro-2012-audiology-infos-acstica-acstica-nossa.jpg)