Embed Size (px)
Citation preview

I.~ .......... .
PRIMSTAT, A MENU-DRIVEN SYSTEM FOR INFORMATION RETRIEVAL USING SAS/AF SOFTWARE
Esbj6rn Lindhoff - PRIMDATA AB
The company
PRIMDATA is a subsidary company of Swedish Steel. The company has 250 employees at 4 locations in Sweden.
We run the SAS system on IBM3083, VAX and PS/2 and are SAS users since 1981.
About six persons at Swedish Steel are familiar with the SAS-system in detail. Fifteen persons can use the DATA-step and the most common procedures in SAS. About 30 persons can use SAS menu-driven systems.
Background
The reason for building PRIMSTAT was that we wanted a flexible menu-driven System for Information Retrieval. We found that the menu-driven systems we built previously always needed to be complemented with new menus, panels and functions. After a while we found that we needed a generalized. Information . Retrieval System that could be called from more specialized systems with fixed choices. We needed flexibility.
We also wanted a System for Information Retrieval that could be used by new groups who were not familiar with computers or did not have enough time to learn the SAS language.
The fact that a skeleton menu-system, the SMSsystem, was available to go on with prompted us to start the development of PRIMSTAT.
255

Functions
The system is designed for generation of reports containing listings and statistics. It can also be used for statistical analysis.
PRIMSTAT is very user friendly and contains menus, panels and help texts in two languages, English and Swedish.
Help text is always available at menu/paneland element-level.
Input data is validated to a high degree.
The system contains "icons" and templates for maximum user support.
Lead- and help texts are made in colors and sometimes reverse video to make the menus/ panels very user friendly.
PRIMSTAT can read and write SAS-files, ordinary files and DB2-files.
Listings containing detail rows and totals can be produced as well as just totals per one or two classification variables.
Many types of diagrams such as vertical- and horizontal bar charts, pie-, radar- and blockcharts can easily be produced in black and white or in color. The diagrams in color graphics can be stored in a graphics catalog for later modification, retrieval and plotting.
Subsystem
PRIMSTAT can be accessed from other SAS/AF menu-systems. This is the way we mostly use the system to get maximum flexibility.
Documentation
Three kinds of documentation are available. There is a general manual, a manual focusing the functions in the system and a manual containing examples. The exampels shown below are extractions from this later manual.
Courses
PRIMDATA has a one day course for persons who want to use PRIMSTAT.
256

Lets look at some examples.
Example 1
We want a pie-chart from The Market Statistics File showing the number of plates per external quality.
We start the PRIMSTAT system and the startmenu will appear on the screen. Se fig 1.
(Unfortunally some blank lines disappear when making a hardcopy of the screens. This happens in some figures. In reality there are blank lines att proper places on the screens sO the text can easily be read)
We select point 2 to get to the Main Menu of the english part of PRIMSTAT. Se fig 2.
On this menu we select point 4 and arrive at the panel for producing pie- and star charts in color (fig 3).
The panel is filled in. The system detects that the name EXTKVAL is not in the file (fig 4) and that an invalid selection is made at "Type of statistics" (fig 5). The user can now, to get a valid s~lection, press the HELP-key and get the help text shown in fig 6.
The user goes on specifying that the classes HX40Q and 8l2E are to be moved out from the pie. The user also specifies that the chart is to be saved in the graphics catalog. See fig 7.
The output is shown in fig 8.
Example 2
In the next example we want to produce some statistics in a form of a vertical bar chart. Mean absent time per type of work injury is wanted from the Work Injury File.
The menus and panel in fig 9 to 15 are filled in. The "icons" in fig 12 makes it easier for the user to make selections. The "icon" in fig 13 makes it easier to fill in the parameters and data. The user can for example directly see where to put the classification variable(s).
257

The resulting diagram is shown in fig 16.
In this example the user had to use several menus to get the result. We have observed that initially the users have some problems finding their way in the menu hierarchy~ Because of this, we developed the function oriented PRIMSTAT manual. In this the user can see that, for example, a vertical bar chart in black and white can be produced with panel 12351. This unique panel identification is constructed so that the user can find his way to the paneL The first character says "choose menu 1", the second "choose point 2". on menu 1. The third character says "choose point 3 on menu 12 and so on.
Example 3
The next example shows PRIMSTAT used as a subsystem to The Work Injury System.
In this case we want the number of accidents plus total and mean absent time per department and type of injury.
The system is started and we enter the main menu of The Work Injury System (se fig 17).
Since there is no preprogrammed function for this report we choose point 5, PRIMSTAT.
The menus and panels in fig 18 to 25 are filled in. The result is shown in fig 26.
The "icons" in fig 22 and the templet in fig 23 are supporting the user to a great extent.
Example 4
In the last example we want a report from a COBOL-file.
We want mean order weight per Denmark, Norway and Sweden shown in a block chart.
In this case we have to first produce a subfile containing records for the countries concerned including the variables land code and order weight.
258

Panel 123212, fig 27 and 28 is filled in. There is a possibility in fig 28 to specify a copy-name. If such a copy exists the user does not have to fill in data names, positions and so on.
At last the panel in fig 29 is filled in.
The block chart is shown in fig 30.
There are also panels for producing SAS-files from other SAS-files. One example is shown in fig 31 and 32. The user is supported with lead texts to a great extent. Sometimes, however, the user needs a more flexibel panel for. producing new files. In this case the panel in fig 33 and 34 is used. To use the panel in fig 34 the. user has to know some SAS-instructions.
The PRIMSTAT system contains many more functions than can be shown here.
The system has made it possible for persons not very familiar with computing and computers to learn how to produce information from a flexible menu system. After that they can, if they want, go on learning SAS-instructions and procedures and thus get a still more flexible way of producing information.
The system has also relieved us from time to time making changes in our SAS/AF menu systems.
PRIMDATA AB Att: EsbjBrn Lindhoff Box 1000 8:-61301 OxelBsund
Tel int: +046155-54481
259

PRIMSTATs startMeny Select OPtion =~=) 2
PI:;:I/'lSTAT
SysteM fHr statistikfraMst~lLning
(System for generation of statistics)
1. SV(;Hlsk h)xt (Sw(;)d i sh text)
2,. Enq0) Lsl< text (Eng l ish tex t)
Fig 1 Press END to return.
(j)
,\
! •
.......... " ...................... > x
3. Ti l l I)isplay Mani:l\HH' era DI sp 1.i:1Y Olan,~gel" )
4. TI 1.1. T.s·o (To Tso)
Specificera 1, 2, 3 eLLer 4 i kOMmandofiLtet ijverst p~ bi Lden samt tryck pI ENTER. (Specify i, 2, 3 or 4 in the command field in the upper part of the menu and press ENTER)
SeLect Option ~~=) 4
PRI/'lSTI~T
SysteM for generation of statistics
1. Input / upclah) Z.Display I search 3. Reports and other functions
4. Pie and star charts (CoLor Graphics) 5. Bar and bLock charts -"-b. PLot cl1~1rt ...•...
7. Sort 8. Data Litn-,. Vi:ll-iabLe and Graph.ics Cat 9. I-IOIJ..I to US'(f) 1'11(-) F'RI/'lSTAT SYS'h)Ol
90. Creation of fi Les 95. To Start /'lenu 96. Clear Output Windo~ 97. To the Output Window 98. To Program/Lo~ Window
99. End (to Tso)
260
Fig 2
Press END to return.
(12)
----------------------! Press PFi tr) 90)t infcH·m~1tiol'l con-' cerning PRIMSTAT.
You wilL also find information about who to contact in case of probLems.

\ ,
Cn!a"te p i(~ 01- star charts Fig 3
Press END to submit or entei CANCEL to return Sp ec l' i I. (;m~1 nle
.N ................................. _ ................ ; ....... .
Page 1 of 1 ( 124)
CClmm<1 nd ::::::::::::)
Spec chart titl.e
. -----------------------------------------------
. -----------------------------------------------Type of c:hart C I.assvar· i ab le Type of statistics Statistic variable Frequency variabLe Expl.ode
P~1tt(;!rn
• OTHER" -a r' e,) Ov(;)rhE)ad
------------------ .)
----- *) ... (X/b)
Graphic catalog Picture description Type of terminal.
I8M3279 : _ (X/b) I8M3279G: _ (X/b) ·It) onl.y f(JI
pi(;! C:h<H·ts
Create pie Dr star charts Fig 4
ERROR: Variable EXTKVAL not found. Press END to submit or enter CANCEL to return
Spec fj Lename RB.MASTFILE Spec chart titl.~
: NUMBER OF PLATES PER EXTERNAL QUALITY
P~1g(;; 1 of 1 ( 124)
-----------------------------------------------Type of chart C I.assval- i ab I.e Type of siatistics Statistic variable Frequency variabl.e Exp f.clcle
P.j·t t.er·n
• OTHER' '-'~1 r'ea Ovel-head Gr~1phic c<1talog Picture description Typ~ of terminal
IBM3279 : _ (X/b)
261
PIE EXTJ<VAL
------------------ .)
.jt )
__ eX/t!)
-----------------------------IBM3279G: _ (X/b)
.)1;) CHll.y for' pie chart~;

Create pie or star charts Fig 5 Coolmand =::::::::}
ERROR: Invalid entry at ROW = 15 COLUMN = 48. PLease reenter Press END to submit or .nter CANCEL to return Page 1 of 1
( 1 ~~4)
GClhlma nd :::::::::}
Spec fi lenam~ RB.MASTFILE Spec chart title
: NUMBER OF PLATES PER EXTERNAL QUALITY
Typ€-) Cl f c:ha d· C Lassval- i ab I.e Type of statistics Statistic vari~bLe Frequency variabl.e Exp tt1de
H OTHER "·-i:ll-ea Ov€-)rhead Graph i c cat"llog Picture description Type of terminal
IBM3279 : _ (X/b)
PIE E({VAL. Fr~EI{V
------------------ .>
---- *) ._. (X/b)
IBM3279G: _ (X/b) ·)f) on I. y fOl
piE) c:h~H·ts
Type of statistics Fig 6 Press END to return.
Specify the type of sJatistics yo want.
You can seLect the folLowi~g:
- FREQ frequences per class
- PCT
_. CFREQ
.- CPCT
.-. SUM
- MEAN
frequences in percent per class
frequences cummuLative per class
frequences in percent. cUMMulative per cLass
the sum of the statistics variable per cLass
the meanvalue of the statistics variabLe per c: I. ~1.S:s
262

Create pie or star charts GClhlhlc1 nel :::::::::: >
Fig '1
Press END to submit or enter CANCEL to return Page 1 of 1 ( 1 :;!4) Spec fi lename : RB.MASTFILE
Spec chart title : NUMBER OF PLATES PER EXTERNAL QUALITY
Typ e --~1; --eh ;;t"------- -- -- ----- ------------1;; IE -------------------------C lassval- i ab le EKVAL Type of statistics FREQ Statistic variable Frequency variable Exp tClele
Pflttern
• OTHER".,-a I" ea Overhead
'I-lX400' 'B12E'
x *)
._. (X/b) RB.GRAFIK Graphic .catal09
Picture description Type of terril ina I.
IBM3279 : _ (X/b)
NUMBER OF PLATES PER EXT QUAL *) only for
IBM3279G: X (X/b) pie charts
Fig 8
NUMBER OF PLATES PER EXTERNAL QUALITY
2144 12
2b14 1b
52-3 39
520C 7
1312 17
522D 28 524D
8
NVA 71
812E 127
263
HX500 9 HX400
117
m~m~~E3b-3
9b0E 1b
12 A48FP 8
OTHER 115

PRIMSTATs startmeny Select Option ===} 2
P RIM S TAT
System fBr statistikframstillning
(System for generation of statistics)
1. Svensk text (Sw~!d i sh text)
2. Enge I.sl< text (Engli.sh text)
Fi 9 Press END to re'urn.
(1)
y
!. . ! '" ... . -_._-_. __ ._---. >
x
3. Ti I.l Display Manager (To Display martager)
4. Till. Tso <To Tso)
Specificera 1, 2, 3 eller 4 i kommandofiltet tiverst p~ bi lden samt tryck pA ENTER. (Specify i, 2. 3 or 4 in the co~mand field in the upper part of the menu and press ENTER)
Ma i n MEmu SeLect Option ===) 3
Pr.:IMSTf-.T
System for generation of statistic!
1. Input / update 2. Display / search 3. Reports and other functions
Fig 10
Press END to return.
( 12)
----------------------! Pr<;!SS PF1 to get inforhl~1tion concerning PRIMSTAT.
4. Pie and star charts (CoLor Graphi~s) .• S. Bar and bLock charts -"- You wi LL also find 6. Plot chart -"- information about
who to contact in 7. Sort case of ptoblems. 8. Data Libr, Variable a~d Graphics Cat -----------------------9. How to use the PRIMSTAT system
90. Cteation of fi les 95. To Start Menu 96. CLear Output Window 97. To the Output Wind6w~ 98. To Program/Log Window
99. End (to Tso) - ~-,. ,

.~.
Fig 11
Select Option ===) 5 Press END to return.
(f 23)
Select one of the options and press ENTER
Specify a SAS data librarY
2 Create, Modify, or look at a SAS data set
3 Coordinate two or tree fi le.
4 Generate reports
5 Produce printer graphics
6 COMPute descriptive statistics
7 COMPute regression analysis
M To Main Menu (2.1'
Fig 12
Se I.ec t Op t i on ::::::::: > 1 Press END to return.
<1235'
Select an option and press ENTER
Ved i ca L Bell- 2 Horizontal Bar 3 Bl.ocl< Chal-t
++ I I
!++ I I
I I I I I
I I I I I ++ I I I I I I I
._._ .. _ .. _ I '_'_00_00_.
• !
! .'00_00_00_00_00-00_._.+
!.-._ .. -.. _._ .. _ .. _ .. _ .. -.. _ .. _.+
!.-._+
5 Plot Y vs X
y 0 .\.
o + a 0
o
o 0
+ _ .... _. +_ .. _ .. -+ _._ .. -X
265
++ I I
I·_oo_ oo-! ! _00_00_'+"00_00_00_·-1 ++ I I I I /
I!! I!! I!! I I I I 1
1.-00-00-00-. I ._00_00_00_. I -00-'-'- I
M To Main Menu (2.1 )

C (lIll ill<1 n d ,,:;:::::: >
Press END to submit or enter CANCEL to return
SAS data set name: ________________ _ Statistic to be charted:
FRE(~
PCT SUM MEI~lN
fro ~?':l tlene y P Ell"' C Em t s UII) i~
m,?~a n .)Ii
* compute the sum or mean
+
+
++ I I , , ! I
I , , I
++ I I I ! ++ , I ++ • •
on the variabLe: _______ _ ---+--+--+--+--+--+--+--+ Chart variable: _______ _ J _ ............................ _ ...... I I .............. _ .......... _ .. _ .... I . . . . Group the bars based on
Fig 13
Pag(~ 'j of 2 (1235'j)
the variable: ________ (optional) If the chart variable is numeric specify either:
_ use discrete values or number LeveLs = __ (2-9)
Fre~uency variable:
~0rtical Bar Chart Comma nd ,,::::;::)
Press END to submit or enter CANCEL to return
SAS data set name: A.ARBSKREG Statistic to be charted: MEAN
FIi:E(~
PCT SUM ME.4N
fro E~'lllenc y pc-!r'cE~nt s tlm i~
(.H,~a n .)Ii
+
...
++ I I
I I
• I
• I
I I
++ , I
I I
I I
++ ++ I I * compute the sum or mean
on the variable: FRVTID ---+--+--+--+--+--+--+--+ Chart variable: KLASSN
1 ........................................ 1 I .. M ...................... " ... , •••• I . . . . Group the bars based on
Fig 14
Page i of 2 ( 1 2~~~51 )
the variable: ________ (optional) If the chart variable is numeric specify either:
_ use discrete values or number Levels = __ (2-9)
Fre~llenCy variable:
Vertical Bar ~hart COIlllJl.:1 nd :::;:::::)-
Press END to submit or enter CANCEL to return
Define or ~Jdify title information Titles
1. Mean absent time per type of work injury
Define or modify footnote information F 00 t no tEo'S
Fig 15
Pa~Jf.~ 2 of 2 ( 12~~~S1 )
1. _________________________________________________________________ _
2. _________________________________________________________________ _ 3. _________________________________________________________________ _
266

Fig 16
PROCEDUI'~E OUTPUT
MEAN ABSENT TIME PER TYPE OF WORK INJURY '13:'i7 FI:;:ID(.!ty, APIUI... 21, 'i'lB9
BAR CHART OF MEANS Frwn D MEAN
40 ·1·
20 '" ·)f .).;.
* .)j; .)j; * ·)f * ~f ·)f 1f
~f
.), ~f
0)1':
"}f
.), ·)f .jf
·)f
* if
'if
'1,
if .», ·)f 'X'
* ·)f
0~)OO~)()()()i ; 'i 1 2222227 1 234 5 6 790 1 2 3 4 5 6 7 8 901 2 3 4 5
I<LASSN Skadf~·"·)ftyp
Systemets startmeny Fig 17
Select Option ===) 5 Press END to return.
ARBETSSI<ADE- OCH TII...I...BUDS-SYSTEM
i. Inrapportering, Arbetsskaderegistret --------------------
2. Visning I sHkning 1ni: k,;'1)'1 E:rh~ l I.as
I genom tryckning ! P~I PF1
3. In1"appo)"tf?l" in~J} Ti I. lbucisre'::J i.~;tl"f,;t
4. Visning I sHkning -"-
~::;. PIUMSTAT
7. Div funktionel" mE.'cI ankn ti ll. Ti I.l.budsr·E!~Ji!;tret
95. 1n- eller urkoppling av grafikkatalogen 96. Rensa rBsultatf6nstret 97. Til. l )"E.'SLl I. ta tflin:s:tr·E.'t
98. Avsluta (ti 1.1. Display Managf:!r) S'9. (.)'v.s:J.ut<) (1'i 1.1. lSD)
PRIMSTATs startmeny Fig 18 Select Option ===) 2 Press END to retu)"n.
(1)
PRIi'ISTAT
System fHr statistikframstjlLning y
(Systelll for generation of st~)tistics) !. ! •
... _,,-_._._._ .. ,,-_._. >
267

\
"
1. SVt'msk text (Swedish text)
2. Engelsk text (English text)
3. Ti II Display Managel- <To Display managel-)
4. Till Tso (To Tso)
Specificera 1, 2, 3 eller 4 [ kommandofiltet tiverst p~ bilden samt tryck p~ ENTER. (Specify 1, 2, 3 or 4 in the command field in the upper part of the menu and press ENTER)
Mel i n Me.nu Select Option ~~=) 3
1. ,., .;..
3.
4. 5. 6.
7. 8. 9.
PRIMSTAT
System for generation of statfsties
Input I upd~1te Di sp I.ay / seal-eh Reports and other functions
Pie and star charts (CoLor Graphics) Bar and bl.ock charts -"-PLot chart -"-
SC)I-t Data Libr, Variabl.e and Graphics Cat How to use the PRIMSTAT system
90. Cr~ation of fi Les
95. To Start Menu 96. CLear Output Window 97. To the Output Window 98. To Program/Log Window
99. End (to Tso)
Select Option ===} 4
Fig 19
Press END to return.
( 12)
-------_____ ~-------__ I
Pn?ss PF1 t() {4et infc)rm~1tion con-·eerning PRIMSTAT.
You wi II also find information about who to contact in case of probLems.
Fig 20
Press END to return.
( 123)
Select one of the options and press ENTER
Specify a SAS data l.ibr~ry
2 Create, modify, or look at a SAS data set
3 Coordinate two or tree fi Les
4 Generate reports
5 Produce printer graphics
6 Compute descriptive statistics
7 Compute regression analysis
M To Main Menu (2.1)
268
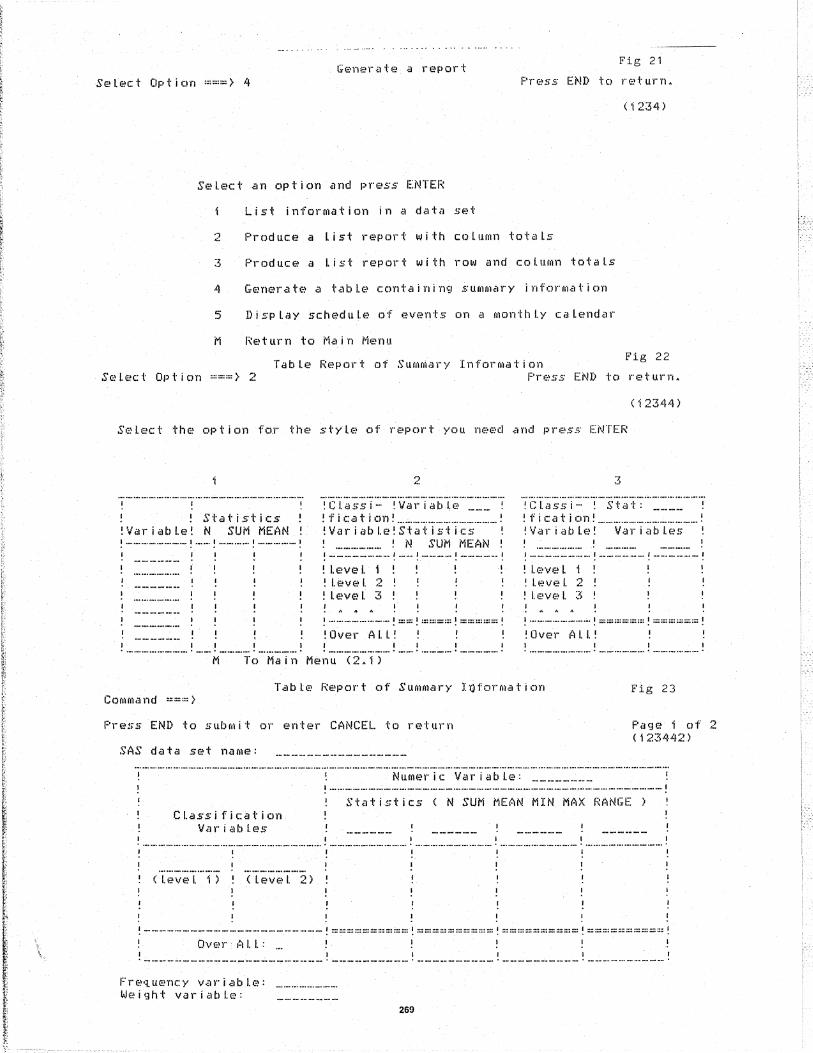
Generate a report Fig 21
SeLect Option ===) 4 Press END to return.
( 1 234)
SeLect an option and press ENTER
2 Produce a List report with coLumn totaLs
3 Produce a list report with row and column totaLs
4 Generate a table containing summary information
5 Display scheduLe of events on a monthLy calendar
M Return to Main Menu
Table Report of Sum~ary Information Fig 22
Select Option ===) 2
-----------------------! Statistics
VariabLe! N SUM MEAN
1
--___ - __ 1 __ 1 ____ 1 _____ 1 .. . .
I I I , I '--------,--,----,-----,
!Classi- !Variable ___ ! !fication!_~ __ ---------! !Variable!Statistics ! ______ ! N SUM MEAN ! 1 ________ 1 __ 1 ____ 1 _____ 1
. .... ! I.E!vel, ! lf~vel 2 !LE~VE~L ~;;
!--------!==!====!=====! ! OVE)I" (4 I, I, ! I I I I I ,--------,--'----,-----,
Press END to return.
(i2344)
"1 ,-'
!Classi- ! Stat: ___ _ !fication! _____________ ! !Variable! Variables 1 1 • 0-•• M •• M •• M •• _. '.' '. 1 ________ 1 ______ 1-_____ 1 . . . . ! I.I:n/E~ L ! L(;)VE! I. 2 ! I.':~VE) I. ~'iS
!--------!======!======! ! CJVf~l- A l I. ! I I I I ,--------'------'------' M To Main Menu (2.1)
TabLe Report of Summary Ieformation Fig 23 Command ::::::::::: >
Press END to submit or enter CANCEL to return F'agE~ i of 2 ( 1 2::,;4,(12)
SAS data set name:
CLassi fic:~1tiCll1 Val" jab I.f2S
Numeric VariabLe: 1 ______ -------------------------------______ 1 , '
Statistics ( N SUM MEAN MIN MAX RANGE)
1 1 1 1 1 -----------------------,----------'----------'----------,----------' ( L ev(;) I. i) <leveL 2)
!-----------------~-----!==========!==========!==========!==========! ! OV(;) 1" 1~II, L: ,_,!! !! I I I I 1 I '-----------------------'----------'----------'----------,----------'
Frequency variabLe: l~e i <3h t val" jab I.E.':
269

Table Report of Summary Information Comma nd :::::;:;::;: >
Press END to submit or enter CANCEL to return
SAS data set name: A.ARBSKREG
Fig 24
Pa~H? 1 of :2 ( 1 2:?;";\.~f2)
------------------------~-------~~~;;;~~-~~;~~b~;~-~~~ii~-----------~ 1 ____ ---------------------------------______ 1 . .
S·tatistic.!> ( N SUM MEAN MIN MAX RANGE ) 1
Classi 1;ic:~1tion Voll- i i~ b I.f~s N SUM
1 J I I I
. _---------------------- ---------_._--------_._--------_._--------_ . , , , ,~v:o
(level 1) J<L(.lSSN (level 2)
!-----------------------!==========!==========!==========!==========! ! Over ALL: X ! !!! I I I } I I ._---------------------_._--------_._--------_._--------_._--------_.
Frequency variable: I,..J;:~ i gh t von" iab l;:~:
Table Report of Summary Information Co (i'Ifll·i:j nel :::::::::)
Press END to submit or enter CANCEL to return
Define or modify title information Titl.(~~s
1. Statistic.!> per department and type of injury ~,
Fig 25
Pa<J(;; :2 of 2 (1 ;':'~:':H42)
,. ------------------------------------------------------------------'7
~. ------------------------------------------------------------------Define or modify footnote information Footnot('~s 1. _________________________________________________________________ _
'1
,. ------------------------------------------------------------------3. ____________________________________________________________ _
COi"IMAND ::;::::::: > Fig 26 F'F:OCEDURE OUTPUT
STATISTICS PER DEPARTMENT AND TYPE OF INJURY 13: 'j '(' FI;':Il)'~IY, ,~,F'IUL. 21, 19tJ'?
Fr·~lnv<'r·()·· .. )(·t i d
,--------------------------------------, . . TOTAL
!-----------------+------------+------------+------------, ! '~l'Ild ! Skad;:~··· ! .- .. ----- ........ - ... ! 1ft yp !TIF ,--------,
! :;!~) !--------+------------+------------+------------, '22 1.00! O.O(·)! ~).O~)!
!--------+------------+------------+------------! !23 2.00! 0.00! 0.00!
!--------+--------+------------+------------+------------! ! TI K ! 20 i . 0~)! 0.00! 0 .. N)! !--------+--------+------------+------------+------------! !TIS !:2() 'i,.~)0! 0.N)! O .. t)0! !--------+--------+------------+------------+------------! !TMB !11 1.E)E)! l'5.()O! is.'M)!
!--------+------------+------------+------------! !2~> i ,.E)()! E).~)~)! 0.';)O!
!--------+--------+------------+------------+------------! !TMM !~)7 2 .. 00! 9.~)~)! 4.~>O!
(CONTINUED) 270

I'(?ad 1;'iJta fl"Olll an E::t~?l"na I. FiLe Fig 27
Press END to submit Dr enter CANCEL to return Page" 'i of 2 ( 12~~;;'~12)
SAS-fi lename: MARKSTAT Name of thE~ ,:!xt.;;)j"·nal. fi LE~ (not il Sf-IS···fi LE~) on disk that c:ont':"lins your data:
Fi I.en':"lhl'::~: 'XPS156.MASTFILE'
Specify conditions for sel.ection: IF LANDKOD ::: 'SE' OR LANDKOD = 'DK' OR LANDKOD = 'NO';
(give conditions in the form of subsetting IF:s) Proceed to next page to specify variabLes!
Fig 28 C (liMn ~1 n d :;::::::: >
Press END to submit or enter CANCEL to return Page 2 of 2 ( 123212)
Specify copy name if there is a copy of the record in PD.SAS.COPY:
or fi lL in variable names, there position and representation. Spec onl.y the datanames you want to read from the external. fi I.e.
Name Start Format
LANDKOD OI:;:DVII<T
COhHikl nel ::::::::: >
P()S
58 229
.3.CI·I('!)R2. PD5.
Spec in the format fieLd:
- ICHARXX. for character variabLes
.- F'DXX.Y
- IBXX.Y
ZDXX.Y
- RBXX.
for packed dec var.
for binary variabLes
for zoned variabLes
for fLoating point val".
XX is the variabLes Length in by t.;;)S
Y is the number of decimaLs you want the variable to have
Fig 29
Press END to submit or enter CANCEL to return PaQ(7! 'i of 1 ( 1 2:5 )
Spec fi Lename MARKSTAT Spec chart title
: MEAN ORDER WEIGHT PER LAND
-----------------------------------------------Type of chart BLOCK CLassvariabLe LANDKOD
- " ._. . 2
3 Type of statistics
Statistic variabLe
Frequency variable ()vE!l"'h'::)~ld Graphic cati~LQ~J
Picture description Termi na I. tYPf?
IBM3279 : _ (X/b)
MEAN
or';;DVII<T
... (X/b) I'B. GF:(~IF I K MEAN ORDER WEIGHT PER LAND
IBM3179G : X (X/b)
271

Fig 30
MEAN ORDER WEIGHT PER LAND·
18112.5
LANDKOD
Modify a SAS Data Set CC)(II01a nel :::::::::)
Press END to submit or enter CANCEL to return
1b043.3
Fig 31
Page 1 of 2 ( 12::;22)
SAS data set naMe: New _______________ _ Old ________________ _
(use the same name to Modify Or create new variables:
replace the old data set)
Variable Arithmetic Expression
-------------------~--------------------------------------------------------------------------------------~-
--------------------------------------~---------------
Co hi 01.01 nd ::::::;::) Modify a SAS Data Set
END to submit or enter CANCEL to return
Fig 32
F'a~JE' 2 elf 2 ( 1 2:322)
S(.iS did,~ SEd name: New Old oS' Ed, (;!C: t thE! clb oS'E! '" V,", .' " 1.-) ','1,<:;.' "1.'" -j(-I-.:·,'I·_::F:;-,'-·- ••• (- -I· .--- -••• ·-1·· 1 .-_ •••• -••••••• - •• -- ....... - •• -
• , ,., , . ,1:!"l'\ll:! j, <1 n k i'c))" ,,', I, I.) lvhf~re ............... .
val" i <1b le sYIIlbCl I, ~;;-;~i";;-t;i~,;;-~;;~-·c;,~);;;;1~~';;1:'-····· .. ···"·-··· ... -.- ... -.. -.. -.... -------- ..... -.... -.. -..
variable SYhlbol
272

Creation of fi les from e,isting inti Las CC)mOI~' nd ::::,::::}
Press END to submit or enter CANCEL to return
Creation of a new fi Le from an existing ti Le. Spec naMe of infi le : _______________ _
Spec name of outfi Le:
Spec naMe of variables in the subfi le (Leave bLank for all):
Creation of fi les from existing infi las
Press END to SUbMit or enter CANCEL to return
Spec conditions and calculations:
---------------------------------------------
273
Fig 33
Page 1 of 2 ( 1 2.90. )
Fig 34
Page 2 of 2 ( 12.90. )