Embed Size (px)
Citation preview
PRINCE HOUSING & DEVELOPMENT
CORP. AND SUBSIDIARIES
CONSOLIDATED FINANCIAL STATEMENTS AND
REVIEW REPORT OF INDEPENDENT
ACCOUNTANTS
MARCH 31, 2015 AND 2014
------------------------------------------------------------------------------------------------------------------------------------For the convenience of readers and for information purpose only, the auditors’ report and the accompanyingfinancial statements have been translated into English from the original Chinese version prepared and used inthe Republic of China. In the event of any discrepancy between the English version and the originalChinese version or any differences in the interpretation of the two versions, the Chinese-language auditors’report and financial statements shall prevail.
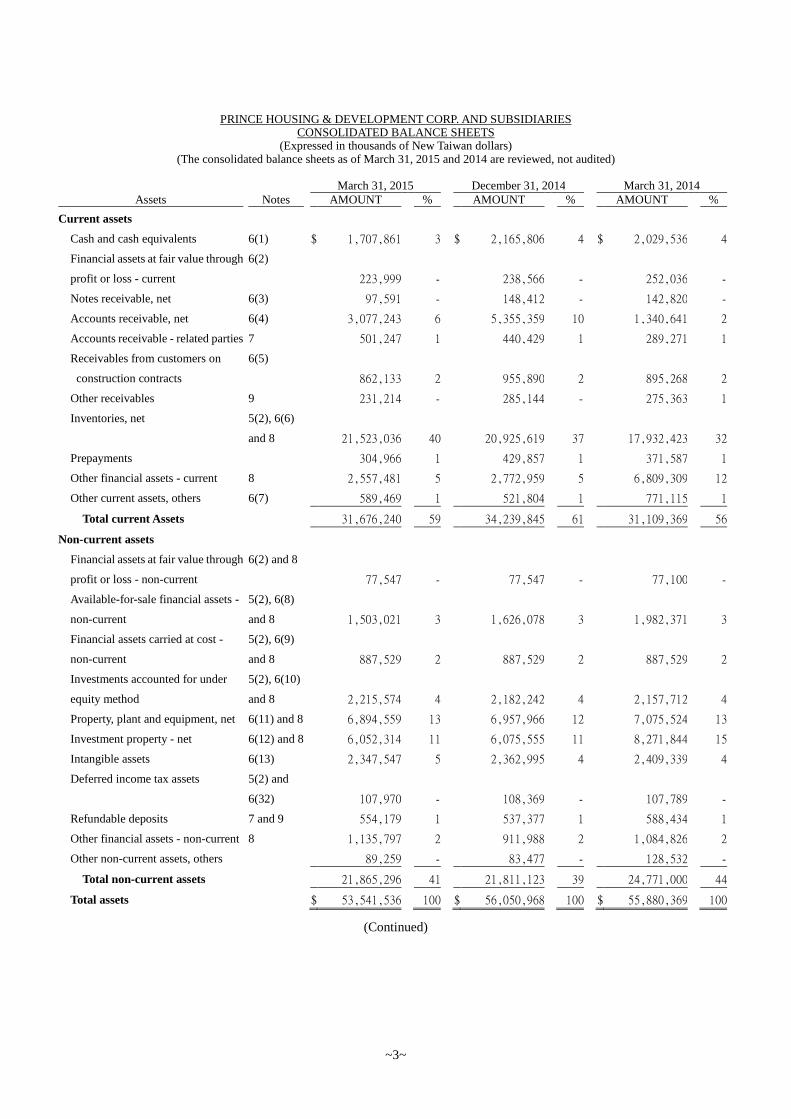
PRINCE HOUSING & DEVELOPMENT CORP. AND SUBSIDIARIESCONSOLIDATED BALANCE SHEETS
(Expressed in thousands of New Taiwan dollars)(The consolidated balance sheets as of March 31, 2015 and 2014 are reviewed, not audited)
~3~
March 31, 2015 December 31, 2014 March 31, 2014Assets Notes AMOUNT % AMOUNT % AMOUNT %
Current assets
Cash and cash equivalents 6(1) $ 1,707,861 3 $ 2,165,806 4 $ 2,029,536 4
Financial assets at fair value through
profit or loss - current
6(2)
223,999 - 238,566 - 252,036 -
Notes receivable, net 6(3) 97,591 - 148,412 - 142,820 -
Accounts receivable, net 6(4) 3,077,243 6 5,355,359 10 1,340,641 2
Accounts receivable - related parties 7 501,247 1 440,429 1 289,271 1
Receivables from customers on
construction contracts
6(5)
862,133 2 955,890 2 895,268 2
Other receivables 9 231,214 - 285,144 - 275,363 1
Inventories, net 5(2), 6(6)
and 8 21,523,036 40 20,925,619 37 17,932,423 32
Prepayments 304,966 1 429,857 1 371,587 1
Other financial assets - current 8 2,557,481 5 2,772,959 5 6,809,309 12
Other current assets, others 6(7) 589,469 1 521,804 1 771,115 1
Total current Assets 31,676,240 59 34,239,845 61 31,109,369 56
Non-current assets
Financial assets at fair value through
profit or loss - non-current
6(2) and 8
77,547 - 77,547 - 77,100 -
Available-for-sale financial assets -
non-current
5(2), 6(8)
and 8 1,503,021 3 1,626,078 3 1,982,371 3
Financial assets carried at cost -
non-current
5(2), 6(9)
and 8 887,529 2 887,529 2 887,529 2
Investments accounted for under
equity method
5(2), 6(10)
and 8 2,215,574 4 2,182,242 4 2,157,712 4
Property, plant and equipment, net 6(11) and 8 6,894,559 13 6,957,966 12 7,075,524 13
Investment property - net 6(12) and 8 6,052,314 11 6,075,555 11 8,271,844 15
Intangible assets 6(13) 2,347,547 5 2,362,995 4 2,409,339 4
Deferred income tax assets 5(2) and
6(32) 107,970 - 108,369 - 107,789 -
Refundable deposits 7 and 9 554,179 1 537,377 1 588,434 1
Other financial assets - non-current 8 1,135,797 2 911,988 2 1,084,826 2
Other non-current assets, others 89,259 - 83,477 - 128,532 -
Total non-current assets 21,865,296 41 21,811,123 39 24,771,000 44
Total assets $ 53,541,536 100 $ 56,050,968 100 $ 55,880,369 100
(Continued)
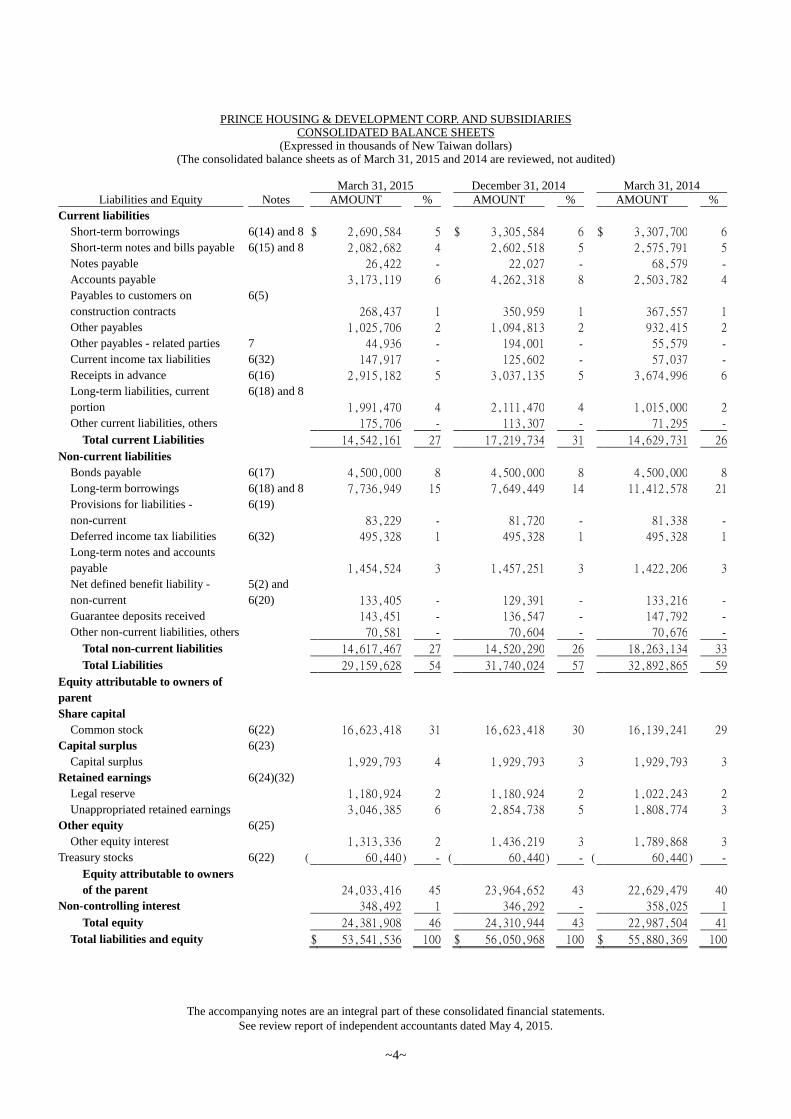
PRINCE HOUSING & DEVELOPMENT CORP. AND SUBSIDIARIESCONSOLIDATED BALANCE SHEETS
(Expressed in thousands of New Taiwan dollars)(The consolidated balance sheets as of March 31, 2015 and 2014 are reviewed, not audited)
The accompanying notes are an integral part of these consolidated financial statements.See review report of independent accountants dated May 4, 2015.
~4~
March 31, 2015 December 31, 2014 March 31, 2014Liabilities and Equity Notes AMOUNT % AMOUNT % AMOUNT %
Current liabilities
Short-term borrowings 6(14) and 8 $ 2,690,584 5 $ 3,305,584 6 $ 3,307,700 6
Short-term notes and bills payable 6(15) and 8 2,082,682 4 2,602,518 5 2,575,791 5
Notes payable 26,422 - 22,027 - 68,579 -
Accounts payable 3,173,119 6 4,262,318 8 2,503,782 4
Payables to customers on
construction contracts
6(5)
268,437 1 350,959 1 367,557 1
Other payables 1,025,706 2 1,094,813 2 932,415 2
Other payables - related parties 7 44,936 - 194,001 - 55,579 -
Current income tax liabilities 6(32) 147,917 - 125,602 - 57,037 -
Receipts in advance 6(16) 2,915,182 5 3,037,135 5 3,674,996 6
Long-term liabilities, current
portion
6(18) and 8
1,991,470 4 2,111,470 4 1,015,000 2
Other current liabilities, others 175,706 - 113,307 - 71,295 -
Total current Liabilities 14,542,161 27 17,219,734 31 14,629,731 26
Non-current liabilities
Bonds payable 6(17) 4,500,000 8 4,500,000 8 4,500,000 8
Long-term borrowings 6(18) and 8 7,736,949 15 7,649,449 14 11,412,578 21
Provisions for liabilities -
non-current
6(19)
83,229 - 81,720 - 81,338 -
Deferred income tax liabilities 6(32) 495,328 1 495,328 1 495,328 1
Long-term notes and accounts
payable 1,454,524 3 1,457,251 3 1,422,206 3
Net defined benefit liability -
non-current
5(2) and
6(20) 133,405 - 129,391 - 133,216 -
Guarantee deposits received 143,451 - 136,547 - 147,792 -
Other non-current liabilities, others 70,581 - 70,604 - 70,676 -
Total non-current liabilities 14,617,467 27 14,520,290 26 18,263,134 33
Total Liabilities 29,159,628 54 31,740,024 57 32,892,865 59
Equity attributable to owners of
parent
Share capital
Common stock 6(22) 16,623,418 31 16,623,418 30 16,139,241 29
Capital surplus 6(23)
Capital surplus 1,929,793 4 1,929,793 3 1,929,793 3
Retained earnings 6(24)(32)
Legal reserve 1,180,924 2 1,180,924 2 1,022,243 2
Unappropriated retained earnings 3,046,385 6 2,854,738 5 1,808,774 3
Other equity 6(25)
Other equity interest 1,313,336 2 1,436,219 3 1,789,868 3
Treasury stocks 6(22) ( 60,440) - ( 60,440) - ( 60,440) -
Equity attributable to owners
of the parent 24,033,416 45 23,964,652 43 22,629,479 40
Non-controlling interest 348,492 1 346,292 - 358,025 1
Total equity 24,381,908 46 24,310,944 43 22,987,504 41
Total liabilities and equity $ 53,541,536 100 $ 56,050,968 100 $ 55,880,369 100
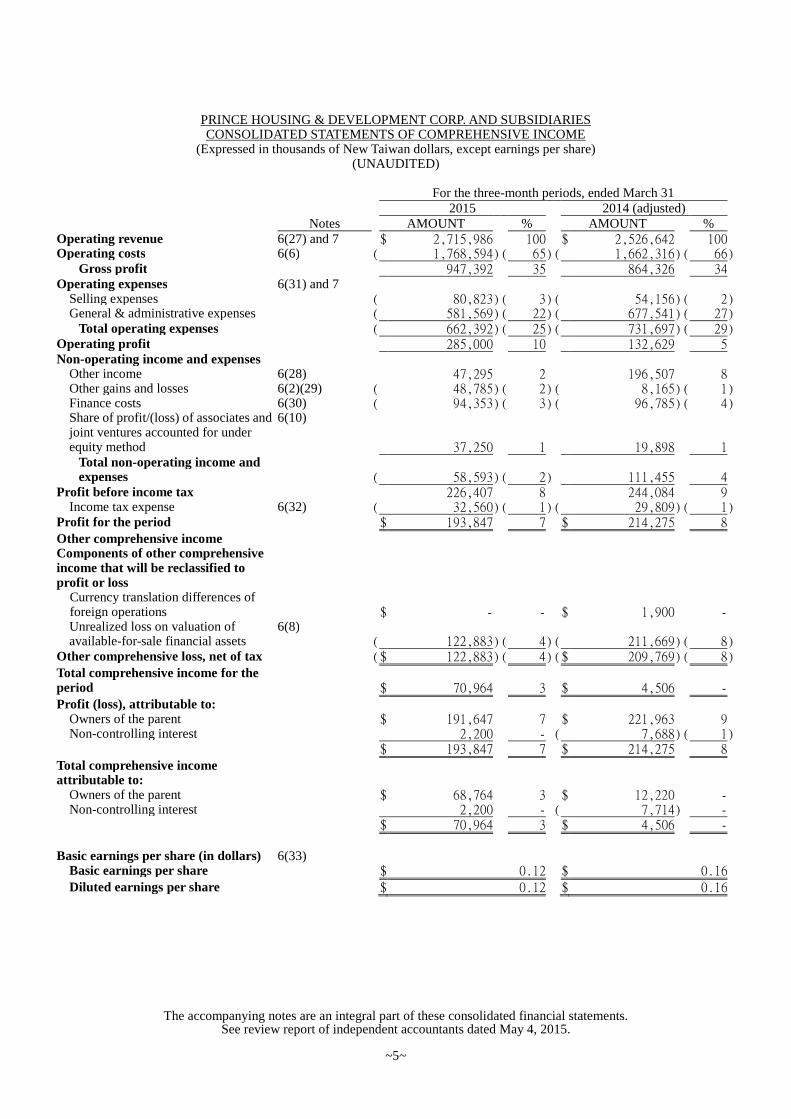
PRINCE HOUSING & DEVELOPMENT CORP. AND SUBSIDIARIESCONSOLIDATED STATEMENTS OF COMPREHENSIVE INCOME
(Expressed in thousands of New Taiwan dollars, except earnings per share)(UNAUDITED)
The accompanying notes are an integral part of these consolidated financial statements.See review report of independent accountants dated May 4, 2015.
~5~
For the three-month periods, ended March 312015 2014 (adjusted)
Notes AMOUNT % AMOUNT %Operating revenue 6(27) and 7 $ 2,715,986 100 $ 2,526,642 100Operating costs 6(6) ( 1,768,594)( 65)( 1,662,316)( 66)
Gross profit 947,392 35 864,326 34Operating expenses 6(31) and 7
Selling expenses ( 80,823)( 3)( 54,156)( 2)General & administrative expenses ( 581,569)( 22)( 677,541)( 27)
Total operating expenses ( 662,392)( 25)( 731,697)( 29)Operating profit 285,000 10 132,629 5Non-operating income and expenses
Other income 6(28) 47,295 2 196,507 8Other gains and losses 6(2)(29) ( 48,785)( 2)( 8,165)( 1)Finance costs 6(30) ( 94,353)( 3)( 96,785)( 4)Share of profit/(loss) of associates andjoint ventures accounted for underequity method
6(10)
37,250 1 19,898 1Total non-operating income andexpenses ( 58,593)( 2) 111,455 4
Profit before income tax 226,407 8 244,084 9Income tax expense 6(32) ( 32,560)( 1)( 29,809)( 1)
Profit for the period $ 193,847 7 $ 214,275 8
Other comprehensive incomeComponents of other comprehensiveincome that will be reclassified toprofit or loss
Currency translation differences offoreign operations $ - - $ 1,900 -Unrealized loss on valuation ofavailable-for-sale financial assets
6(8)( 122,883)( 4)( 211,669)( 8)
Other comprehensive loss, net of tax ($ 122,883)( 4)($ 209,769)( 8)
Total comprehensive income for theperiod $ 70,964 3 $ 4,506 -
Profit (loss), attributable to:Owners of the parent $ 191,647 7 $ 221,963 9Non-controlling interest 2,200 - ( 7,688)( 1)
$ 193,847 7 $ 214,275 8
Total comprehensive incomeattributable to:
Owners of the parent $ 68,764 3 $ 12,220 -Non-controlling interest 2,200 - ( 7,714) -
$ 70,964 3 $ 4,506 -
Basic earnings per share (in dollars) 6(33)Basic earnings per share $ 0.12 $ 0.16
Diluted earnings per share $ 0.12 $ 0.16
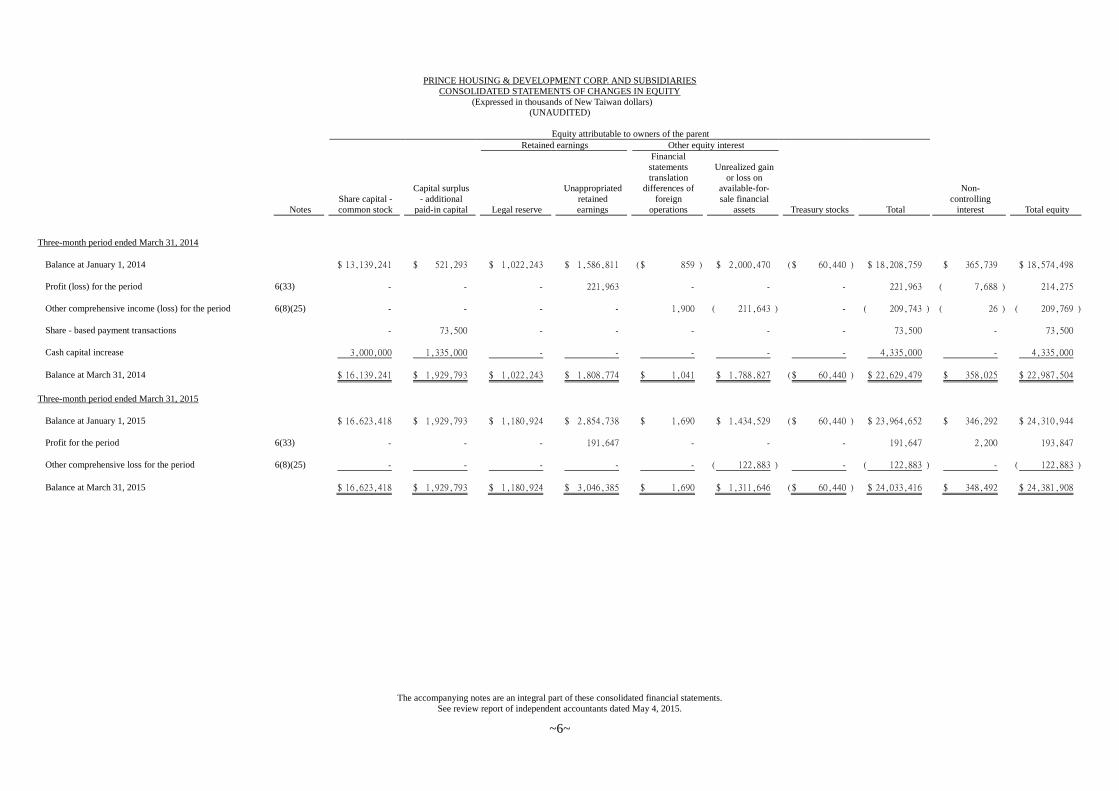
PRINCE HOUSING & DEVELOPMENT CORP. AND SUBSIDIARIESCONSOLIDATED STATEMENTS OF CHANGES IN EQUITY
(Expressed in thousands of New Taiwan dollars)(UNAUDITED)
Equity attributable to owners of the parentRetained earnings Other equity interest
NotesShare capital -common stock
Capital surplus- additional
paid-in capital Legal reserve
Unappropriatedretainedearnings
Financialstatementstranslation
differences offoreign
operations
Unrealized gainor loss on
available-for-sale financial
assets Treasury stocks Total
Non-controlling
interest Total equity
The accompanying notes are an integral part of these consolidated financial statements.See review report of independent accountants dated May 4, 2015.
~6~
Three-month period ended March 31, 2014
Balance at January 1, 2014 $ 13,139,241 $ 521,293 $ 1,022,243 $ 1,586,811 ($ 859 ) $ 2,000,470 ($ 60,440 ) $ 18,208,759 $ 365,739 $ 18,574,498
Profit (loss) for the period 6(33) - - - 221,963 - - - 221,963 ( 7,688 ) 214,275
Other comprehensive income (loss) for the period 6(8)(25) - - - - 1,900 ( 211,643 ) - ( 209,743 ) ( 26 ) ( 209,769 )
Share - based payment transactions - 73,500 - - - - - 73,500 - 73,500
Cash capital increase 3,000,000 1,335,000 - - - - - 4,335,000 - 4,335,000
Balance at March 31, 2014 $ 16,139,241 $ 1,929,793 $ 1,022,243 $ 1,808,774 $ 1,041 $ 1,788,827 ($ 60,440 ) $ 22,629,479 $ 358,025 $ 22,987,504
Three-month period ended March 31, 2015
Balance at January 1, 2015 $ 16,623,418 $ 1,929,793 $ 1,180,924 $ 2,854,738 $ 1,690 $ 1,434,529 ($ 60,440 ) $ 23,964,652 $ 346,292 $ 24,310,944
Profit for the period 6(33) - - - 191,647 - - - 191,647 2,200 193,847
Other comprehensive loss for the period 6(8)(25) - - - - - ( 122,883 ) - ( 122,883 ) - ( 122,883 )
Balance at March 31, 2015 $ 16,623,418 $ 1,929,793 $ 1,180,924 $ 3,046,385 $ 1,690 $ 1,311,646 ($ 60,440 ) $ 24,033,416 $ 348,492 $ 24,381,908

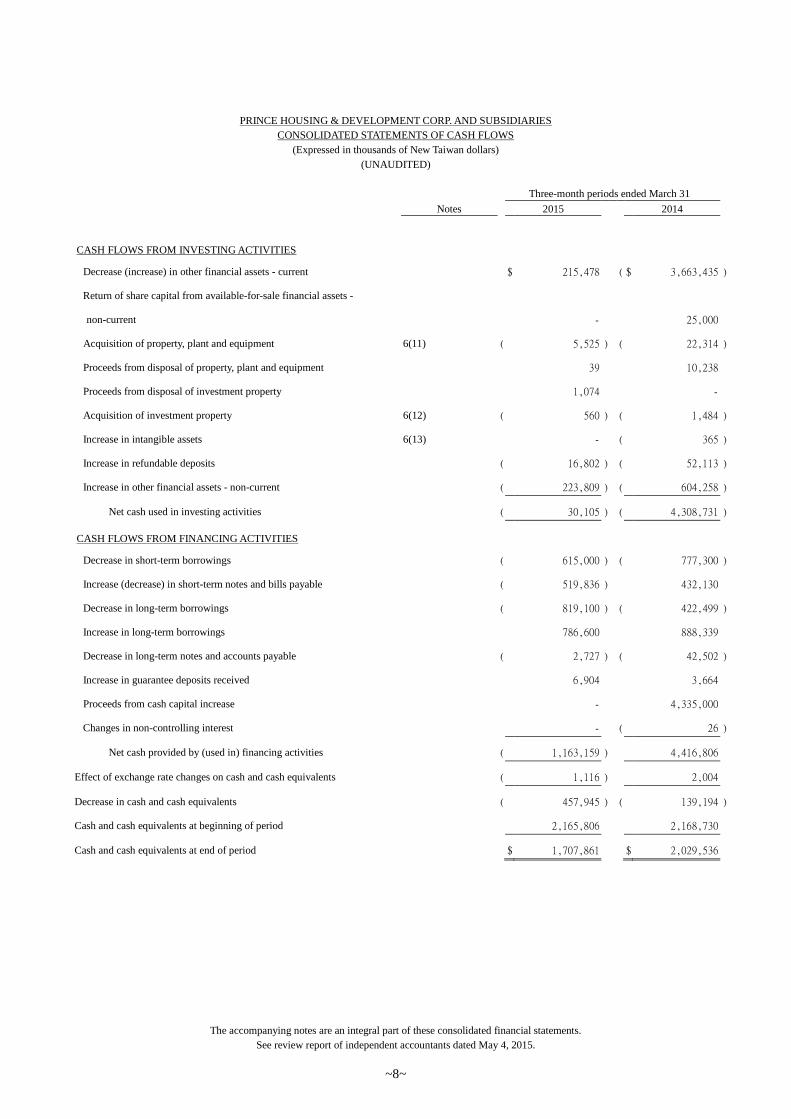
PRINCE HOUSING & DEVELOPMENT CORP. AND SUBSIDIARIES
CONSOLIDATED STATEMENTS OF CASH FLOWS
(Expressed in thousands of New Taiwan dollars)
(UNAUDITED)
Three-month periods ended March 31
Notes 2015 2014
~7~
CASH FLOWS FROM OPERATING ACTIVITIESConsolidated profit before tax for the period $ 226,407 $ 244,084Adjustments to reconcile profit before tax to net cash (used in) provided
by operating activitiesIncome and expenses having no effect on cash flows
Share-based compensation cost 6(21) - 73,500
Loss (gain) on financial assets at fair value through profit or loss 6(2)(29) ( 6,090 ) 4,560Write-off of uncollectible accounts 6(4) - ( 296 )Share of profit of associates and joint ventures accounted for under
equity method
6(10)
( 37,250 ) ( 19,898 )Loss on disposal of property, plant and equipment 492 1,939Loss on disposal of investment property 1,256 -
Depreciation 6(31) 89,872 76,543Amortization 6(13)(31) 15,448 16,042Interest expense 6(30) 94,053 96,485
Interest income 6(28) ( 1,249 ) ( 992 )Dividend income 6(28) ( 28,228 ) ( 176,439 )Impairment loss on financial assets 6(8)(29) - 11,813
Loss (gain) on unrealized foreign exchange 4,171 ( 8,564 )Changes in assets/liabilities relating to operating activities
Net changes in assets relating to operating activities
Financial assets at fair value through profit or loss - current 20,657 -Notes receivable 50,821 ( 39,301 )Accounts receivable 2,278,116 2,396,251
Accounts receivable - related parties ( 60,818 ) 494,132Receivables from customers on construction contracts 93,757 ( 81,272 )Other receivables 52,955 31,276
Inventories ( 597,417 ) ( 2,141,132 )Prepayments 124,891 161,468Other current assets, others ( 67,665 ) ( 45,527 )
Other non-current assets, others ( 5,782 ) ( 8,482 )Net changes in liabilities relating to operating activities
Notes payable 4,395 ( 6,753 )
Accounts payable ( 1,089,199 ) ( 1,651,032 )Payables to customers on construction contracts ( 82,522 ) 99,066Other payables ( 96,414 ) ( 119,662 )
Other payables - related parties ( 149,065 ) ( 199,020 )Receipts in advance ( 121,953 ) 504,268Other current liabilities, others 62,399 ( 27,721 )
Provisions for liabilities - non-current 1,509 2,267Net defined benefit liability - non-current 4,014 334Other non-current liabilities, others ( 23 ) ( 105 )
Cash (used in) generated from operations 781,538 ( 312,168 )Interest received 2,224 1,062
Cash dividend received 28,228 176,439Interest paid ( 65,709 ) ( 80,015 )Income tax paid ( 9,846 ) ( 34,591 )
Net cash used in (generated from) operating activities 736,435 ( 249,273 )
(Continued)
PRINCE HOUSING & DEVELOPMENT CORP. AND SUBSIDIARIES
CONSOLIDATED STATEMENTS OF CASH FLOWS
(Expressed in thousands of New Taiwan dollars)
(UNAUDITED)
Three-month periods ended March 31
Notes 2015 2014
The accompanying notes are an integral part of these consolidated financial statements.
See review report of independent accountants dated May 4, 2015.
~8~
CASH FLOWS FROM INVESTING ACTIVITIES
Decrease (increase) in other financial assets - current $ 215,478 ( $ 3,663,435 )
Return of share capital from available-for-sale financial assets -
non-current - 25,000
Acquisition of property, plant and equipment 6(11) ( 5,525 ) ( 22,314 )
Proceeds from disposal of property, plant and equipment 39 10,238
Proceeds from disposal of investment property 1,074 -
Acquisition of investment property 6(12) ( 560 ) ( 1,484 )
Increase in intangible assets 6(13) - ( 365 )
Increase in refundable deposits ( 16,802 ) ( 52,113 )
Increase in other financial assets - non-current ( 223,809 ) ( 604,258 )
Net cash used in investing activities ( 30,105 ) ( 4,308,731 )
CASH FLOWS FROM FINANCING ACTIVITIES
Decrease in short-term borrowings ( 615,000 ) ( 777,300 )
Increase (decrease) in short-term notes and bills payable ( 519,836 ) 432,130
Decrease in long-term borrowings ( 819,100 ) ( 422,499 )
Increase in long-term borrowings 786,600 888,339
Decrease in long-term notes and accounts payable ( 2,727 ) ( 42,502 )
Increase in guarantee deposits received 6,904 3,664
Proceeds from cash capital increase - 4,335,000
Changes in non-controlling interest - ( 26 )
Net cash provided by (used in) financing activities ( 1,163,159 ) 4,416,806
Effect of exchange rate changes on cash and cash equivalents ( 1,116 ) 2,004
Decrease in cash and cash equivalents ( 457,945 ) ( 139,194 )
Cash and cash equivalents at beginning of period 2,165,806 2,168,730
Cash and cash equivalents at end of period $ 1,707,861 $ 2,029,536
~9~
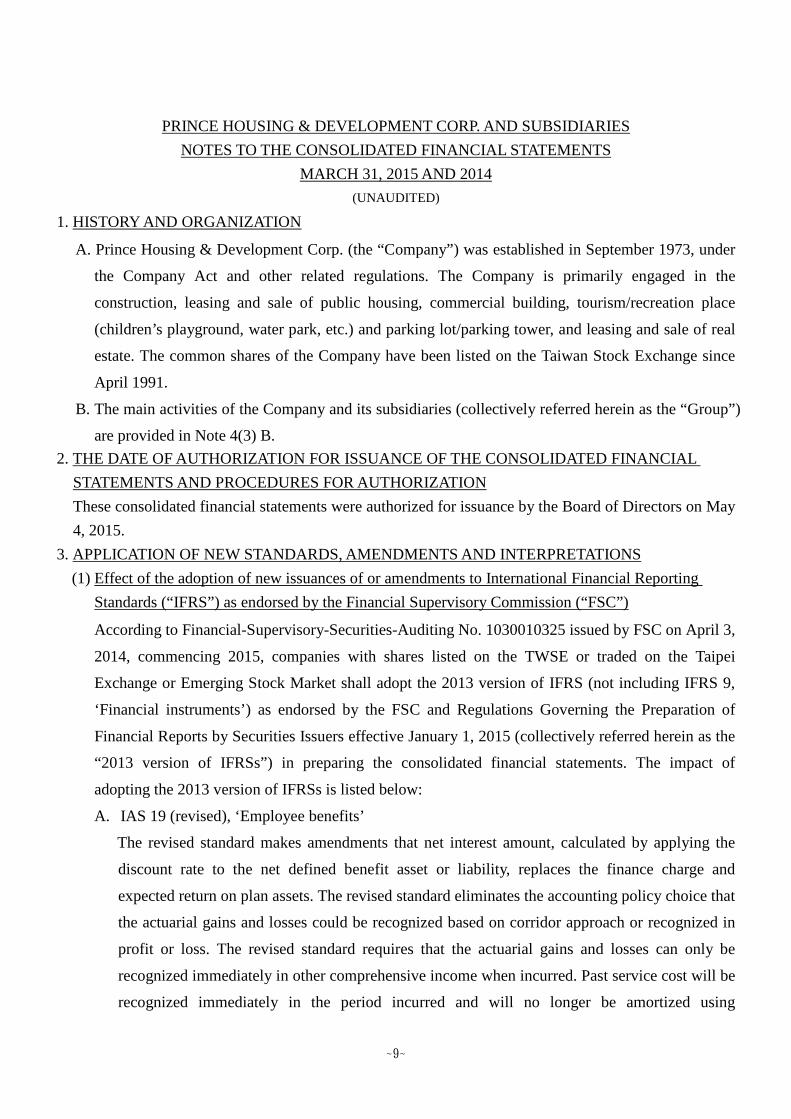
PRINCE HOUSING & DEVELOPMENT CORP. AND SUBSIDIARIES
NOTES TO THE CONSOLIDATED FINANCIAL STATEMENTS
MARCH 31, 2015 AND 2014
(UNAUDITED)
1. HISTORY AND ORGANIZATION
A. Prince Housing & Development Corp. (the “Company”) was established in September 1973, under
the Company Act and other related regulations. The Company is primarily engaged in the
construction, leasing and sale of public housing, commercial building, tourism/recreation place
(children’s playground, water park, etc.) and parking lot/parking tower, and leasing and sale of real
estate. The common shares of the Company have been listed on the Taiwan Stock Exchange since
April 1991.
B. The main activities of the Company and its subsidiaries (collectively referred herein as the “Group”)
are provided in Note 4(3) B.
2. THE DATE OF AUTHORIZATION FOR ISSUANCE OF THE CONSOLIDATED FINANCIAL
STATEMENTS AND PROCEDURES FOR AUTHORIZATION
These consolidated financial statements were authorized for issuance by the Board of Directors on May
4, 2015.
3. APPLICATION OF NEW STANDARDS, AMENDMENTS AND INTERPRETATIONS
(1) Effect of the adoption of new issuances of or amendments to International Financial Reporting
Standards (“IFRS”) as endorsed by the Financial Supervisory Commission (“FSC”)
According to Financial-Supervisory-Securities-Auditing No. 1030010325 issued by FSC on April 3,
2014, commencing 2015, companies with shares listed on the TWSE or traded on the Taipei
Exchange or Emerging Stock Market shall adopt the 2013 version of IFRS (not including IFRS 9,
‘Financial instruments’) as endorsed by the FSC and Regulations Governing the Preparation of
Financial Reports by Securities Issuers effective January 1, 2015 (collectively referred herein as the
“2013 version of IFRSs”) in preparing the consolidated financial statements. The impact of
adopting the 2013 version of IFRSs is listed below:
A. IAS 19 (revised), ‘Employee benefits’
The revised standard makes amendments that net interest amount, calculated by applying the
discount rate to the net defined benefit asset or liability, replaces the finance charge and
expected return on plan assets. The revised standard eliminates the accounting policy choice that
the actuarial gains and losses could be recognized based on corridor approach or recognized in
profit or loss. The revised standard requires that the actuarial gains and losses can only be
recognized immediately in other comprehensive income when incurred. Past service cost will be
recognized immediately in the period incurred and will no longer be amortized using

~10~
straight-line basis over the average period until the benefits become vested. An entity is required
to recognized termination benefits at the earlier of when the entity can no longer withdraw an
offer of those benefits and when it recognized any related restructuring costs, rather than when
the entity is demonstrably committed to a termination. Based on the Group’s assessment, the
adoption of the standard has no significant impact on its consolidated financial statements, and
the Group has disclosed additional information about defined benefit plans accordingly.
B. IAS 1, ‘Presentation of financial statements’
The amendment requires entities to separate items presented in OCI classified by nature into two
groups on the basis of whether they are potentially reclassifiable to profit or loss subsequently
when specific conditions are met. If the items are presented before tax then the tax related to
each of the two groups of OCI items (those that might be reclassified and those that will not be
reclassified) must be shown separately. Accordingly, the Group has adjusted its presentation of
the statement of comprehensive income.
C. IFRS 12, ‘Disclosure of interests in other entities’
The standard integrates the disclosure requirements for subsidiaries, joint arrangements,
associates and unconsolidated structured entities. Also, the Group has disclosed additional
information about its interests in consolidated entities and unconsolidated entities accordingly.
D. IFRS 13, ‘Fair value measurement’
The standard defines fair value as the price that would be received to sell an asset or paid to
transfer a liability in an orderly transaction between market participants at the measurement date.
The standard sets out a framework for measuring fair value from market participants’
perspective, and requires disclosures about fair value measurements. For non-financial assets
only, fair value is determined based on the highest and best use of the asset. Based on the
Group’s assessment, the adoption of the standard has no significant impact on its consolidated
financial statements, and the Group has disclosed additional information about fair value
measurements accordingly.
(2) Effect of new issuances of or amendments to IFRSs as endorsed by the FSC but not yet adopted by
the Group
None.
~11~
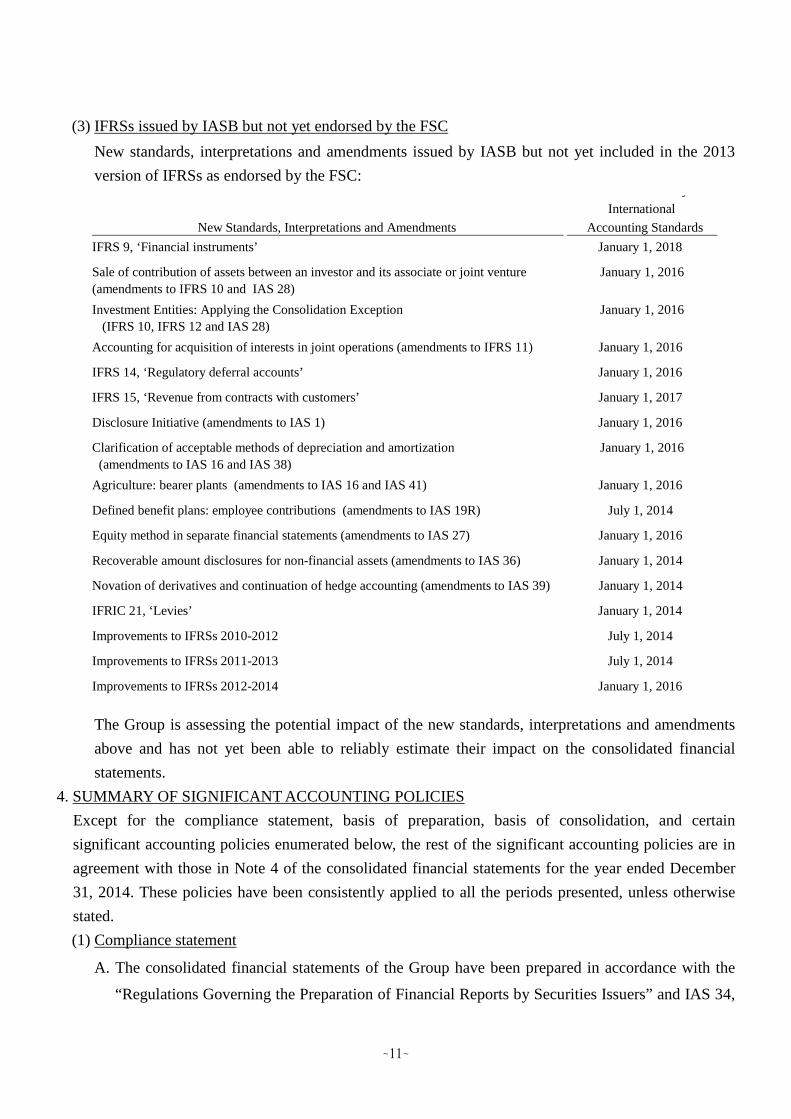
(3) IFRSs issued by IASB but not yet endorsed by the FSC
New standards, interpretations and amendments issued by IASB but not yet included in the 2013
version of IFRSs as endorsed by the FSC:
The Group is assessing the potential impact of the new standards, interpretations and amendments
above and has not yet been able to reliably estimate their impact on the consolidated financial
statements.
4. SUMMARY OF SIGNIFICANT ACCOUNTING POLICIES
Except for the compliance statement, basis of preparation, basis of consolidation, and certain
significant accounting policies enumerated below, the rest of the significant accounting policies are in
agreement with those in Note 4 of the consolidated financial statements for the year ended December
31, 2014. These policies have been consistently applied to all the periods presented, unless otherwise
stated.
(1) Compliance statement
A. The consolidated financial statements of the Group have been prepared in accordance with the
“Regulations Governing the Preparation of Financial Reports by Securities Issuers” and IAS 34,
New Standards, Interpretations and Amendments
Effective date by
International
Accounting Standards
IFRS 9, ‘Financial instruments’ January 1, 2018
Sale of contribution of assets between an investor and its associate or joint venture
(amendments to IFRS 10 and IAS 28)
January 1, 2016
Investment Entities: Applying the Consolidation Exception
(IFRS 10, IFRS 12 and IAS 28)
January 1, 2016
Accounting for acquisition of interests in joint operations (amendments to IFRS 11) January 1, 2016
IFRS 14, ‘Regulatory deferral accounts’ January 1, 2016
IFRS 15, ‘Revenue from contracts with customers’ January 1, 2017
Disclosure Initiative (amendments to IAS 1) January 1, 2016
Clarification of acceptable methods of depreciation and amortization
(amendments to IAS 16 and IAS 38)
January 1, 2016
Agriculture: bearer plants (amendments to IAS 16 and IAS 41) January 1, 2016
Defined benefit plans: employee contributions (amendments to IAS 19R) July 1, 2014
Equity method in separate financial statements (amendments to IAS 27) January 1, 2016
Recoverable amount disclosures for non-financial assets (amendments to IAS 36) January 1, 2014
Novation of derivatives and continuation of hedge accounting (amendments to IAS 39) January 1, 2014
IFRIC 21, ‘Levies’ January 1, 2014
Improvements to IFRSs 2010-2012 July 1, 2014
Improvements to IFRSs 2011-2013 July 1, 2014
Improvements to IFRSs 2012-2014 January 1, 2016
~12~
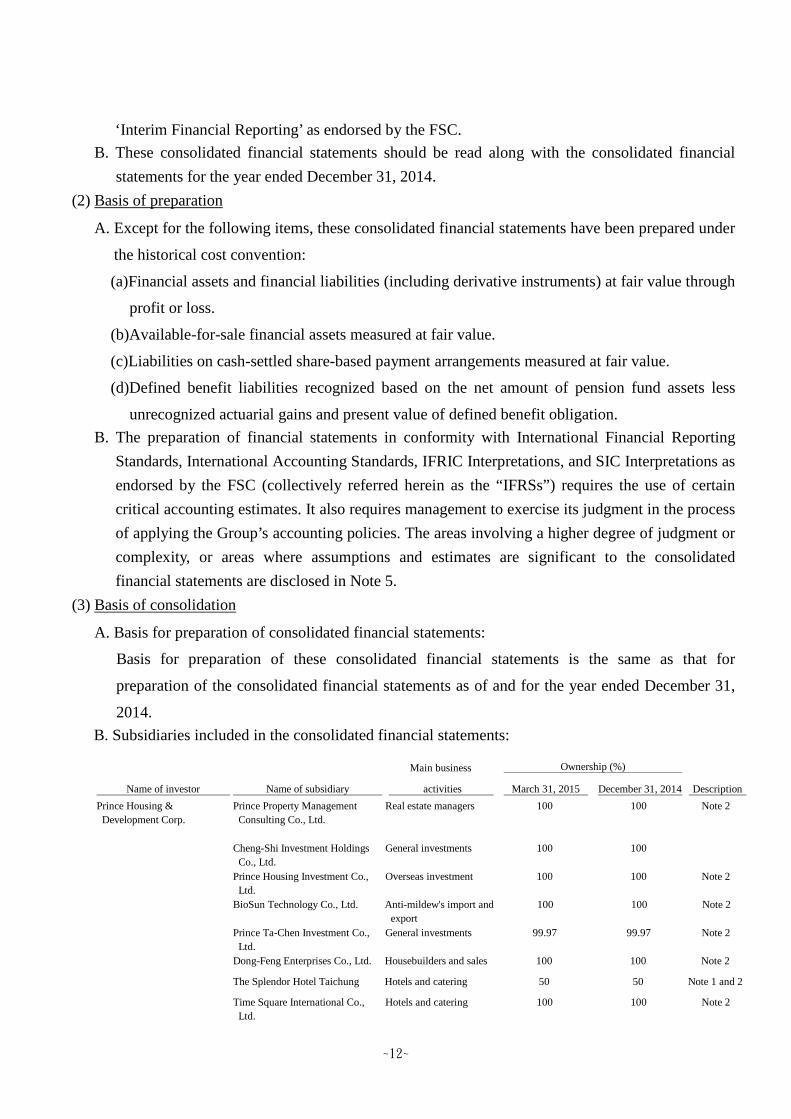
‘Interim Financial Reporting’ as endorsed by the FSC.
B. These consolidated financial statements should be read along with the consolidated financial
statements for the year ended December 31, 2014.
(2) Basis of preparation
A. Except for the following items, these consolidated financial statements have been prepared under
the historical cost convention:
(a)Financial assets and financial liabilities (including derivative instruments) at fair value through
profit or loss.
(b)Available-for-sale financial assets measured at fair value.
(c)Liabilities on cash-settled share-based payment arrangements measured at fair value.
(d)Defined benefit liabilities recognized based on the net amount of pension fund assets less
unrecognized actuarial gains and present value of defined benefit obligation.
B. The preparation of financial statements in conformity with International Financial Reporting
Standards, International Accounting Standards, IFRIC Interpretations, and SIC Interpretations as
endorsed by the FSC (collectively referred herein as the “IFRSs”) requires the use of certain
critical accounting estimates. It also requires management to exercise its judgment in the process
of applying the Group’s accounting policies. The areas involving a higher degree of judgment or
complexity, or areas where assumptions and estimates are significant to the consolidated
financial statements are disclosed in Note 5.
(3) Basis of consolidation
A. Basis for preparation of consolidated financial statements:
Basis for preparation of these consolidated financial statements is the same as that for
preparation of the consolidated financial statements as of and for the year ended December 31,
2014.
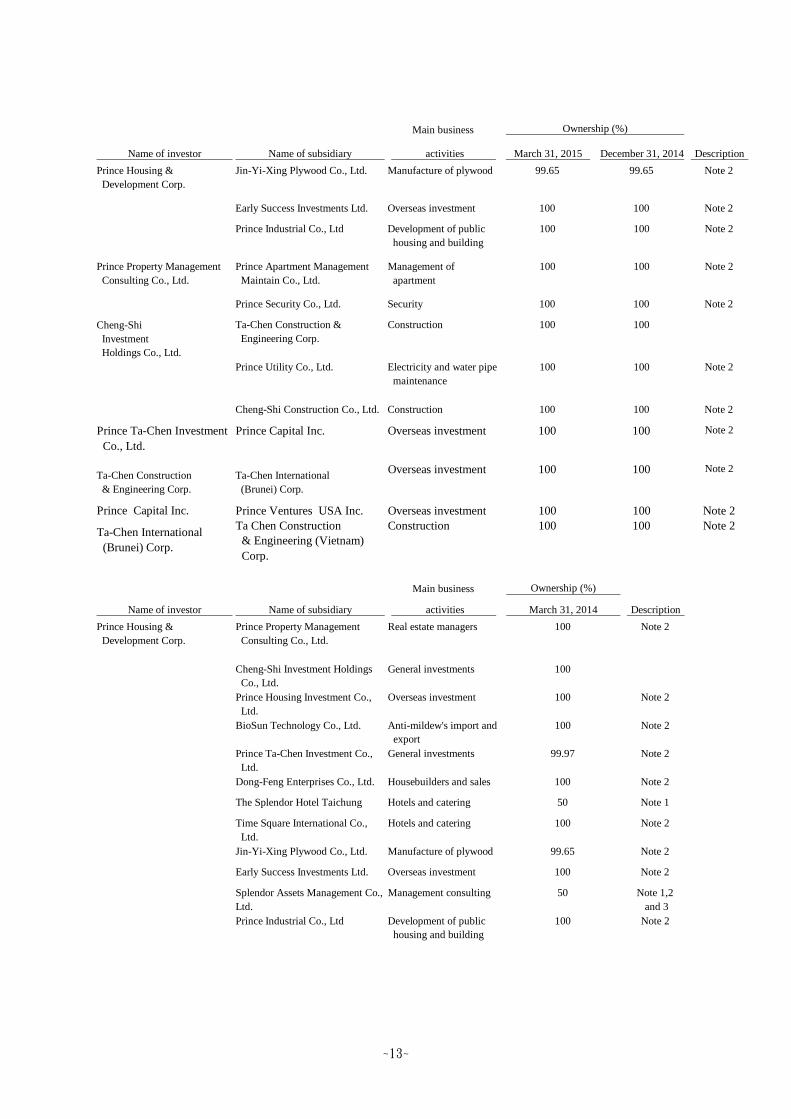
B. Subsidiaries included in the consolidated financial statements:
Main business
Name of investor Name of subsidiary activities March 31, 2015 December 31, 2014 Description
Prince Housing &
Development Corp.
Prince Property Management
Consulting Co., Ltd.
Real estate managers 100 100 Note 2
Cheng-Shi Investment Holdings
Co., Ltd.
General investments 100 100
Prince Housing Investment Co.,
Ltd.
Overseas investment 100 100 Note 2
BioSun Technology Co., Ltd. Anti-mildew's import and
export
100 100 Note 2
Prince Ta-Chen Investment Co.,
Ltd.
General investments 99.97 99.97 Note 2
Dong-Feng Enterprises Co., Ltd. Housebuilders and sales 100 100 Note 2
The Splendor Hotel Taichung Hotels and catering 50 50 Note 1 and 2
Time Square International Co.,
Ltd.
Hotels and catering 100 100 Note 2
Ownership (%)
~13~
Main business
Name of investor Name of subsidiary activities March 31, 2015 December 31, 2014 Description
Prince Housing &
Development Corp.
Jin-Yi-Xing Plywood Co., Ltd. Manufacture of plywood 99.65 99.65 Note 2
Early Success Investments Ltd. Overseas investment 100 100 Note 2
Prince Industrial Co., Ltd Development of public
housing and building
100 100 Note 2
Prince Property Management
Consulting Co., Ltd.
Prince Apartment Management
Maintain Co., Ltd.
Management of
apartment
100 100 Note 2
Prince Security Co., Ltd. Security 100 100 Note 2
Cheng-Shi
Investment
Holdings Co., Ltd.
Ta-Chen Construction &
Engineering Corp.
Construction 100 100
Prince Utility Co., Ltd. Electricity and water pipe
maintenance
100 100 Note 2
Cheng-Shi Construction Co., Ltd. Construction 100 100 Note 2
Prince Ta-Chen Investment
Co., Ltd.
Prince Capital Inc. Overseas investment 100 100 Note 2
Ta-Chen Construction
& Engineering Corp.
Ta-Chen International
(Brunei) Corp.
Overseas investment 100 100 Note 2
Prince Capital Inc. Prince Ventures USA Inc. Overseas investment 100 100 Note 2
Ta Chen Construction& Engineering (Vietnam)
Corp.
Note 2
Ownership (%)
Ta-Chen International
(Brunei) Corp.
Construction 100 100
Main business Ownership (%)
Name of investor Name of subsidiary activities March 31, 2014 Description
Prince Housing &
Development Corp.
Prince Property Management
Consulting Co., Ltd.
Real estate managers 100 Note 2
Cheng-Shi Investment Holdings
Co., Ltd.
General investments 100
Prince Housing Investment Co.,
Ltd.
Overseas investment 100 Note 2
BioSun Technology Co., Ltd. Anti-mildew's import and
export
100 Note 2
Prince Ta-Chen Investment Co.,
Ltd.
General investments 99.97 Note 2
Dong-Feng Enterprises Co., Ltd. Housebuilders and sales 100 Note 2
The Splendor Hotel Taichung Hotels and catering 50 Note 1
Time Square International Co.,
Ltd.
Hotels and catering 100 Note 2
Jin-Yi-Xing Plywood Co., Ltd. Manufacture of plywood 99.65 Note 2
Early Success Investments Ltd. Overseas investment 100 Note 2
Splendor Assets Management Co.,
Ltd.
Management consulting 50 Note 1,2
and 3
Prince Industrial Co., Ltd Development of public
housing and building
100 Note 2
~14~
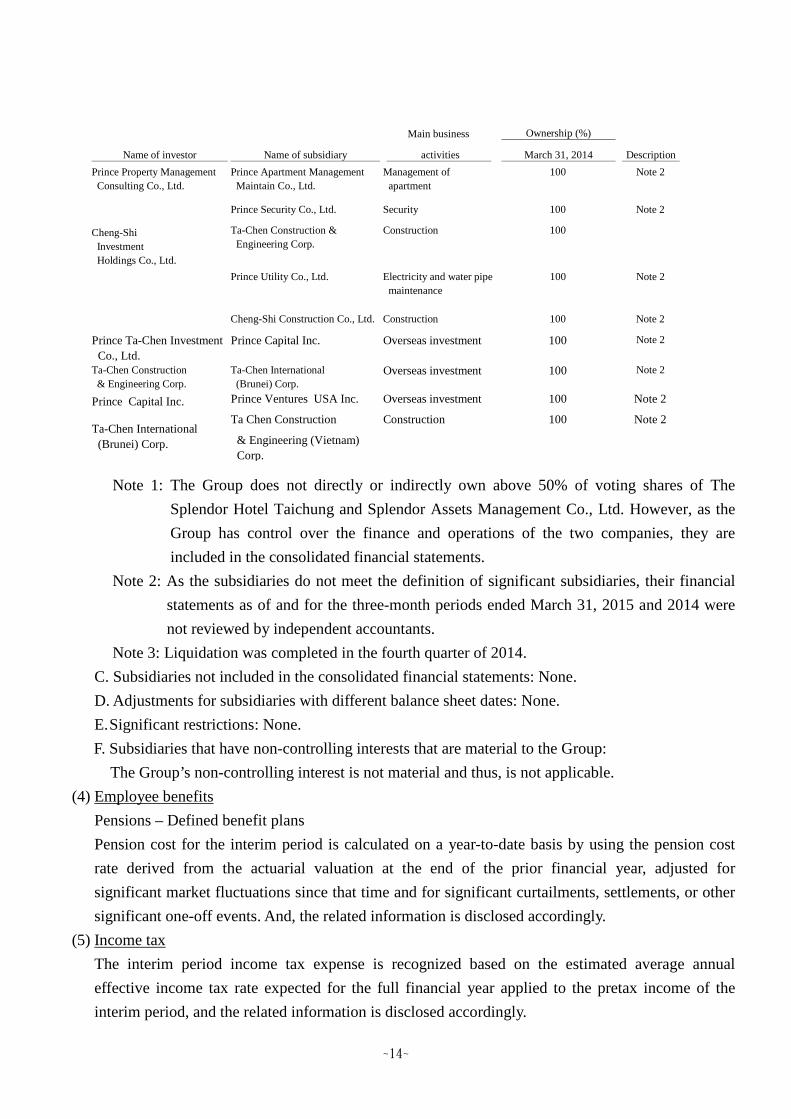
Note 1: The Group does not directly or indirectly own above 50% of voting shares of The
Splendor Hotel Taichung and Splendor Assets Management Co., Ltd. However, as the
Group has control over the finance and operations of the two companies, they are
included in the consolidated financial statements.
Note 2: As the subsidiaries do not meet the definition of significant subsidiaries, their financial
statements as of and for the three-month periods ended March 31, 2015 and 2014 were
not reviewed by independent accountants.
Note 3: Liquidation was completed in the fourth quarter of 2014.
C. Subsidiaries not included in the consolidated financial statements: None.
D. Adjustments for subsidiaries with different balance sheet dates: None.
E.Significant restrictions: None.
F. Subsidiaries that have non-controlling interests that are material to the Group:
The Group’s non-controlling interest is not material and thus, is not applicable.
(4) Employee benefits
Pensions – Defined benefit plans
Pension cost for the interim period is calculated on a year-to-date basis by using the pension cost
rate derived from the actuarial valuation at the end of the prior financial year, adjusted for
significant market fluctuations since that time and for significant curtailments, settlements, or other
significant one-off events. And, the related information is disclosed accordingly.
(5) Income tax
The interim period income tax expense is recognized based on the estimated average annual
effective income tax rate expected for the full financial year applied to the pretax income of the
interim period, and the related information is disclosed accordingly.
Main business Ownership (%)
Name of investor Name of subsidiary activities March 31, 2014 Description
Prince Property Management
Consulting Co., Ltd.
Prince Apartment Management
Maintain Co., Ltd.
Management of
apartment
100 Note 2
Prince Security Co., Ltd. Security 100 Note 2
Cheng-Shi
Investment
Holdings Co., Ltd.
Ta-Chen Construction &
Engineering Corp.
Construction 100
Prince Utility Co., Ltd. Electricity and water pipe
maintenance
100 Note 2
Cheng-Shi Construction Co., Ltd. Construction 100 Note 2
Prince Ta-Chen Investment
Co., Ltd.
Prince Capital Inc. Overseas investment 100 Note 2
Ta-Chen Construction
& Engineering Corp.
Ta-Chen International
(Brunei) Corp.Overseas investment 100 Note 2
Prince Capital Inc. Prince Ventures USA Inc. Overseas investment 100 Note 2
Ta Chen Construction
& Engineering (Vietnam)
Corp.
Ta-Chen International
(Brunei) Corp.
Construction 100 Note 2
~15~
5. CRITICAL ACCOUNTING JUDGEMENTS, ESTIMATES AND KEY SOURCES OF
ASSUMPTION UNCERTAINTY
The preparation of these consolidated financial statements requires management to make critical
judgements in applying the Group’s accounting policies and make critical assumptions and estimates
concerning future events. Assumptions and estimates are continually evaluated and adjusted based on
historical experience and other factors. Su ch assumptions and estimates have a significant risk of
causing a material adjustment to the carrying amounts of assets and liabilities within the next financial
year. The above information is addressed below:
(1) Critical judgements in applying the Group’s accounting policies
There is no significant change during the period. Please refer to Note 5 of the 2014 consolidated
financial statements.
(2) Critical accounting estimates and assumptions
A. Impairment assessment of tangible and intangible assets (excluding goodwill)
The Group assesses impairment based on its subjective judgement and determines the separate
cash flows of a specific group of assets, useful lives of assets and the future possible income and
expenses arising from the assets depending on how assets are utilised and industrial
characteristics. Any changes of economic circumstances or estimates due to the change of
Group strategy might cause material impairment on assets in the future.
B. Impairment assessment of investments accounted for under the equity method
The Group assesses the impairment of an investment accounted for under the equity method as
soon as there is any indication that it might have been impaired and its carrying amount cannot
be recoverable. The Group assesses the recoverable amounts of an investment accounted for
under the equity method based on the present value of the Group’s share of expected future cash
flows of the investee, and analyzes the reasonableness of related assumptions.
As of March 31, 2015, the Group’s investments accounted for under the equity method, net of
impairment loss, amounted to $2,215,574.
C. Realisability of deferred income tax assets
Deferred income tax assets are recognized only to the extent that it is probable that future taxable
profit will be available against which the deductible temporary differences can be utilized.
Assessment of the realisability of deferred income tax assets involves critical accounting
judgements and estimates of the management, including the assumptions of expected future sales
revenue growth rate and profit rate, tax exempt duration, available tax credits, tax planning, etc.
Any variations in global economic environment, industrial environment, and laws and regulations
might cause material adjustments to deferred income tax assets.
As of March 31, 2015, the Group recognized deferred income tax assets amounting to $107,970.
~16~
D. Evaluation of inventories
As inventories are stated at the lower of cost and net realisable value, the Group must determine
the net realisable value of inventories on balance sheet date using judgements and estimates.
Due to the rapid technology innovation, the Group evaluates the amounts of normal inventory
consumption, obsolete inventories or inventories without market selling value on balance sheet
date, and writes down the cost of inventories to the net realisable value. Such an evaluation of
inventories is principally based on the demand for the products within the specified period in the
future. Therefore, there might be material changes to the evaluation.
As of March 31, 2015, the carrying amount of inventories was $21,523,036.
E. Calculation of net defined benefit liabilities
When calculating the present value of defined pension obligations, the Group must apply
judgements and estimates to determine the actuarial assumptions on balance sheet date, including
discount rates and expected rate of return on plan assets. Any changes in these assumptions could
significantly impact the carrying amount of defined pension obligations.
As of March 31, 2015, the carrying amount of accrued pension obligations was $133,405.
F. Financial assets—fair value measurement of unlisted stocks without active market
The fair value of unlisted stocks held by the Group that are not traded in an active market is
determined considering those companies’ recent fund raising activities and technical development
status, fair value assessment of other companies of the same type, market conditions and other
economic indicators existing on balance sheet date. Any changes in these judgements and
estimates will impact the fair value measurement of these unlisted stocks. Please refer to Note
12(3) for the financial instruments fair value information.
As of March 31, 2015, the carrying amount of unlisted stocks was $285,691.
6. DETAILS OF SIGNIFICANT ACCOUNTS
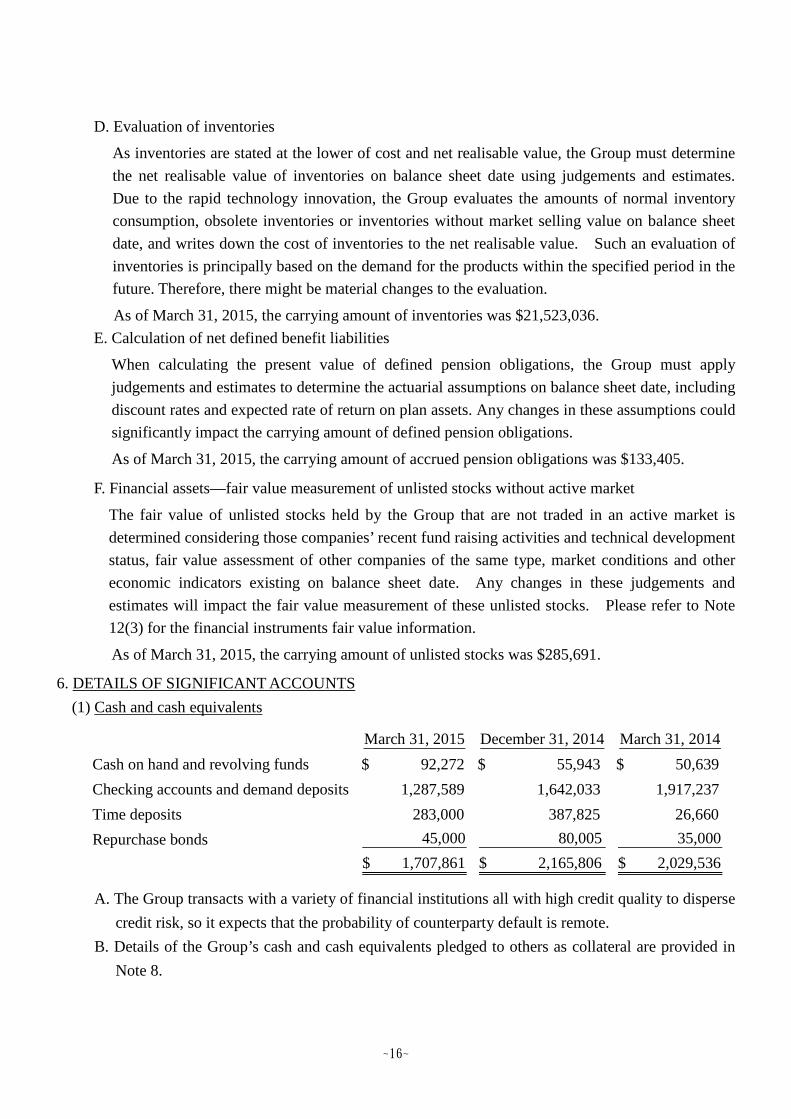
(1) Cash and cash equivalents
A. The Group transacts with a variety of financial institutions all with high credit quality to disperse
credit risk, so it expects that the probability of counterparty default is remote.
B. Details of the Group’s cash and cash equivalents pledged to others as collateral are provided in
Note 8.
March 31, 2015 December 31, 2014 March 31, 2014
Cash on hand and revolving funds $ 92,272 $ 55,943 $ 50,639
Checking accounts and demand deposits 1,287,589 1,642,033 1,917,237
Time deposits 283,000 387,825 26,660
Repurchase bonds 45,000 80,005 35,000
$ 1,707,861 $ 2,165,806 $ 2,029,536
~17~
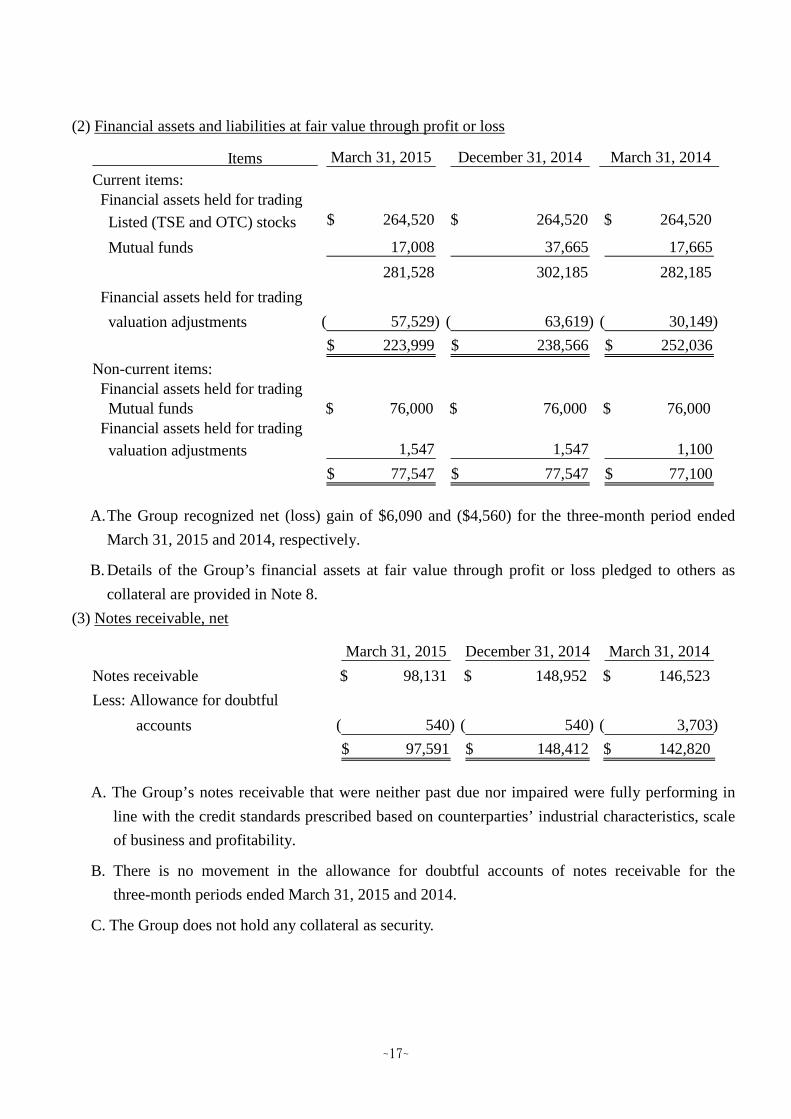
(2) Financial assets and liabilities at fair value through profit or loss
A.The Group recognized net (loss) gain of $6,090 and ($4,560) for the three-month period ended
March 31, 2015 and 2014, respectively.
B. Details of the Group’s financial assets at fair value through profit or loss pledged to others as
collateral are provided in Note 8.
(3) Notes receivable, net
A. The Group’s notes receivable that were neither past due nor impaired were fully performing in
line with the credit standards prescribed based on counterparties’ industrial characteristics, scale
of business and profitability.
B. There is no movement in the allowance for doubtful accounts of notes receivable for the
three-month periods ended March 31, 2015 and 2014.
C. The Group does not hold any collateral as security.
Items March 31, 2015 December 31, 2014 March 31, 2014
Current items:Financial assets held for trading
Listed (TSE and OTC) stocks 264,520$ 264,520$ 264,520$
Mutual funds 17,008 37,665 17,665
281,528 302,185 282,185
Financial assets held for trading
valuation adjustments 57,529)( 63,619)( 30,149)(
223,999$ 238,566$ 252,036$
Non-current items:Financial assets held for trading
Mutual funds 76,000$ 76,000$ 76,000$Financial assets held for trading
valuation adjustments 1,547 1,547 1,100
77,547$ 77,547$ 77,100$
March 31, 2015 December 31, 2014 March 31, 2014
Notes receivable $ 98,131 $ 148,952 $ 146,523
Less: Allowance for doubtful
accounts 540)( 540)( 3,703)(
97,591$ 148,412$ $ 142,820
~18~
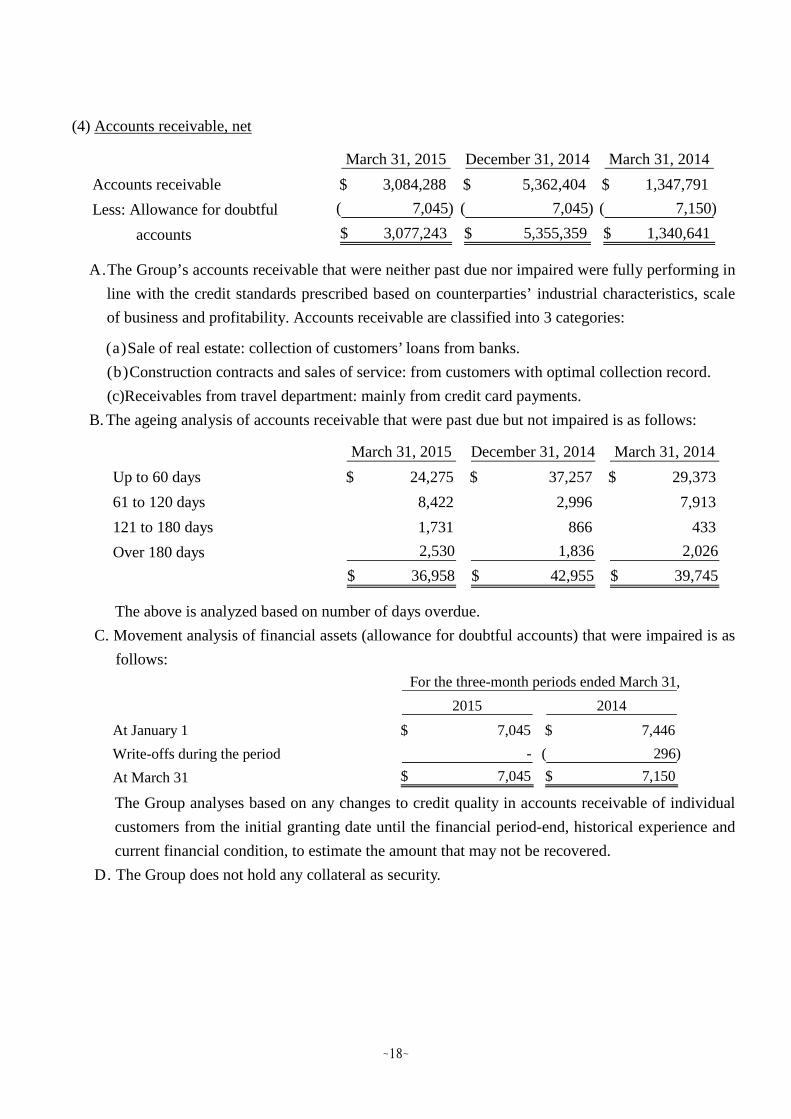
(4) Accounts receivable, net
A.The Group’s accounts receivable that were neither past due nor impaired were fully performing in
line with the credit standards prescribed based on counterparties’ industrial characteristics, scale
of business and profitability. Accounts receivable are classified into 3 categories:
(a)Sale of real estate: collection of customers’ loans from banks.
(b)Construction contracts and sales of service: from customers with optimal collection record.
(c)Receivables from travel department: mainly from credit card payments.
B. The ageing analysis of accounts receivable that were past due but not impaired is as follows:
The above is analyzed based on number of days overdue.
C. Movement analysis of financial assets (allowance for doubtful accounts) that were impaired is as
follows:
The Group analyses based on any changes to credit quality in accounts receivable of individual
customers from the initial granting date until the financial period-end, historical experience and
current financial condition, to estimate the amount that may not be recovered.
D. The Group does not hold any collateral as security.
March 31, 2015 December 31, 2014 March 31, 2014
Accounts receivable $ 3,084,288 $ 5,362,404 $ 1,347,791
Less: Allowance for doubtful ( 7,045) ( 7,045) ( 7,150)
accounts $ 3,077,243 $ 5,355,359 $ 1,340,641
March 31, 2015 December 31, 2014 March 31, 2014
Up to 60 days 24,275$ 37,257$ 29,373$
61 to 120 days 8,422 2,996 7,913
121 to 180 days 1,731 866 433
Over 180 days 2,530 1,836 2,026
36,958$ 42,955$ 39,745$
2015 2014
At January 1 $ 7,045 $ 7,446
Write-offs during the period - 296)(
At March 31 $ 7,045 $ 7,150
For the three-month periods ended March 31,
~19~
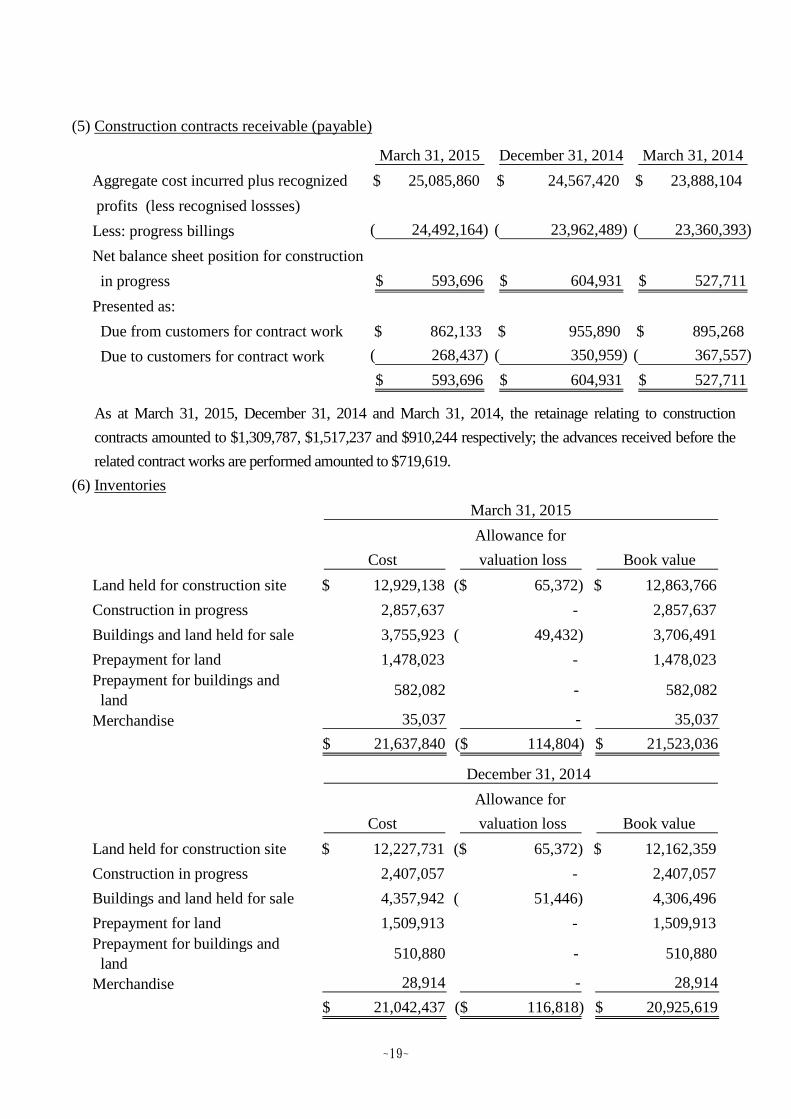
(5) Construction contracts receivable (payable)
As at March 31, 2015, December 31, 2014 and March 31, 2014, the retainage relating to construction
contracts amounted to $1,309,787, $1,517,237 and $910,244 respectively; the advances received before the
related contract works are performed amounted to $719,619.
(6) Inventories
March 31, 2015 December 31, 2014 March 31, 2014
Aggregate cost incurred plus recognized $ 25,085,860 $ 24,567,420 $ 23,888,104
profits (less recognised lossses)
Less: progress billings 24,492,164)( 23,962,489)( 23,360,393)(
Net balance sheet position for construction
in progress 593,696$ 604,931$ 527,711$
Presented as:
Due from customers for contract work 862,133$ 955,890$ 895,268$
Due to customers for contract work 268,437)( 350,959)( 367,557)(
593,696$ 604,931$ 527,711$
Allowance for
Cost valuation loss Book value
Land held for construction site $ 12,929,138 ($ 65,372) $ 12,863,766
Construction in progress 2,857,637 - 2,857,637
Buildings and land held for sale 3,755,923 ( 49,432) 3,706,491
Prepayment for land 1,478,023 - 1,478,023
Prepayment for buildings and
land582,082 - 582,082
Merchandise 35,037 - 35,037
$ 21,637,840 ($ 114,804) $ 21,523,036
March 31, 2015
Allowance for
Cost valuation loss Book value
Land held for construction site $ 12,227,731 ($ 65,372) $ 12,162,359
Construction in progress 2,407,057 - 2,407,057
Buildings and land held for sale 4,357,942 ( 51,446) 4,306,496
Prepayment for land 1,509,913 - 1,509,913
Prepayment for buildings and
land510,880 - 510,880
Merchandise 28,914 - 28,914
$ 21,042,437 ($ 116,818) $ 20,925,619
December 31, 2014
~20~
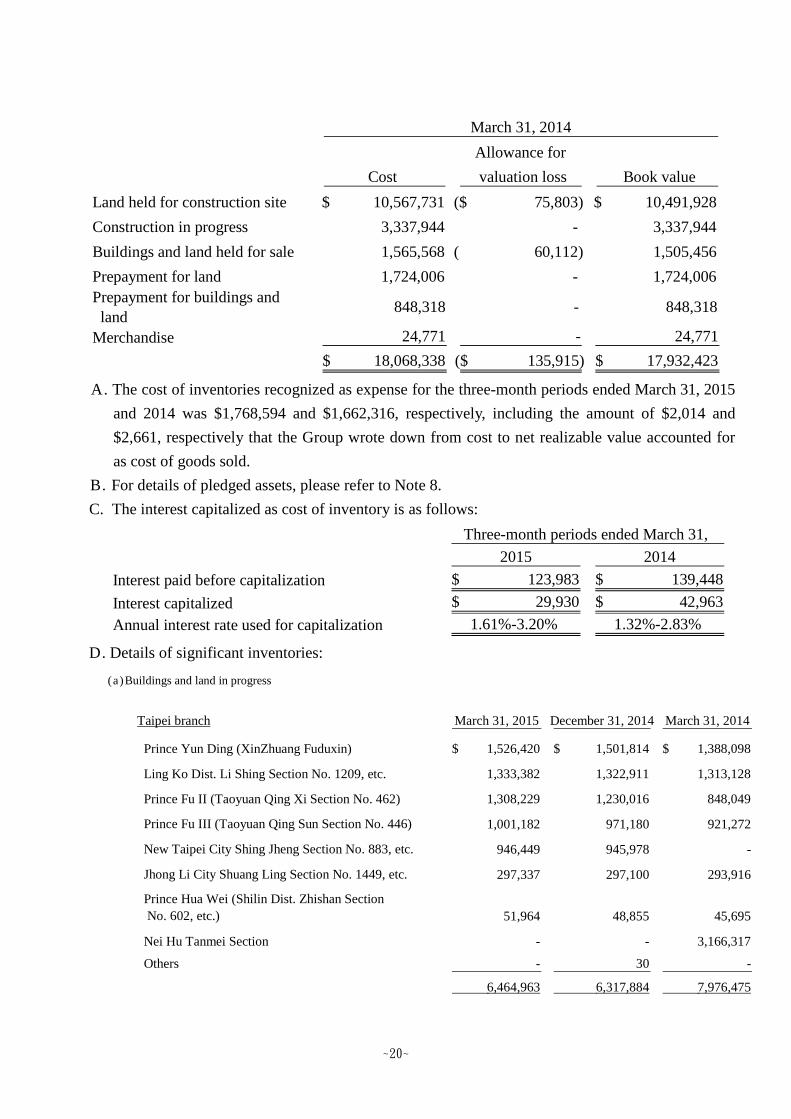
A. The cost of inventories recognized as expense for the three-month periods ended March 31, 2015
and 2014 was $1,768,594 and $1,662,316, respectively, including the amount of $2,014 and
$2,661, respectively that the Group wrote down from cost to net realizable value accounted for
as cost of goods sold.
B. For details of pledged assets, please refer to Note 8.
C. The interest capitalized as cost of inventory is as follows:
D. Details of significant inventories:
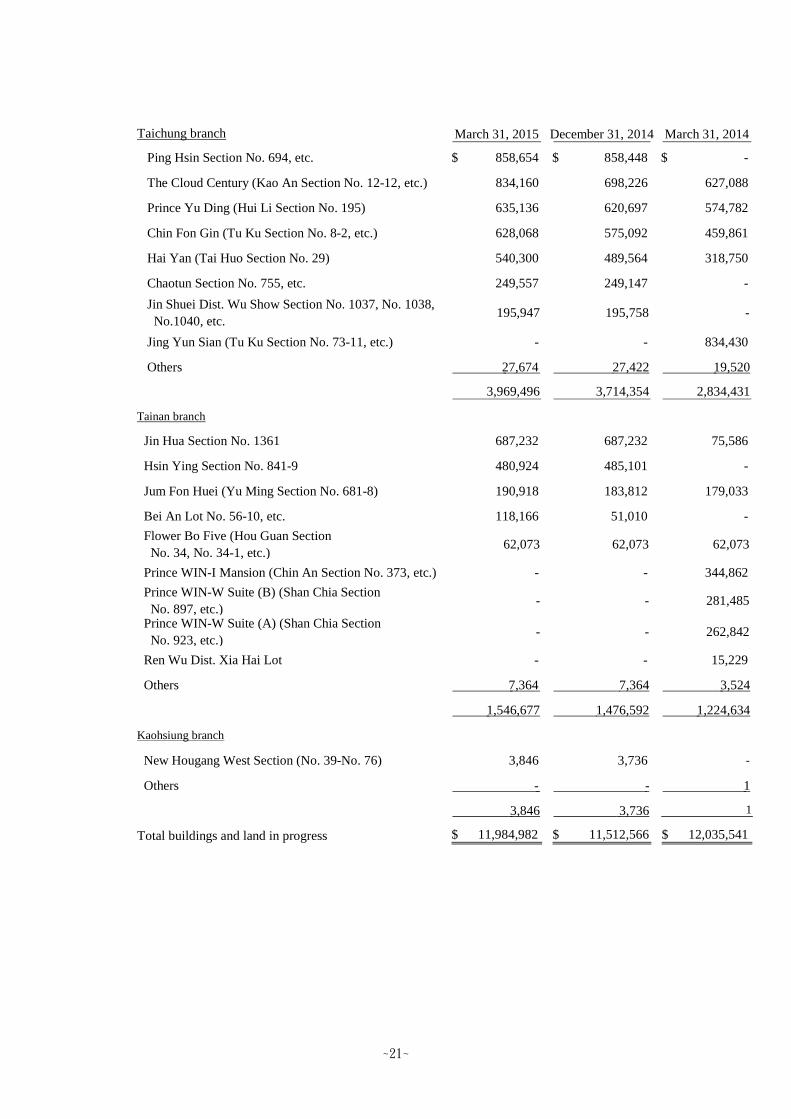
(a)Buildings and land in progress
Allowance for
Cost valuation loss Book value
Land held for construction site $ 10,567,731 ($ 75,803) $ 10,491,928
Construction in progress 3,337,944 - 3,337,944
Buildings and land held for sale 1,565,568 ( 60,112) 1,505,456
Prepayment for land 1,724,006 - 1,724,006
Prepayment for buildings and
land848,318 - 848,318
Merchandise 24,771 - 24,771
$ 18,068,338 ($ 135,915) $ 17,932,423
March 31, 2014
2015 2014
123,983$ 139,448$
Interest capitalized 29,930$ 42,963$
1.61%-3.20% 1.32%-2.83%
Three-month periods ended March 31,
Interest paid before capitalization
Annual interest rate used for capitalization
Taipei branch March 31, 2015 December 31, 2014 March 31, 2014
Prince Yun Ding (XinZhuang Fuduxin) 1,526,420$ 1,501,814$ 1,388,098$
Ling Ko Dist. Li Shing Section No. 1209, etc. 1,333,382 1,322,911 1,313,128
Prince Fu II (Taoyuan Qing Xi Section No. 462) 1,308,229 1,230,016 848,049
Prince Fu III (Taoyuan Qing Sun Section No. 446) 1,001,182 971,180 921,272
New Taipei City Shing Jheng Section No. 883, etc. 946,449 945,978 -
Jhong Li City Shuang Ling Section No. 1449, etc. 297,337 297,100 293,916
Prince Hua Wei (Shilin Dist. Zhishan Section
No. 602, etc.) 51,964 48,855 45,695
Nei Hu Tanmei Section - - 3,166,317
Others - 30 -
6,464,963 6,317,884 7,976,475
~21~
Taichung branch March 31, 2015 December 31, 2014 March 31, 2014
Ping Hsin Section No. 694, etc. 858,654$ 858,448$ -$
The Cloud Century (Kao An Section No. 12-12, etc.) 834,160 698,226 627,088
Prince Yu Ding (Hui Li Section No. 195) 635,136 620,697 574,782
Chin Fon Gin (Tu Ku Section No. 8-2, etc.) 628,068 575,092 459,861
Hai Yan (Tai Huo Section No. 29) 540,300 489,564 318,750
Chaotun Section No. 755, etc. 249,557 249,147 -
Jin Shuei Dist. Wu Show Section No. 1037, No. 1038,
No.1040, etc.195,947 195,758 -
Jing Yun Sian (Tu Ku Section No. 73-11, etc.) - - 834,430
Others 27,674 27,422 19,520
3,969,496 3,714,354 2,834,431
Tainan branch
Jin Hua Section No. 1361 687,232 687,232 75,586
Hsin Ying Section No. 841-9 480,924 485,101 -
Jum Fon Huei (Yu Ming Section No. 681-8) 190,918 183,812 179,033
Bei An Lot No. 56-10, etc. 118,166 51,010 -
Flower Bo Five (Hou Guan Section
No. 34, No. 34-1, etc.)62,073 62,073 62,073
Prince WIN-I Mansion (Chin An Section No. 373, etc.) - - 344,862
Prince WIN-W Suite (B) (Shan Chia Section
No. 897, etc.)- - 281,485
Prince WIN-W Suite (A) (Shan Chia Section
No. 923, etc.)- - 262,842
Ren Wu Dist. Xia Hai Lot - - 15,229
Others 7,364 7,364 3,524
1,546,677 1,476,592 1,224,634
Kaohsiung branch
New Hougang West Section (No. 39-No. 76) 3,846 3,736 -
Others - - 1
3,846 3,736 1
Total buildings and land in progress $ 11,984,982 $ 11,512,566 $ 12,035,541
~22~
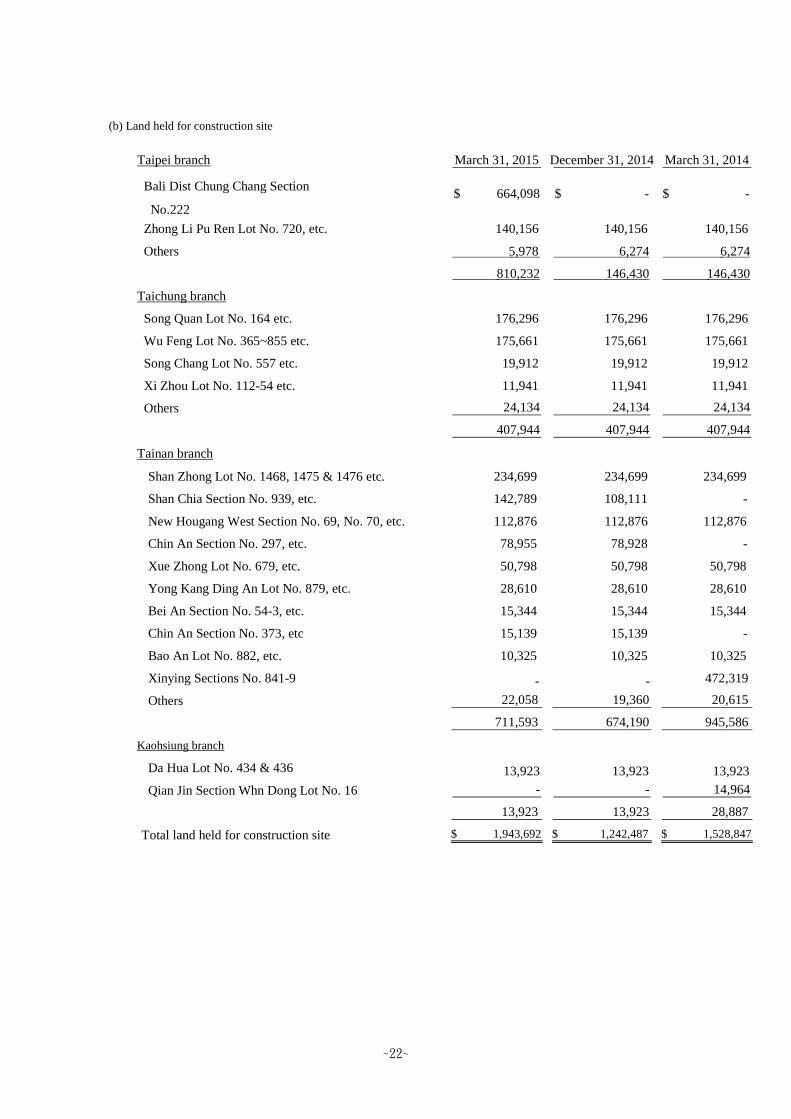
(b) Land held for construction site
Taipei branch March 31, 2015 December 31, 2014 March 31, 2014
Bali Dist Chung Chang Section
No.222
Zhong Li Pu Ren Lot No. 720, etc. 140,156 140,156 140,156
Others 5,978 6,274 6,274
810,232 146,430 146,430
Taichung branch
Song Quan Lot No. 164 etc. 176,296 176,296 176,296
Wu Feng Lot No. 365~855 etc. 175,661 175,661 175,661
Song Chang Lot No. 557 etc. 19,912 19,912 19,912
Xi Zhou Lot No. 112-54 etc. 11,941 11,941 11,941
Others 24,134 24,134 24,134
407,944 407,944 407,944
Tainan branch
Shan Zhong Lot No. 1468, 1475 & 1476 etc. 234,699 234,699 234,699
Shan Chia Section No. 939, etc. 142,789 108,111 -
New Hougang West Section No. 69, No. 70, etc. 112,876 112,876 112,876
Chin An Section No. 297, etc. 78,955 78,928 -
Xue Zhong Lot No. 679, etc. 50,798 50,798 50,798
Yong Kang Ding An Lot No. 879, etc. 28,610 28,610 28,610
Bei An Section No. 54-3, etc. 15,344 15,344 15,344
Chin An Section No. 373, etc 15,139 15,139 -
Bao An Lot No. 882, etc. 10,325 10,325 10,325
Xinying Sections No. 841-9 - - 472,319
Others 22,058 19,360 20,615
711,593 674,190 945,586
Kaohsiung branch
Da Hua Lot No. 434 & 436 13,923 13,923 13,923
Qian Jin Section Whn Dong Lot No. 16 - - 14,964
13,923 13,923 28,887
Total land held for construction site $ 1,943,692 $ 1,242,487 $ 1,528,847
664,098$ -$ -$
~23~
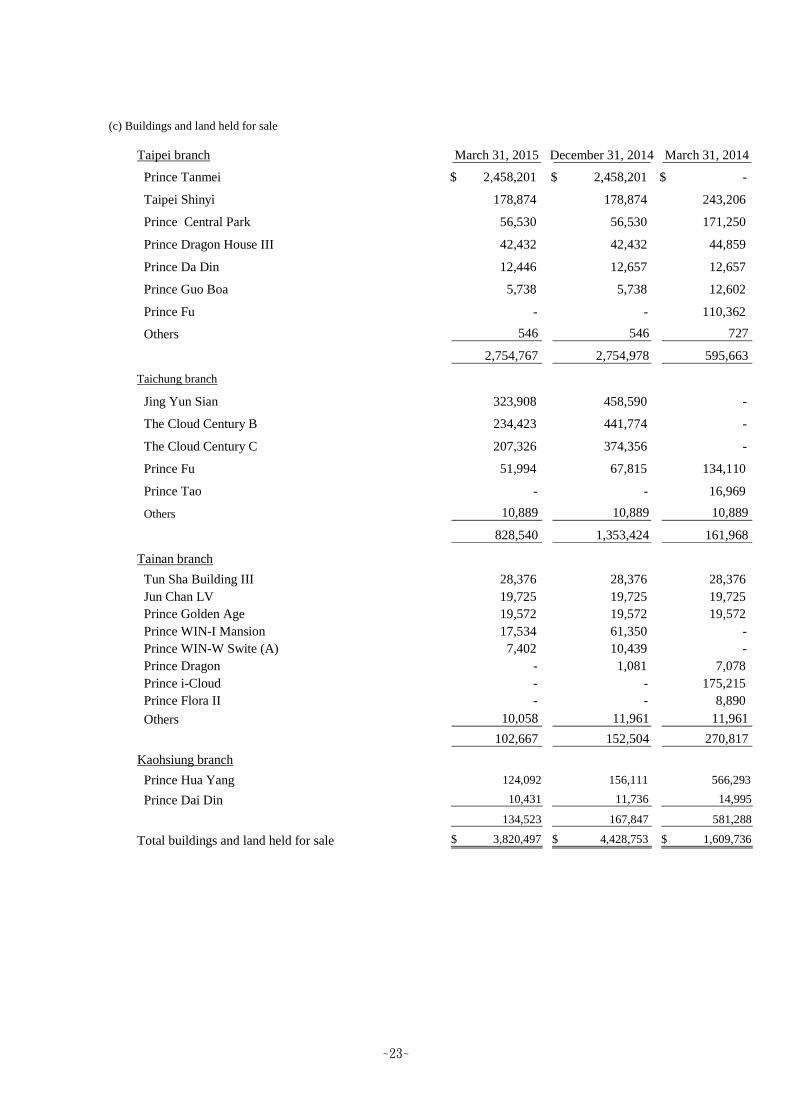
(c) Buildings and land held for sale
Taipei branch March 31, 2015 December 31, 2014 March 31, 2014
Prince Tanmei $ 2,458,201 $ 2,458,201 $ -
Taipei Shinyi 178,874 178,874 243,206
Prince Central Park 56,530 56,530 171,250
Prince Dragon House III 42,432 42,432 44,859
Prince Da Din 12,446 12,657 12,657
Prince Guo Boa 5,738 5,738 12,602
Prince Fu - - 110,362
Others 546 546 727
2,754,767 2,754,978 595,663
Taichung branch
Jing Yun Sian 323,908 458,590 -
The Cloud Century B 234,423 441,774 -
The Cloud Century C 207,326 374,356 -
Prince Fu 51,994 67,815 134,110
Prince Tao - - 16,969
Others 10,889 10,889 10,889
828,540 1,353,424 161,968
Tainan branch
Tun Sha Building III 28,376 28,376 28,376
Jun Chan LV 19,725 19,725 19,725
Prince Golden Age 19,572 19,572 19,572
Prince WIN-I Mansion 17,534 61,350 -
Prince WIN-W Swite (A) 7,402 10,439 -
Prince Dragon - 1,081 7,078
Prince i-Cloud - - 175,215
Prince Flora II - - 8,890
Others 10,058 11,961 11,961
102,667 152,504 270,817
Kaohsiung branch
Prince Hua Yang 124,092 156,111 566,293
Prince Dai Din 10,431 11,736 14,995
134,523 167,847 581,288
Total buildings and land held for sale $ 3,820,497 $ 4,428,753 $ 1,609,736
~24~
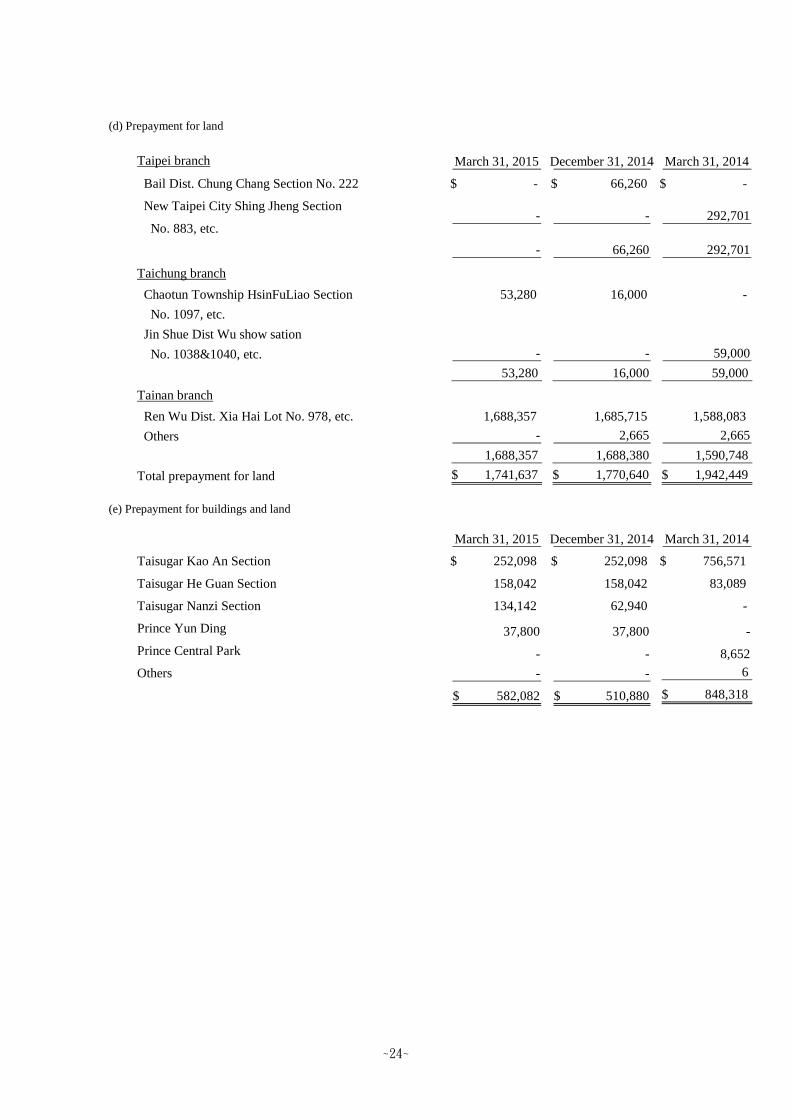
(d) Prepayment for land
(e) Prepayment for buildings and land
Taipei branch March 31, 2015 December 31, 2014 March 31, 2014
Bail Dist. Chung Chang Section No. 222 $ - $ 66,260 $ -
New Taipei City Shing Jheng Section
No. 883, etc.
- 66,260 292,701
Taichung branch
Chaotun Township HsinFuLiao Section 53,280 16,000 -
No. 1097, etc.
Jin Shue Dist Wu show sation
No. 1038&1040, etc. - - 59,000
53,280 16,000 59,000
Tainan branch
Ren Wu Dist. Xia Hai Lot No. 978, etc. 1,688,357 1,685,715 1,588,083
Others - 2,665 2,665
1,688,357 1,688,380 1,590,748
Total prepayment for land $ 1,741,637 $ 1,770,640 $ 1,942,449
- - 292,701
March 31, 2015 December 31, 2014 March 31, 2014
Taisugar Kao An Section $ 252,098 $ 252,098 $ 756,571
Taisugar He Guan Section 158,042 158,042 83,089
Taisugar Nanzi Section 134,142 62,940 -
Prince Yun Ding 37,800 37,800 -
Prince Central Park - - 8,652
Others - - 6
582,082$ 510,880$ $ 848,318
~25~
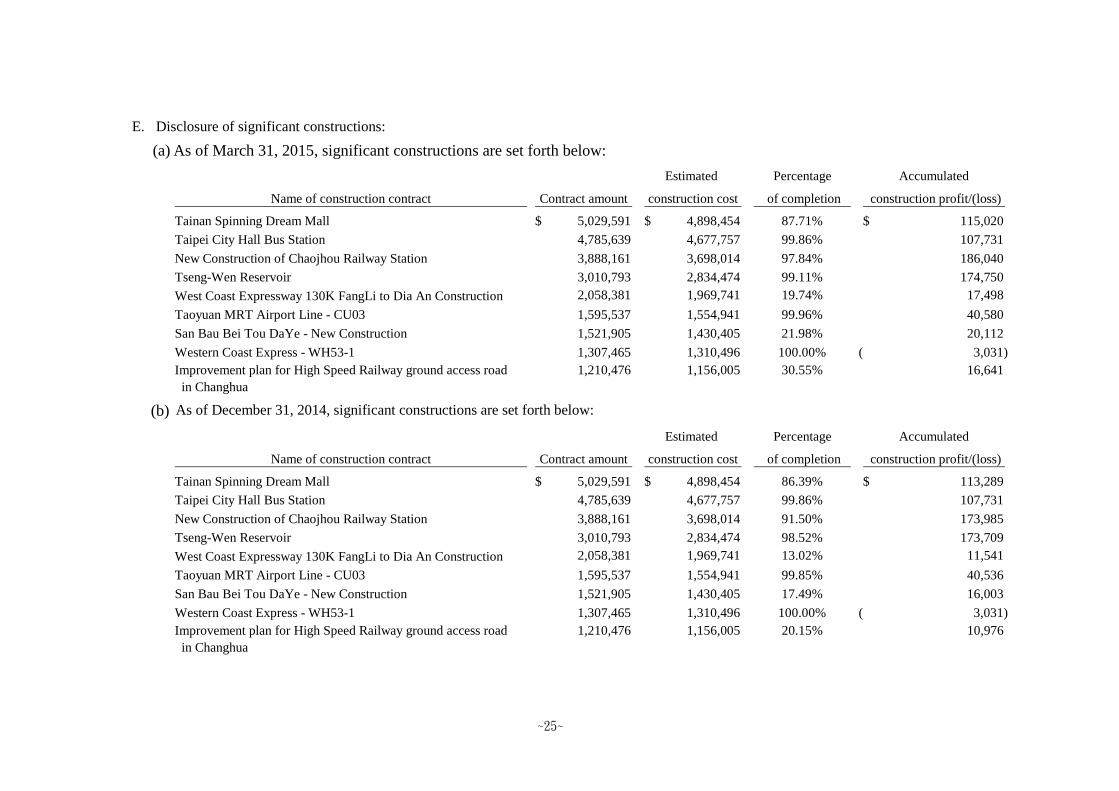
E. Disclosure of significant constructions:
(a) As of March 31, 2015, significant constructions are set forth below:
(b) As of December 31, 2014, significant constructions are set forth below:
Estimated Percentage Accumulated
Name of construction contract Contract amount construction cost of completion construction profit/(loss)
Tainan Spinning Dream Mall 5,029,591$ 4,898,454$ 87.71% 115,020$
Taipei City Hall Bus Station 4,785,639 4,677,757 99.86% 107,731
New Construction of Chaojhou Railway Station 3,888,161 3,698,014 97.84% 186,040
Tseng-Wen Reservoir 3,010,793 2,834,474 99.11% 174,750
West Coast Expressway 130K FangLi to Dia An Construction 2,058,381 1,969,741 19.74% 17,498
Taoyuan MRT Airport Line - CU03 1,595,537 1,554,941 99.96% 40,580
San Bau Bei Tou DaYe - New Construction 1,521,905 1,430,405 21.98% 20,112
Western Coast Express - WH53-1 1,307,465 1,310,496 100.00% 3,031)(
Improvement plan for High Speed Railway ground access road
in Changhua
1,210,476 1,156,005 30.55% 16,641
Estimated Percentage Accumulated
Name of construction contract Contract amount construction cost of completion construction profit/(loss)
Tainan Spinning Dream Mall 5,029,591$ 4,898,454$ 86.39% 113,289$
Taipei City Hall Bus Station 4,785,639 4,677,757 99.86% 107,731
New Construction of Chaojhou Railway Station 3,888,161 3,698,014 91.50% 173,985
Tseng-Wen Reservoir 3,010,793 2,834,474 98.52% 173,709
West Coast Expressway 130K FangLi to Dia An Construction 2,058,381 1,969,741 13.02% 11,541
Taoyuan MRT Airport Line - CU03 1,595,537 1,554,941 99.85% 40,536
San Bau Bei Tou DaYe - New Construction 1,521,905 1,430,405 17.49% 16,003
Western Coast Express - WH53-1 1,307,465 1,310,496 100.00% 3,031)(
Improvement plan for High Speed Railway ground access road
in Changhua
1,210,476 1,156,005 20.15% 10,976
~26~
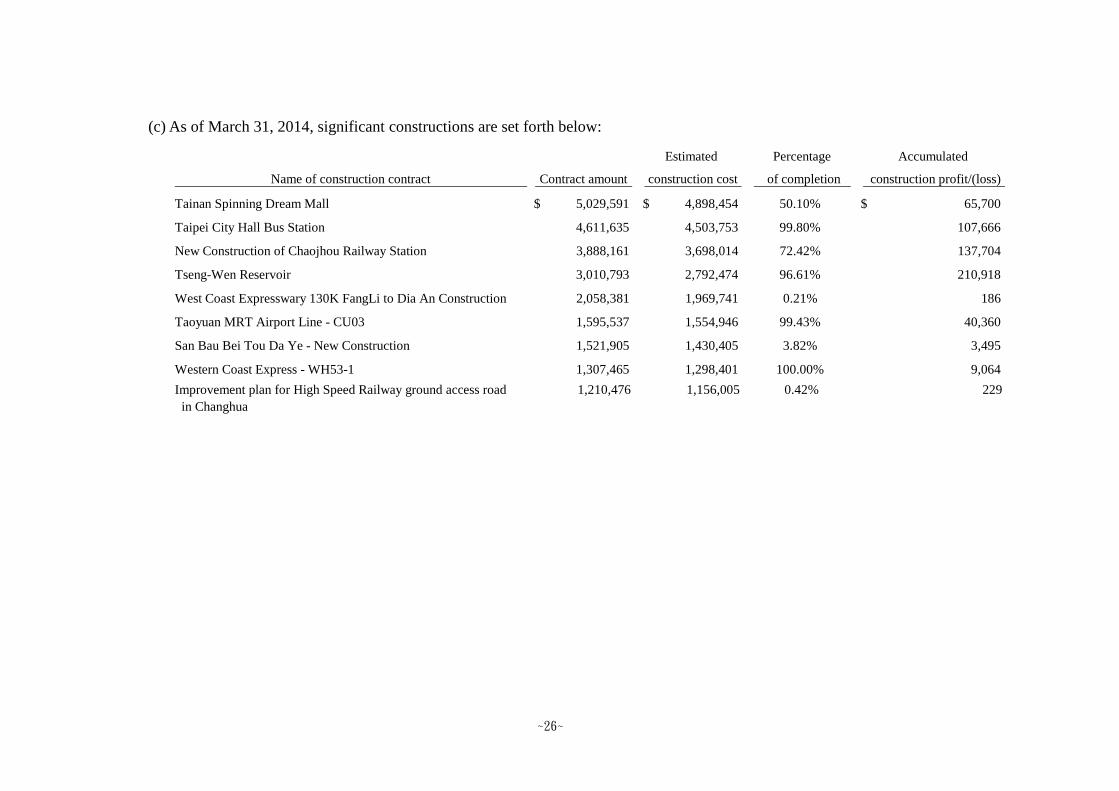
(c) As of March 31, 2014, significant constructions are set forth below:
Estimated Percentage Accumulated
Name of construction contract Contract amount construction cost of completion construction profit/(loss)
Tainan Spinning Dream Mall 5,029,591$ 4,898,454$ 50.10% 65,700$
Taipei City Hall Bus Station 4,611,635 4,503,753 99.80% 107,666
New Construction of Chaojhou Railway Station 3,888,161 3,698,014 72.42% 137,704
Tseng-Wen Reservoir 3,010,793 2,792,474 96.61% 210,918
West Coast Expresswary 130K FangLi to Dia An Construction 2,058,381 1,969,741 0.21% 186
Taoyuan MRT Airport Line - CU03 1,595,537 1,554,946 99.43% 40,360
San Bau Bei Tou Da Ye - New Construction 1,521,905 1,430,405 3.82% 3,495
Western Coast Express - WH53-1 1,307,465 1,298,401 100.00% 9,064
Improvement plan for High Speed Railway ground access road
in Changhua
1,210,476 1,156,005 0.42% 229
~27~
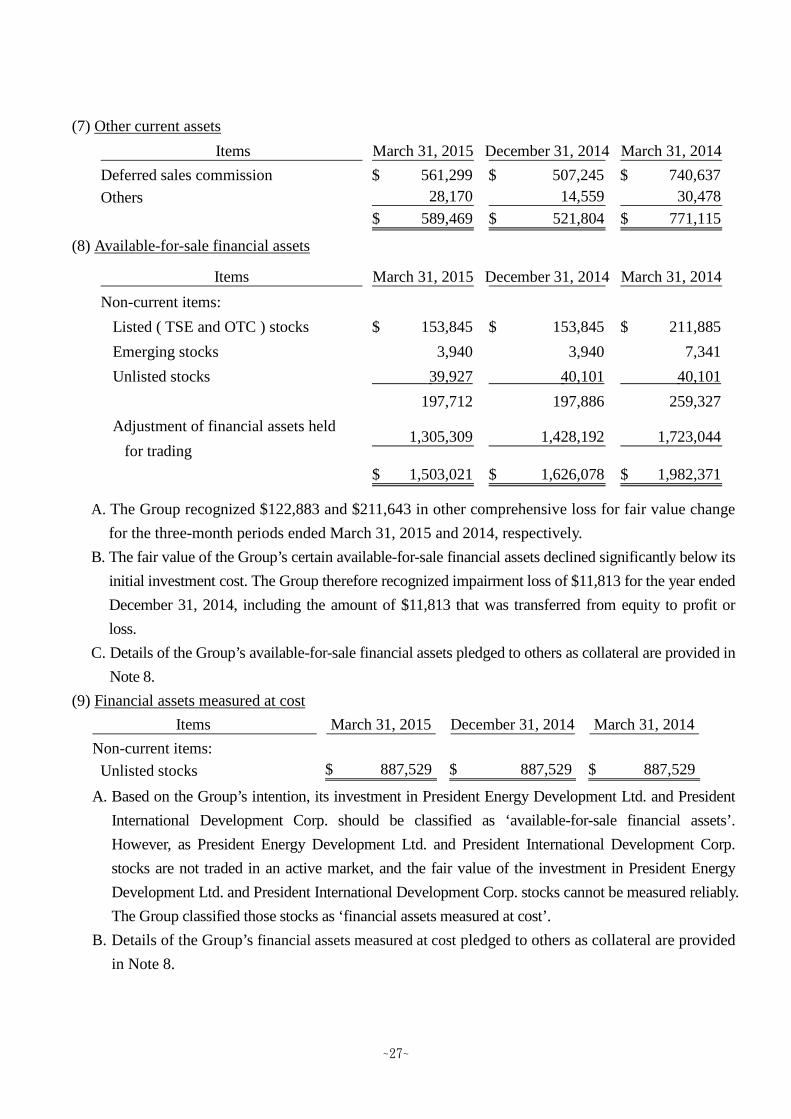
(7) Other current assets
(8) Available-for-sale financial assets
A. The Group recognized $122,883 and $211,643 in other comprehensive loss for fair value change
for the three-month periods ended March 31, 2015 and 2014, respectively.
B. The fair value of the Group’s certain available-for-sale financial assets declined significantly below its
initial investment cost. The Group therefore recognized impairment loss of $11,813 for the year ended
December 31, 2014, including the amount of $11,813 that was transferred from equity to profit or
loss.
C. Details of the Group’s available-for-sale financial assets pledged to others as collateral are provided in
Note 8.
(9) Financial assets measured at cost
A. Based on the Group’s intention, its investment in President Energy Development Ltd. and President
International Development Corp. should be classified as ‘available-for-sale financial assets’.
However, as President Energy Development Ltd. and President International Development Corp.
stocks are not traded in an active market, and the fair value of the investment in President Energy
Development Ltd. and President International Development Corp. stocks cannot be measured reliably.
The Group classified those stocks as ‘financial assets measured at cost’.
B. Details of the Group’s financial assets measured at cost pledged to others as collateral are provided
in Note 8.
Items March 31, 2015 December 31, 2014 March 31, 2014
Deferred sales commission 561,299$ 507,245$ 740,637$
Others 28,170 14,559 30,478
589,469$ 521,804$ 771,115$
Items March 31, 2015 December 31, 2014 March 31, 2014
Non-current items:
Listed ( TSE and OTC ) stocks 153,845$ 153,845$ 211,885$
Emerging stocks 3,940 3,940 7,341
Unlisted stocks 39,927 40,101 40,101
197,712 197,886 259,327
Adjustment of financial assets held
for trading
1,503,021$ 1,626,078$ 1,982,371$
1,305,309 1,428,192 1,723,044
Items March 31, 2015 December 31, 2014 March 31, 2014
Non-current items:
Unlisted stocks $ 887,529 $ 887,529 $ 887,529
~28~
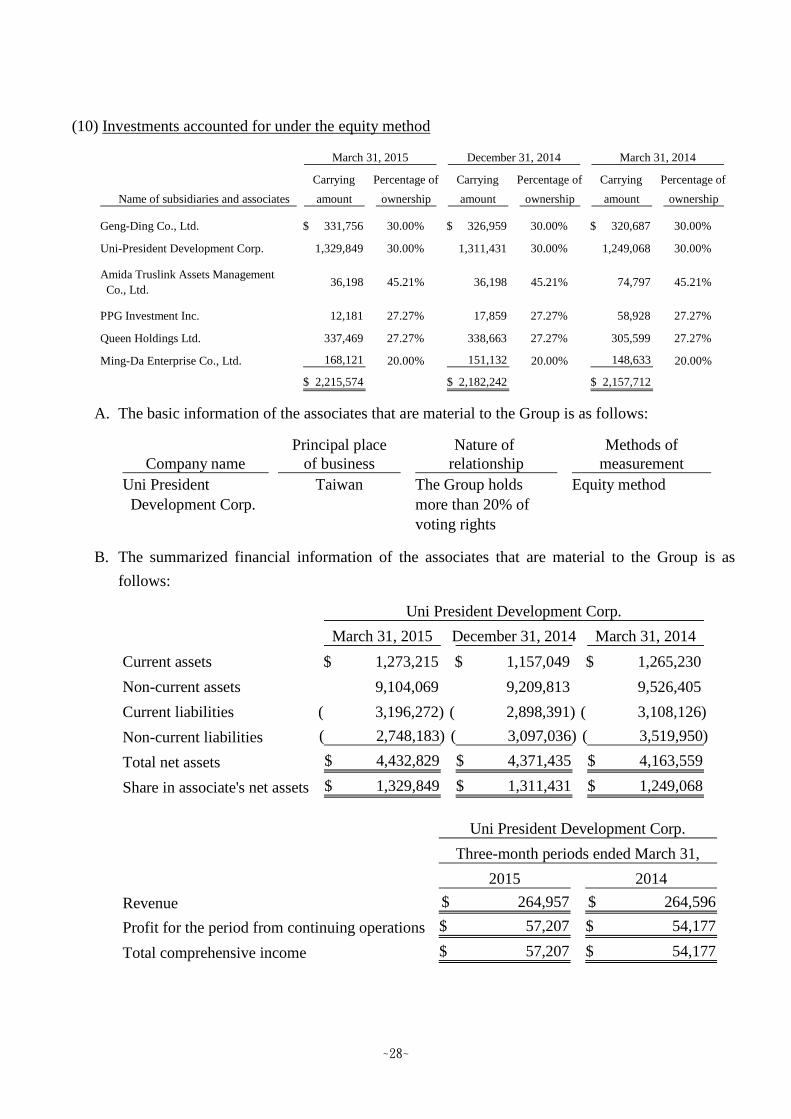
(10) Investments accounted for under the equity method
A. The basic information of the associates that are material to the Group is as follows:
B. The summarized financial information of the associates that are material to the Group is as
follows:
Carrying Percentage of Carrying Percentage of Carrying Percentage of
Name of subsidiaries and associates amount ownership amount ownership amount ownership
Geng-Ding Co., Ltd. $ 331,756 30.00% $ 326,959 30.00% $ 320,687 30.00%
Uni-President Development Corp. 1,329,849 30.00% 1,311,431 30.00% 1,249,068 30.00%
Amida Truslink Assets Management
Co., Ltd.36,198 45.21% 36,198 45.21% 74,797 45.21%
PPG Investment Inc. 12,181 27.27% 17,859 27.27% 58,928 27.27%
Queen Holdings Ltd. 337,469 27.27% 338,663 27.27% 305,599 27.27%
Ming-Da Enterprise Co., Ltd. 168,121 20.00% 151,132 20.00% 148,633 20.00%
$ 2,215,574 $ 2,182,242 $ 2,157,712
March 31, 2015 December 31, 2014 March 31, 2014
Principal place Nature of Methods ofCompany name of business relationship measurement
Uni President Taiwan The Group holds Equity method
Development Corp. more than 20% ofvoting rights
March 31, 2015 December 31, 2014 March 31, 2014
Current assets 1,273,215$ 1,157,049$ 1,265,230$
Non-current assets 9,104,069 9,209,813 9,526,405
Current liabilities 3,196,272)( 2,898,391)( 3,108,126)(
Non-current liabilities 2,748,183)( 3,097,036)( 3,519,950)(
Total net assets 4,432,829$ 4,371,435$ 4,163,559$
Share in associate's net assets 1,329,849$ 1,311,431$ 1,249,068$
Uni President Development Corp.
2015 2014
Revenue 264,957$ 264,596$
Profit for the period from continuing operations 57,207$ 54,177$
Total comprehensive income 57,207$ 54,177$
Uni President Development Corp.
Three-month periods ended March 31,
~29~
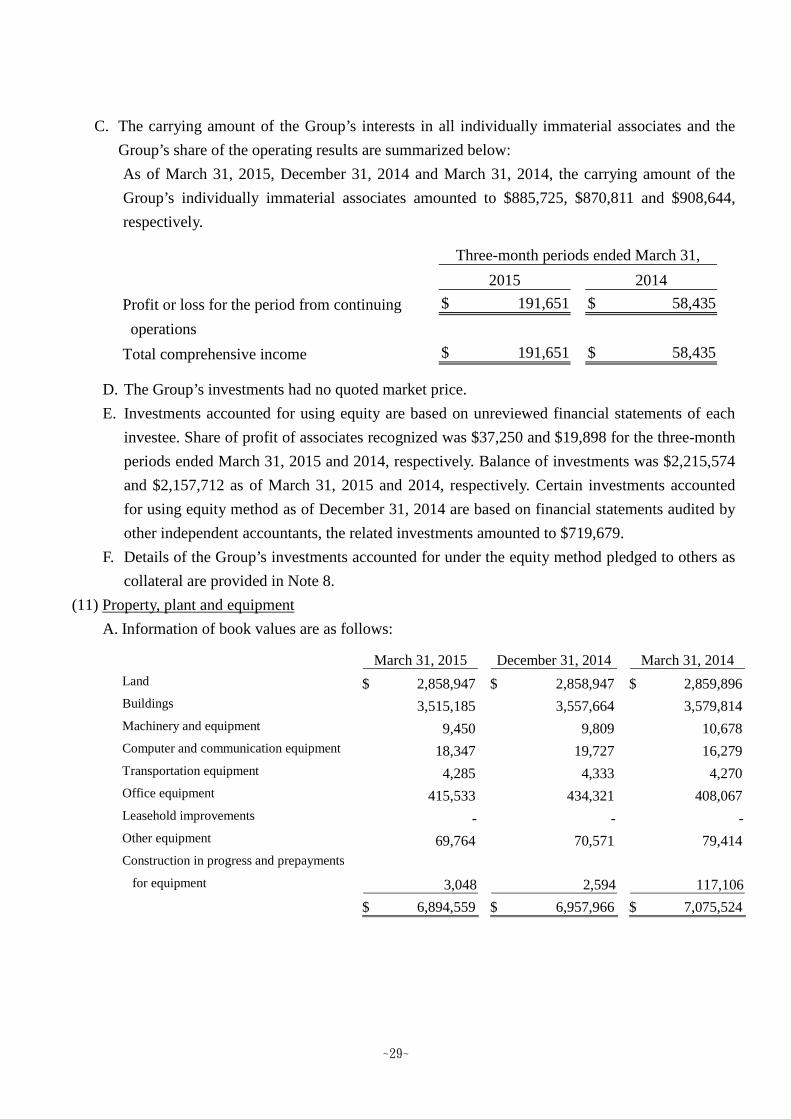
C. The carrying amount of the Group’s interests in all individually immaterial associates and the
Group’s share of the operating results are summarized below:
As of March 31, 2015, December 31, 2014 and March 31, 2014, the carrying amount of the
Group’s individually immaterial associates amounted to $885,725, $870,811 and $908,644,
respectively.
D. The Group’s investments had no quoted market price.
E. Investments accounted for using equity are based on unreviewed financial statements of each
investee. Share of profit of associates recognized was $37,250 and $19,898 for the three-month
periods ended March 31, 2015 and 2014, respectively. Balance of investments was $2,215,574
and $2,157,712 as of March 31, 2015 and 2014, respectively. Certain investments accounted
for using equity method as of December 31, 2014 are based on financial statements audited by
other independent accountants, the related investments amounted to $719,679.
F. Details of the Group’s investments accounted for under the equity method pledged to others as
collateral are provided in Note 8.
(11) Property, plant and equipment
A. Information of book values are as follows:
2015 2014
Profit or loss for the period from continuing 191,651$ 58,435$
operations
Total comprehensive income 191,651$ 58,435$
Three-month periods ended March 31,
March 31, 2015 December 31, 2014 March 31, 2014
Land $ 2,858,947 $ 2,858,947 $ 2,859,896
Buildings 3,515,185 3,557,664 3,579,814
Machinery and equipment 9,450 9,809 10,678
Computer and communication equipment 18,347 19,727 16,279
Transportation equipment 4,285 4,333 4,270
Office equipment 415,533 434,321 408,067
Leasehold improvements - - -
Other equipment 69,764 70,571 79,414
Construction in progress and prepayments
for equipment 3,048 2,594 117,106
$ 6,894,559 $ 6,957,966 $ 7,075,524
~30~
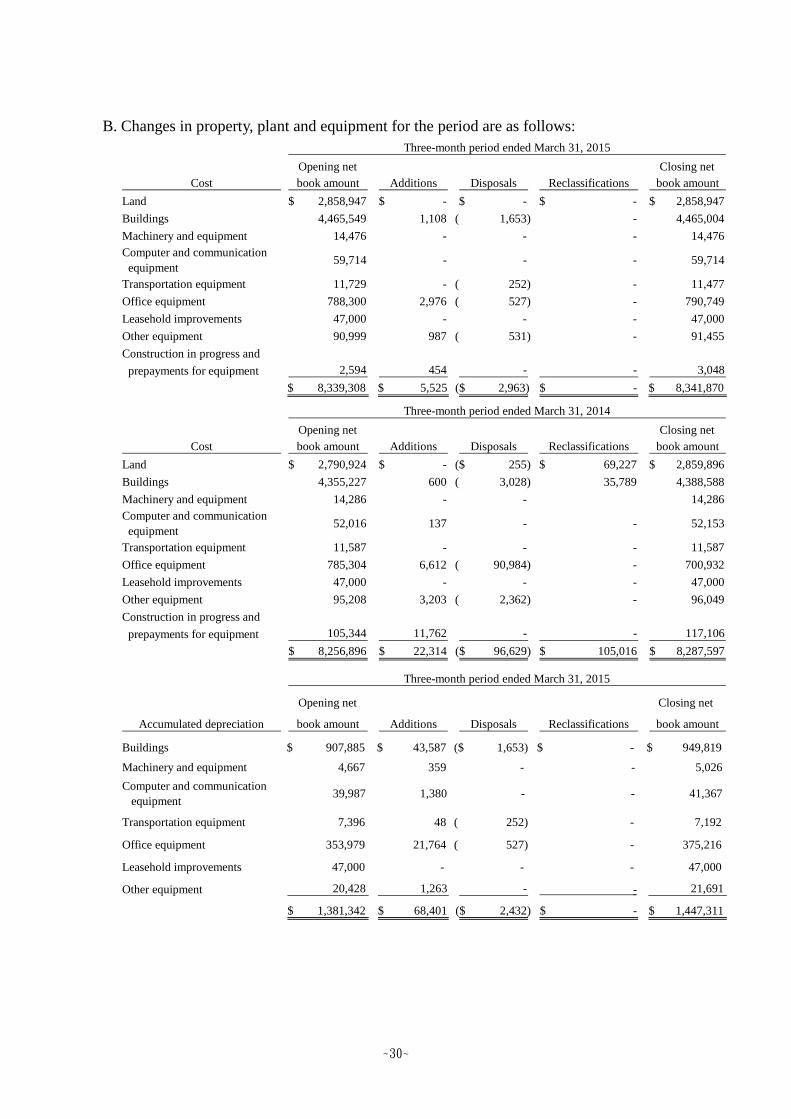
B. Changes in property, plant and equipment for the period are as follows:
Opening net Closing net
Cost book amount Additions Disposals Reclassifications book amount
Land 2,858,947$ -$ -$ -$ 2,858,947$
Buildings 4,465,549 1,108 1,653)( - 4,465,004
Machinery and equipment 14,476 - - - 14,476
Computer and communication
equipment59,714 - - - 59,714
Transportation equipment 11,729 - 252)( - 11,477
Office equipment 788,300 2,976 527)( - 790,749
Leasehold improvements 47,000 - - - 47,000
Other equipment 90,999 987 531)( - 91,455
Construction in progress and
prepayments for equipment 2,594 454 - - 3,048
$ 8,339,308 $ 5,525 ($ 2,963) -$ $ 8,341,870
Three-month period ended March 31, 2015
Opening net Closing net
Cost book amount Additions Disposals Reclassifications book amount
Land 2,790,924$ -$ 255)($ 69,227$ 2,859,896$
Buildings 4,355,227 600 3,028)( 35,789 4,388,588
Machinery and equipment 14,286 - - 14,286
Computer and communication
equipment52,016 137 - - 52,153
Transportation equipment 11,587 - - - 11,587
Office equipment 785,304 6,612 90,984)( - 700,932
Leasehold improvements 47,000 - - - 47,000
Other equipment 95,208 3,203 2,362)( - 96,049
Construction in progress and
prepayments for equipment 105,344 11,762 - - 117,106
8,256,896$ 22,314$ 96,629)($ 105,016$ 8,287,597$
Three-month period ended March 31, 2014
Opening net Closing net
Accumulated depreciation book amount Additions Disposals Reclassifications book amount
Buildings $ 907,885 $ 43,587 ($ 1,653) $ - $ 949,819
Machinery and equipment 4,667 359 - - 5,026
Computer and communication
equipment39,987 1,380 - - 41,367
Transportation equipment 7,396 48 ( 252) - 7,192
Office equipment 353,979 21,764 ( 527) - 375,216
Leasehold improvements 47,000 - - - 47,000
Other equipment 20,428 1,263 - - 21,691
$ 1,381,342 $ 68,401 2,432)($ -$ $ 1,447,311
Three-month period ended March 31, 2015
~31~
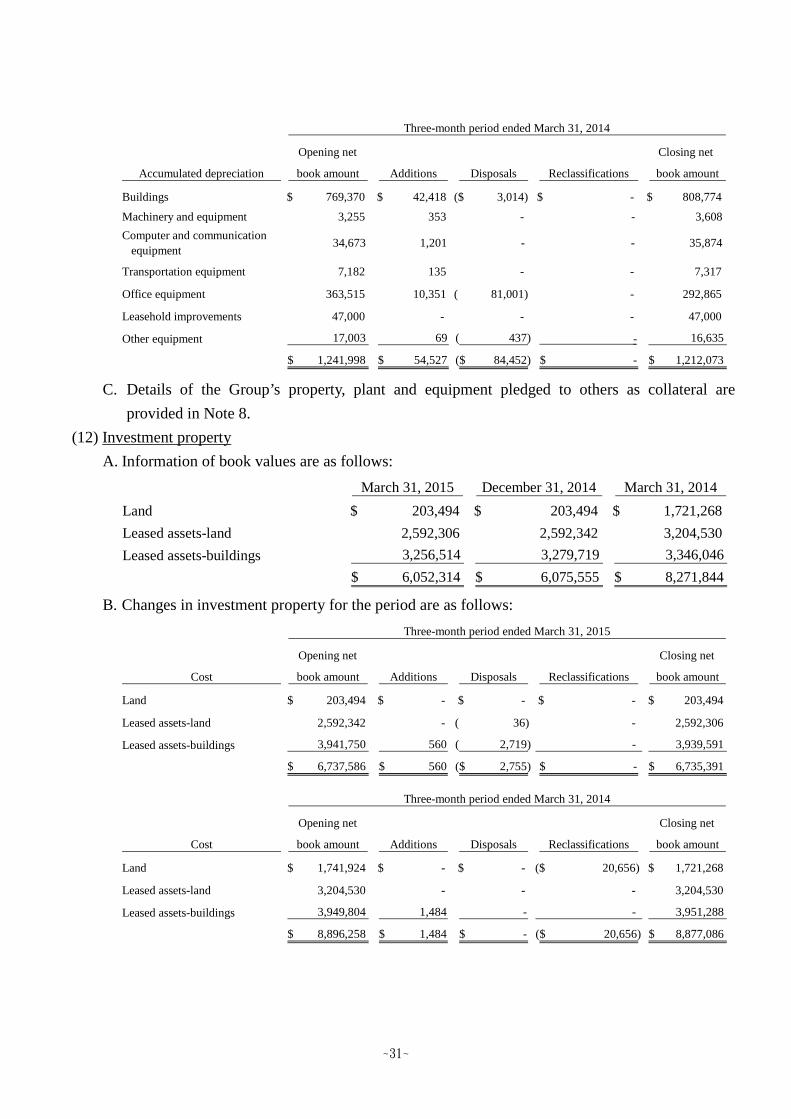
C. Details of the Group’s property, plant and equipment pledged to others as collateral are
provided in Note 8.
(12) Investment property
A. Information of book values are as follows:
B. Changes in investment property for the period are as follows:
Opening net Closing net
Accumulated depreciation book amount Additions Disposals Reclassifications book amount
Buildings $ 769,370 $ 42,418 ($ 3,014) $ - $ 808,774
Machinery and equipment 3,255 353 - - 3,608
Computer and communication
equipment34,673 1,201 - - 35,874
Transportation equipment 7,182 135 - - 7,317
Office equipment 363,515 10,351 ( 81,001) - 292,865
Leasehold improvements 47,000 - - - 47,000
Other equipment 17,003 69 437)( - 16,635
$ 1,241,998 $ 54,527 84,452)($ -$ $ 1,212,073
Three-month period ended March 31, 2014
March 31, 2015 December 31, 2014 March 31, 2014
Land $ 203,494 $ 203,494 $ 1,721,268
Leased assets-land 2,592,306 2,592,342 3,204,530
Leased assets-buildings 3,256,514 3,279,719 3,346,046
$ 6,052,314 $ 6,075,555 $ 8,271,844
Opening net Closing net
Cost book amount Additions Disposals Reclassifications book amount
Land $ 203,494 $ - $ - $ - $ 203,494
Leased assets-land 2,592,342 - ( 36) - 2,592,306
Leased assets-buildings 3,941,750 560 2,719)( - 3,939,591
$ 6,737,586 560$ 2,755)($ -$ $ 6,735,391
Three-month period ended March 31, 2015
Opening net Closing net
Cost book amount Additions Disposals Reclassifications book amount
Land $ 1,741,924 $ - $ - ($ 20,656) $ 1,721,268
Leased assets-land 3,204,530 - - - 3,204,530
Leased assets-buildings 3,949,804 1,484 - - 3,951,288
$ 8,896,258 1,484$ -$ 20,656)($ $ 8,877,086
Three-month period ended March 31, 2014
~32~
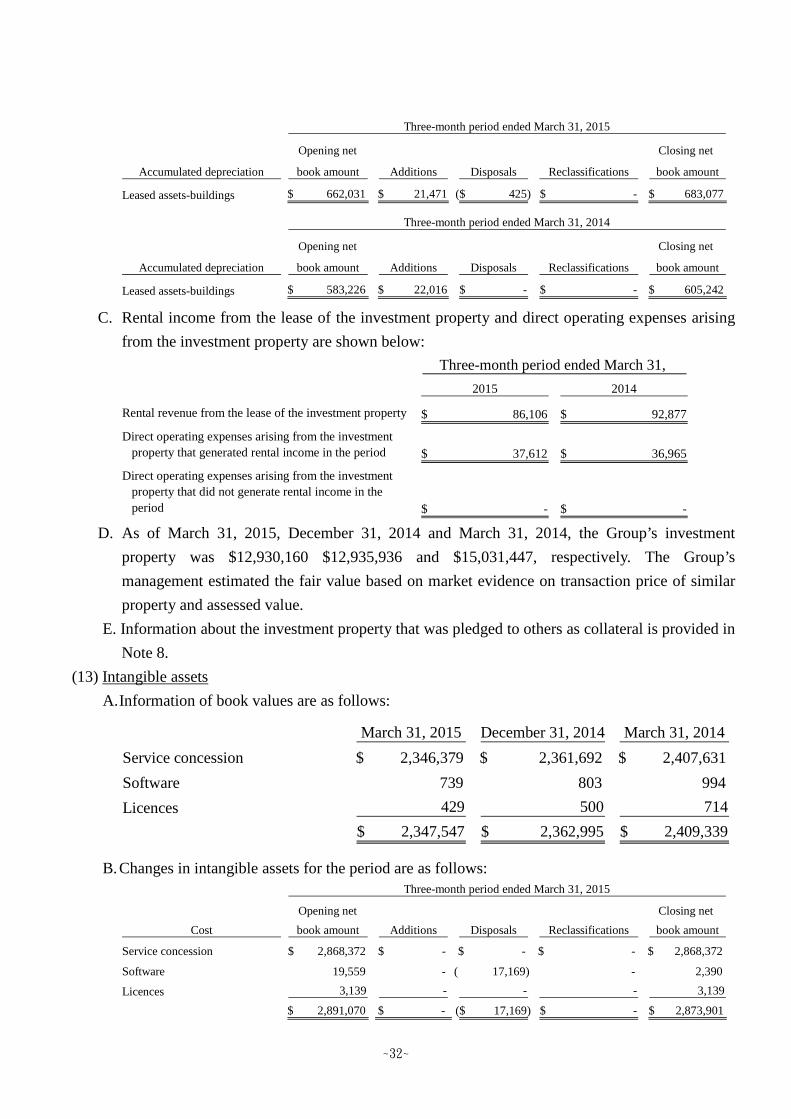
C. Rental income from the lease of the investment property and direct operating expenses arising
from the investment property are shown below:
D. As of March 31, 2015, December 31, 2014 and March 31, 2014, the Group’s investment
property was $12,930,160 $12,935,936 and $15,031,447, respectively. The Group’s
management estimated the fair value based on market evidence on transaction price of similar
property and assessed value.
E. Information about the investment property that was pledged to others as collateral is provided in
Note 8.
(13) Intangible assets
A.Information of book values are as follows:
B.Changes in intangible assets for the period are as follows:
Opening net Closing net
Accumulated depreciation book amount Additions Disposals Reclassifications book amount
Leased assets-buildings $ 662,031 $ 21,471 425)($ -$ $ 683,077
Three-month period ended March 31, 2015
Opening net Closing net
Accumulated depreciation book amount Additions Disposals Reclassifications book amount
Leased assets-buildings $ 583,226 $ 22,016 -$ -$ $ 605,242
Three-month period ended March 31, 2014
2015 2014
Rental revenue from the lease of the investment property 86,106$ 92,877$
Direct operating expenses arising from the investment
property that generated rental income in the period 37,612$ 36,965$
Direct operating expenses arising from the investment
property that did not generate rental income in the
period -$ -$
Three-month period ended March 31,
March 31, 2015 December 31, 2014 March 31, 2014
Service concession 2,346,379$ 2,361,692$ 2,407,631$
Software 739 803 994
Licences 429 500 714
2,347,547$ 2,362,995$ 2,409,339$
Opening net Closing net
Cost book amount Additions Disposals Reclassifications book amount
Service concession 2,868,372$ -$ -$ -$ 2,868,372$
Software 19,559 - 17,169)( - 2,390
Licences 3,139 - - - 3,139
$ 2,891,070 $ - 17,169)($ -$ $ 2,873,901
Three-month period ended March 31, 2015

~33~
C. Details of amortisation on intangible assets are as follows:
(14) Short-term borrowings
For details of pledged assets, please refer to Note 8.
Opening net Closing net
Cost book amount Additions Disposals Reclassifications book amount
Service concession 2,868,372$ -$ -$ -$ 2,868,372$
Software 18,189 365 - - 18,554
Licences 3,139 - - - 3,139
$ 2,889,700 $ 365 -$ -$ $ 2,890,065
Three-month period ended March 31, 2014
Opening net Closing net
Accumulated Amortization book amount Additions Disposals Reclassifications book amount
Service concession 506,680$ 15,313$ -$ -$ 521,993$
Software 18,756 64 17,169)( - 1,651
Licences 2,639 71 - - 2,710
$ 528,075 $ 15,448 17,169)($ -$ $ 526,354
Three-month period ended March 31, 2015
Opening net Closing net
Accumulated Amortization book amount Additions Disposals Reclassifications book amount
Service concession 445,427$ 15,314$ -$ -$ 460,741$
Software 16,902 658 - - 17,560
Licences 2,355 70 - - 2,425
$ 464,684 $ 16,042 -$ -$ $ 480,726
Three-month period ended March 31, 2014
2015 2014
Operating costs 15,313$ 15,314$
Administrative expenses 135 728
15,448$ 16,042$
Three-month periods ended March 31,
March 31, 2015 December 31, 2014 March 31, 2014
Secured borrowings 1,480,000$ 1,682,500$ 2,096,000$
Unsecured borrowings 1,210,584 1,623,084 1,211,700
2,690,584$ 3,305,584$ 3,307,700$
Interest rate range 1.92%~2.64% 1.92%~2.59% 1.45%~2.53%
~34~
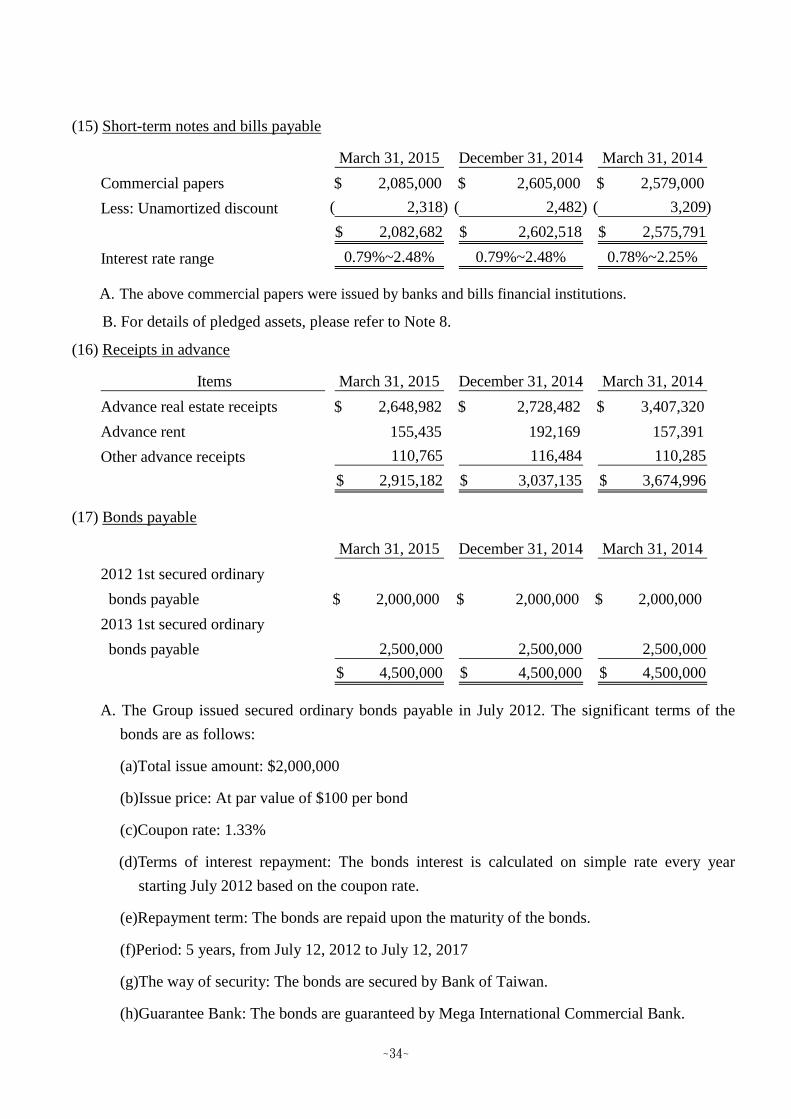
(15) Short-term notes and bills payable
A. The above commercial papers were issued by banks and bills financial institutions.
B. For details of pledged assets, please refer to Note 8.
(16) Receipts in advance
(17) Bonds payable
A. The Group issued secured ordinary bonds payable in July 2012. The significant terms of the
bonds are as follows:
(a)Total issue amount: $2,000,000
(b)Issue price: At par value of $100 per bond
(c)Coupon rate: 1.33%
(d)Terms of interest repayment: The bonds interest is calculated on simple rate every year
starting July 2012 based on the coupon rate.
(e)Repayment term: The bonds are repaid upon the maturity of the bonds.
(f)Period: 5 years, from July 12, 2012 to July 12, 2017
(g)The way of security: The bonds are secured by Bank of Taiwan.
(h)Guarantee Bank: The bonds are guaranteed by Mega International Commercial Bank.
March 31, 2015 December 31, 2014 March 31, 2014
Commercial papers 2,085,000$ 2,605,000$ 2,579,000$
Less: Unamortized discount 2,318)( 2,482)( 3,209)(
2,082,682$ 2,602,518$ 2,575,791$
Interest rate range 0.79%~2.48% 0.79%~2.48% 0.78%~2.25%
Items March 31, 2015 December 31, 2014 March 31, 2014
Advance real estate receipts 2,648,982$ 2,728,482$ 3,407,320$
Advance rent 155,435 192,169 157,391
Other advance receipts 110,765 116,484 110,285
2,915,182$ 3,037,135$ 3,674,996$
March 31, 2015 December 31, 2014 March 31, 2014
2012 1st secured ordinary
bonds payable $ 2,000,000 $ 2,000,000 $ 2,000,000
2013 1st secured ordinary
bonds payable 2,500,000 2,500,000 2,500,000
4,500,000$ 4,500,000$ 4,500,000$
~35~
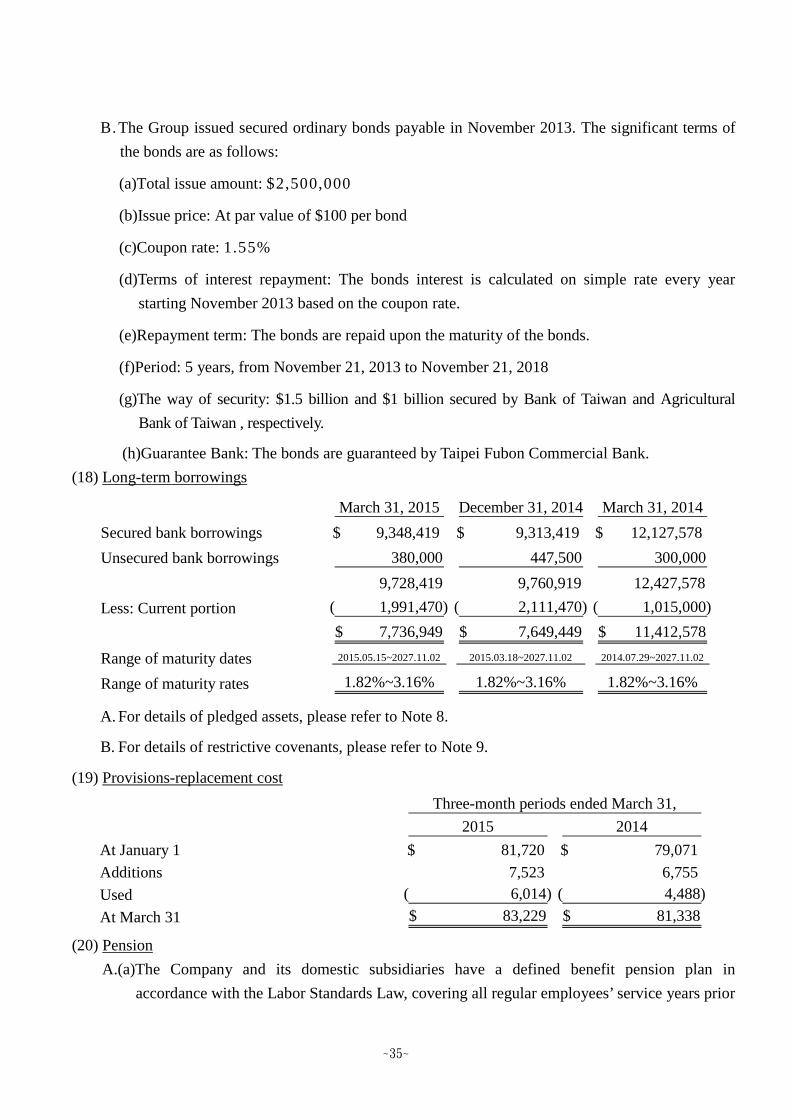
B. The Group issued secured ordinary bonds payable in November 2013. The significant terms of
the bonds are as follows:
(a)Total issue amount: $2,500,000
(b)Issue price: At par value of $100 per bond
(c)Coupon rate: 1.55%
(d)Terms of interest repayment: The bonds interest is calculated on simple rate every year
starting November 2013 based on the coupon rate.
(e)Repayment term: The bonds are repaid upon the maturity of the bonds.
(f)Period: 5 years, from November 21, 2013 to November 21, 2018
(g)The way of security: $1.5 billion and $1 billion secured by Bank of Taiwan and Agricultural
Bank of Taiwan , respectively.
(h)Guarantee Bank: The bonds are guaranteed by Taipei Fubon Commercial Bank.
(18) Long-term borrowings
A. For details of pledged assets, please refer to Note 8.
B. For details of restrictive covenants, please refer to Note 9.
(19) Provisions-replacement cost
(20) Pension
A.(a)The Company and its domestic subsidiaries have a defined benefit pension plan in
accordance with the Labor Standards Law, covering all regular employees’ service years prior
March 31, 2015 December 31, 2014 March 31, 2014
Secured bank borrowings $ 9,348,419 $ 9,313,419 $ 12,127,578
Unsecured bank borrowings 380,000 447,500 300,000
9,728,419 9,760,919 12,427,578
Less: Current portion 1,991,470)( 2,111,470)( 1,015,000)(
7,736,949$ 7,649,449$ 11,412,578$
Range of maturity dates 2015.05.15~2027.11.02 2015.03.18~2027.11.02 2014.07.29~2027.11.02
Range of maturity rates 1.82%~3.16% 1.82%~3.16% 1.82%~3.16%
2015 2014
At January 1 81,720$ 79,071$
Additions 7,523 6,755
Used 6,014)( 4,488)(
At March 31 83,229$ 81,338$
Three-month periods ended March 31,

~36~
to the enforcement of the Labor Pension Act on July 1, 2005 and service years thereafter of
employees who chose to continue to be subject to the pension mechanism under the Law.
Under the defined benefit pension plan, two units are accrued for each year of service for the
first 15 years and one unit for each additional year thereafter, subject to a maximum of 45
units. Pension benefits are based on the number of units accrued and the average monthly
salaries and wages of the last 6 months prior to retirement. The Company and its domestic
subsidiaries contributes monthly an amount equal to 2% of the employees’ monthly salaries
and wages to the retirement fund deposited with Bank of Taiwan, the trustee, under the name
of the independent retirement fund committee.
(b)For the aforementioned pension plan, the Group recognized pension costs of $948 and
$1,192 for the three-month periods ended March 31, 2015 and 2014, respectively.
(c)Expected contributions to the defined benefit pension plans of the Group for the year ended
December 31, 2016 amounts to $3,793.
B.(a)Effective July 1, 2005, the Company and its domestic subsidiaries have established a defined
contribution pension plan (the “New Plan”) under the Labor Pension Act (the “Act”),
covering all regular employees with R.O.C. nationality. Under the New Plan, the Company
and its domestic subsidiaries contribute monthly an amount based on 6% of the employees’
monthly salaries and wages to the employees’ individual pension accounts at the Bureau of
Labor Insurance. The benefits accrued are paid monthly or in lump sum upon termination of
employment.
(b)The pension costs under the defined contribution pension plans of the Company and its
domestic subsidiaries for the three-month periods ended March 31, 2015 and 2014 were
$14,221 and $15,333, respectively.
(21) Share-based payment-employee compensation plan
A. For the three-month period ended March 31, 2015, the Group’s share-based payment: None.
B. For the three-month period ended March 31, 2014, the Group’s share-based payment
arrangement were as follows:
Note:in thousand shares
Type of Quantity Contract Vesting
arrangements Grant date granted period conditions
Cash capital increase reserved for 2014.01.13 30,000 NA Immediately
employees (Note)
~37~
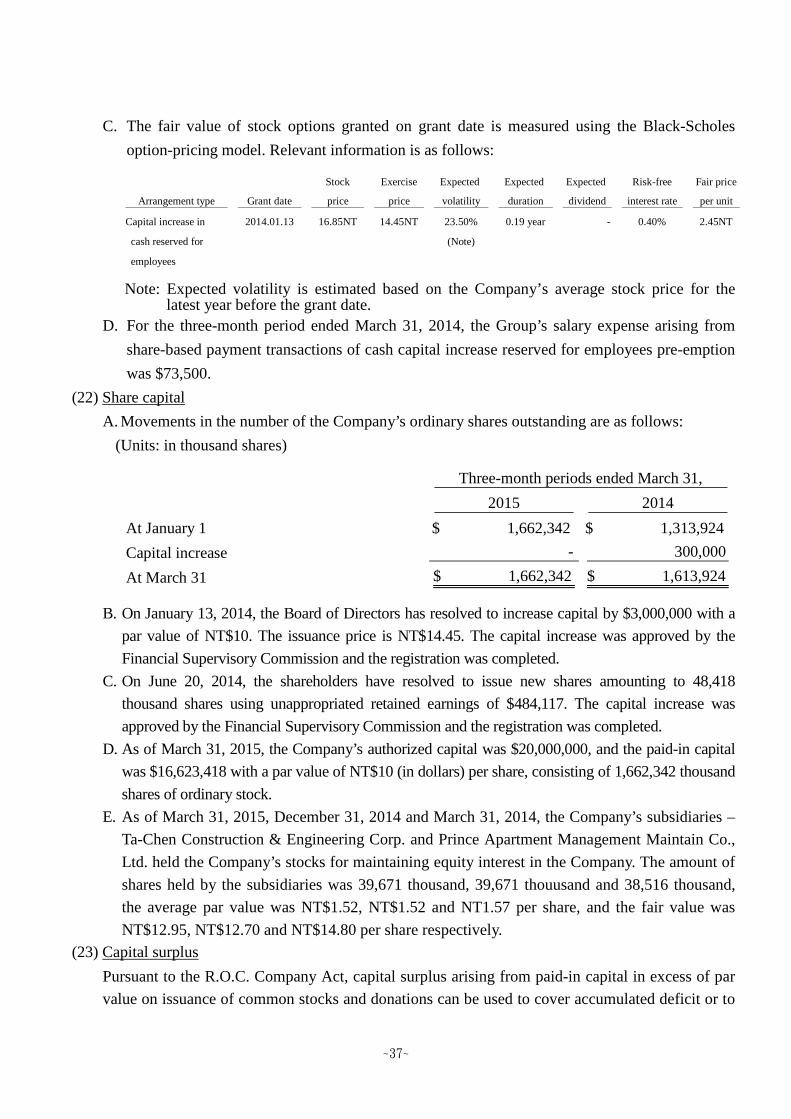
C. The fair value of stock options granted on grant date is measured using the Black-Scholes
option-pricing model. Relevant information is as follows:
Note: Expected volatility is estimated based on the Company’s average stock price for thelatest year before the grant date.
D. For the three-month period ended March 31, 2014, the Group’s salary expense arising from
share-based payment transactions of cash capital increase reserved for employees pre-emption
was $73,500.
(22) Share capital
A. Movements in the number of the Company’s ordinary shares outstanding are as follows:
(Units: in thousand shares)
B. On January 13, 2014, the Board of Directors has resolved to increase capital by $3,000,000 with a
par value of NT$10. The issuance price is NT$14.45. The capital increase was approved by the
Financial Supervisory Commission and the registration was completed.
C. On June 20, 2014, the shareholders have resolved to issue new shares amounting to 48,418
thousand shares using unappropriated retained earnings of $484,117. The capital increase was
approved by the Financial Supervisory Commission and the registration was completed.
D. As of March 31, 2015, the Company’s authorized capital was $20,000,000, and the paid-in capital
was $16,623,418 with a par value of NT$10 (in dollars) per share, consisting of 1,662,342 thousand
shares of ordinary stock.
E. As of March 31, 2015, December 31, 2014 and March 31, 2014, the Company’s subsidiaries –
Ta-Chen Construction & Engineering Corp. and Prince Apartment Management Maintain Co.,
Ltd. held the Company’s stocks for maintaining equity interest in the Company. The amount of
shares held by the subsidiaries was 39,671 thousand, 39,671 thouusand and 38,516 thousand,
the average par value was NT$1.52, NT$1.52 and NT1.57 per share, and the fair value was
NT$12.95, NT$12.70 and NT$14.80 per share respectively.
(23) Capital surplus
Pursuant to the R.O.C. Company Act, capital surplus arising from paid-in capital in excess of par
value on issuance of common stocks and donations can be used to cover accumulated deficit or to
Stock Exercise Expected Expected Expected Risk-free Fair price
Arrangement type Grant date price price volatility duration dividend interest rate per unit
Capital increase in 2014.01.13 16.85NT 14.45NT 23.50% 0.19 year - 0.40% 2.45NT
cash reserved for (Note)
employees
2015 2014
At January 1 $ 1,662,342 $ 1,313,924
Capital increase - 300,000
At March 31 $ 1,662,342 $ 1,613,924
Three-month periods ended March 31,

~38~
issue new stocks or cash to shareholders in proportion to their share ownership, provided that the
Group has no accumulated deficit. Further, the R.O.C. Securities and Exchange Law requires that
the amount of capital surplus to be capitalized mentioned above should not exceed 10% of the
paid-in capital each year. Capital surplus should not be used to cover accumulated deficit unless
the legal reserve is insufficient.
(24) Retained earnings
A.In accordance with the Company’s Articles of Incorporation, the Company will take into
consideration its future business plans and capital expenditures in determining the amounts of
earnings to be retained and to be distributed. In accordance with the Company Law, 10% of the
current year’s earnings, after payment of all taxes and after offsetting accumulated deficit, shall be
set aside as legal reserve until the balance of legal reserve is equal to that of issued share capital.
Afterwards, an amount shall be appropriated or reversed as special reserve in accordance with
applicable legal or regulatory requirements, along with prior years’ accumulated unappropriated
retained earnings, and then distribution should be in the following order: stock dividend and bonus
to shareholders are 50%~100% of the accumulated distributable earnings, and cash dividend is
at least 30% of the total stock dividend and bonus; except for dividend distribution, the
appropriation of earnings is proposed by the Board of Directors and resolved by the
shareholders. The remuneration to directors and supervisors is 3% of the distributable earnings
and the bonus to employees is at least 2% of the distributable earnings. The receipts of the
above employees’ bonus must include employees who satisfy certain conditions and are
qualified as the Company’s employees.
B. Except for covering accumulated deficit or issuing new stocks or cash to shareholders in
proportion to their share ownership, the legal reserve shall not be used for any other purpose.
The use of legal reserve for the issuance of stocks or cash to shareholders in proportion to their
Share Trading
2015 premium treasury stock Others Total
At January 1, 2015 (At March 31, 2015) 1,408,500$ 514,061$ 7,232$ 1,929,793$
Share Trading Treasury share
premium treasury stock transactions Others Total
2014
At January 1, 2014 -$ 514,061$ -$ 7,232$ 521,293$
Share-based payment of cash capital
increase reserved for employees
pre-emption- - 73,500 - 73,500
Cash capital increase 1,408,500$ - 73,500)( - 1,335,000
At March 31, 2014 1,408,500$ 514,061$ -$ 7,232$ 1,929,793$
Capital surplus
Capital surplus
~39~
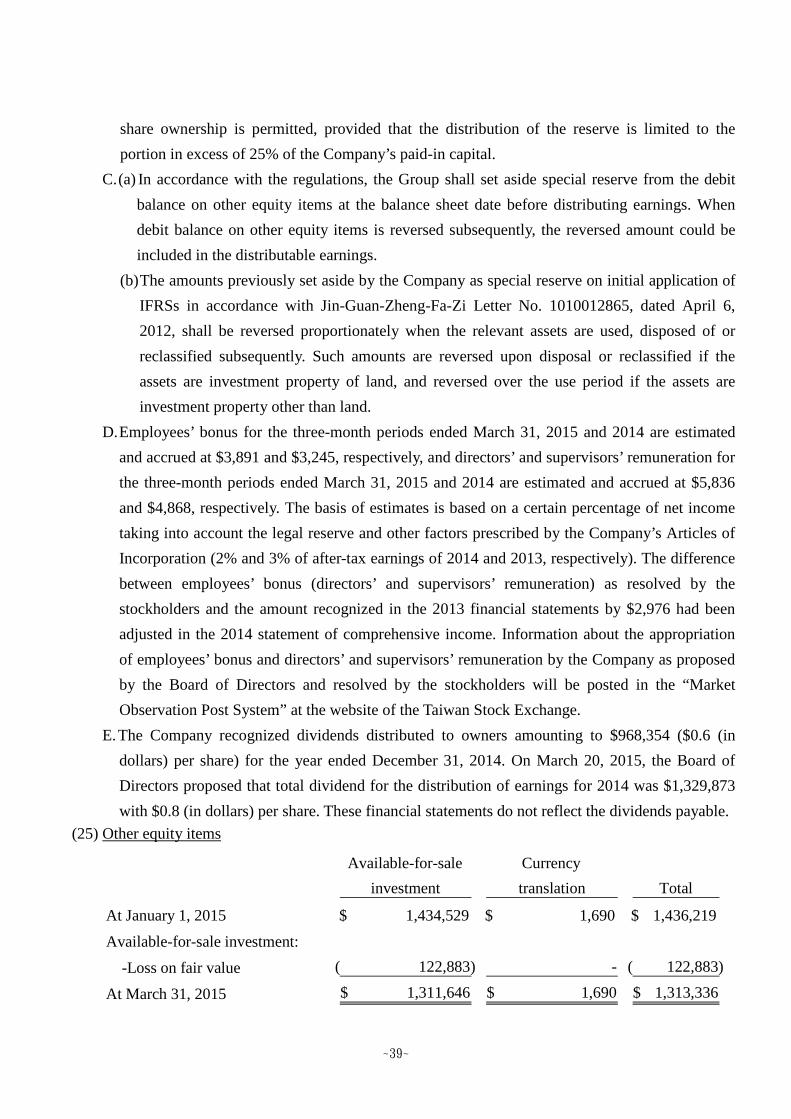
share ownership is permitted, provided that the distribution of the reserve is limited to the
portion in excess of 25% of the Company’s paid-in capital.
C.(a) In accordance with the regulations, the Group shall set aside special reserve from the debit
balance on other equity items at the balance sheet date before distributing earnings. When
debit balance on other equity items is reversed subsequently, the reversed amount could be
included in the distributable earnings.
(b)The amounts previously set aside by the Company as special reserve on initial application of
IFRSs in accordance with Jin-Guan-Zheng-Fa-Zi Letter No. 1010012865, dated April 6,
2012, shall be reversed proportionately when the relevant assets are used, disposed of or
reclassified subsequently. Such amounts are reversed upon disposal or reclassified if the
assets are investment property of land, and reversed over the use period if the assets are
investment property other than land.
D.Employees’ bonus for the three-month periods ended March 31, 2015 and 2014 are estimated
and accrued at $3,891 and $3,245, respectively, and directors’ and supervisors’ remuneration for
the three-month periods ended March 31, 2015 and 2014 are estimated and accrued at $5,836
and $4,868, respectively. The basis of estimates is based on a certain percentage of net income
taking into account the legal reserve and other factors prescribed by the Company’s Articles of
Incorporation (2% and 3% of after-tax earnings of 2014 and 2013, respectively). The difference
between employees’ bonus (directors’ and supervisors’ remuneration) as resolved by the
stockholders and the amount recognized in the 2013 financial statements by $2,976 had been
adjusted in the 2014 statement of comprehensive income. Information about the appropriation
of employees’ bonus and directors’ and supervisors’ remuneration by the Company as proposed
by the Board of Directors and resolved by the stockholders will be posted in the “Market
Observation Post System” at the website of the Taiwan Stock Exchange.
E.The Company recognized dividends distributed to owners amounting to $968,354 ($0.6 (in
dollars) per share) for the year ended December 31, 2014. On March 20, 2015, the Board of
Directors proposed that total dividend for the distribution of earnings for 2014 was $1,329,873
with $0.8 (in dollars) per share. These financial statements do not reflect the dividends payable.
(25) Other equity items
Available-for-sale Currency
investment translation Total
At January 1, 2015 1,434,529$ 1,690$ 1,436,219$
Available-for-sale investment:
-Loss on fair value 122,883)( - 122,883)(
At March 31, 2015 1,311,646$ 1,690$ 1,313,336$
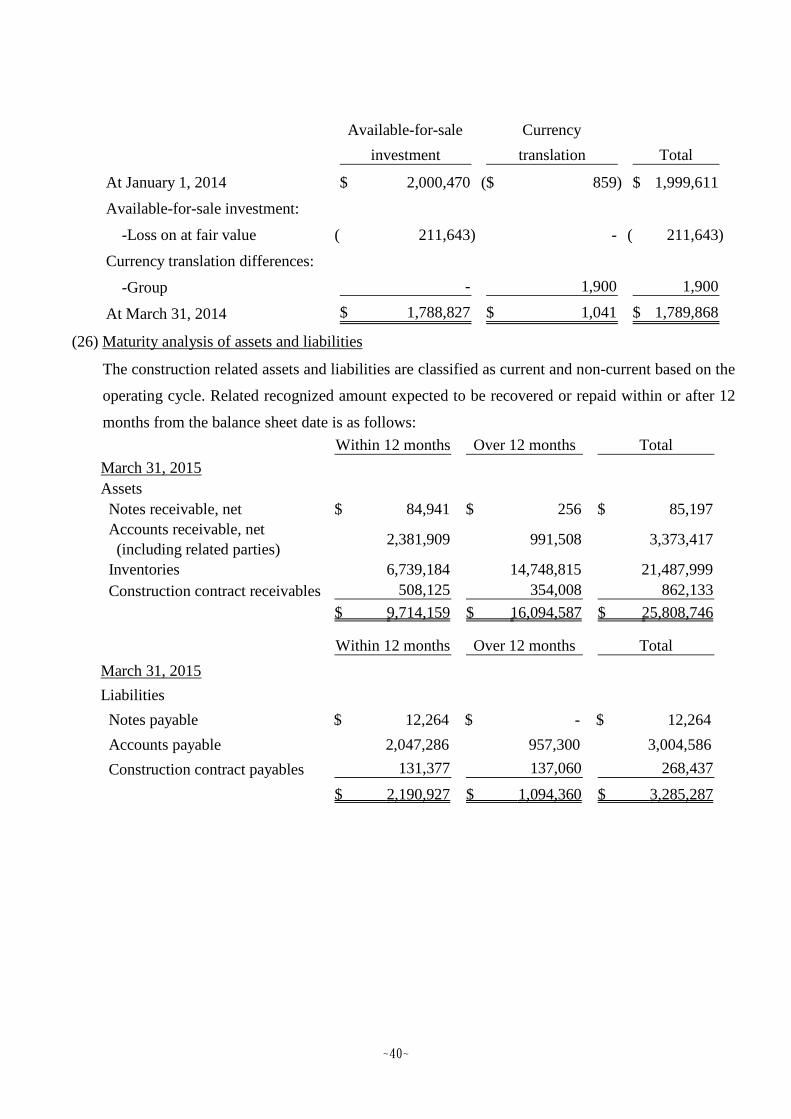
~40~
(26) Maturity analysis of assets and liabilities
The construction related assets and liabilities are classified as current and non-current based on the
operating cycle. Related recognized amount expected to be recovered or repaid within or after 12
months from the balance sheet date is as follows:
Available-for-sale Currency
investment translation Total
At January 1, 2014 2,000,470$ 859)($ 1,999,611$
Available-for-sale investment:
-Loss on at fair value 211,643)( - 211,643)(
Currency translation differences:
-Group - 1,900 1,900
At March 31, 2014 1,788,827$ 1,041$ 1,789,868$
Within 12 months Over 12 months Total
March 31, 2015
Assets
Notes receivable, net 84,941$ 256$ 85,197$
Accounts receivable, net
(including related parties)2,381,909 991,508 3,373,417
Inventories 6,739,184 14,748,815 21,487,999
Construction contract receivables 508,125 354,008 862,133
9,714,159$ 16,094,587$ 25,808,746$
Within 12 months Over 12 months Total
March 31, 2015
Liabilities
Notes payable 12,264$ -$ 12,264$
Accounts payable 2,047,286 957,300 3,004,586
Construction contract payables 131,377 137,060 268,437
2,190,927$ 1,094,360$ 3,285,287$
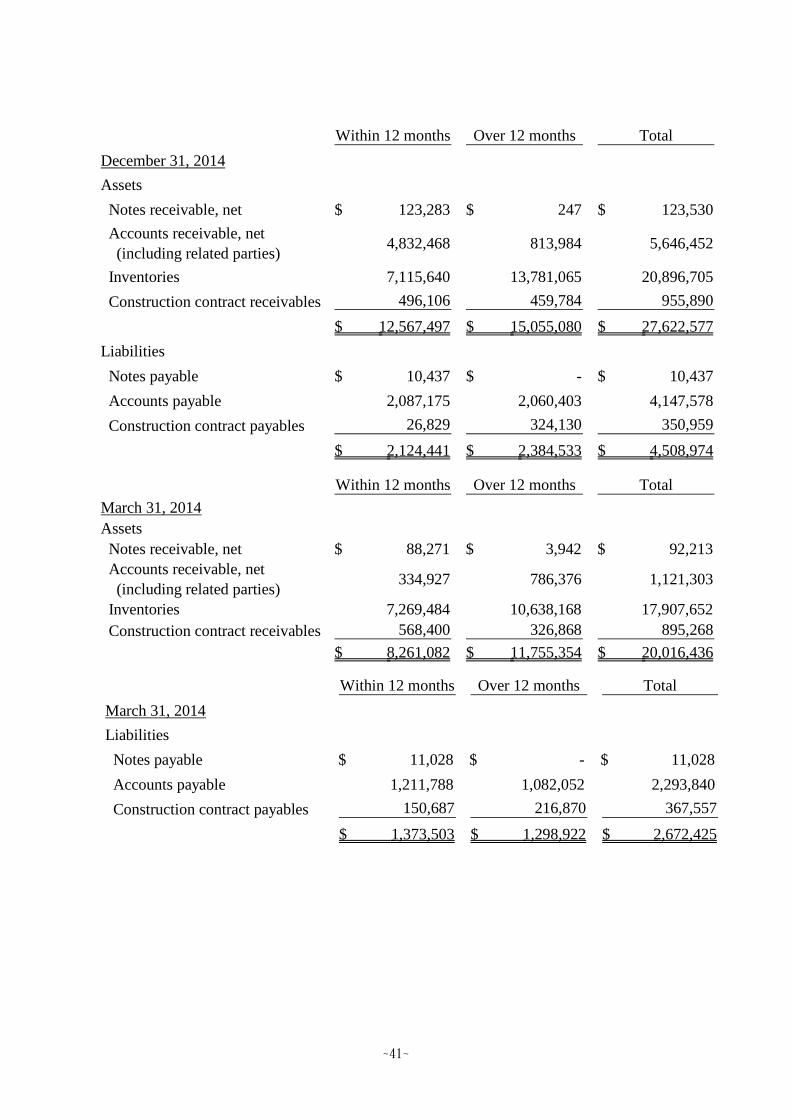
~41~
Within 12 months Over 12 months Total
December 31, 2014
Assets
Notes receivable, net 123,283$ 247$ 123,530$
Accounts receivable, net
(including related parties)4,832,468 813,984 5,646,452
Inventories 7,115,640 13,781,065 20,896,705
Construction contract receivables 496,106 459,784 955,890
12,567,497$ 15,055,080$ 27,622,577$
Liabilities
Notes payable 10,437$ -$ 10,437$
Accounts payable 2,087,175 2,060,403 4,147,578
Construction contract payables 26,829 324,130 350,959
2,124,441$ 2,384,533$ 4,508,974$
Within 12 months Over 12 months Total
March 31, 2014
Assets
Notes receivable, net 88,271$ 3,942$ 92,213$
Accounts receivable, net
(including related parties)334,927 786,376 1,121,303
Inventories 7,269,484 10,638,168 17,907,652
Construction contract receivables 568,400 326,868 895,268
8,261,082$ 11,755,354$ 20,016,436$
Within 12 months Over 12 months Total
March 31, 2014
Liabilities
Notes payable 11,028$ -$ 11,028$
Accounts payable 1,211,788 1,082,052 2,293,840
Construction contract payables 150,687 216,870 367,557
1,373,503$ 1,298,922$ 2,672,425$

~42~
(27) Operating revenue
(28) Other income
(29) Other gains and losses
Note 1: Please refer to Note 9(14) for details.
Note 2: Please refer to Note 6(8) for details.
2015 2014
Sales revenue 1,625,631$ 1,508,640$
Service revenue 123,337 129,496
Construction contract revenues 876,494 798,444
Service concession revenue
-Operating service revenue 90,524 90,062
2,715,986$ 2,526,642$
Three-month periods ended March 31,
2015 2014
Interest income 1,249$ 992$
Dividend income 28,228 176,439
Others 17,818 19,076
47,295$ 196,507$
Three-month periods ended March 31,
2015 2014
Net (losses) gains on financial liabilities at fair 6,090$ 4,560)($
value through profit or loss
Net currency exchange gains (losses) 4,030)( 8,310
Arbitration expenses and compensation loss(Note 1)
Impairment of financial assets (Note 2) - 11,813)(
Others 490 102)(
48,785)($ 8,165)($
Three-month periods ended March 31,
51,335)( -
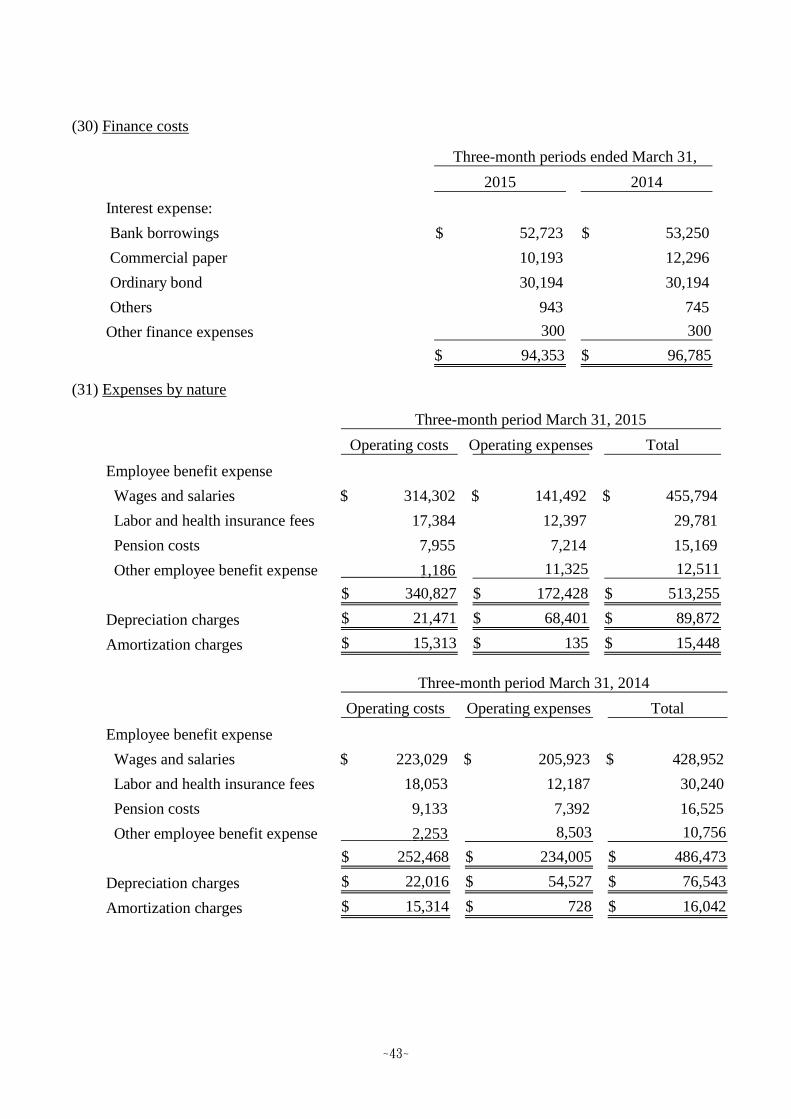
~43~
(30) Finance costs
(31) Expenses by nature
2015 2014
Interest expense:
Bank borrowings 52,723$ 53,250$
Commercial paper 10,193 12,296
Ordinary bond 30,194 30,194
Others 943 745
Other finance expenses 300 300
94,353$ 96,785$
Three-month periods ended March 31,
Operating costs Operating expenses Total
Employee benefit expense
Wages and salaries 314,302$ 141,492$ 455,794$
Labor and health insurance fees 17,384 12,397 29,781
Pension costs 7,955 7,214 15,169
Other employee benefit expense 1,186 11,325 12,511
340,827$ 172,428$ 513,255$
Depreciation charges 21,471$ 68,401$ 89,872$
Amortization charges 15,313$ 135$ 15,448$
Three-month period March 31, 2015
Operating costs Operating expenses Total
Employee benefit expense
Wages and salaries 223,029$ 205,923$ 428,952$
Labor and health insurance fees 18,053 12,187 30,240
Pension costs 9,133 7,392 16,525
Other employee benefit expense 2,253 8,503 10,756
252,468$ 234,005$ 486,473$
Depreciation charges 22,016$ 54,527$ 76,543$
Amortization charges 15,314$ 728$ 16,042$
Three-month period March 31, 2014
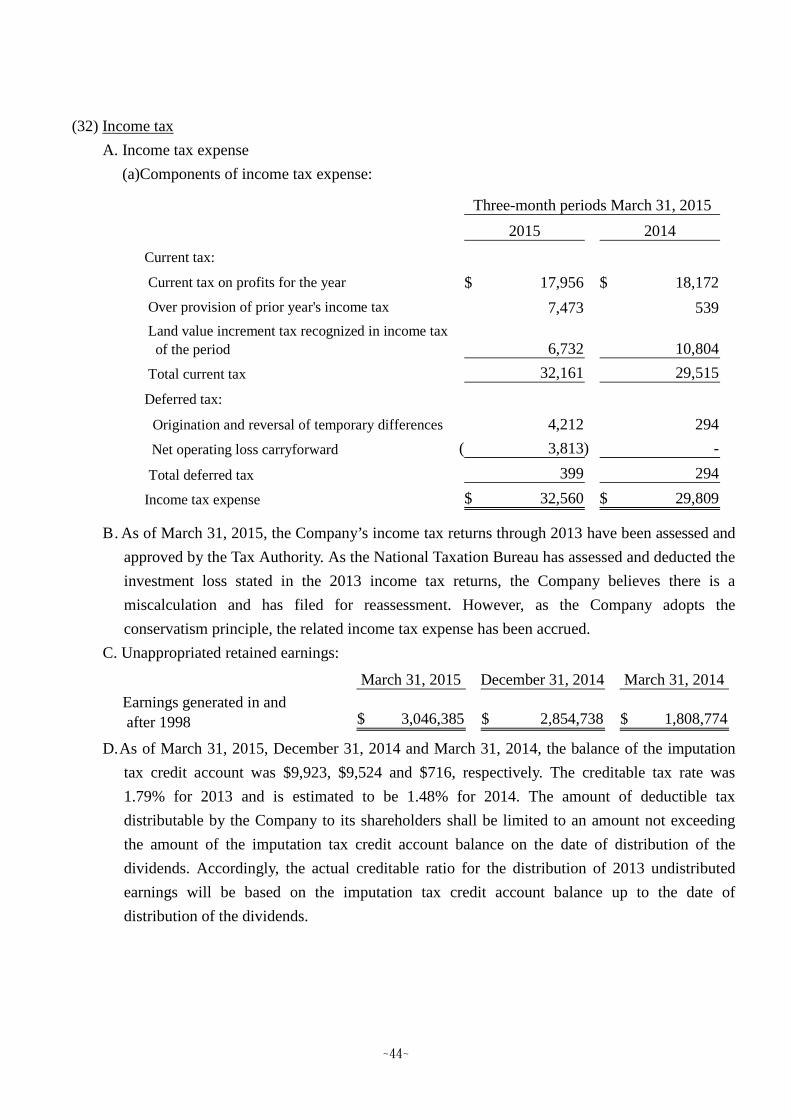
~44~
(32) Income tax
A. Income tax expense
(a)Components of income tax expense:
B. As of March 31, 2015, the Company’s income tax returns through 2013 have been assessed and
approved by the Tax Authority. As the National Taxation Bureau has assessed and deducted the
investment loss stated in the 2013 income tax returns, the Company believes there is a
miscalculation and has filed for reassessment. However, as the Company adopts the
conservatism principle, the related income tax expense has been accrued.
C. Unappropriated retained earnings:
D.As of March 31, 2015, December 31, 2014 and March 31, 2014, the balance of the imputation
tax credit account was $9,923, $9,524 and $716, respectively. The creditable tax rate was
1.79% for 2013 and is estimated to be 1.48% for 2014. The amount of deductible tax
distributable by the Company to its shareholders shall be limited to an amount not exceeding
the amount of the imputation tax credit account balance on the date of distribution of the
dividends. Accordingly, the actual creditable ratio for the distribution of 2013 undistributed
earnings will be based on the imputation tax credit account balance up to the date of
distribution of the dividends.
2015 2014
Current tax:
Current tax on profits for the year 17,956$ 18,172$
7,473 539
6,732 10,804
Total current tax 32,161 29,515
Deferred tax:
4,212 294
Net operating loss carryforward 3,813)( -
Total deferred tax 399 294
Income tax expense 32,560$ 29,809$
Three-month periods March 31, 2015
Over provision of prior year's income tax
Land value increment tax recognized in income tax
of the period
Origination and reversal of temporary differences
March 31, 2015 December 31, 2014 March 31, 2014
Earnings generated in and
after 1998 3,046,385$ 2,854,738$ 1,808,774$
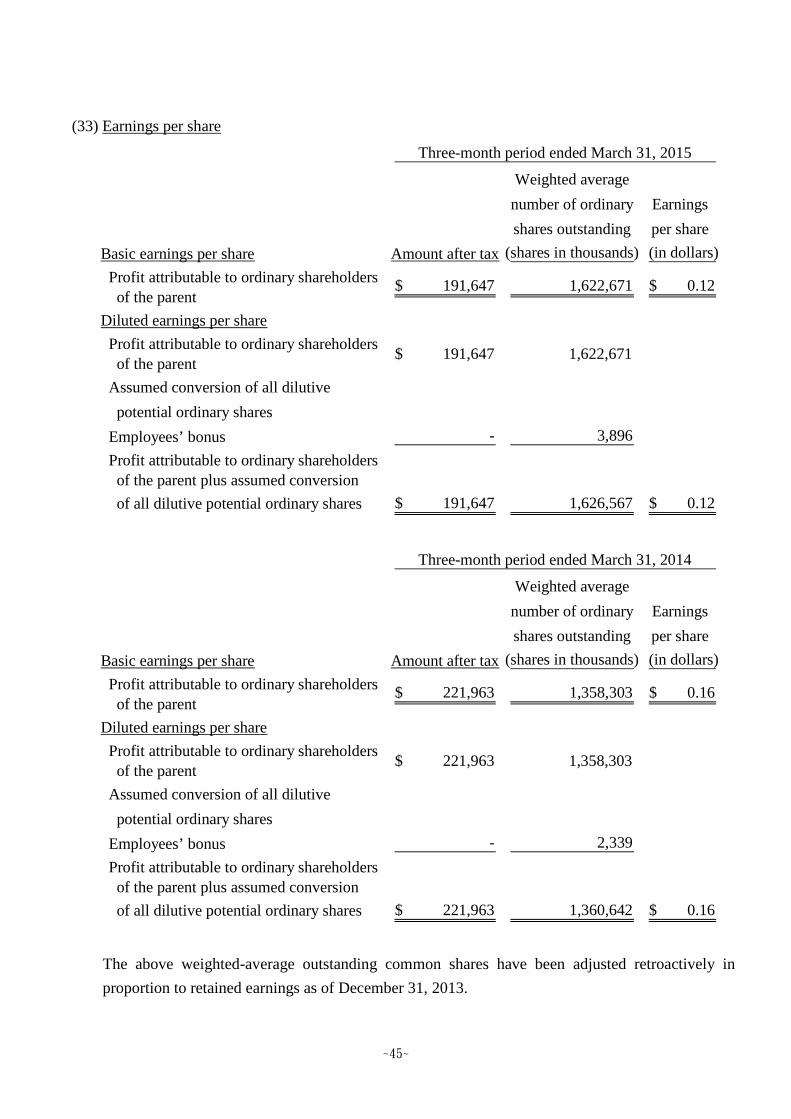
~45~
(33) Earnings per share
The above weighted-average outstanding common shares have been adjusted retroactively in
proportion to retained earnings as of December 31, 2013.
Weighted average
number of ordinary Earnings
shares outstanding per share
Basic earnings per share Amount after tax (shares in thousands) (in dollars)
Profit attributable to ordinary shareholders
of the parent191,647$ 1,622,671 0.12$
Diluted earnings per share
Profit attributable to ordinary shareholders
of the parent191,647$ 1,622,671
Assumed conversion of all dilutive
potential ordinary shares
Employees’ bonus - 3,896
Profit attributable to ordinary shareholders
of the parent plus assumed conversion
of all dilutive potential ordinary shares 191,647$ 1,626,567 0.12$
Three-month period ended March 31, 2015
Weighted average
number of ordinary Earnings
shares outstanding per share
Basic earnings per share Amount after tax (shares in thousands) (in dollars)
Profit attributable to ordinary shareholders
of the parent221,963$ 1,358,303 0.16$
Diluted earnings per share
Profit attributable to ordinary shareholders
of the parent221,963$ 1,358,303
Assumed conversion of all dilutive
potential ordinary shares
Employees’ bonus - 2,339
Profit attributable to ordinary shareholders
of the parent plus assumed conversion
of all dilutive potential ordinary shares 221,963$ 1,360,642 0.16$
Three-month period ended March 31, 2014
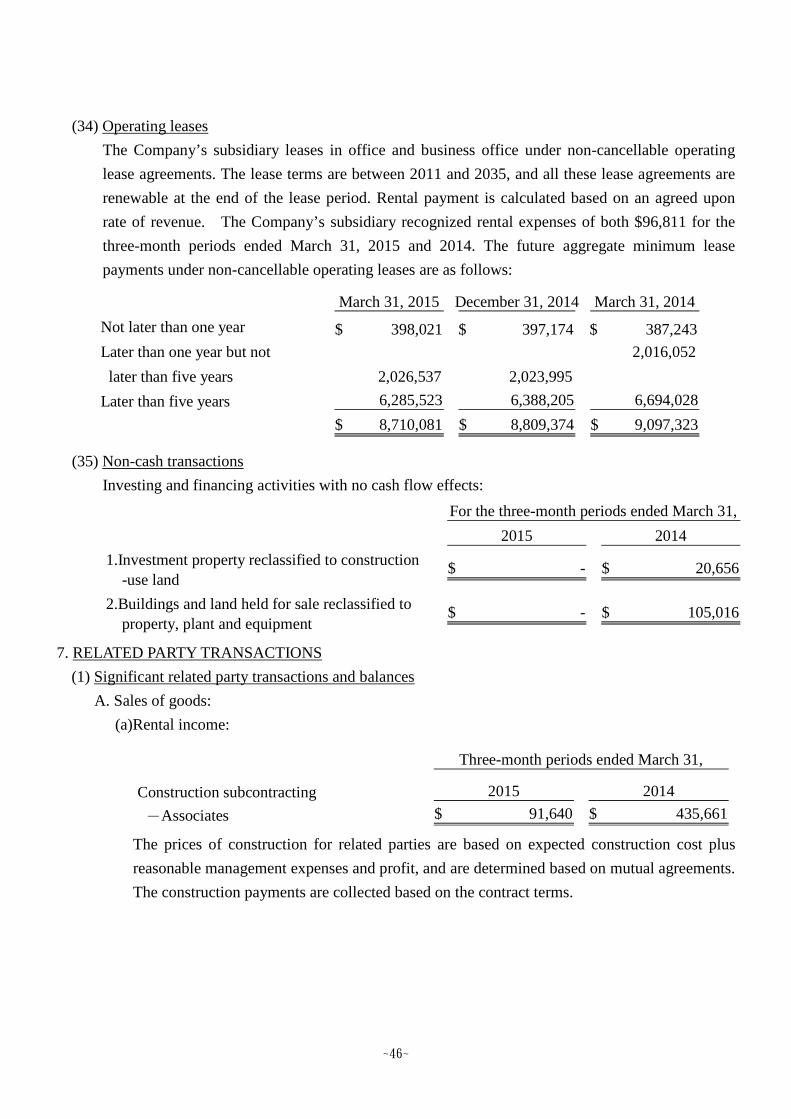
~46~
(34) Operating leases
The Company’s subsidiary leases in office and business office under non-cancellable operating
lease agreements. The lease terms are between 2011 and 2035, and all these lease agreements are
renewable at the end of the lease period. Rental payment is calculated based on an agreed upon
rate of revenue. The Company’s subsidiary recognized rental expenses of both $96,811 for the
three-month periods ended March 31, 2015 and 2014. The future aggregate minimum lease
payments under non-cancellable operating leases are as follows:
(35) Non-cash transactions
Investing and financing activities with no cash flow effects:
7. RELATED PARTY TRANSACTIONS
(1) Significant related party transactions and balances
A. Sales of goods:
(a)Rental income:
The prices of construction for related parties are based on expected construction cost plus
reasonable management expenses and profit, and are determined based on mutual agreements.
The construction payments are collected based on the contract terms.
March 31, 2015 December 31, 2014 March 31, 2014
Not later than one year 398,021$ 397,174$ 387,243$
Later than one year but not 2,016,052
later than five years 2,026,537 2,023,995
Later than five years 6,285,523 6,388,205 6,694,028
8,710,081$ 8,809,374$ 9,097,323$
2015 2014
1.Investment property reclassified to construction
-use land-$ 20,656$
2.Buildings and land held for sale reclassified to
property, plant and equipment-$ 105,016$
For the three-month periods ended March 31,
Construction subcontracting 2015 2014
-Associates 91,640$ 435,661$
Three-month periods ended March 31,
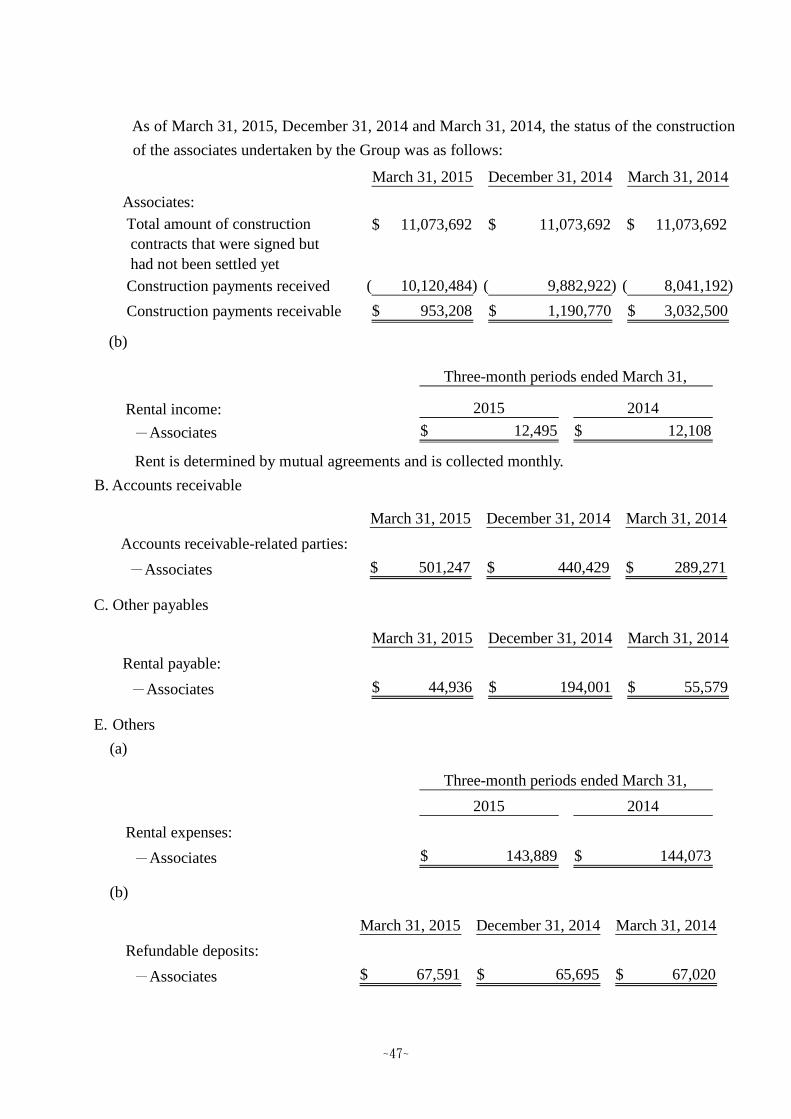
~47~
As of March 31, 2015, December 31, 2014 and March 31, 2014, the status of the construction
of the associates undertaken by the Group was as follows:
(b)
Rent is determined by mutual agreements and is collected monthly.
B. Accounts receivable
C. Other payables
E. Others
(a)
(b)
March 31, 2015 December 31, 2014 March 31, 2014
Associates:
Total amount of construction
contracts that were signed but
had not been settled yet
11,073,692$ 11,073,692$ 11,073,692$
Construction payments received 10,120,484)( 9,882,922)( 8,041,192)(
Construction payments receivable 953,208$ 1,190,770$ 3,032,500$
Rental income: 2015 2014
-Associates 12,495$ 12,108$
Three-month periods ended March 31,
March 31, 2015 December 31, 2014 March 31, 2014
Accounts receivable-related parties:
-Associates 501,247$ 440,429$ 289,271$
March 31, 2015 December 31, 2014 March 31, 2014
Rental payable:
-Associates 44,936$ 194,001$ 55,579$
2015 2014
Rental expenses:
-Associates 143,889$ 144,073$
Three-month periods ended March 31,
March 31, 2015 December 31, 2014 March 31, 2014
Refundable deposits:
-Associates 67,591$ 65,695$ 67,020$
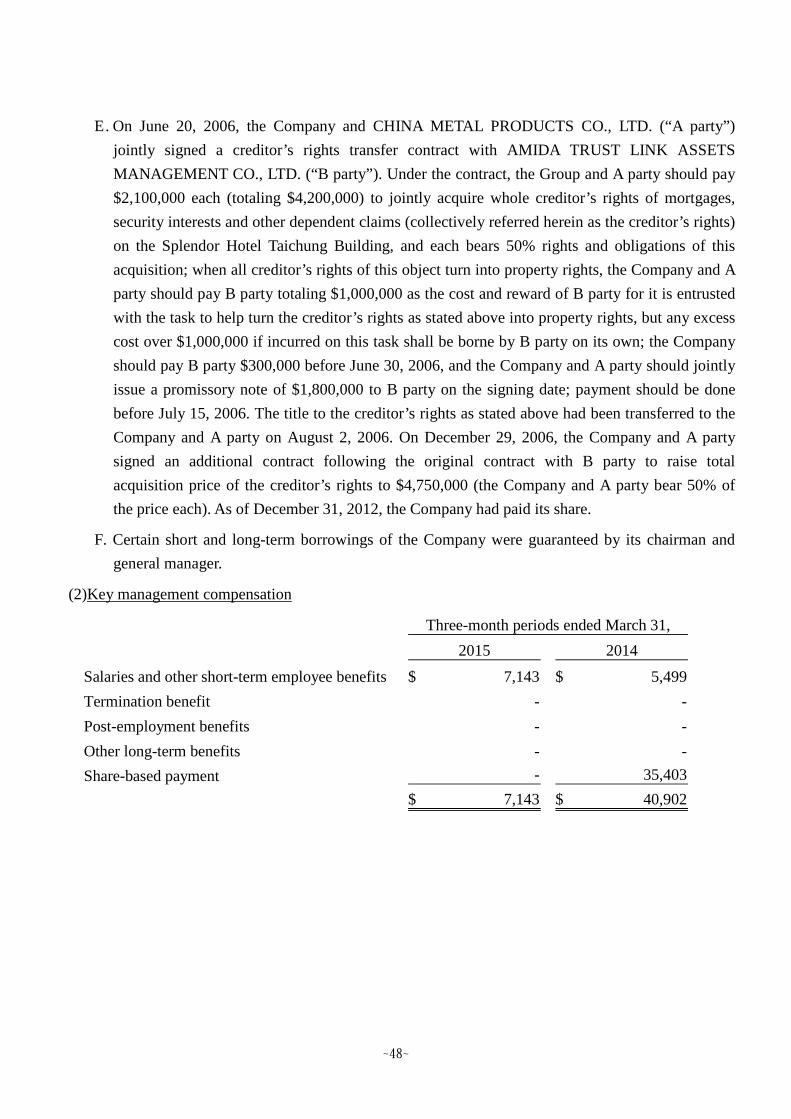
~48~
E. On June 20, 2006, the Company and CHINA METAL PRODUCTS CO., LTD. (“A party”)
jointly signed a creditor’s rights transfer contract with AMIDA TRUST LINK ASSETS
MANAGEMENT CO., LTD. (“B party”). Under the contract, the Group and A party should pay
$2,100,000 each (totaling $4,200,000) to jointly acquire whole creditor’s rights of mortgages,
security interests and other dependent claims (collectively referred herein as the creditor’s rights)
on the Splendor Hotel Taichung Building, and each bears 50% rights and obligations of this
acquisition; when all creditor’s rights of this object turn into property rights, the Company and A
party should pay B party totaling $1,000,000 as the cost and reward of B party for it is entrusted
with the task to help turn the creditor’s rights as stated above into property rights, but any excess
cost over $1,000,000 if incurred on this task shall be borne by B party on its own; the Company
should pay B party $300,000 before June 30, 2006, and the Company and A party should jointly
issue a promissory note of $1,800,000 to B party on the signing date; payment should be done
before July 15, 2006. The title to the creditor’s rights as stated above had been transferred to the
Company and A party on August 2, 2006. On December 29, 2006, the Company and A party
signed an additional contract following the original contract with B party to raise total
acquisition price of the creditor’s rights to $4,750,000 (the Company and A party bear 50% of
the price each). As of December 31, 2012, the Company had paid its share.
F. Certain short and long-term borrowings of the Company were guaranteed by its chairman and
general manager.
(2)Key management compensation
2015 2014
Salaries and other short-term employee benefits 7,143$ 5,499$
Termination benefit - -
Post-employment benefits - -
Other long-term benefits - -
Share-based payment - 35,403
7,143$ 40,902$
Three-month periods ended March 31,

~49~
8. PLEDGED ASSETS
The Group’s assets pledged as collateral are as follows:
9. SIGNIFICANT CONTINGENT LIABILITIES AND UNRECOGNIZED CONTRACT
COMMITMENTS
(1) Summary of endorsements and guarantees and financial support commitments is as follows:
A.Summary of endorsements and guarantees provided by the Company to subsidiaries is as
follows:
Pledged asset March 31, 2015 December 31, 2014 March 31, 2014 Purpose
Demand deposits, certificate of deposit and 3,693,278$ 3,684,947$ 7,894,135$ To obtain a higher credit for client, performance
checking deposit (shown as "other financial guarantee, construction performance guarantee,
assets - current" and "other financial assets - short-term and long-term borrowings,
non-current") short-term commercial papers issue, member
reward points and gift coupons trust account
Financial assets at fair value through profit 77,547 77,547 77,100 Construction performance guarantees,
or loss short-term and long-term borrowings
Land held for construction 6,064,724 6,300,506 6,863,803 Short-term borrowings, notes and
bills payable and long-term borrwings
Construction in progress 1,419,577 1,275,593 2,768,401 Short-term borrowings, notes and
bills payable and long-term borrwings
Available-for-sale financial assets 925,938 1,033,280 1,483,129 Short-term borrowings, notes and
bills payable
Financial assets carried at cost 575,426 575,426 575,426 Short-term borrowings, notes and
bills payable
Investments accounted for under equity method 1,550,640 1,120,379 1,462,320 Short-term borrowings, notes and
bills payable
Land 2,883,788 2,883,788 2,884,737 Construction performance guarantees,
short-term borrowings, notes and bills
payable and long-term borrowings
Buildings 2,085,390 2,103,423 2,150,119 Short-term borrowings, notes and bills
payable and long-term borrowings
Investment property 4,077,499 4,807,921 6,675,508 Construction performance guarantees,
short-term borrowings, notes and bills
payable and long-term borrowings
23,353,807$ 23,862,810$ 32,834,678$
Total Total Total
endorsement Amount endorsement Amount endorsement Amount
Name of company amount drawn amount drawn amount drawn
The Splendor Hotel Taichung 2,000,000$ 1,752,610$ 2,000,000$ 1,773,973$ 2,000,000$ 1,756,229$
Ta-Chen Construction & Engineering Corp. 1,900,000 100,000 1,900,000 160,256 1,900,000 698,572
3,900,000$ 1,852,610$ 3,900,000$ 1,934,229$ 3,900,000$ 2,454,801$
March 31, 2015 December 31, 2014 March 31, 2014
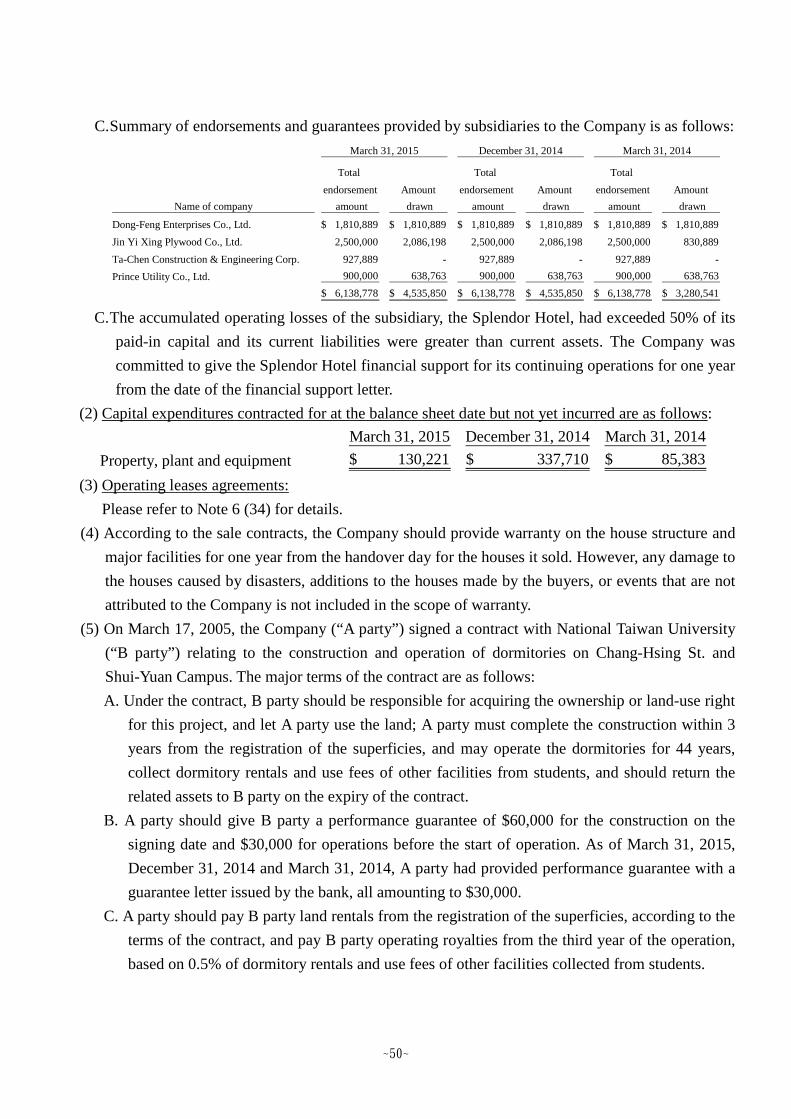
~50~
C.Summary of endorsements and guarantees provided by subsidiaries to the Company is as follows:
C.The accumulated operating losses of the subsidiary, the Splendor Hotel, had exceeded 50% of its
paid-in capital and its current liabilities were greater than current assets. The Company was
committed to give the Splendor Hotel financial support for its continuing operations for one year
from the date of the financial support letter.
(2) Capital expenditures contracted for at the balance sheet date but not yet incurred are as follows:
(3) Operating leases agreements:
Please refer to Note 6 (34) for details.
(4) According to the sale contracts, the Company should provide warranty on the house structure and
major facilities for one year from the handover day for the houses it sold. However, any damage to
the houses caused by disasters, additions to the houses made by the buyers, or events that are not
attributed to the Company is not included in the scope of warranty.
(5) On March 17, 2005, the Company (“A party”) signed a contract with National Taiwan University
(“B party”) relating to the construction and operation of dormitories on Chang-Hsing St. and
Shui-Yuan Campus. The major terms of the contract are as follows:
A. Under the contract, B party should be responsible for acquiring the ownership or land-use right
for this project, and let A party use the land; A party must complete the construction within 3
years from the registration of the superficies, and may operate the dormitories for 44 years,
collect dormitory rentals and use fees of other facilities from students, and should return the
related assets to B party on the expiry of the contract.
B. A party should give B party a performance guarantee of $60,000 for the construction on the
signing date and $30,000 for operations before the start of operation. As of March 31, 2015,
December 31, 2014 and March 31, 2014, A party had provided performance guarantee with a
guarantee letter issued by the bank, all amounting to $30,000.
C. A party should pay B party land rentals from the registration of the superficies, according to the
terms of the contract, and pay B party operating royalties from the third year of the operation,
based on 0.5% of dormitory rentals and use fees of other facilities collected from students.
Total Total Total
endorsement Amount endorsement Amount endorsement Amount
Name of company amount drawn amount drawn amount drawn
Dong-Feng Enterprises Co., Ltd. 1,810,889$ 1,810,889$ 1,810,889$ 1,810,889$ 1,810,889$ 1,810,889$
Jin Yi Xing Plywood Co., Ltd. 2,500,000 2,086,198 2,500,000 2,086,198 2,500,000 830,889
Ta-Chen Construction & Engineering Corp. 927,889 - 927,889 - 927,889 -
Prince Utility Co., Ltd. 900,000 638,763 900,000 638,763 900,000 638,763
6,138,778$ 4,535,850$ 6,138,778$ 4,535,850$ 6,138,778$ 3,280,541$
March 31, 2015 December 31, 2014 March 31, 2014
March 31, 2015 December 31, 2014 March 31, 2014
Property, plant and equipment 130,221$ 337,710$ 85,383$
~51~
D. Terms of restrictions for A party:
(a)The ratio of A party’s own capital utilized in this project to total construction cost of this
project should be at least 30%;
(b) During the operation period, the ratio of shareholders’ equity to total assets should be at
least 25%; and current ratio (current assets/current liabilities) should be at least 100%;
(c) All rights acquired by A party under the contract, except for other conditions specified in the
contract and approved by B party, should not be transferred, leased, registered as a
liability/obligation or become an executed object of civil litigation.
(6) On May 10, 2005, the Company (“A party”) signed a contract with National Cheng Kung
University (“B party”) relating to the construction and operation of student dormitories and
alumni hall. The major terms of the contract are as follows:
A. Under the contract, B party should be responsible for acquiring the ownership or land-use right
for this project, and let A party use the land by way of registration of the superficies; A party
must obtain the user license within 3 years after the signing date, and may operate the student
dormitories and motorcycle parking lots for 35 years from the start of operation and collect
dormitory rentals and use fees of other facilities from students for 50 years from the start of
construction, and should return the related assets to B party on the expiry of the contract.
B. A party should give B party performance guarantee of $50,000 for this project on the signing
date, which will be returned in installment according to the contractual terms. As of March 31,
2015, December 31, 2014 and March 31, 2014, A party had provided performance guarantee
with a guarantee letter issued by the bank, all amounting to $20,000.
C. During the operation period, A party should pay B party dormitory operating royalties based on
2% of annual operating revenue of the dormitories and auxiliary facilities operating royalties
based on 4% of annual operating revenue of the auxiliary facilities. A party should pay such
operating royalties for prior year before the end of June every year. Further, according to the
superficies contract signed by the two parties, A party should pay B party land rentals from the
registration of superficies.
D. All rights acquired by A party under the contract, except for other conditions specified in the
contract and approved by B party, should not be transferred, leased, registered as a
liability/obligation or become an executed object of civil litigation.
(7)The Company signed a syndicated loan contract with 7 banks - Mega International Commercial
Bank as the lead bank for a credit line of $2.16 billion. The syndicated loans include long-term
(secured) loans and guarantee payments receivable (secured), which are used to fund the
construction of dormitories in Changxing St. Campus and Shuiyuan Campus of National Taiwan
University. During the loan period, the Company should maintain financial commitments such as
current ratio, liability ratio and interest coverage; those financial ratios/restrictions shall be
reviewed at least once every year, based on the Company’s audited annual non-consolidated
financial statements. If the Company violates the above financial commitments, it shall improve its
~52~
financial position by capital increase or other ways before the end of October of the following year
from the year of violation; it would not be regarded as a default if the managing bank confirms that
its financial position has improved completely. In case of violation, interest on the loans would be
charged at the loan rate specified in the contract plus additional 0.25% per annum from the
notification date of the managing bank to the completion date of financial improvement or to the
date the Company gains the relief from the consortium for its violation.
(8)The Company signed a loan contract with Mega International Commercial Bank for a credit line of
$785 million. The loans include long-term (secured) loans and guarantee payments receivable
(secured), which are used to fund the construction of student dormitories and alumnus hall of
National Cheng Kung University. During the loan period, the Company should maintain financial
commitments such as current ratio, liability ratio and interest coverage; those financial
ratios/restrictions shall be reviewed at least once every year. Current ratio and liability ratio shall
be reviewed based on the Company’s audited annual non-consolidated financial statements, and
interest coverage based on the Company’s revenue and expenditure table for the related project. If
the Company violates the above financial commitments, it shall improve its financial position by
capital increase or other ways before the end of October of the following year from the year of
violation; it would not be regarded as a default if the bank confirms that its financial position has
improved completely. In case of violation, interest on the loans would be charged at the loan rate
specified in the contract plus additional 0.25% per annum from the notification date of the bank to
the completion date of financial improvement or to the date the Company obtains a waiver from
the bank for its violation.
(9)The Company signed a syndicated loan contract with 10 banks - Bank of Taiwan Co., Ltd. as the
lead bank for a credit line of $2 billion. The syndicated loans are medium-term (secured) loans,
and are used for residential building construction cooperated by the Company and Taiwan Sugar
Corporation (“TSC”) on Guo--An Sec., Xitun District, Taichung City. Furthermore, the Company
shall repay in full for the balance of unpaid principal on maturity date. However, when the
buildings in the case are completed and sold or when handling buyer’s household debt, borrower
should repay the balance of used and unpaid principal for the syndicated loans with 70% of selling
consideration.
(10)On May 18, 2007, the Company signed a contract with Taiwan Sugar Corporation (“TSC”) in
relation to cooperative construction of houses. According to the contract, TSC shall provide Lot
No. 12-12, Guo-An Sec., Xitun District, Taichung City; the Company shall provide funding for
those projects and repurchase houses and land allocated to TSC amounting to $1,810,889 and
shall bear all improvement fees of houses, public facilities and land, selling expenses, and other
expenses or contributed expenses required under the decrees. The Company shall not ask for any
compensation for price fluctuations or other reasons. Further, under the contract, the Company
shall give TSC performance guarantee amounting to $181,090, respectively, on the signing date,
which will be returned in installments according to the contractual terms. The Company had
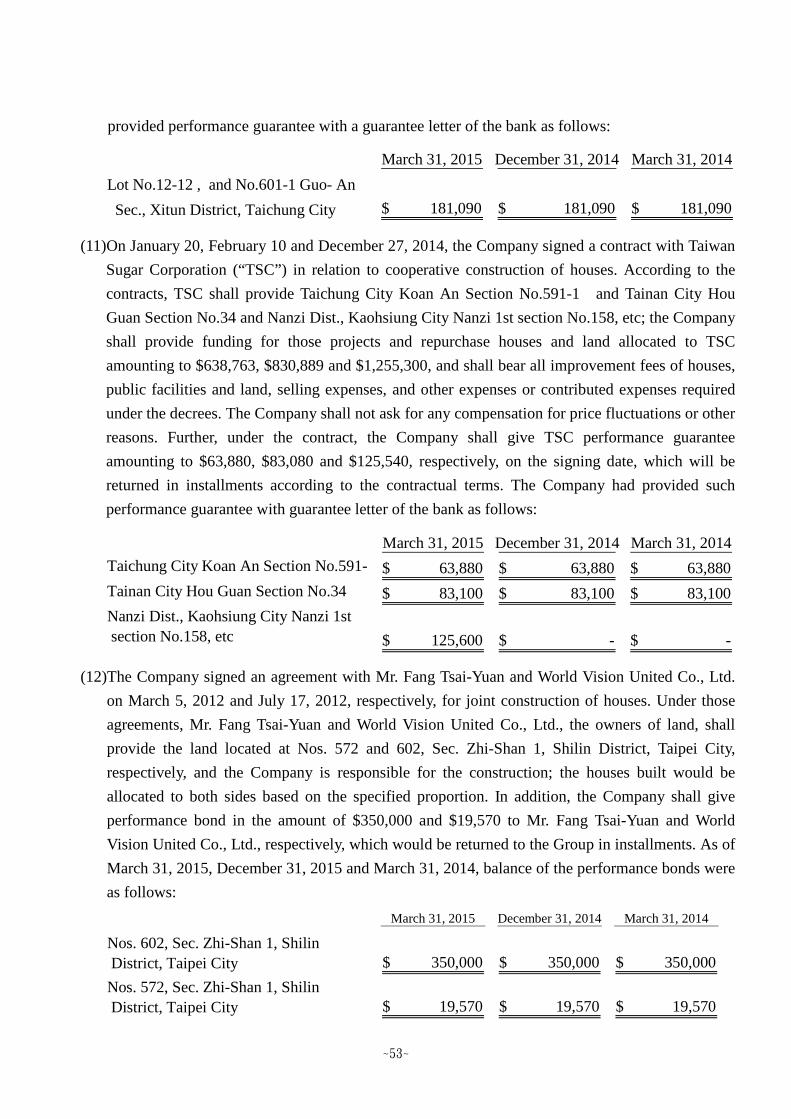
~53~
provided performance guarantee with a guarantee letter of the bank as follows:
(11)On January 20, February 10 and December 27, 2014, the Company signed a contract with Taiwan
Sugar Corporation (“TSC”) in relation to cooperative construction of houses. According to the
contracts, TSC shall provide Taichung City Koan An Section No.591-1 and Tainan City Hou
Guan Section No.34 and Nanzi Dist., Kaohsiung City Nanzi 1st section No.158, etc; the Company
shall provide funding for those projects and repurchase houses and land allocated to TSC
amounting to $638,763, $830,889 and $1,255,300, and shall bear all improvement fees of houses,
public facilities and land, selling expenses, and other expenses or contributed expenses required
under the decrees. The Company shall not ask for any compensation for price fluctuations or other
reasons. Further, under the contract, the Company shall give TSC performance guarantee
amounting to $63,880, $83,080 and $125,540, respectively, on the signing date, which will be
returned in installments according to the contractual terms. The Company had provided such
performance guarantee with guarantee letter of the bank as follows:
(12)The Company signed an agreement with Mr. Fang Tsai-Yuan and World Vision United Co., Ltd.
on March 5, 2012 and July 17, 2012, respectively, for joint construction of houses. Under those
agreements, Mr. Fang Tsai-Yuan and World Vision United Co., Ltd., the owners of land, shall
provide the land located at Nos. 572 and 602, Sec. Zhi-Shan 1, Shilin District, Taipei City,
respectively, and the Company is responsible for the construction; the houses built would be
allocated to both sides based on the specified proportion. In addition, the Company shall give
performance bond in the amount of $350,000 and $19,570 to Mr. Fang Tsai-Yuan and World
Vision United Co., Ltd., respectively, which would be returned to the Group in installments. As of
March 31, 2015, December 31, 2015 and March 31, 2014, balance of the performance bonds were
as follows:
March 31, 2015 December 31, 2014 March 31, 2014
Lot No.12-12 , and No.601-1 Guo- An
Sec., Xitun District, Taichung City 181,090$ 181,090$ 181,090$
March 31, 2015 December 31, 2014 March 31, 2014
Taichung City Koan An Section No.591-
163,880$ 63,880$ 63,880$
Tainan City Hou Guan Section No.34 83,100$ 83,100$ 83,100$
Nanzi Dist., Kaohsiung City Nanzi 1st
section No.158, etc 125,600$ -$ -$
March 31, 2015 December 31, 2014 March 31, 2014
Nos. 602, Sec. Zhi-Shan 1, Shilin
District, Taipei City 350,000$ 350,000$ 350,000$
Nos. 572, Sec. Zhi-Shan 1, Shilin
District, Taipei City 19,570$ 19,570$ 19,570$
~54~
(13)As of March 31, 2015, December 31, 2014 and March 31, 2014, performance guarantee letters
issued for construction undertaking, warranty and leases of subsidiary, Ta-Chen Construction &
Engineering Corp., amounted to $723,416, $780,581 and $972,382, respectively.
(14)The Subsidiary, Ta-Chen Construction & Engineering Corp. (“Ta-Chen”), and Hung-Yi
Construction Corp. and Evergreen International Engineering Corp. (collectively referred herein as
the joint constructors) jointly undertook the construction of the new office building of the
American Institute in Taiwan. As the joint contractors and the owner of this project both claim the
counterparty defaulted on the contract, they terminated the contract and referred the dispute to
arbitration. A settlement was reached in August 2013, and the joint contractors would together pay
a reconciliation payment amounting to US$16.4 million, which Ta-Chen pays 68.24%. Ta-Chen
has estimated and recognized related arbitration expenses, reconciliation payment and
construction loss.
Furthermore, Ta-Chen has paid the settlement on behalf of the joint constructors. Ta-Chen planned
to request Evergreen International Engineering to pay all payments on behalf of other joint
contractions. As of December 31, 2014, payments on behalf of other joint contractors recognized
as other receivables were $221,100. As joint contractors have arguments toward the contract,
Ta-Chen has filed an arbitration application to the Chinese Arbitration Association, Taipei, and
received an arbitration award on March 27, 2015 which, Evergreen International Engineering shall
pay Ta-Chen a total amount of $169,765 along with interest at 5% per annum from December 17,
2013 until the date of payment. Ta-Chen has written off related other receivables and recognized
arbitration loss of $51,335 (shown as other gains and losses) in the first quarter of 2015. However,
as the amount in the arbitration award may have been miscalculated and Ta-Chen applied for
correcting the amount to $201,427. The ruling for application has yet to be made.
(15)Certain construction contracts undertaken by subsidiary, Ta-Chen Construction & Engineering
Corp., specify that default penalty shall be computed according to the contractual terms if the
construction is not completed in the prescribed period.
(16)On May 27, 2011, subsidiary, The Splendor Hotel Taichung, signed a syndicated loan contract
with 3 banks, SinoPac Bank, etc., in the amount of $3.3 billion, with Prince Housing &
Development Corp. and China Metal Products Co., Ltd. as guarantors. Under the contract, the
subsidiary promised its tangible net equity shall not be negative and current ratio, liability ratio,
tangible net equity and interest coverage of Prince Housing & Development Corp. and China
Metal Products Co., Ltd. shall conform to certain criteria as specified in the contract. If the
subsidiary violates above financial commitments, the managing bank has the right to take the
following actions, including but not limited, according to the contract or the resolution of majority
of the consortium: 1) request the subsidiary to stop drawing down all or part of the loans; 2)
cancel all or part of the credit line of the contract which has not been drawn down yet; 3)
announce that all outstanding principal, interest and other accrued expenses payable to the
consortium in relation to the loan contract should mature immediately; 4) demand the subsidiary’s
~55~
payment of the promissory note acquired under the loan contract; 5) exercise creditor’s right of
mortgage, pledge right, other rights or contract transfer right; 6) exercise other rights given by the
laws, the loan contract and other relevant documents; 7) take other actions as resolved by the
majority of the consortium.
10. SIGNIFICANT DISASTER LOSS
None.
11. SIGNIFICANT EVENTS AFTER THE BALANCE SHEET DATE
In order to integrate resources to increase operation performances and competition, the Board of
Directors has resolved to merge the Company and the subsidiary–Prince Ta-Chen Investment Co., Ltd..
Prince Ta-Chen Investment Co., Ltd. will be the dissolved company while the Company will be the
surviving company. The merger is temporarily set to be effective on May 12, 2015. The Company’s
chairman is authorized to proceed with the necessary procedures if there is any need to change the
date or any unfinished issue.
12. OTHERS
(1) Capital management
The Group’s capital management is to ensure it has sufficient financial resource and operating
plans to meet operational capital for future needs, capital expenditure, obligation repayment and
dividend distribution. The Group adjusts borrowing amount in accordance with construction
progress and capital needed for operating.
(2) Financial instruments
A. Fair value information of financial instruments
The carrying amount of cash and cash equivalents and financial instruments measured at
recognized cost (including notes and accounts receivable, other receivables, short-term
borrowings, short-term notes and bills payable, notes and accounts payable and other payables)
are approximate to their fair values. Furthermore, the Group’s management believes the
carrying amounts of financial assets and liabilities not measured at fair value are approximate to
their fair value or their fair value cannot be reliably measured. Thus, the carrying amount is the
estimated fair value. The fair value information of financial instruments measured at fair value
is provided in Note 12(3).
B. Financial risk management policies
(a)The Group’s activities expose it to a variety of financial risks: market risk (including foreign
exchange risk, interest rate risk and price risk), credit risk and liquidity risk. The Group’s
overall risk management programme focuses on the unpredictability of financial markets
and seeks to minimize potential adverse effects on the Group’s financial position and
financial performance.
(b) Risk management is carried out by a central treasury department (Group's finance &
accounting division) under policies approved by the Board of Directors. Group's finance &
accounting division evaluates and hedges financial risks in close cooperation with the
~56~
Group’s operating units. The Board provides written principles for overall risk management,
as well as written policies covering specific areas and matters, such as foreign exchange
risk, interest rate risk, credit risk, use of derivative financial instruments and non-derivative
financial instruments, and investment of excess liquidity.
C. Significant financial risks and degrees of financial risks
(a) Market risk
Foreign exchange risk
The Group operates internationally and the currencies primarily used are NTD and USD.
Foreign exchange risk arises from recognized assets and liabilities and net investments in
foreign operations. Management has set up a policy to require the Group entities to manage
their foreign exchange risk against their functional currency. The Group entities are required
to manage their entire foreign exchange risk exposure with the Group finance & accounting
division. Foreign exchange risk does not have significant impact to the Group.
Interest rate risk
The Group’s interest rate risk arises from short-term and long-term borrowings. Borrowings
issued at variable rates expose the Group to cash flow interest rate risk which is partially
offset by cash and cash equivalents held at variable rates. Borrowings issued at fixed rates
expose the Group to fair value interest rate risk. The Group’s borrowings at variable rate
were denominated in the NTD. If interest rates on borrowings had been 0.1% basis point
higher/lower with all other variables held constant, pre-tax profit for the three-month
periods ended March 31, 2015 and 2014 would have been $12,419 and $15,735
lower/higher, respectively.
Price risk
The Group’s investments in equity instruments, and the prices would change due to the
change of the future value of investee companies. However, the Group has set a stop-loss
point and it was assessed that the Group was not exposed to significant price risk. If the
prices of these equity securities had increased/decreased by 10% with all other variables
held constant, pre-tax profit for the three-month periods ended March 31, 2015 and 2014
would both have increased/decreased by $35,753 and $35,819, respectively, as a result of
gains/losses on equity securities classified as at fair value through profit or loss. Other
components of equity would have increased/decreased by $19,771 and $29,933,
respectively, as a result of gains/losses on equity securities classified as available-for-sale.
(b) Credit risk
i. Credit risk refers to the risk of financial loss to the Group arising from default by the
clients or counterparties of financial instruments on the contract obligations. Credit risk
arises from cash and deposits with banks and financial institutions, including outstanding
receivables.
~57~
ii. The Group’s receivables, which are the receivables from pre-selling of housing before
completing construction and transferring the title, are installments received from
customers of pre-construction real estate. Therefore, it was assessed that the Group was
not exposed to significant credit risk from receivables.
iii. For the three-month periods ended March 31, 2015 and 2014, the management does not
expect any significant losses from non-performance by these counterparties.
(c) Liquidity risk
i. Cash flow forecasting is performed in the operating entities of the Group and aggregated
by Group’s finance & accounting division. Group's finance & accounting division
monitors rolling forecasts of the Group’s liquidity requirements to ensure it has sufficient
cash to meet operational needs while maintaining sufficient headroom on its undrawn
committed borrowing facilities at all times.
ii. The table below analyses the Group’s non-derivative financial liabilities into relevant
maturity groupings based on the remaining period at the balance sheet date to the
contractual maturity date for non-derivative financial liabilities. The amounts disclosed
in the table are the contractual undiscounted cash flows.
Within 1 year Between 1 to 3 years Over 3 years
Non-derivative financial liabilities:
Short-term borrowings 2,692,968$ -$ -$
Short-term notes and bills payable 2,085,000 - -
Notes payable 26,422 - -
Accounts payable 2,215,628 321,973 635,518
Other payables 1,065,136 5,417 89
Guarantee deposits received 91,356 20,385 31,710
Bonds payable 65,350 2,130,700 2,538,750
Long-term borrowings
(including current portion)1,997,830 2,410,944 6,242,296
March 31, 2015
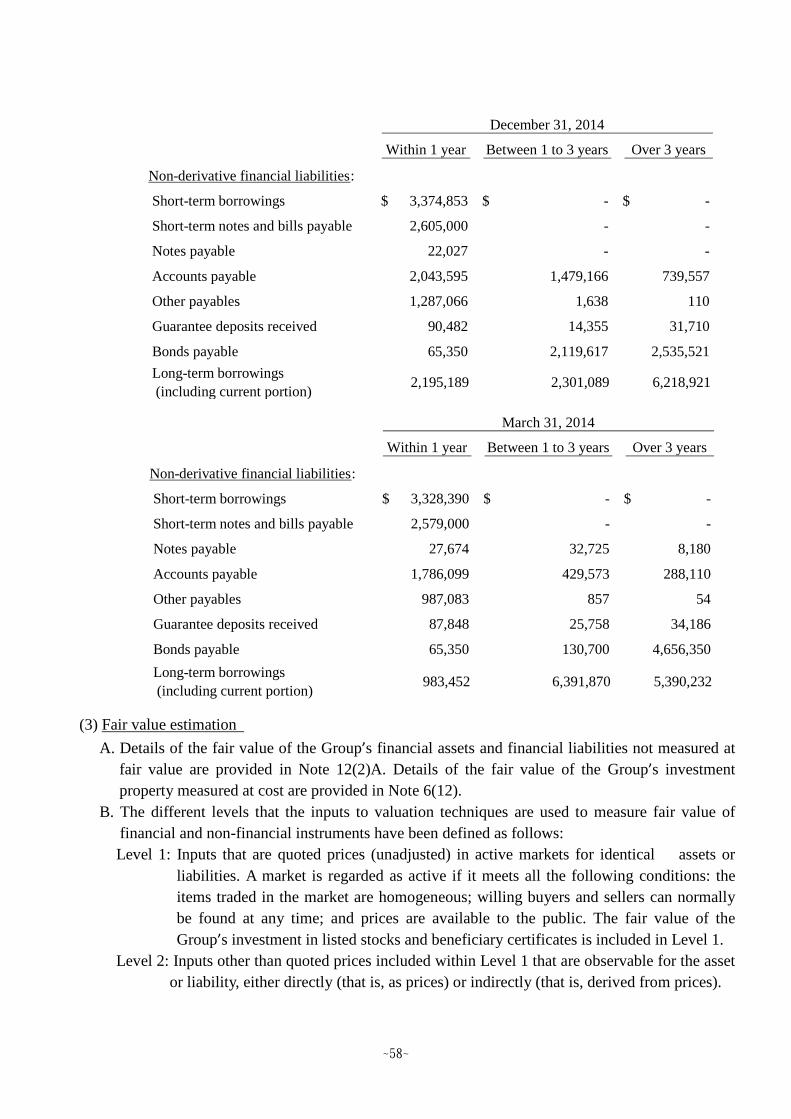
~58~
(3) Fair value estimation
A. Details of the fair value of the Group’s financial assets and financial liabilities not measured at
fair value are provided in Note 12(2)A. Details of the fair value of the Group’s investment
property measured at cost are provided in Note 6(12).
B. The different levels that the inputs to valuation techniques are used to measure fair value of
financial and non-financial instruments have been defined as follows:
Level 1: Inputs that are quoted prices (unadjusted) in active markets for identical assets or
liabilities. A market is regarded as active if it meets all the following conditions: the
items traded in the market are homogeneous; willing buyers and sellers can normally
be found at any time; and prices are available to the public. The fair value of the
Group’s investment in listed stocks and beneficiary certificates is included in Level 1.
Level 2: Inputs other than quoted prices included within Level 1 that are observable for the asset
or liability, either directly (that is, as prices) or indirectly (that is, derived from prices).
Within 1 year Between 1 to 3 years Over 3 years
Non-derivative financial liabilities:
Short-term borrowings 3,374,853$ -$ -$
Short-term notes and bills payable 2,605,000 - -
Notes payable 22,027 - -
Accounts payable 2,043,595 1,479,166 739,557
Other payables 1,287,066 1,638 110
Guarantee deposits received 90,482 14,355 31,710
Bonds payable 65,350 2,119,617 2,535,521
Long-term borrowings
(including current portion)2,195,189 2,301,089 6,218,921
December 31, 2014
Within 1 year Between 1 to 3 years Over 3 years
Non-derivative financial liabilities:
Short-term borrowings 3,328,390$ -$ -$
Short-term notes and bills payable 2,579,000 - -
Notes payable 27,674 32,725 8,180
Accounts payable 1,786,099 429,573 288,110
Other payables 987,083 857 54
Guarantee deposits received 87,848 25,758 34,186
Bonds payable 65,350 130,700 4,656,350
Long-term borrowings
(including current portion)983,452 6,391,870 5,390,232
March 31, 2014
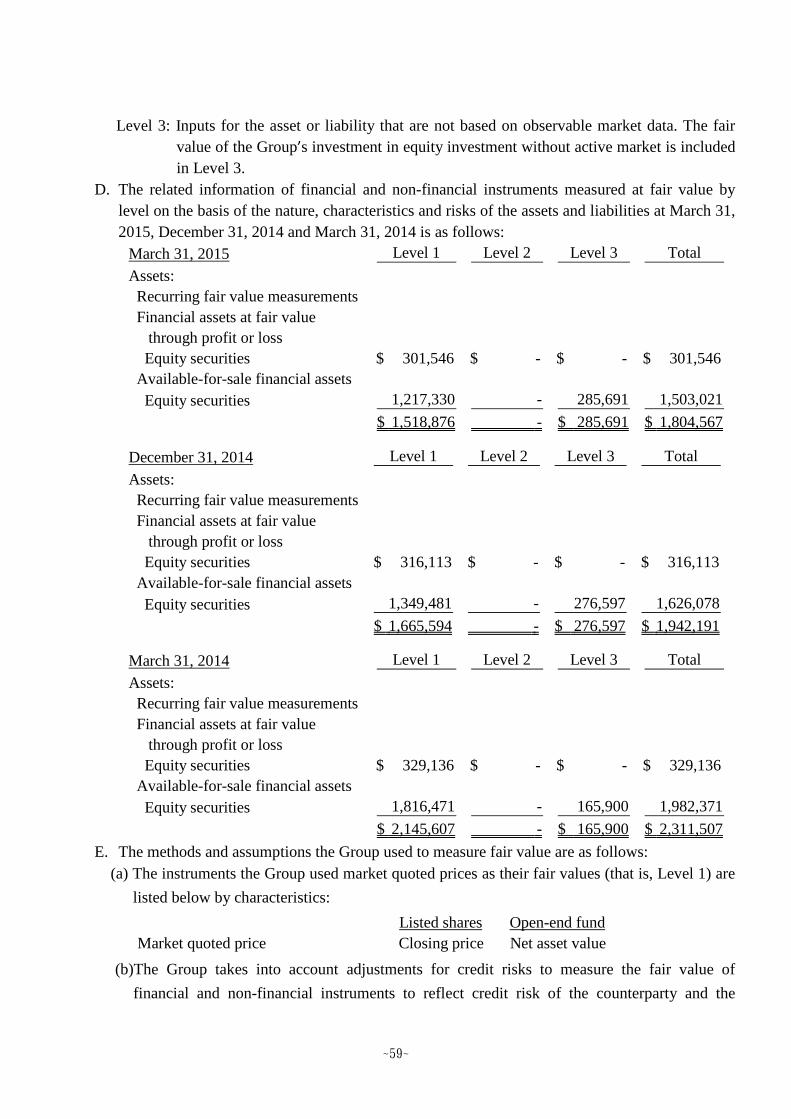
~59~
Level 3: Inputs for the asset or liability that are not based on observable market data. The fair
value of the Group’s investment in equity investment without active market is included
in Level 3.
D. The related information of financial and non-financial instruments measured at fair value by
level on the basis of the nature, characteristics and risks of the assets and liabilities at March 31,
2015, December 31, 2014 and March 31, 2014 is as follows:
E. The methods and assumptions the Group used to measure fair value are as follows:
(a) The instruments the Group used market quoted prices as their fair values (that is, Level 1) are
listed below by characteristics:
(b)The Group takes into account adjustments for credit risks to measure the fair value of
financial and non-financial instruments to reflect credit risk of the counterparty and the
March 31, 2015 Level 1 Level 2 Level 3 Total
Assets:
Recurring fair value measurements
Financial assets at fair value
through profit or loss
Equity securities 301,546$ -$ -$ 301,546$
Available-for-sale financial assets
Equity securities 1,217,330 - 285,691 1,503,021
1,518,876$ - 285,691$ 1,804,567$
December 31, 2014 Level 1 Level 2 Level 3 Total
Assets:
Recurring fair value measurements
Financial assets at fair value
through profit or loss
Equity securities 316,113$ -$ -$ 316,113$
Available-for-sale financial assets
Equity securities 1,349,481 - 276,597 1,626,078
1,665,594$ - 276,597$ 1,942,191$
March 31, 2014 Level 1 Level 2 Level 3 Total
Assets:
Recurring fair value measurements
Financial assets at fair value
through profit or loss
Equity securities 329,136$ -$ -$ 329,136$
Available-for-sale financial assets
Equity securities 1,816,471 - 165,900 1,982,371
2,145,607$ - 165,900$ 2,311,507$
Listed shares Open-end fund
Market quoted price Closing price Net asset value

~60~
Group’s credit quality.
F. For the three-month periods ended March 31, 2015 and 2014, there was no transfer between
Level 1 and Level 2.
G. The following chart is the movement of Level 3 for the three-month periods ended March 31,
2015 and 2014:
Note: Recorded as unrealised valuation gain or loss of available-for-sale financial assets.
H. For the three-month periods ended March 31, 2015 and 2014, there was no transfer into or out
from Level 3.
I. Finance and Accounting segment is in charge of valuation procedures for fair value
measurements being categorised within Level 3, which is to verify independent fair value of
financial instruments. Such assessment is to ensure the valuation results are reasonable by
applying independent information to make results close to current market conditions,
confirming the resource of information is independent, reliable and in line with other resources
and represented as the exercisable price, and frequently assessing valuation results and making
any other necessary adjustments to the fair value.
J. The following is the qualitative information of significant unobservable inputs and sensitivity
analysis of changes in significant unobservable inputs to valuation model used in Level 3 fair
value measurement:
K. The Group has carefully assessed the valuation models and assumptions used to measure fair
value; therefore, the fair value measurement is reasonable. However, use of different valuation
models or assumptions may result in difference measurement. The following is the effect of
profit or loss or of other comprehensive income from financial assets and liabilities categorized
within Level 3 if the inputs used to valuation models have changed:
2015 2014
Non-derivative equity
instrument
Non-derivative equity
instrument
At January 1 276,597$ 285,365$
Gains and losses recognised in other comprehensive
income (Note )9,094 94,465)(
Proceeds from capital reduction - 25,000)(
March 31 285,691$ 165,900$
Movement of unrealised gain or loss in profit or loss
of assets and liabilities held as at March 31, 2015-$ -$
Three-month periods ended March 31,
Fair value at
March 31,
2015
Valuation
technique
Significant
unobservable
input
Range
(weighted
average)
Relationship of
inputs to fair
value
Non-derivative equity
Unlisted shares 285,691$Net asset
value
Net asset
valueN/A
The higher the
net asset value,
the higher the
fair value
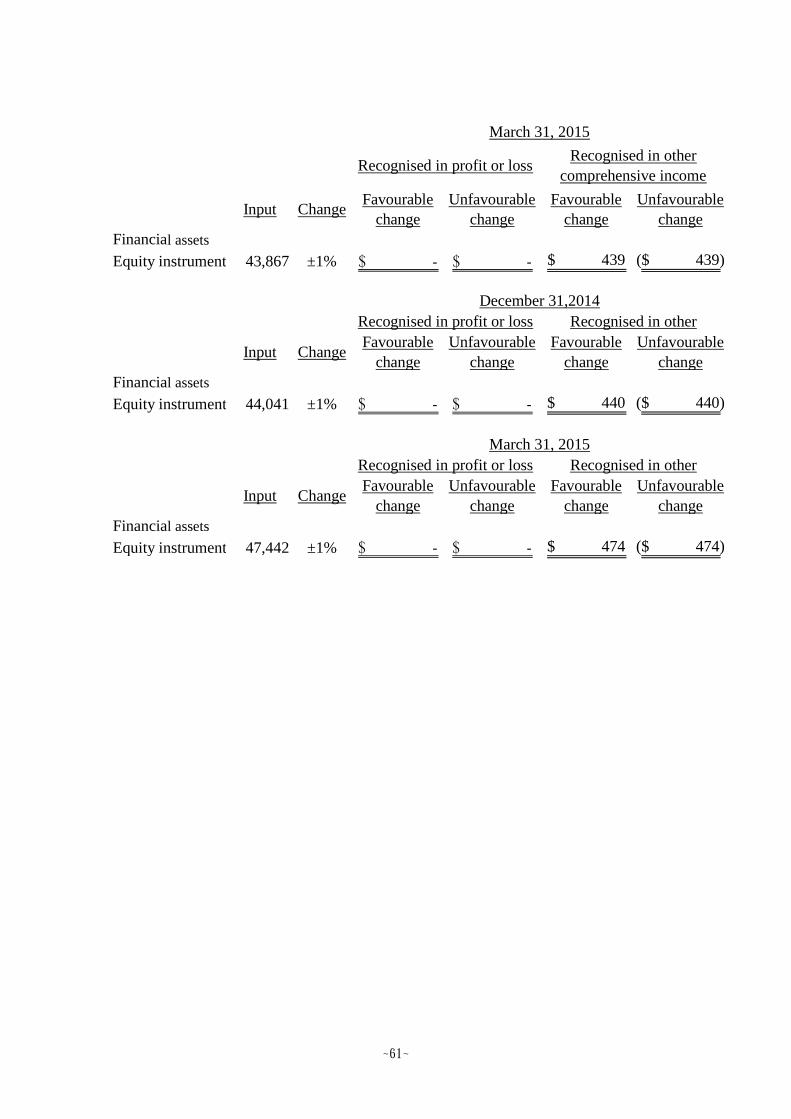
~61~
Input ChangeFavourable
change
Unfavourable
change
Favourable
change
Unfavourable
change
Financial assets
Equity instrument 43,867 ±1% -$ -$ 439$ 439)($
Recognised in profit or lossRecognised in other
comprehensive income
March 31, 2015
Input ChangeFavourable
change
Unfavourable
change
Favourable
change
Unfavourable
change
Financial assets
Equity instrument 44,041 ±1% -$ -$ 440$ 440)($
December 31,2014
Recognised in profit or loss Recognised in other
Input ChangeFavourable
change
Unfavourable
change
Favourable
change
Unfavourable
change
Financial assets
Equity instrument 47,442 ±1% -$ -$ 474$ 474)($
March 31, 2015
Recognised in profit or loss Recognised in other
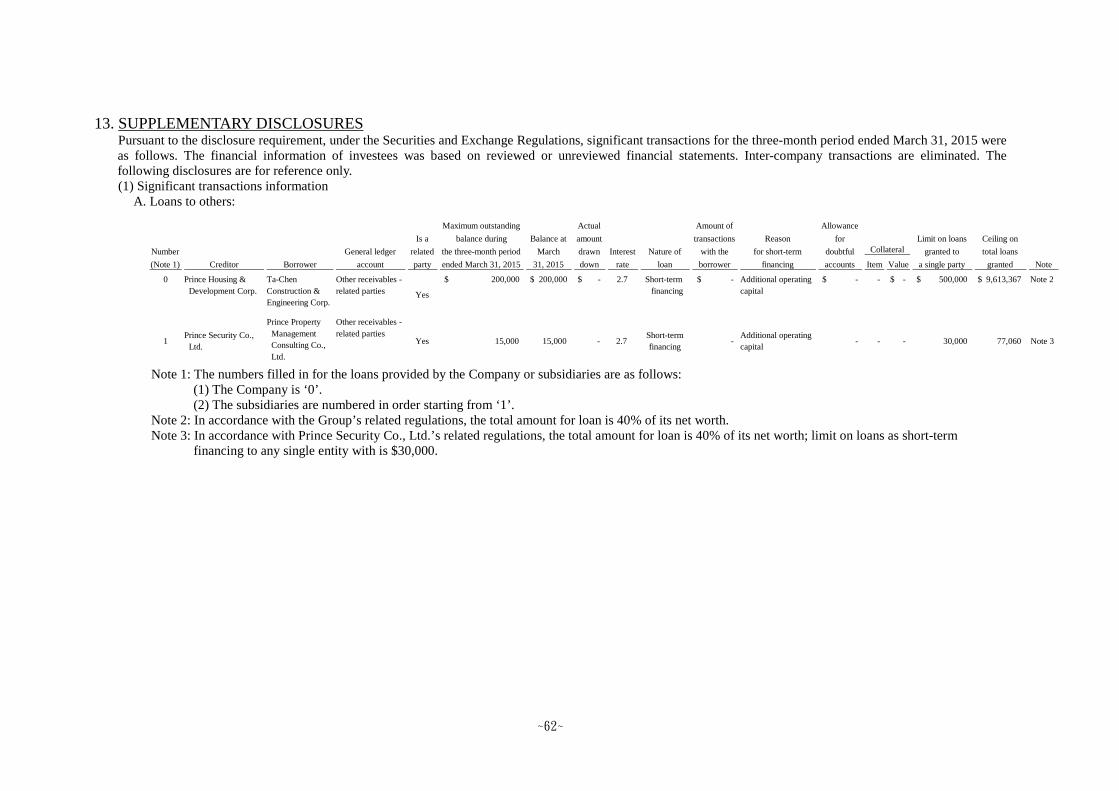
~62~
13. SUPPLEMENTARY DISCLOSURESPursuant to the disclosure requirement, under the Securities and Exchange Regulations, significant transactions for the three-month period ended March 31, 2015 wereas follows. The financial information of investees was based on reviewed or unreviewed financial statements. Inter-company transactions are eliminated. Thefollowing disclosures are for reference only.(1) Significant transactions information
A. Loans to others:
Note 1: The numbers filled in for the loans provided by the Company or subsidiaries are as follows:(1) The Company is ‘0’.(2) The subsidiaries are numbered in order starting from ‘1’.
Note 2: In accordance with the Group’s related regulations, the total amount for loan is 40% of its net worth.Note 3: In accordance with Prince Security Co., Ltd.’s related regulations, the total amount for loan is 40% of its net worth; limit on loans as short-term
financing to any single entity with is $30,000.
Item Value
0 Prince Housing &
Development Corp.
Ta-Chen
Construction &
Engineering Corp.
Other receivables -
related parties Yes
200,000$ 200,000$ -$ 2.7 Short-term
financing
-$ Additional operating
capital
-$ - -$ 500,000$ 9,613,367$ Note 2
1Prince Security Co.,
Ltd.
Prince Property
Management
Consulting Co.,
Ltd.
Other receivables -
related partiesYes 15,000 15,000 - 2.7
Short-term
financing-
Additional operating
capital- - - 30,000 77,060 Note 3
Reason
for short-term
financing
Number
(Note 1) Creditor Borrower
General ledger
account
Is a
related
party
Maximum outstanding
balance during
the three-month period
ended March 31, 2015
Balance at
March
31, 2015
Actual
amount
drawn
down
Interest
rate
Nature of
loan
Amount of
transactions
with the
borrower
Allowance
for
doubtful
accounts
CollateralLimit on loans
granted to
a single party
Ceiling on
total loans
granted Note
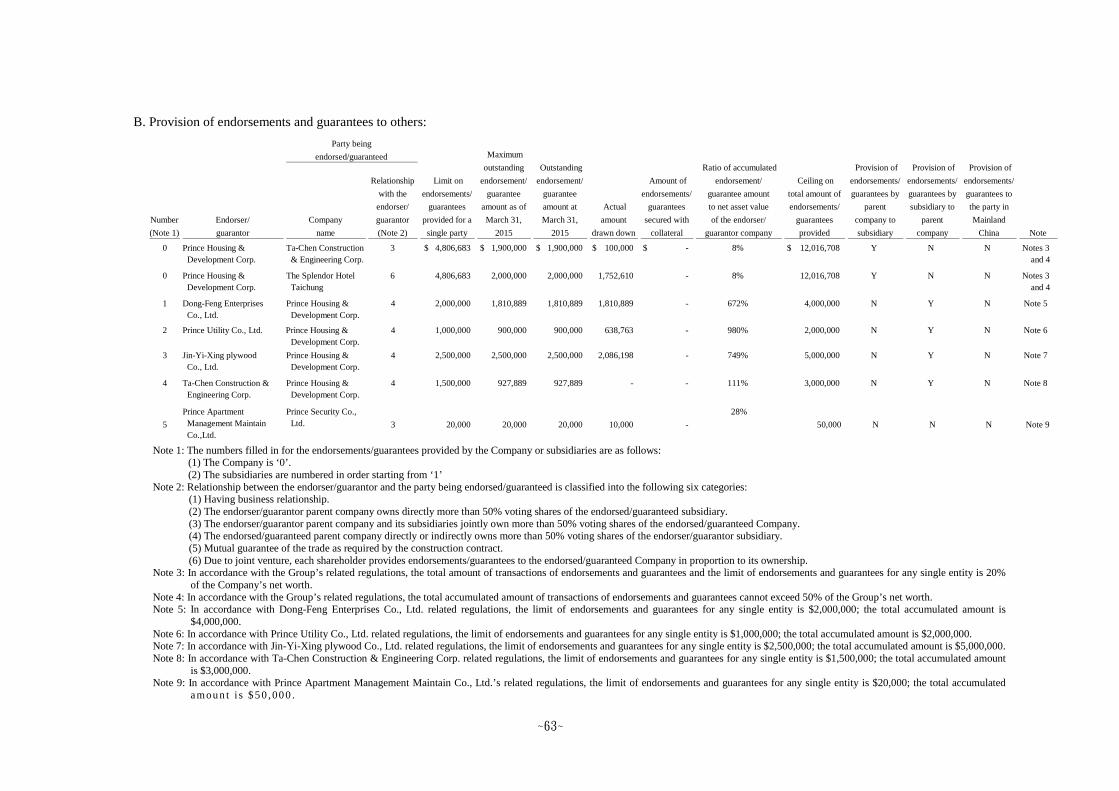
~63~
B. Provision of endorsements and guarantees to others:
Note 1: The numbers filled in for the endorsements/guarantees provided by the Company or subsidiaries are as follows:(1) The Company is ‘0’.(2) The subsidiaries are numbered in order starting from ‘1’
Note 2: Relationship between the endorser/guarantor and the party being endorsed/guaranteed is classified into the following six categories:(1) Having business relationship.(2) The endorser/guarantor parent company owns directly more than 50% voting shares of the endorsed/guaranteed subsidiary.(3) The endorser/guarantor parent company and its subsidiaries jointly own more than 50% voting shares of the endorsed/guaranteed Company.(4) The endorsed/guaranteed parent company directly or indirectly owns more than 50% voting shares of the endorser/guarantor subsidiary.(5) Mutual guarantee of the trade as required by the construction contract.(6) Due to joint venture, each shareholder provides endorsements/guarantees to the endorsed/guaranteed Company in proportion to its ownership.
Note 3: In accordance with the Group’s related regulations, the total amount of transactions of endorsements and guarantees and the limit of endorsements and guarantees for any single entity is 20%of the Company’s net worth.
Note 4: In accordance with the Group’s related regulations, the total accumulated amount of transactions of endorsements and guarantees cannot exceed 50% of the Group’s net worth.Note 5: In accordance with Dong-Feng Enterprises Co., Ltd. related regulations, the limit of endorsements and guarantees for any single entity is $2,000,000; the total accumulated amount is
$4,000,000.Note 6: In accordance with Prince Utility Co., Ltd. related regulations, the limit of endorsements and guarantees for any single entity is $1,000,000; the total accumulated amount is $2,000,000.Note 7: In accordance with Jin-Yi-Xing plywood Co., Ltd. related regulations, the limit of endorsements and guarantees for any single entity is $2,500,000; the total accumulated amount is $5,000,000.Note 8: In accordance with Ta-Chen Construction & Engineering Corp. related regulations, the limit of endorsements and guarantees for any single entity is $1,500,000; the total accumulated amount
is $3,000,000.Note 9: In accordance with Prince Apartment Management Maintain Co., Ltd.’s related regulations, the limit of endorsements and guarantees for any single entity is $20,000; the total accumulated
amou n t i s $ 5 0 ,00 0 .
Company
name
Relationship
with the
endorser/
guarantor
(Note 2)
0 Prince Housing &
Development Corp.
Ta-Chen Construction
& Engineering Corp.
3 4,806,683$ 1,900,000$ 1,900,000$ 100,000$ -$ 8% 12,016,708$ Y N N Notes 3
and 4
0 Prince Housing &
Development Corp.
The Splendor Hotel
Taichung
6 4,806,683 2,000,000 2,000,000 1,752,610 - 8% 12,016,708 Y N N Notes 3
and 4
1 Dong-Feng Enterprises
Co., Ltd.
Prince Housing &
Development Corp.
4 2,000,000 1,810,889 1,810,889 1,810,889 - 672% 4,000,000 N Y N Note 5
2 Prince Utility Co., Ltd. Prince Housing &
Development Corp.
4 1,000,000 900,000 900,000 638,763 - 980% 2,000,000 N Y N Note 6
3 Jin-Yi-Xing plywood
Co., Ltd.
Prince Housing &
Development Corp.
4 2,500,000 2,500,000 2,500,000 2,086,198 - 749% 5,000,000 N Y N Note 7
4 Ta-Chen Construction &
Engineering Corp.
Prince Housing &
Development Corp.
4 1,500,000 927,889 927,889 - - 111% 3,000,000 N Y N Note 8
5
Prince Apartment
Management Maintain
Co.,Ltd.
Prince Security Co.,
Ltd. 3 20,000 20,000 20,000 10,000 -
28%
50,000 N N N Note 9
Outstanding
endorsement/
guarantee
amount at
March 31,
2015
Number
(Note 1)
Endorser/
guarantor
Party being
endorsed/guaranteed
Limit on
endorsements/
guarantees
provided for a
single party
Maximum
outstanding
endorsement/
guarantee
amount as of
March 31,
2015
Provision of
endorsements/
guarantees to
the party in
Mainland
China Note
Actual
amount
drawn down
Amount of
endorsements/
guarantees
secured with
collateral
Ratio of accumulated
endorsement/
guarantee amount
to net asset value
of the endorser/
guarantor company
Ceiling on
total amount of
endorsements/
guarantees
provided
Provision of
endorsements/
guarantees by
parent
company to
subsidiary
Provision of
endorsements/
guarantees by
subsidiary to
parent
company
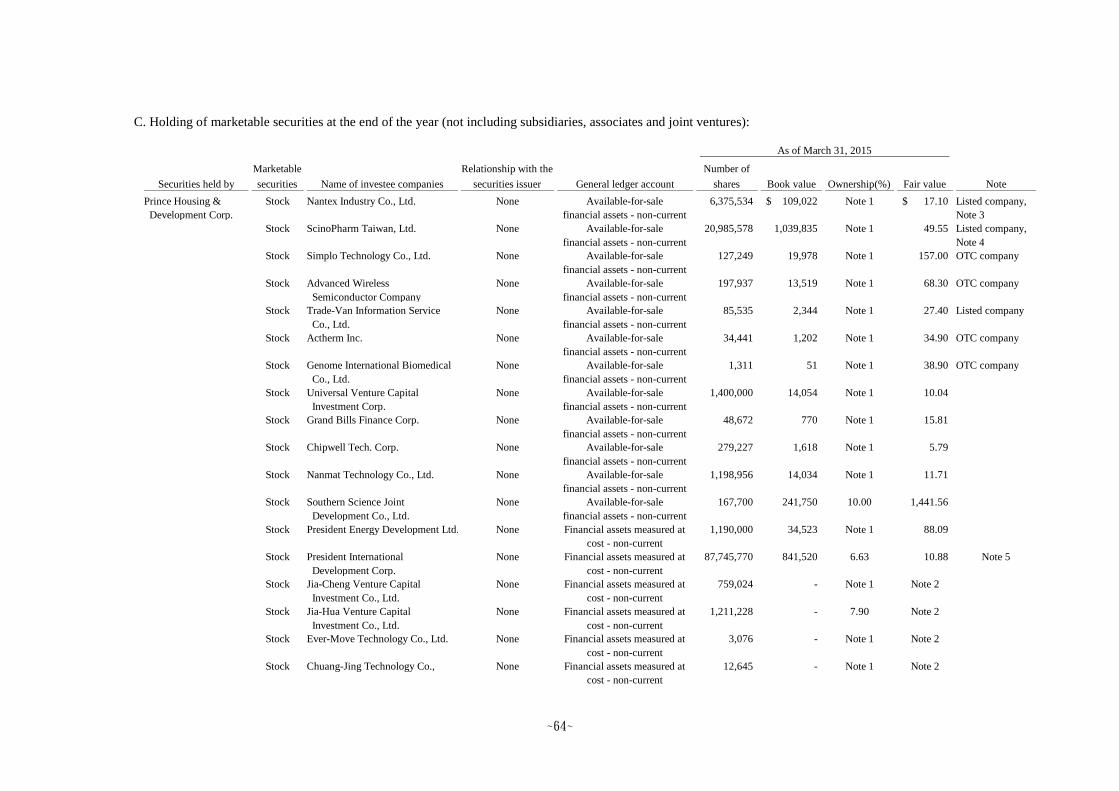
~64~
C. Holding of marketable securities at the end of the year (not including subsidiaries, associates and joint ventures):
Securities held by
Marketable
securities Name of investee companies
Relationship with the
securities issuer General ledger account
Number of
shares Book value Ownership(%) Fair value Note
Prince Housing &
Development Corp.
Stock Nantex Industry Co., Ltd. None Available-for-sale
financial assets - non-current
6,375,534 109,022$ Note 1 17.10$ Listed company,
Note 3
Stock ScinoPharm Taiwan, Ltd. None Available-for-sale
financial assets - non-current
20,985,578 1,039,835 Note 1 49.55 Listed company,
Note 4
Stock Simplo Technology Co., Ltd. None Available-for-sale
financial assets - non-current
127,249 19,978 Note 1 157.00 OTC company
Stock Advanced Wireless
Semiconductor Company
None Available-for-sale
financial assets - non-current
197,937 13,519 Note 1 68.30 OTC company
Stock Trade-Van Information Service
Co., Ltd.
None Available-for-sale
financial assets - non-current
85,535 2,344 Note 1 27.40 Listed company
Stock Actherm Inc. None Available-for-sale
financial assets - non-current
34,441 1,202 Note 1 34.90 OTC company
Stock Genome International Biomedical
Co., Ltd.
None Available-for-sale
financial assets - non-current
1,311 51 Note 1 38.90 OTC company
Stock Universal Venture Capital
Investment Corp.
None Available-for-sale
financial assets - non-current
1,400,000 14,054 Note 1 10.04
Stock Grand Bills Finance Corp. None Available-for-sale
financial assets - non-current
48,672 770 Note 1 15.81
Stock Chipwell Tech. Corp. None Available-for-sale
financial assets - non-current
279,227 1,618 Note 1 5.79
Stock Nanmat Technology Co., Ltd. None Available-for-sale
financial assets - non-current
1,198,956 14,034 Note 1 11.71
Stock Southern Science Joint
Development Co., Ltd.
None Available-for-sale
financial assets - non-current
167,700 241,750 10.00 1,441.56
Stock President Energy Development Ltd. None Financial assets measured at
cost - non-current
1,190,000 34,523 Note 1 88.09
Stock President International
Development Corp.
None Financial assets measured at
cost - non-current
87,745,770 841,520 6.63 10.88 Note 5
Stock Jia-Cheng Venture Capital
Investment Co., Ltd.
None Financial assets measured at
cost - non-current
759,024 - Note 1 Note 2
Stock Jia-Hua Venture Capital
Investment Co., Ltd.
None Financial assets measured at
cost - non-current
1,211,228 - 7.90 Note 2
Stock Ever-Move Technology Co., Ltd. None Financial assets measured at
cost - non-current
3,076 - Note 1 Note 2
Stock Chuang-Jing Technology Co., None Financial assets measured at
cost - non-current
12,645 - Note 1 Note 2
As of March 31, 2015
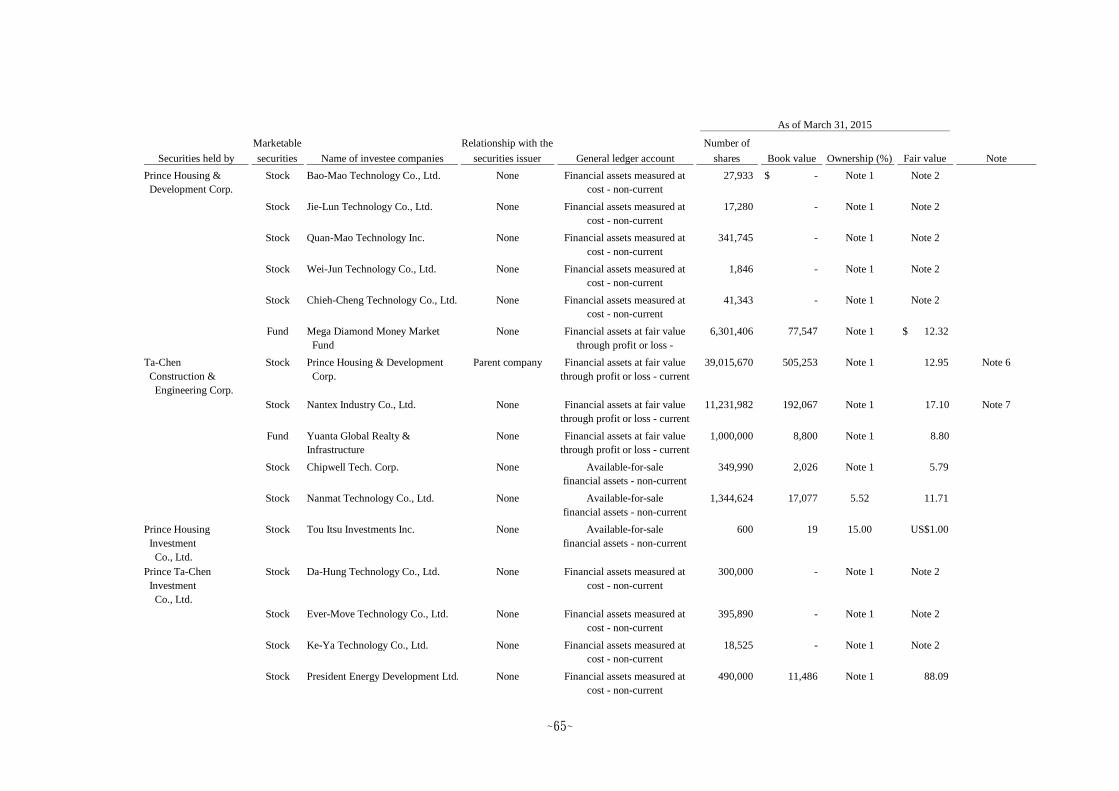
~65~
Securities held by
Marketable
securities Name of investee companies
Relationship with the
securities issuer General ledger account
Number of
shares Book value Ownership (%) Fair value Note
Prince Housing &
Development Corp.
Stock Bao-Mao Technology Co., Ltd. None Financial assets measured at
cost - non-current
27,933 -$ Note 1 Note 2
Stock Jie-Lun Technology Co., Ltd. None Financial assets measured at
cost - non-current
17,280 - Note 1 Note 2
Stock Quan-Mao Technology Inc. None Financial assets measured at
cost - non-current
341,745 - Note 1 Note 2
Stock Wei-Jun Technology Co., Ltd. None Financial assets measured at
cost - non-current
1,846 - Note 1 Note 2
Stock Chieh-Cheng Technology Co., Ltd. None Financial assets measured at
cost - non-current
41,343 - Note 1 Note 2
Fund Mega Diamond Money Market
Fund
None Financial assets at fair value
through profit or loss -
non-current
6,301,406 77,547 Note 1 12.32$
Ta-Chen
Construction &
Engineering Corp.
Stock Prince Housing & Development
Corp.
Parent company Financial assets at fair value
through profit or loss - current
39,015,670 505,253 Note 1 12.95 Note 6
Stock Nantex Industry Co., Ltd. None Financial assets at fair value
through profit or loss - current
11,231,982 192,067 Note 1 17.10 Note 7
Fund Yuanta Global Realty &
Infrastructure
Acc.
None Financial assets at fair value
through profit or loss - current
1,000,000 8,800 Note 1 8.80
Stock Chipwell Tech. Corp. None Available-for-sale
financial assets - non-current
349,990 2,026 Note 1 5.79
Stock Nanmat Technology Co., Ltd. None Available-for-sale
financial assets - non-current
1,344,624 17,077 5.52 11.71
Prince Housing
Investment
Co., Ltd.
Stock Tou Itsu Investments Inc. None Available-for-sale
financial assets - non-current
600 19 15.00 US$1.00
Prince Ta-Chen
Investment
Co., Ltd.
Stock Da-Hung Technology Co., Ltd. None Financial assets measured at
cost - non-current
300,000 - Note 1 Note 2
Stock Ever-Move Technology Co., Ltd. None Financial assets measured at
cost - non-current
395,890 - Note 1 Note 2
Stock Ke-Ya Technology Co., Ltd. None Financial assets measured at
cost - non-current
18,525 - Note 1 Note 2
Stock President Energy Development Ltd. None Financial assets measured at
cost - non-current
490,000 11,486 Note 1 88.09
As of March 31, 2015
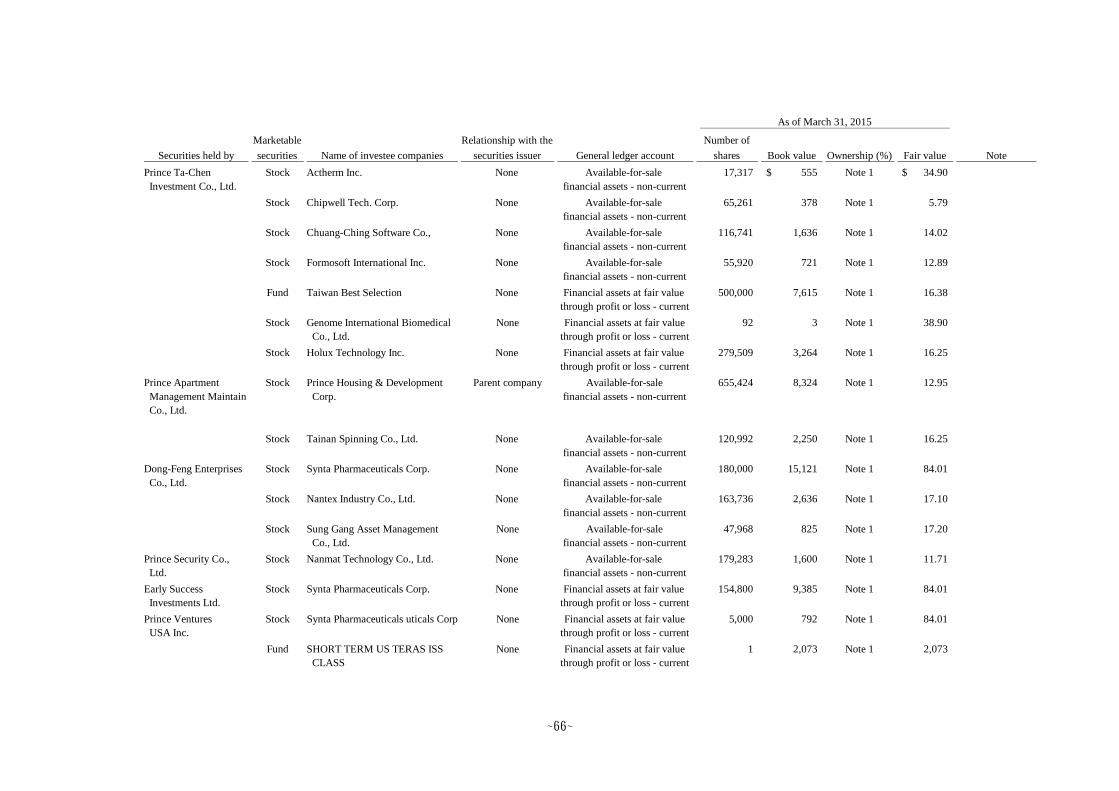
~66~
Securities held by
Marketable
securities Name of investee companies
Relationship with the
securities issuer General ledger account
Number of
shares Book value Ownership (%) Fair value Note
Prince Ta-Chen
Investment Co., Ltd.
Stock Actherm Inc. None Available-for-sale
financial assets - non-current
17,317 555$ Note 1 34.90$
Stock Chipwell Tech. Corp. None Available-for-sale
financial assets - non-current
65,261 378 Note 1 5.79
Stock Chuang-Ching Software Co., None Available-for-sale
financial assets - non-current
116,741 1,636 Note 1 14.02
Stock Formosoft International Inc. None Available-for-sale
financial assets - non-current
55,920 721 Note 1 12.89
Fund Taiwan Best Selection None Financial assets at fair value
through profit or loss - current
500,000 7,615 Note 1 16.38
Stock Genome International Biomedical
Co., Ltd.
None Financial assets at fair value
through profit or loss - current
92 3 Note 1 38.90
Stock Holux Technology Inc. None Financial assets at fair value
through profit or loss - current
279,509 3,264 Note 1 16.25
Prince Apartment
Management Maintain
Co., Ltd.
Stock Prince Housing & Development
Corp.
Parent company Available-for-sale
financial assets - non-current
655,424 8,324 Note 1 12.95
Stock Tainan Spinning Co., Ltd. None Available-for-sale
financial assets - non-current
120,992 2,250 Note 1 16.25
Dong-Feng Enterprises
Co., Ltd.
Stock Synta Pharmaceuticals Corp. None Available-for-sale
financial assets - non-current
180,000 15,121 Note 1 84.01
Stock Nantex Industry Co., Ltd. None Available-for-sale
financial assets - non-current
163,736 2,636 Note 1 17.10
Stock Sung Gang Asset Management
Co., Ltd.
None Available-for-sale
financial assets - non-current
47,968 825 Note 1 17.20
Prince Security Co.,
Ltd.
Stock Nanmat Technology Co., Ltd. None Available-for-sale
financial assets - non-current
179,283 1,600 Note 1 11.71
Early Success
Investments Ltd.
Stock Synta Pharmaceuticals Corp. None Financial assets at fair value
through profit or loss - current
154,800 9,385 Note 1 84.01
Prince Ventures
USA Inc.
Stock Synta Pharmaceuticals uticals Corp. None Financial assets at fair value
through profit or loss - current
5,000 792 Note 1 84.01
Fund SHORT TERM US TERAS ISS
CLASS
None Financial assets at fair value
through profit or loss - current
1 2,073 Note 1 2,073
As of March 31, 2015
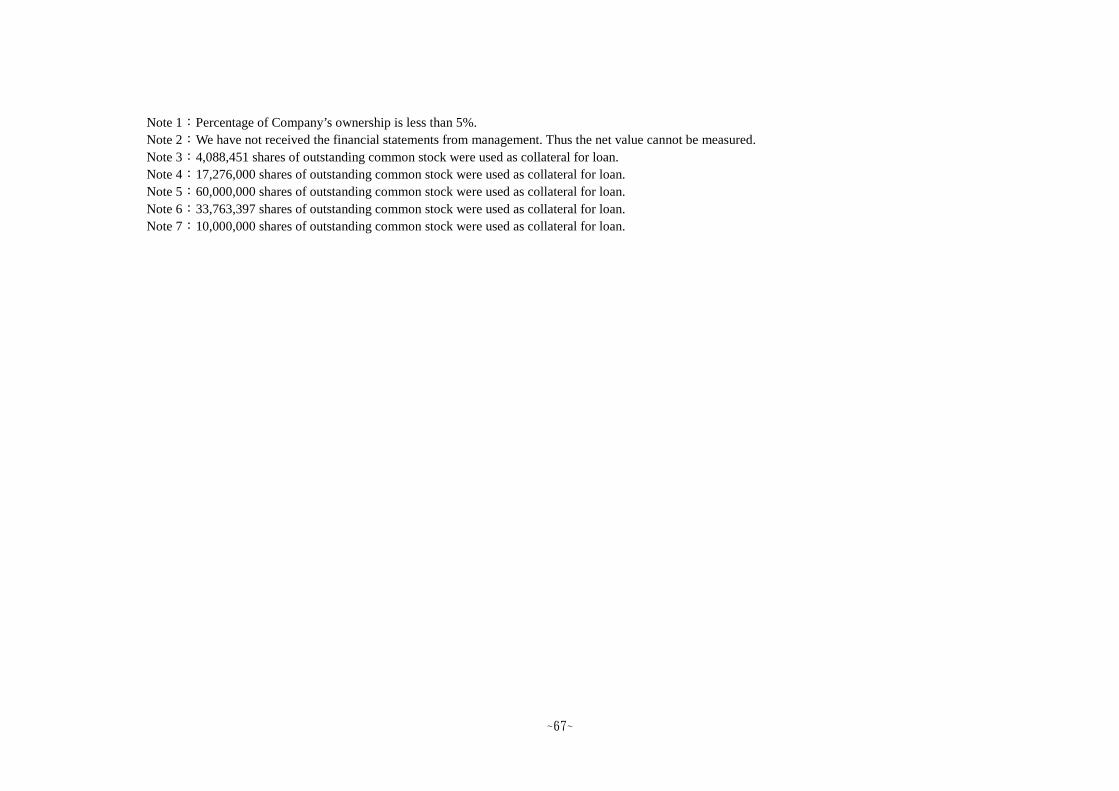
~67~
Note 1:Percentage of Company’s ownership is less than 5%.
Note 2:We have not received the financial statements from management. Thus the net value cannot be measured.
Note 3:4,088,451 shares of outstanding common stock were used as collateral for loan.
Note 4:17,276,000 shares of outstanding common stock were used as collateral for loan.
Note 5:60,000,000 shares of outstanding common stock were used as collateral for loan.
Note 6:33,763,397 shares of outstanding common stock were used as collateral for loan.
Note 7:10,000,000 shares of outstanding common stock were used as collateral for loan.
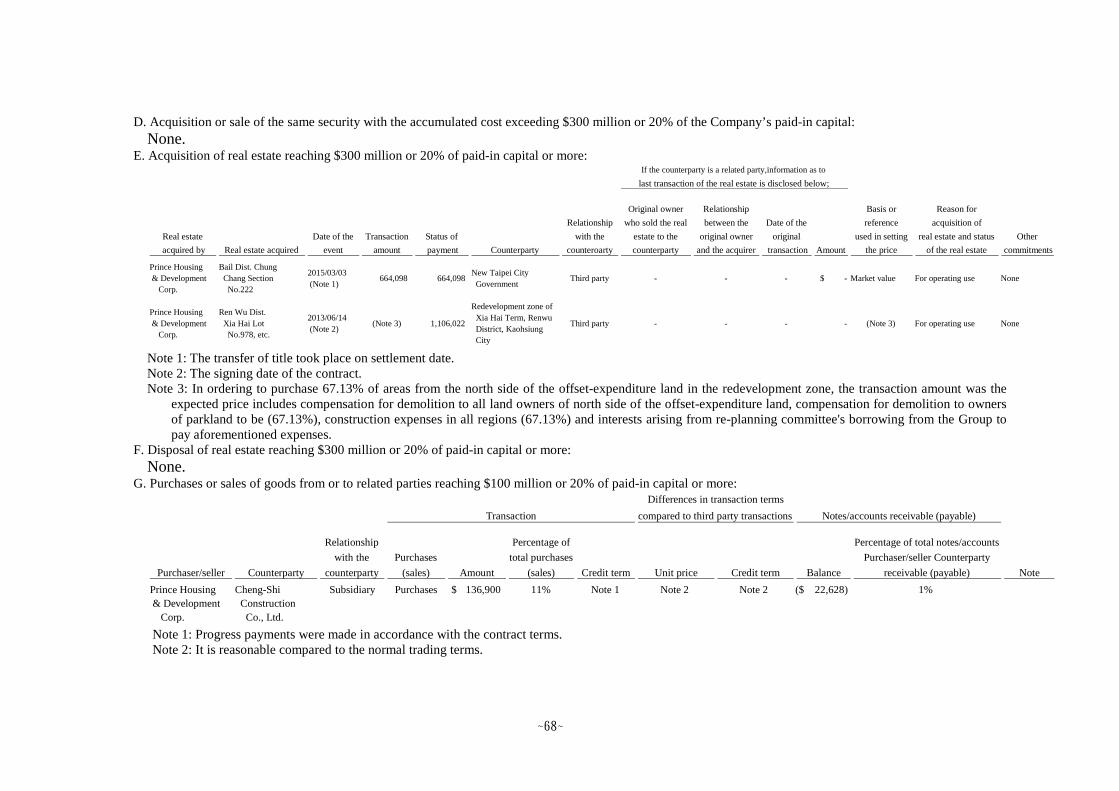
~68~
D. Acquisition or sale of the same security with the accumulated cost exceeding $300 million or 20% of the Company’s paid-in capital:
None.E. Acquisition of real estate reaching $300 million or 20% of paid-in capital or more:
Note 1: The transfer of title took place on settlement date.Note 2: The signing date of the contract.Note 3: In ordering to purchase 67.13% of areas from the north side of the offset-expenditure land in the redevelopment zone, the transaction amount was the
expected price includes compensation for demolition to all land owners of north side of the offset-expenditure land, compensation for demolition to ownersof parkland to be (67.13%), construction expenses in all regions (67.13%) and interests arising from re-planning committee's borrowing from the Group topay aforementioned expenses.
F. Disposal of real estate reaching $300 million or 20% of paid-in capital or more:
None.G. Purchases or sales of goods from or to related parties reaching $100 million or 20% of paid-in capital or more:
Note 1: Progress payments were made in accordance with the contract terms.Note 2: It is reasonable compared to the normal trading terms.
Real estate
acquired by Real estate acquired
Date of the
event
Transaction
amount
Status of
payment Counterparty
Relationship
with the
counteroarty
Original owner
who sold the real
estate to the
counterparty
Relationship
between the
original owner
and the acquirer
Date of the
original
transaction Amount
Basis or
reference
used in setting
the price
Reason for
acquisition of
real estate and status
of the real estate
Other
commitments
Prince Housing
& Development
Corp.
Bail Dist. Chung
Chang Section
No.222
2015/03/03
(Note 1)664,098 664,098
New Taipei City
GovernmentThird party - - - $ - Market value For operating use None
Prince Housing
& Development
Corp.
Ren Wu Dist.
Xia Hai Lot
No.978, etc.
2013/06/14
(Note 2)(Note 3) 1,106,022
Redevelopment zone of
Xia Hai Term, Renwu
District, Kaohsiung
City
Third party - - - - (Note 3) For operating use None
If the counterparty is a related party,information as to
last transaction of the real estate is disclosed below;
Purchaser/seller Counterparty
Relationship
with the
counterparty
Purchases
(sales) Amount
Percentage of
total purchases
(sales) Credit term Unit price Credit term Balance
Percentage of total notes/accounts
Purchaser/seller Counterparty
receivable (payable) Note
Prince Housing
& Development
Corp.
Cheng-Shi
Construction
Co., Ltd.
Subsidiary Purchases 136,900$ 11% Note 1 Note 2 Note 2 22,628)($ 1%
Differences in transaction terms
Transaction compared to third party transactions Notes/accounts receivable (payable)
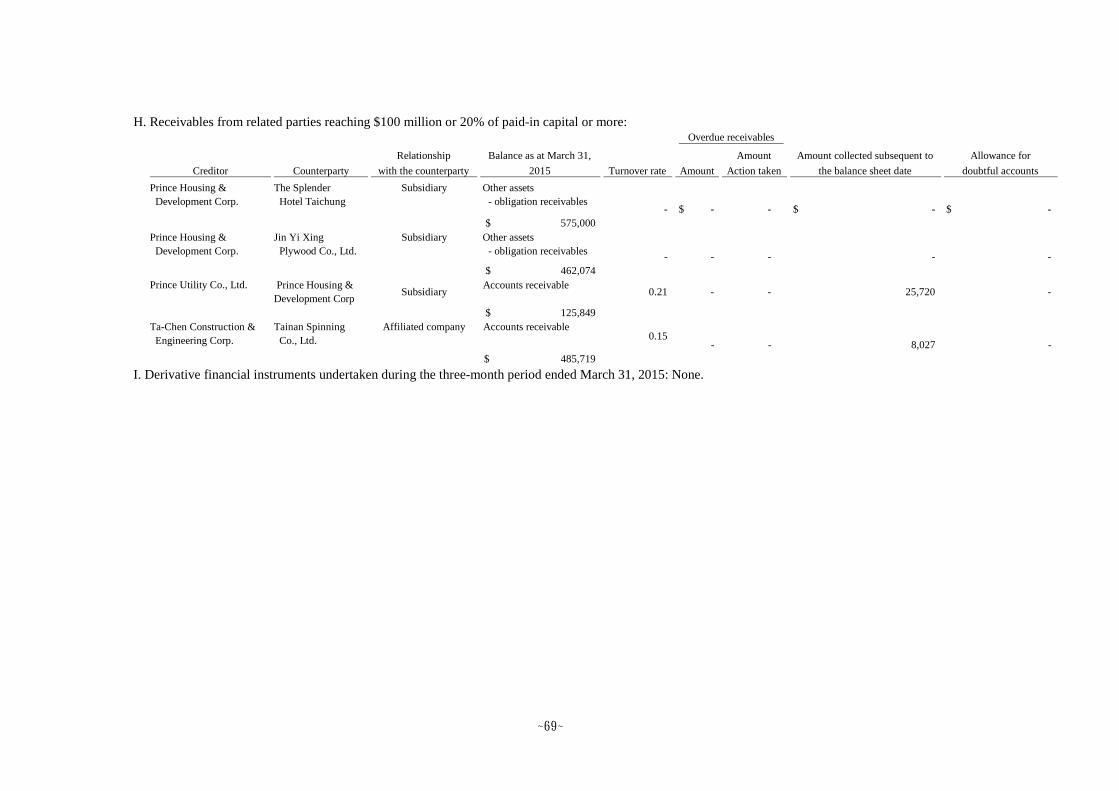
~69~
H. Receivables from related parties reaching $100 million or 20% of paid-in capital or more:
I. Derivative financial instruments undertaken during the three-month period ended March 31, 2015: None.
Creditor Counterparty
Relationship
with the counterparty
Balance as at March 31,
2015 Turnover rate Amount
Amount
Action taken
Amount collected subsequent to
the balance sheet date
Allowance for
doubtful accounts
Prince Housing &
Development Corp.
The Splender
Hotel Taichung
Subsidiary Other assets
- obligation receivables- -$ - -$ -$
575,000$
Prince Housing &
Development Corp.
Jin Yi Xing
Plywood Co., Ltd.
Subsidiary Other assets
- obligation receivables- - - - -
462,074$
Prince Utility Co., Ltd. Prince Housing &
Development CorpSubsidiary
Accounts receivable0.21 - - 25,720 -
125,849$
Ta-Chen Construction &
Engineering Corp.
Tainan Spinning
Co., Ltd.
Affiliated company Accounts receivable0.15
- - 8,027 -
485,719$
Overdue receivables
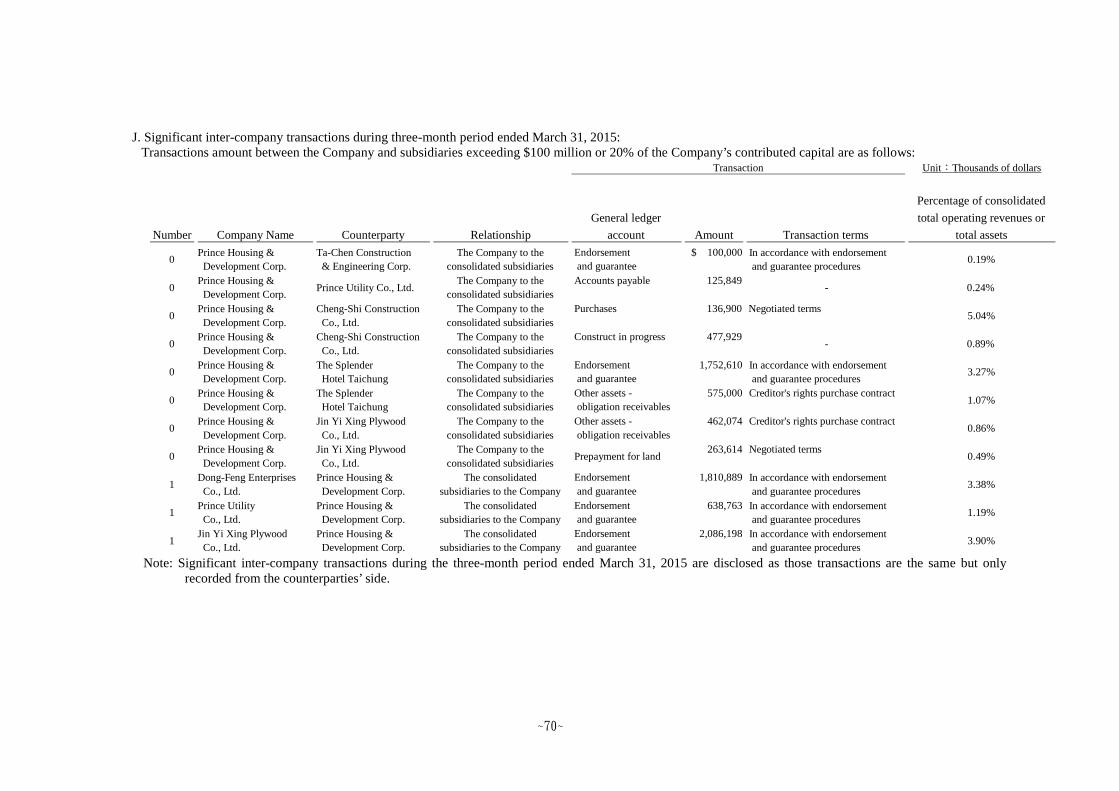
~70~
J. Significant inter-company transactions during three-month period ended March 31, 2015:Transactions amount between the Company and subsidiaries exceeding $100 million or 20% of the Company’s contributed capital are as follows:
Note: Significant inter-company transactions during the three-month period ended March 31, 2015 are disclosed as those transactions are the same but onlyrecorded from the counterparties’ side.
Unit:Thousands of dollars
Number Company Name Counterparty Relationship
General ledger
account Amount Transaction terms
Percentage of consolidated
total operating revenues or
total assets
0Prince Housing &
Development Corp.
Ta-Chen Construction
& Engineering Corp.
The Company to the
consolidated subsidiaries
Endorsement
and guarantee
$ 100,000 In accordance with endorsement
and guarantee procedures0.19%
0Prince Housing &
Development Corp.Prince Utility Co., Ltd.
The Company to the
consolidated subsidiaries
Accounts payable 125,849- 0.24%
0Prince Housing &
Development Corp.
Cheng-Shi Construction
Co., Ltd.
The Company to the
consolidated subsidiaries
Purchases 136,900 Negotiated terms5.04%
0Prince Housing &
Development Corp.
Cheng-Shi Construction
Co., Ltd.
The Company to the
consolidated subsidiaries
Construct in progress 477,929- 0.89%
0Prince Housing &
Development Corp.
The Splender
Hotel Taichung
The Company to the
consolidated subsidiaries
Endorsement
and guarantee
1,752,610 In accordance with endorsement
and guarantee procedures3.27%
0Prince Housing &
Development Corp.
The Splender
Hotel Taichung
The Company to the
consolidated subsidiaries
Other assets -
obligation receivables
575,000 Creditor's rights purchase contract1.07%
0Prince Housing &
Development Corp.
Jin Yi Xing Plywood
Co., Ltd.
The Company to the
consolidated subsidiaries
Other assets -
obligation receivables
462,074 Creditor's rights purchase contract0.86%
0Prince Housing &
Development Corp.
Jin Yi Xing Plywood
Co., Ltd.
The Company to the
consolidated subsidiariesPrepayment for land
263,614 Negotiated terms0.49%
1Dong-Feng Enterprises
Co., Ltd.
Prince Housing &
Development Corp.
The consolidated
subsidiaries to the Company
Endorsement
and guarantee
1,810,889 In accordance with endorsement
and guarantee procedures3.38%
1Prince Utility
Co., Ltd.
Prince Housing &
Development Corp.
The consolidated
subsidiaries to the Company
Endorsement
and guarantee
638,763 In accordance with endorsement
and guarantee procedures1.19%
1Jin Yi Xing Plywood
Co., Ltd.
Prince Housing &
Development Corp.
The consolidated
subsidiaries to the Company
Endorsement
and guarantee
2,086,198 In accordance with endorsement
and guarantee procedures3.90%
Transaction
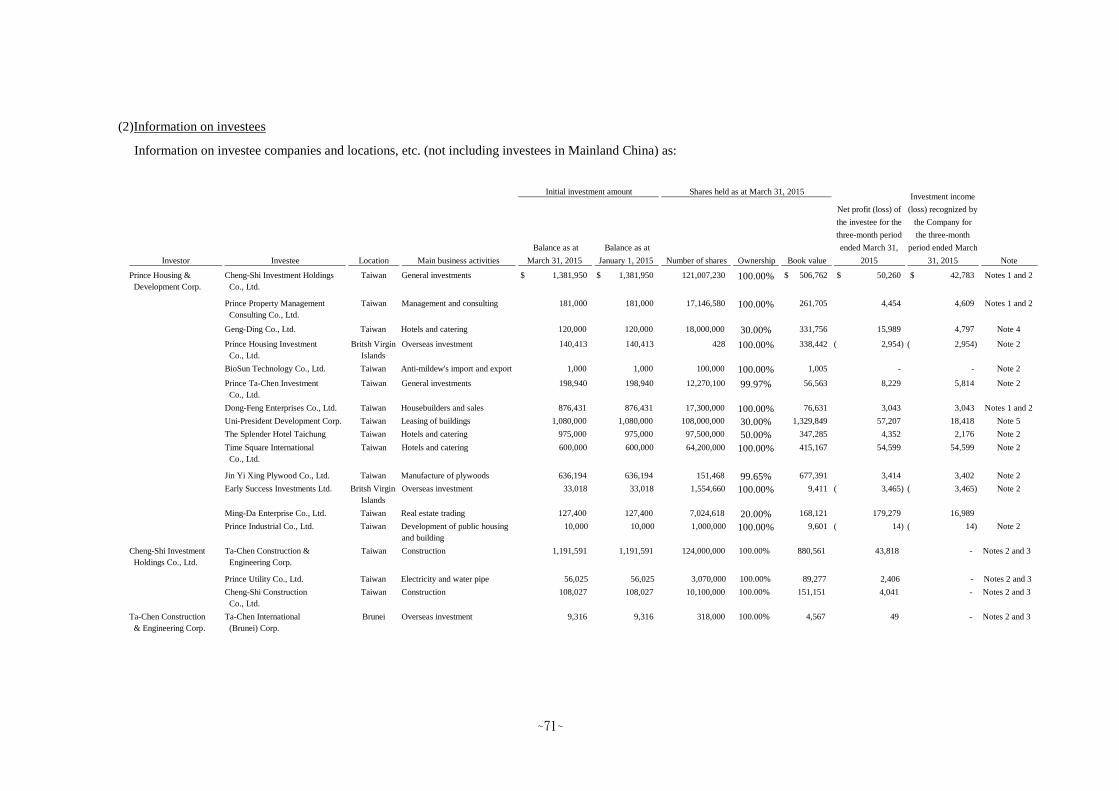
~71~
(2)Information on investees
Information on investee companies and locations, etc. (not including investees in Mainland China) as:
Balance as at
March 31, 2015
Balance as at
January 1, 2015 Number of shares Ownership Book value
Prince Housing &
Development Corp.
Cheng-Shi Investment Holdings
Co., Ltd.
Taiwan General investments 1,381,950$ 1,381,950$ 121,007,230 100.00% 506,762$ 50,260$ 42,783$ Notes 1 and 2
Prince Property Management
Consulting Co., Ltd.
Taiwan Management and consulting 181,000 181,000 17,146,580 100.00% 261,705 4,454 4,609 Notes 1 and 2
Geng-Ding Co., Ltd. Taiwan Hotels and catering 120,000 120,000 18,000,000 30.00% 331,756 15,989 4,797 Note 4
Prince Housing Investment
Co., Ltd.
Britsh Virgin
Islands
Overseas investment 140,413 140,413 428 100.00% 338,442 2,954)( 2,954)( Note 2
BioSun Technology Co., Ltd. Taiwan Anti-mildew's import and export 1,000 1,000 100,000 100.00% 1,005 - - Note 2
Prince Ta-Chen Investment
Co., Ltd.
Taiwan General investments 198,940 198,940 12,270,100 99.97% 56,563 8,229 5,814 Note 2
Dong-Feng Enterprises Co., Ltd. Taiwan Housebuilders and sales 876,431 876,431 17,300,000 100.00% 76,631 3,043 3,043 Notes 1 and 2
Uni-President Development Corp. Taiwan Leasing of buildings 1,080,000 1,080,000 108,000,000 30.00% 1,329,849 57,207 18,418 Note 5
The Splender Hotel Taichung Taiwan Hotels and catering 975,000 975,000 97,500,000 50.00% 347,285 4,352 2,176 Note 2
Time Square International
Co., Ltd.
Taiwan Hotels and catering 600,000 600,000 64,200,000 100.00% 415,167 54,599 54,599 Note 2
Jin Yi Xing Plywood Co., Ltd. Taiwan Manufacture of plywoods 636,194 636,194 151,468 99.65% 677,391 3,414 3,402 Note 2
Early Success Investments Ltd. Britsh Virgin
Islands
Overseas investment 33,018 33,018 1,554,660 100.00% 9,411 3,465)( 3,465)( Note 2
Ming-Da Enterprise Co., Ltd. Taiwan Real estate trading 127,400 127,400 7,024,618 20.00% 168,121 179,279 16,989
Prince Industrial Co., Ltd. Taiwan Development of public housing
and building
10,000 10,000 1,000,000 100.00% 9,601 14)( 14)( Note 2
Cheng-Shi Investment
Holdings Co., Ltd.
Ta-Chen Construction &
Engineering Corp.
Taiwan Construction 1,191,591 1,191,591 124,000,000 100.00% 880,561 43,818 - Notes 2 and 3
Prince Utility Co., Ltd. Taiwan Electricity and water pipe
maintenance
56,025 56,025 3,070,000 100.00% 89,277 2,406 - Notes 2 and 3
Cheng-Shi Construction
Co., Ltd.
Taiwan Construction 108,027 108,027 10,100,000 100.00% 151,151 4,041 - Notes 2 and 3
Ta-Chen Construction
& Engineering Corp.
Ta-Chen International
(Brunei) Corp.
Brunei Overseas investment 9,316 9,316 318,000 100.00% 4,567 49 - Notes 2 and 3
Net profit (loss) of
the investee for the
three-month period
ended March 31,
2015
Investment income
(loss) recognized by
the Company for
the three-month
period ended March
31, 2015 NoteInvestor Investee Location Main business activities
Initial investment amount Shares held as at March 31, 2015
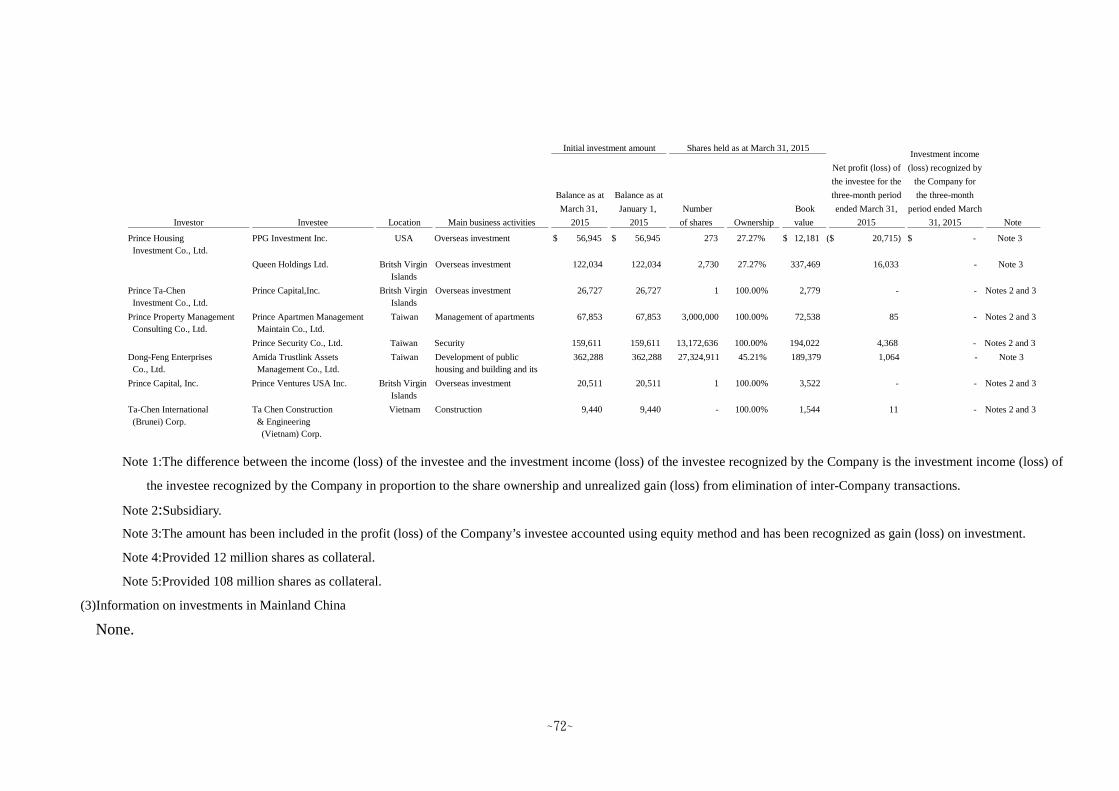
~72~
Note 1:The difference between the income (loss) of the investee and the investment income (loss) of the investee recognized by the Company is the investment income (loss) of
the investee recognized by the Company in proportion to the share ownership and unrealized gain (loss) from elimination of inter-Company transactions.
Note 2:Subsidiary.
Note 3:The amount has been included in the profit (loss) of the Company’s investee accounted using equity method and has been recognized as gain (loss) on investment.
Note 4:Provided 12 million shares as collateral.
Note 5:Provided 108 million shares as collateral.
(3)Information on investments in Mainland China
None.
Balance as at
March 31,
2015
Balance as at
January 1,
2015
Number
of shares Ownership
Book
value
Prince Housing
Investment Co., Ltd.
PPG Investment Inc. USA Overseas investment 56,945$ 56,945$ 273 27.27% 12,181$ 20,715)($ -$ Note 3
Queen Holdings Ltd. Britsh Virgin
Islands
Overseas investment 122,034 122,034 2,730 27.27% 337,469 16,033 - Note 3
Prince Ta-Chen
Investment Co., Ltd.
Prince Capital,Inc. Britsh Virgin
Islands
Overseas investment 26,727 26,727 1 100.00% 2,779 - - Notes 2 and 3
Prince Property Management
Consulting Co., Ltd.
Prince Apartmen Management
Maintain Co., Ltd.
Taiwan Management of apartments 67,853 67,853 3,000,000 100.00% 72,538 85 - Notes 2 and 3
Prince Security Co., Ltd. Taiwan Security 159,611 159,611 13,172,636 100.00% 194,022 4,368 - Notes 2 and 3
Dong-Feng Enterprises
Co., Ltd.
Amida Trustlink Assets
Management Co., Ltd.
Taiwan Development of public
housing and building and its
rental
362,288 362,288 27,324,911 45.21% 189,379 1,064 - Note 3
Prince Capital, Inc. Prince Ventures USA Inc. Britsh Virgin
Islands
Overseas investment 20,511 20,511 1 100.00% 3,522 - - Notes 2 and 3
Ta-Chen International
(Brunei) Corp.
Ta Chen Construction
& Engineering
(Vietnam) Corp.
Vietnam Construction 9,440 9,440 - 100.00% 1,544 11 - Notes 2 and 3
Net profit (loss) of
the investee for the
three-month period
ended March 31,
2015
Investment income
(loss) recognized by
the Company for
the three-month
period ended March
31, 2015 NoteInvestor Investee Location Main business activities
Initial investment amount Shares held as at March 31, 2015
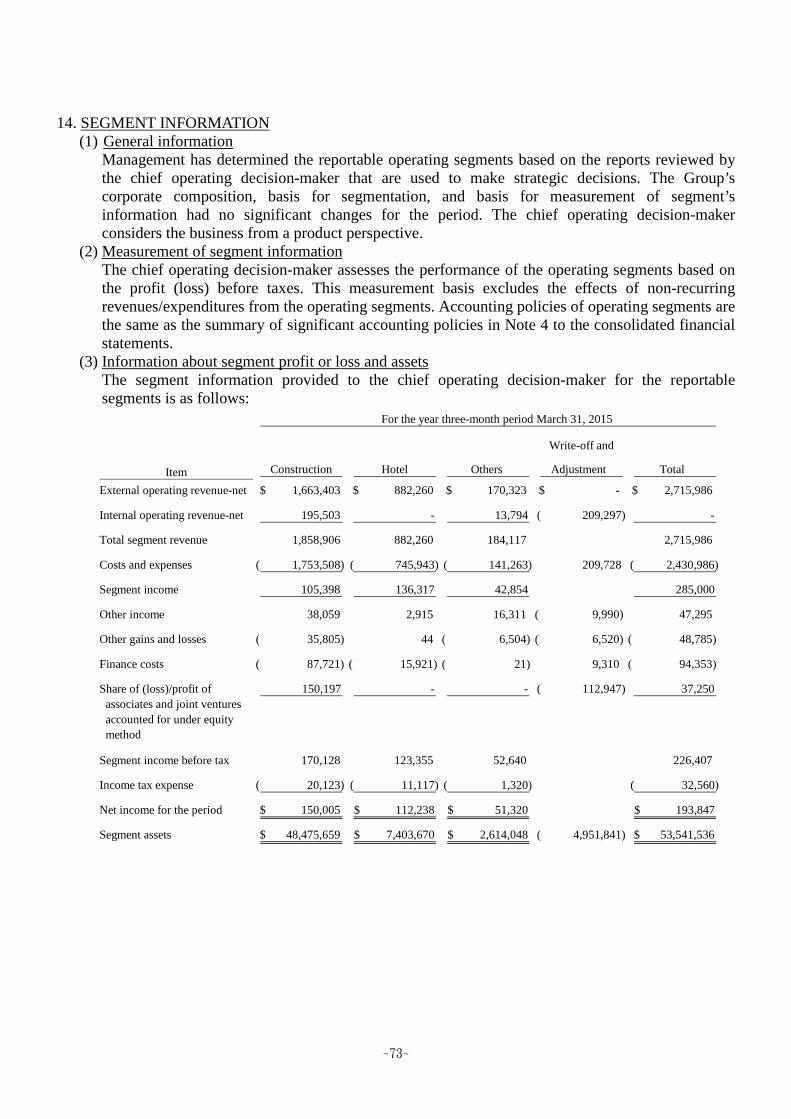
~73~
14. SEGMENT INFORMATION(1) General information
Management has determined the reportable operating segments based on the reports reviewed bythe chief operating decision-maker that are used to make strategic decisions. The Group’scorporate composition, basis for segmentation, and basis for measurement of segment’sinformation had no significant changes for the period. The chief operating decision-makerconsiders the business from a product perspective.
(2) Measurement of segment informationThe chief operating decision-maker assesses the performance of the operating segments based onthe profit (loss) before taxes. This measurement basis excludes the effects of non-recurringrevenues/expenditures from the operating segments. Accounting policies of operating segments arethe same as the summary of significant accounting policies in Note 4 to the consolidated financialstatements.
(3) Information about segment profit or loss and assetsThe segment information provided to the chief operating decision-maker for the reportablesegments is as follows:
Write-off and
Item Construction Hotel Others Adjustment Total
External operating revenue-net 1,663,403$ 882,260$ 170,323$ -$ 2,715,986$
Internal operating revenue-net 195,503 - 13,794 209,297)( -
Total segment revenue 1,858,906 882,260 184,117 2,715,986
Costs and expenses 1,753,508)( 745,943)( 141,263)( 209,728 2,430,986)(
Segment income 105,398 136,317 42,854 285,000
Other income 38,059 2,915 16,311 9,990)( 47,295
Other gains and losses 35,805)( 44 6,504)( 6,520)( 48,785)(
Finance costs 87,721)( 15,921)( 21)( 9,310 94,353)(
Share of (loss)/profit of
associates and joint ventures
accounted for under equity
method
150,197 - - 112,947)( 37,250
Segment income before tax 170,128 123,355 52,640 226,407
Income tax expense 20,123)( 11,117)( 1,320)( 32,560)(
Net income for the period 150,005$ 112,238$ 51,320$ 193,847$
Segment assets 48,475,659$ 7,403,670$ 2,614,048$ 4,951,841)( 53,541,536$
For the year three-month period March 31, 2015
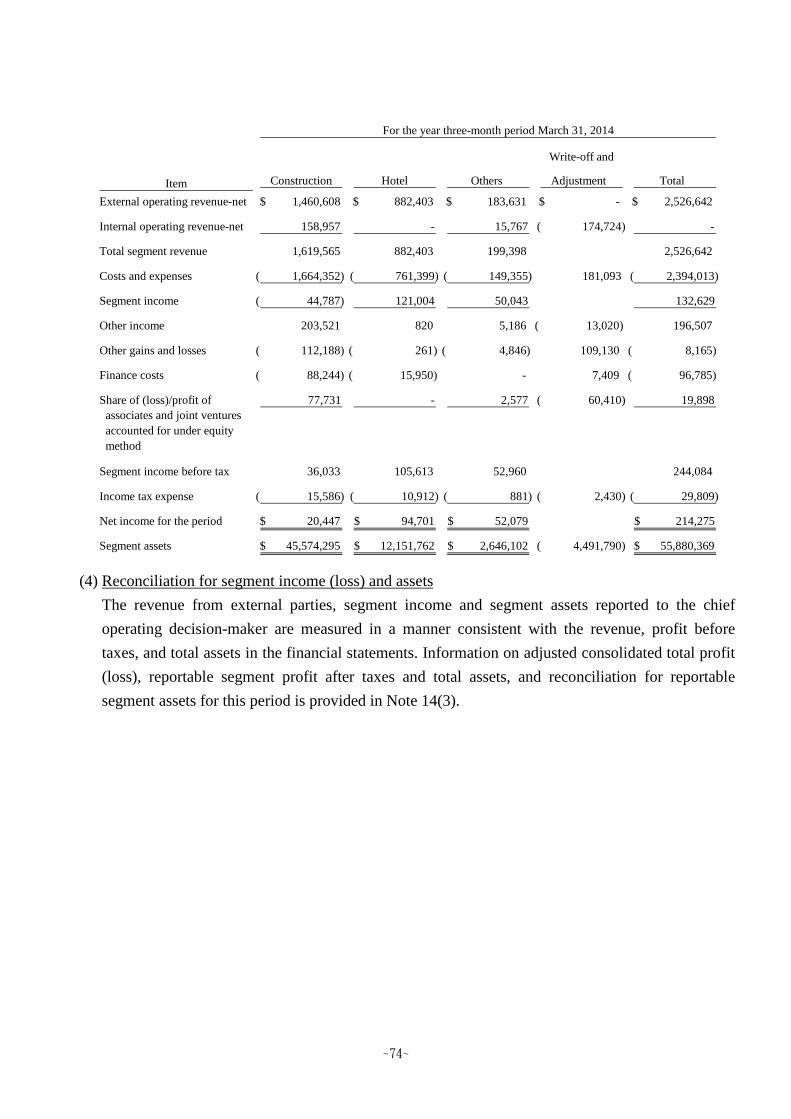
~74~
(4) Reconciliation for segment income (loss) and assets
The revenue from external parties, segment income and segment assets reported to the chief
operating decision-maker are measured in a manner consistent with the revenue, profit before
taxes, and total assets in the financial statements. Information on adjusted consolidated total profit
(loss), reportable segment profit after taxes and total assets, and reconciliation for reportable
segment assets for this period is provided in Note 14(3).
Write-off and
Item Construction Hotel Others Adjustment Total
External operating revenue-net 1,460,608$ 882,403$ 183,631$ -$ 2,526,642$
Internal operating revenue-net 158,957 - 15,767 174,724)( -
Total segment revenue 1,619,565 882,403 199,398 2,526,642
Costs and expenses 1,664,352)( 761,399)( 149,355)( 181,093 2,394,013)(
Segment income 44,787)( 121,004 50,043 132,629
Other income 203,521 820 5,186 13,020)( 196,507
Other gains and losses 112,188)( 261)( 4,846)( 109,130 8,165)(
Finance costs 88,244)( 15,950)( - 7,409 96,785)(
Share of (loss)/profit of
associates and joint ventures
accounted for under equity
method
77,731 - 2,577 60,410)( 19,898
Segment income before tax 36,033 105,613 52,960 244,084
Income tax expense 15,586)( 10,912)( 881)( 2,430)( 29,809)(
Net income for the period 20,447$ 94,701$ 52,079$ 214,275$
Segment assets 45,574,295$ 12,151,762$ 2,646,102$ 4,491,790)( 55,880,369$
For the year three-month period March 31, 2014


![Mount Vernon’s Hometown Newspaper • A Connection …connection.media.clients.ellingtoncms.com › news › ... · Drum Corp, Francisco said, “He [Prince Charles] was very grateful](https://img.pdfslide.net/doc/110x75/5f03faf47e708231d40bb8f8/mount-vernonas-hometown-newspaper-a-a-connection-a-news-a-drum-corp.jpg)