Embed Size (px)
Citation preview

Principals of Kinetic Measures of Liver Function
Focus on the Dual Cholate Clearance Test (HepQuant SHUNT)*
Gregory T. Everson, MDProfessor of MedicineDirector of Hepatology
University of Colorado Denver School of Medicine
HepQuant is a registered trademark of HepQuant LLC. The HepQuant SHUNT test is NOT FDA-APPROVED and is for investigational use only.Dr Everson is Equity Member and Co-Manager of HepQuant LLC.
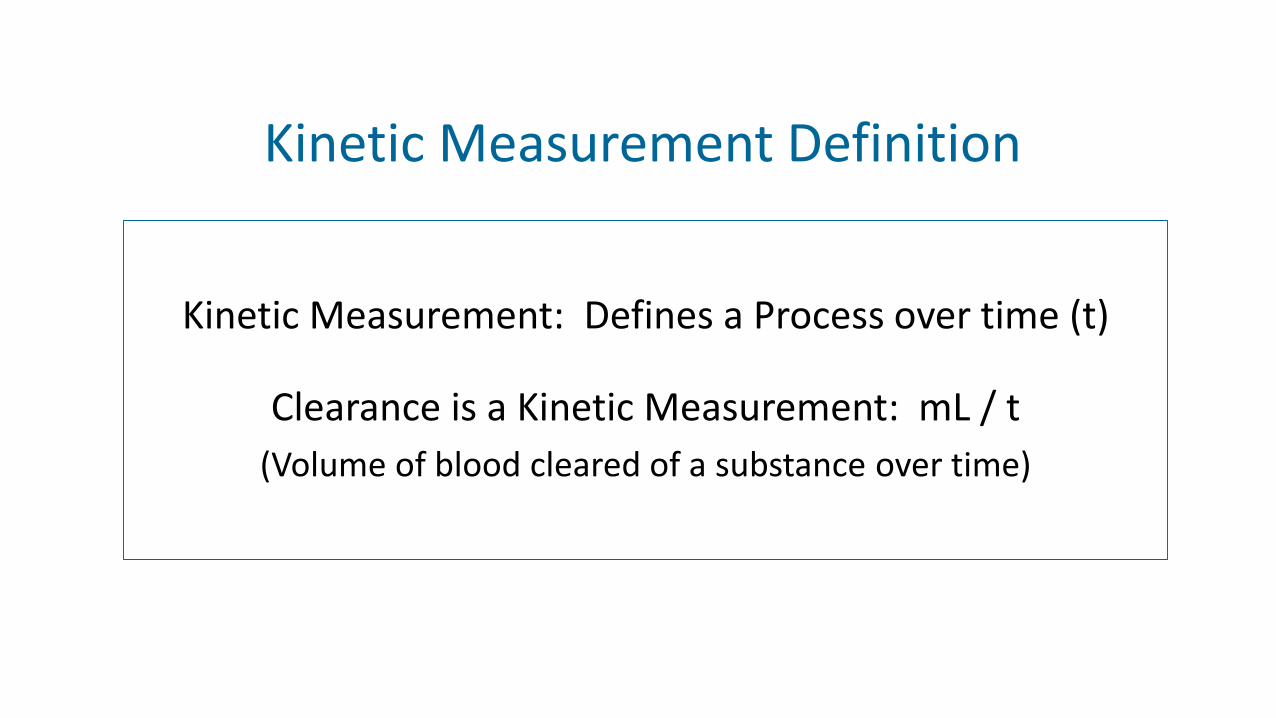
Kinetic Measurement Definition
Kinetic Measurement: Defines a Process over time (t)
Clearance is a Kinetic Measurement: mL / t
(Volume of blood cleared of a substance over time)

Lobule Acinus
The Hepatic Acinus is the Functional Unit of The Liver
Inflow
Spillover toSystemic
Circulation(1 – Extraction)
Cholate: First-pass Extraction ≈ 0.80

Iwakiri Y, Shah V, Rockey DC.J Hepatology 2014;61:912–924

Liver Disease Targets the Acinus and Alters the Portal Circulation
ImpairedInflow
PortalHypertension
Portal-Systemic CollateralsVarices
↓Uptake + Collaterals Decreases Extraction
IncreasesSpillover (SHUNT)
Lobule Acinus
¤¤ ¤ ¤ ¤ ¤ ¤ ¤¤ ¤¤ ¤ ¤ ¤ ¤ ¤ ¤ ¤≠≠ ≠≠ ≠ ≠ ≠≠≠ ≠≠ ≠ ≠ ≠ ≠ ≠ ≠ ≠ ≠ ≠ ≠ ≠ ≠
≠≠ ≠≠ ≠ ≠ ≠≠≠ ≠≠ ≠ ≠ ≠ ≠ ≠ ≠ ≠ ≠ ≠ ≠ ≠ ≠
Simultaneous Measurement ofSystemic and Portal Clearance of Cholate to
Quantify Disease State

The HepQuant SHUNT Test
Assesses Simultaneously:
Perfusion/uptake from portal circulationPerfusion/uptake from systemic circulation

HepQuant SHUNT Test Administration
• Peripheral venous indwelling catheter• Oral (D4-cholate, 40 mg) and IV (13C-cholate, 20 mg)• Timed blood draws at t = 5, 20, 45, 60 and 90 minutes• Quantifies HFRs, SHUNT, and DSI

There are two primary measurements in the HepQuant SHUNT Test
➢Portal Hepatic Filtration Rate (Portal HFR)➢Clearance 4D-Cholate (Dose AUC-1 kg body weight-1)
➢Systemic Hepatic Filtration Rate (Systemic HFR)➢Clearance 13C-Cholate (Dose AUC-1 kg body weight-1)
LiverDisease
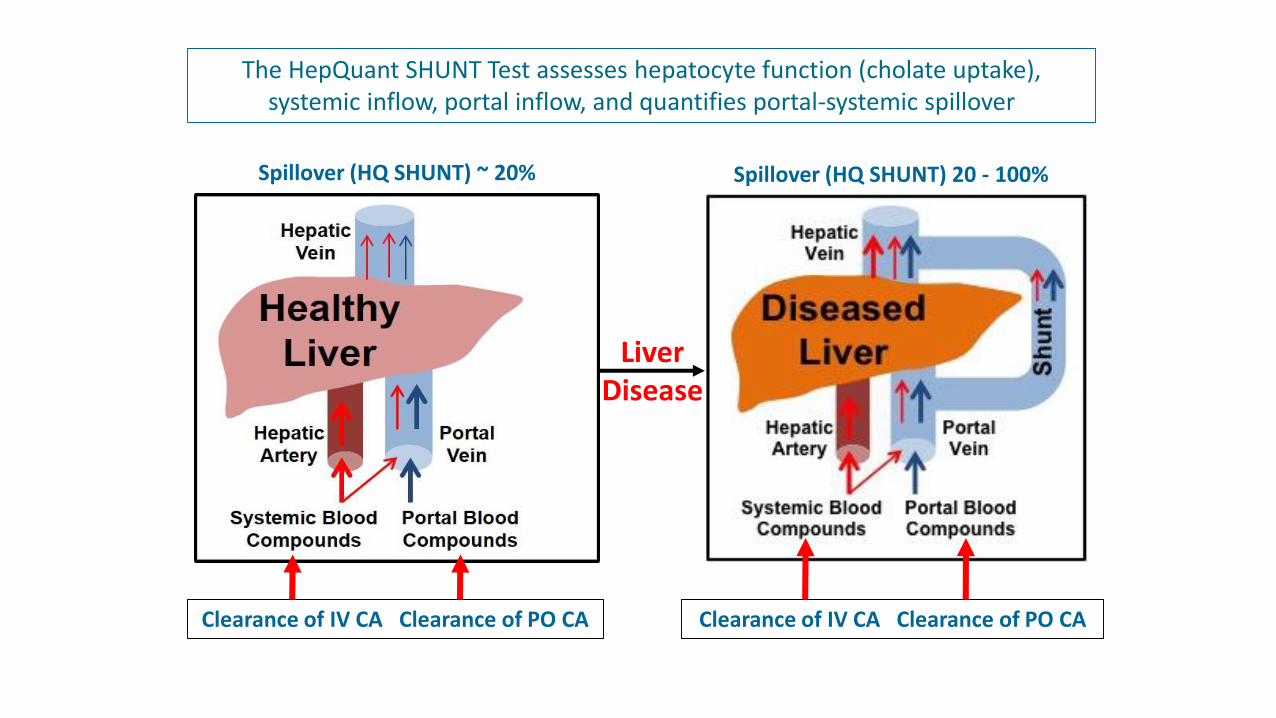
The HepQuant SHUNT Test assesses hepatocyte function (cholate uptake), systemic inflow, portal inflow, and quantifies portal-systemic spillover
Spillover (HQ SHUNT) ~ 20% Spillover (HQ SHUNT) 20 - 100%
Clearance of IV CA Clearance of PO CA Clearance of IV CA Clearance of PO CA
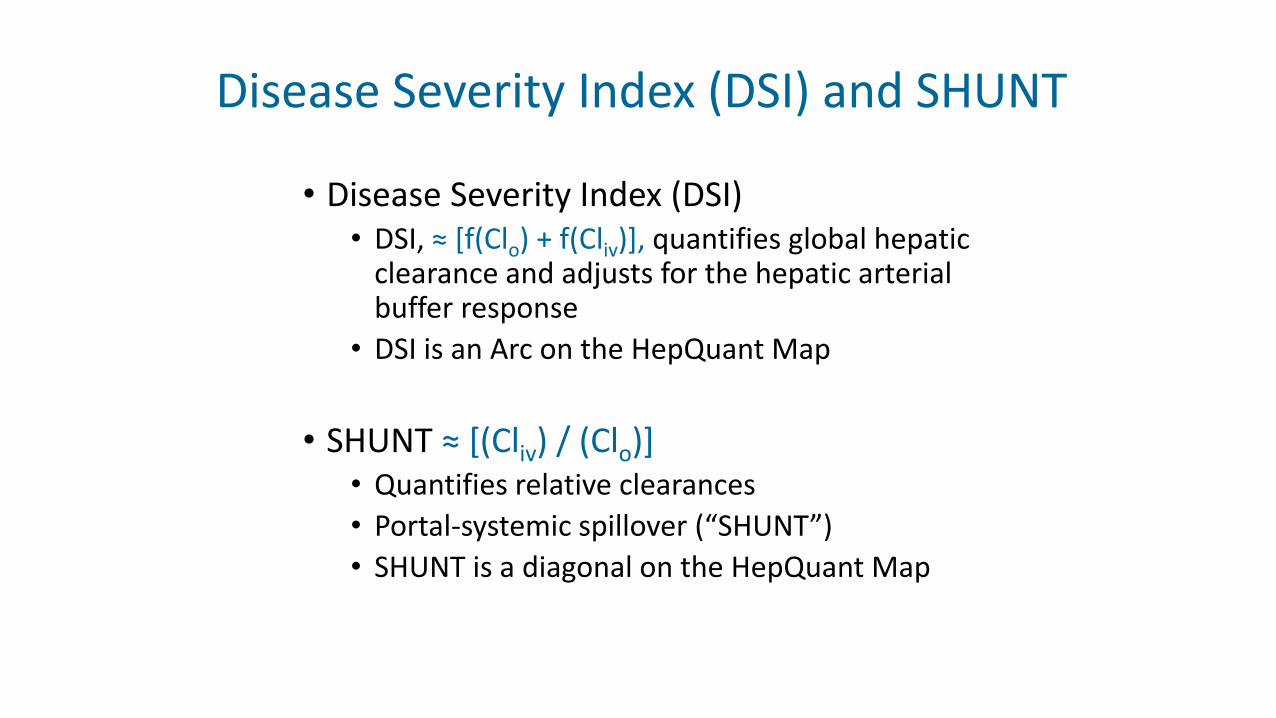
Disease Severity Index (DSI) and SHUNT
• Disease Severity Index (DSI)• DSI, ≈ [f(Clo) + f(Cliv)], quantifies global hepatic
clearance and adjusts for the hepatic arterial buffer response
• DSI is an Arc on the HepQuant Map
• SHUNT ≈ [(Cliv) / (Clo)]• Quantifies relative clearances
• Portal-systemic spillover (“SHUNT”)
• SHUNT is a diagonal on the HepQuant Map

5040302010521
10
5
2
1
Syst
emic
HFR
(m
L m
in-1
kg-1
)
Portal HFR (mL min-1 kg-1)
DSI 15
DSI 20
DSI 30
DSI 40
SHUNT 120% 100% 80% 60% 40% 20%
HepQuant SHUNT Map
10%
DSI 0
DSI 50
Data Coordinates (X, Y): Portal HFR (horizontal (or X) axis); Systemic HFR (vertical (or Y) axis. Ln/Ln plot.SHUNT: Diagonal dotted lines on the Map
DSI: red dashed arcsTrajectory of disease progression from DSI 0 (upper right) to DSI 50 (lower left): heavy red-dashed arrow

Beyond Principles: Applications

Reproducibility Studies
Study 1: Controls, HCV, NASHHQ SHUNT three times within one month
Study 2: PSCHQ SHUNT twice within one month
14

DSI Reproducibility
-40
-30
-20
-10
0
10
20
30
40
0 5 10 15 20 25 30 35 40
DSI
i–
Mea
n D
SI
Mean DSI
Triplicates, r ICC 0.932Duplicates, r ICC 0.948
Markers: Orange/Blue = Visits 1 and 2; Grey = Visit 3

0
1
2
3
4
5
0 30 60 90 120 150 180
Seru
m C
on
cen
trat
ion
(u
M)
Time (minutes)
IV and Oral Clearance Curves
IV Clearance Curve Oral Clearance Curve
0
1
2
3
4
5
0 30 60 90
Seru
m C
on
cen
trat
ion
(u
M)
Time (minutes)
IV and Oral Data
IV Data Oral Data
K Elim: 0.088 (min-1) 0.095 ± 0.013 (min-1)
V Distribution: 0.112 (L/kg) 0.095 ± 0.036 (L/kg)
Systemic HFR: 6.93 mL/min/kg 6.6 ± 1.6 mL/min/kg
Portal HFR: 40.67 mL/min/kg 33.7 ± 7.2 mL/min/kg
SHUNT: 17.05% (%) 21 ± 6% (%)
STAT: 0.20 µM 0.32 ± 0.10 µM
DSI v3.3: 4.33 6.6 ± 2.8
Patient Testing ResultsHealthy Controls
(Avg ± SD)
0
1
2
3
4
5
0 30 60 90 120 150 180
Seru
m C
on
cen
trat
ion
(u
M)
Time (minutes)
IV and Oral Clearance Curves
IV Clearance Curve Oral Clearance Curve
0
1
2
3
4
5
0 30 60 90
Seru
m C
on
cen
trat
ion
(u
M)
Time (minutes)
IV and Oral Data
IV Data Oral Data
K Elim: 0.063 (min-1)
V Distribution: 0.076 (L/kg)
Systemic HFR: 3.34 mL/min/kg
Portal HFR: 4.96 mL/min/kg
SHUNT: 67.33% (%)
STAT: 2.50 µM
DSI v3.3: 27.28
Patient Testing Results
0
1
2
3
4
5
0 30 60 90 120 150 180
Seru
m C
on
cen
trat
ion
(u
M)
Time (minutes)
IV and Oral Clearance Curves
IV Clearance Curve Oral Clearance Curve
0
1
2
3
4
5
0 30 60 90
Seru
m C
on
cen
trat
ion
(u
M)
Time (minutes)
IV and Oral Data
IV Data Oral Data
Examples of HepQuant SHUNT Test Results
K Elim: 0.035 (min-1)
V Distribution: 0.108 (L/kg)
Systemic HFR: 2.04 mL/min/kg
Portal HFR: 2.48 mL/min/kg
SHUNT: 82.13% (%)
STAT: 4.53 µM
DSI v3.3: 36.88
Patient Testing Results
Healthy Control
Advanced Fibrosis
Decompensation

Single DSI (Mainly HCV but Similar in NAFLD/NASH)1. > 13 Hepatic Impairment2. > 20 Risk for cirrhosis, portal hypertension, and clinical outcome3. > 20 Non-response to Interferon-based Rx4. > 30 SVR after DAA Rx: “Point of No Return”5. > 30 CTP B and C6. > 40 Decompensation, Death, Transplantation
Change in DSI (∆DSI)1. HCV disease progression over 8 years2. PSC disease progression over one year3. Hepatic improvement after SVR4. Hepatic impairment after Loco-Regional therapy of HCC5. Linkage of ∆DSI to Fibrosis Progression, Progression to Cirrhosis, and Risk
for future Clinical Outcomes in HCV (137 pairs over 2 years)

With Number of Subjects at Risk and 95% Confidence Limits
Product-Limit Survival Estimates
74 73 69 66 63 58 44 27
74 73 70 68 60 55 50 23
72 69 56 44 36 30 21 10
<15.395
15.395-19.898
>19.898
0 1 2 3 4 5 6 7
Years
0.0
0.2
0.4
0.6
0.8
1.0
Surv
ival P
robabili
ty
>19.89815.395-19.898<15.395DSI tertiles
Logrank p <.0001
+ Censored
0 1 2 3 4 5 6 7
Years
0.0
0.2
0.4
0.6
0.8
1.0
Surv
ival P
robabili
ty
>19.89815.395-19.898<15.395DSI tertiles
Logrank p <.0001
+ Censored
DSI Predicts Risk for Clinical Outcome

Variable
Hazard
Ratio
Lower
95%
CI
Upper
95%
CI p-value
Fibrosis ISHAK 5,6 vs 2,3,4 2.21 1.08 4.52 0.030
Platelets per unit 0.99 0.98 1.00 0.002
Age per year 0.98 0.94 1.01 0.192
Gender Male vs Female 0.87 0.46 1.64 0.669
Race Black vs Non-Hispanic, White 0.76 0.29 1.99 0.578
Race Hispanic/other vs Non-Hispanic, White 1.37 0.68 2.77 0.373
DSI is an Independent Predictor of Clinical OutcomeIshak Fibrosis Stage
Variable
Hazard
Ratio
Lower
95%
CI
Upper
95%
CI p-value
DSI tertile 15.395-19.898 2.40 0.64 9.04 0.196
DSI tertile >19.898 14.01 3.84 51.08 <0.001
Fibrosis ISHAK 5,6 vs 2,3,4 1.15 0.52 2.54 0.730
Platelets per unit 0.99 0.99 1.00 0.117
Age per year 0.98 0.94 1.02 0.300
Gender Male vs Female 1.23 0.64 2.38 0.538
Race Black vs Non-Hispanic, White 0.48 0.18 1.26 0.136
Race Hispanic/other vs Non-Hispanic, White 0.97 0.47 2.00 0.940
DSI

Natural Progression
(Analogous to Placebo Arm in a Clinical Trial)

Measuring Disease Severity and Progression(137 Patients with DSI and ISHAK Fibrosis Scores at Baseline and 2 Yr – Excluding ISHAK F6)
0
5
10
15
20
25
30
NonProgressors Fibrosis Progressors Progress to Cirrhosis Experience ClinicalOutcome
Baseline DSI ∆DSI (Yr 2 - Base)
95 42 33 19

Treatment Effect
(Analogous to Treatment Arm in Clinical Trial)

ΔDSI after SVRGroup N, Patients TimeFrame Mean ΔDSI SD of ΔDSI
LTx F0 – F3 10 4 Weeks -3.7* 3.9
ISHAK F2 – F6Comp Cirrh
24 2 Years -2.1* 2.9
LTx Cirrhosis 11 4 Weeks -2.2* 2.6
MELD ≤10 4 36 Weeks -4.4* 3.4
CTP B 8 60 Weeks -4.5* 2.6
Decomp Cirrh 10 4 Weeks 0.2 2.8
HCV Cases 67 Variable ResponseLess with Most Severe Disease
SD of ΔDSI is similar across
studies

Use of ΔDSI to define Sample Size inClinical Trials
24

Comparators
Mean ΔDSI
Placebo
group
Mean ΔDSI
Treatment
group
SD of ΔDSI
N per Arm
80% Power
N per Arm
90% Power
Pl vs Drug 0 1 4 128 171
Pl vs Drug 0 2 4 34 44
Pl vs Drug 0 3 4 16 21
Pl vs Drug 0 4 4 10 13
Sample Sizes based on SD 4 for ΔDSI
In this example, it is assumed that there would be little if any progression in the placebo arm over the time interval.

DSI can Define risk for NASH and Risk of NASH Outcomes
26
27
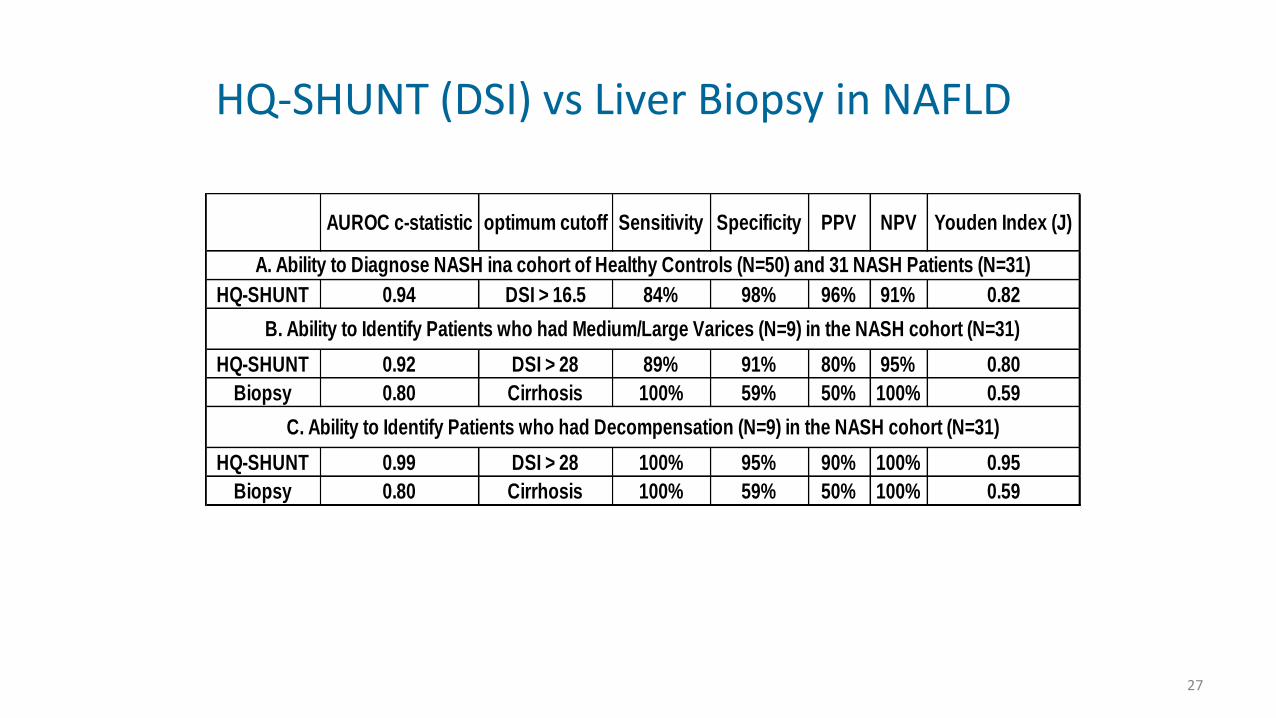
AUROC c-statistic optimum cutoff Sensitivity Specificity PPV NPV Youden Index (J)
HQ-SHUNT 0.94 DSI > 16.5 84% 98% 96% 91% 0.82
HQ-SHUNT 0.92 DSI > 28 89% 91% 80% 95% 0.80
Biopsy 0.80 Cirrhosis 100% 59% 50% 100% 0.59
HQ-SHUNT 0.99 DSI > 28 100% 95% 90% 100% 0.95
Biopsy 0.80 Cirrhosis 100% 59% 50% 100% 0.59
B. Ability to Identify Patients who had Medium/Large Varices (N=9) in the NASH cohort (N=31)
C. Ability to Identify Patients who had Decompensation (N=9) in the NASH cohort (N=31)
A. Ability to Diagnose NASH ina cohort of Healthy Controls (N=50) and 31 NASH Patients (N=31)
HQ-SHUNT (DSI) vs Liver Biopsy in NAFLD

Diagnosing NASH and Patient Riskof Varices and Decompensation
28
5040302010521
10
5
2
1
Sys
tem
ic H
FR
(m
L/m
in/k
g)
Portal HFR (mL/min/kg)
SHUNT: 120% 100% 80% 60% 40% 20%
10%
Healthy ControlsNormal Wt (N = 30)
Over Wt (N = 16)
Obese (N = 4)
NASH Patientsw/o Var (N = 17)
w Sm Var (N = 5)
w M/L Var (N = 9)
Healthy Function
Risk of NASH
Risk of Var
Risk of Med/Lg Var
Risk of Decomp

Tolerability
29
30
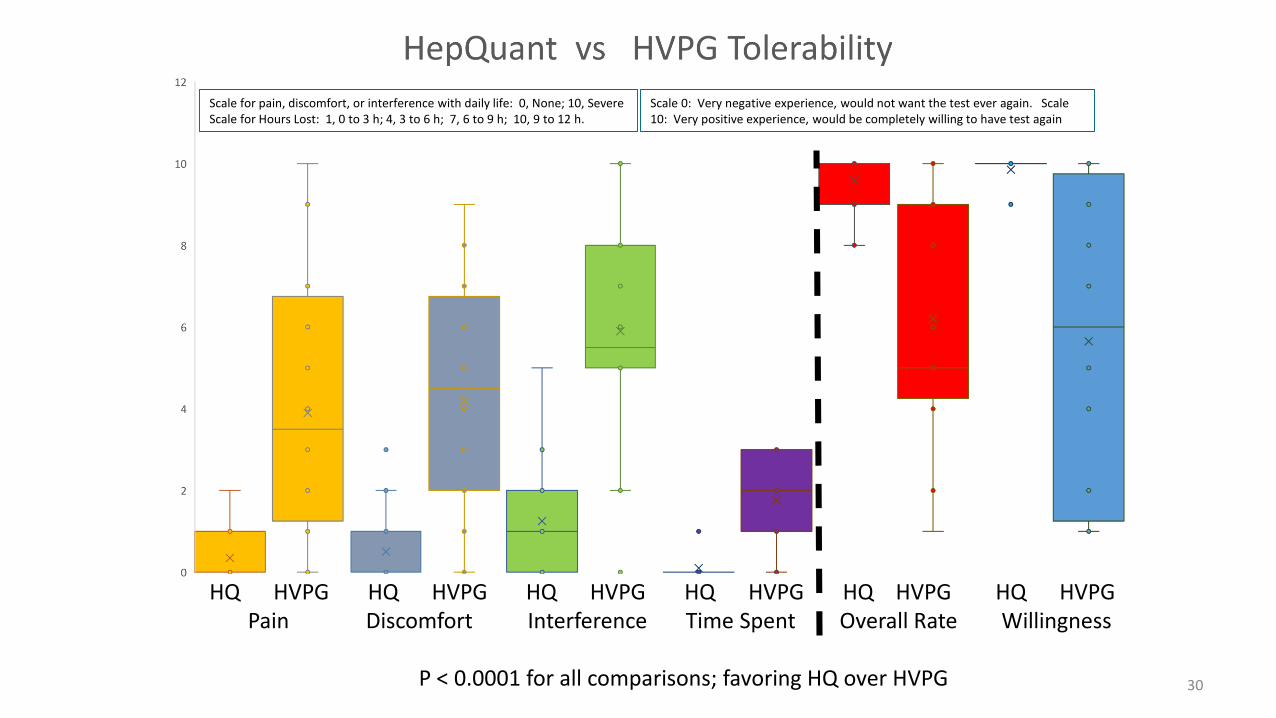
HQ HVPG HQ HVPG HQ HVPG HQ HVPG HQ HVPG HQ HVPGPain Discomfort Interference Time Spent Overall Rate Willingness
P < 0.0001 for all comparisons; favoring HQ over HVPG
Scale for pain, discomfort, or interference with daily life: 0, None; 10, SevereScale for Hours Lost: 1, 0 to 3 h; 4, 3 to 6 h; 7, 6 to 9 h; 10, 9 to 12 h.
Scale 0: Very negative experience, would not want the test ever again. Scale 10: Very positive experience, would be completely willing to have test again
Summary• The Dual Cholate test (HepQuant SHUNT) characteristics
• Plausibly linked to pathophysiology of liver disease
• Realtime functional and physiologicial events
• Targets Systemic and Portal InFlows Simultaneously – DSI
• Sensitive to early changes in sinusoidal perfusion
• Accomodates hepatic buffer responses – ie, DSI does not change
• Quantifies Spillover from the Portal Circulation (SHUNT)
• Over a broad range of advanced disease
• Reproducible
• Patient: Non-invasive, , easy to administer, high acceptance rate
• Linkage to Clinical Endpoints and Outcomes